Integrating Bokeh Visualizations in Django Application
Last Updated :
15 Aug, 2021
Bokeh is an interactive visualization library that helps us to create a visual representation of data set and interact with it. You can create various types of visualizations such as bar charts, horizontal plots,time-series, etc. There are various methods to include Bokeh apps and widgets into web apps and pages.
In this tutorial, we are going to create a basic bokeh graph and embed it into our Django web app. For that, we will be importing components from bokeh.embed which returns the individual components. The function bokeh.embed.components() returns a script that contains that data for your plot with a <div> tag in which the plot view is loaded. We will look in detail at the step-by-step procedure.
Step 1: Setting up a basic Django project
For this project, we are using PyCharm IDE. PyCharm is one of the most popular IDE used for the python Scripting language.
- Open PyCharm and create a new project and save it as BokehProject.
- Go to the terminal and install Django using the command:
pip install django
- In the same way, we will install bokeh in our project as:
pip install bokeh
Step 2: Create the Django project
- Create a Django project using the following command:
django-admin startproject BokehDjango
- Change the project folder using the below command:
cd BokehDjango
- Run manage.py to initially migrate data changes to our project by using migrate as below
python manage.py migrate
- Create a superuser using the following command to create a superuser account
python manage.py createsuperuser
- Add the name, email, and password.
- At this stage, the directory structure is as shown below:

- Now let us run the command below command to check if Django is installed successfully.
python manage.py runserver

- Now we create a Django application using the following command
python manage.py startapp BokehApp
- The directory structure at this stage will be as shown below:

- Since we have created an app we need to add it to settings. Open settings.py and add the following in installed apps:
INSTALLED_APPS = [
   'django.contrib.admin',
   'django.contrib.auth',
   'django.contrib.contenttypes',
   'django.contrib.sessions',
   'django.contrib.messages',
   'django.contrib.staticfiles',
   'BokehApp',
]
- Update urls.py file and add URL patterns. Open urls.py from our project folder i.e.,BokehDjango, and add the include function in the import statement. Also, add the path to include the URLs of our new application as shown below:
Python
from django.contrib import admin
from django.urls import path, include


urlpatterns = [
    path("admin/", admin.site.urls),
    path("", include("BokehApp.urls")),
]
- Now create a new file in our app folder i.e., BokehApp, and save it as urls.py.
- Open the file and add the path to route for your home page as below and also don’t forget to import path and views.
Python
from django.urls import path
from . import views

urlpatterns = [path("", views.home, name="home")]
- Next, we create the view for our home page that will render our first Bokeh Graph. Open views.py and create a new method called home() and before that we import HttpResponse..HttpResponse is most frequently used as a return object from a Django view.
- As of now, we are simply displaying a welcome message as below:
Python
from django.shortcuts import render
from django.http import HttpResponse

# Create your views here.
def home(request):
    return HttpResponse("Welcome to home page")
- Let us run the server using python manage.py runserver and look at the result:

Great! So this was all about setting our Django website.
Step 3:Complete Bokeh Setup into our project:
- Go to your python shell and check the version of Bokeh as:
bokeh.__version__
- As shown in the image below:

- Now let's create a template folder in our BokehApp directory and save it as templates. Create a new file in the templates directory and save it as base.html.
- Add the following links of CSS in your base.html file in the head tag and replace the version of your bokeh at the place bokeh-x.y.z.min (underlined place x.y.z.)
HTML
<link href=”http://cdn.pydata.org/bokeh/release/bokeh-2.3.2.min.css
   " rel=”stylesheet” type=”text/css”>
<link href=”http://cdn.pydata.org/bokeh/release/bokeh-widgets-2.3.2.min.css"
   rel=”stylesheet” type=”text/css”>
- And the JavaScript links below the ending body tag i.e., after </body> and similarly replace your bokeh version at x.y.z
HTML
<script src="https://cdn.bokeh.org/bokeh/release/bokeh-2.3.2.min.js"></script>
<script src="https://cdn.bokeh.org/bokeh/release/bokeh-widgets-2.3.2.min.js"></script>
<script src="https://cdn.bokeh.org/bokeh/release/bokeh-tables-2.3.2.min.js"></script>
<script src="https://cdn.bokeh.org/bokeh/release/bokeh-api-2.3.2.min.js"></script>
- The base.html file looks like
HTML
<html>
   <head>
      <link href=”http://cdn.pydata.org/bokeh/release/bokeh-2.3.2.min.css
         " rel=”stylesheet” type=”text/css”>
      <link href=”http://cdn.pydata.org/bokeh/release/bokeh-widgets-2.3.2.min.css"
         rel=”stylesheet” type=”text/css”>
   </head>
   <body>
      <h1>Our first Bokeh Graph</h1>
      {{div| safe}}
   </body>
   <script src="https://cdn.bokeh.org/bokeh/release/bokeh-2.3.2.min.js"></script>
   <script src="https://cdn.bokeh.org/bokeh/release/bokeh-widgets-2.3.2.min.js"></script>
   <script src="https://cdn.bokeh.org/bokeh/release/bokeh-tables-2.3.2.min.js"></script>
   <script src="https://cdn.bokeh.org/bokeh/release/bokeh-api-2.3.2.min.js"></script>
   {{script| safe}}
</html>
- Let us now replace the view function home so that it renders our first graph. Add the below code which creates basic circle scatter marks on our plot:
Python
from django.shortcuts import render
from django.http import HttpResponse
from bokeh.plotting import figure
from bokeh.embed import components
# Create your views here.
def home(request):
#create a plot
plot = figure(plot_width=400, plot_height=400)
# add a circle renderer with a size, color, and alpha
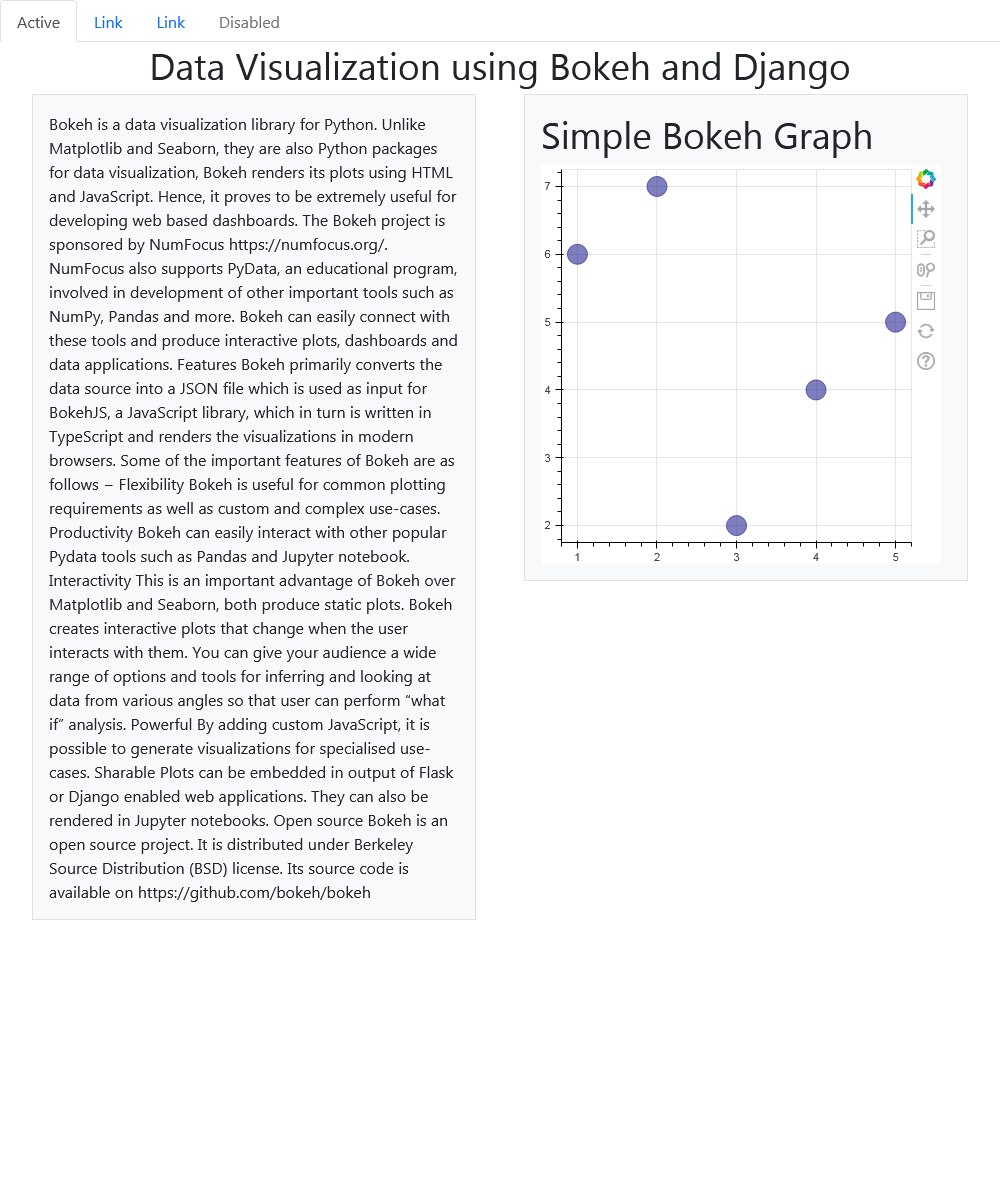
plot.circle([1, 2, 3, 4, 5], [6, 7, 2, 4, 5], size=20, color="navy", alpha=0.5)
script, div = components(plot)
return render(request, 'base.html', {'script': script, 'div': div})
- The components method returns a script that contains the data for your plot and provides a <div>tag to display the plot view. These two elements can be inserted into the HTML text and the <script> when executed will replace the div with the plot.
- The circle method is a glyph method which is a method of the figure object. Glyphs are the basic visual building blocks of Bokeh plots. This includes elements such as lines, rectangles, squares, wedges, or the circles of a scatter plot
- The plot variable enables us to create a plot that holds all the various objects such as glyphs, annotations, etc. of a visualization.
So let us refresh our page after saving all the files and the output will be as shown below.

To enhancing the look of the page we are adding bootstrap to our base.html file. We have added a few of the components and the final HTML will be as shown below:
HTML
<html>
   <head>
      <link href="https://cdn.jsdelivr.net/npm/[email protected]/dist/css/bootstrap.min.css"
         rel="stylesheet"
         integrity="sha384-+0n0xVW2eSR5OomGNYDnhzAbDsOXxcvSN1TPprVMTNDbiYZCxYbOOl7+AMvyTG2x"
         crossorigin="anonymous">
      <link href=”http://cdn.pydata.org/bokeh/release/bokeh-2.3.2.min.css
         " rel=”stylesheet” type=”text/css”>
      <link href=”http://cdn.pydata.org/bokeh/release/bokeh-widgets-2.3.2.min.css"
         rel=”stylesheet” type=”text/css”>
   </head>
   <body>
      <ul class="nav nav-tabs">
         <li class="nav-item">
            <a class="nav-link active" aria-current="page" href="#">Active</a>
         </li>
         <li class="nav-item">
            <a class="nav-link" href="#">Link</a>
         </li>
         <li class="nav-item">
            <a class="nav-link" href="#">Link</a>
         </li>
         <li class="nav-item">
            <a class="nav-link disabled" href="#" tabindex="-1"
               aria-disabled="true">Disabled</a>
         </li>
      </ul>
      <h1 align="center">Data Visualization using Bokeh and Django</h1>
      <div class="container overflow-hidden">
         <div class="row gx-5">
            <div class="col">
               <div class="p-3 border bg-light">Bokeh is a data
                  visualization library for Python. Unlike Matplotlib and
                  Seaborn, they are also Python packages for data visualization,
                  Bokeh renders its plots using HTML and
                  JavaScript. Hence, it proves to be extremely useful
                  for developing web based dashboards.
                  The Bokeh project is sponsored by NumFocus
                  https://numfocus.org/. NumFocus also supports PyData, an
                  educational program, involved in development of
                  important tools such as NumPy, Pandas and more.
                  Bokeh can easily connect with these tools and
                  produce interactive plots, dashboards and data applications.
                  Features
                  Bokeh primarily converts the data source into a JSON file
                  which is used as input for BokehJS, a JavaScript library,
                  which in turn is written in TypeScript and renders the
                  visualizations in modern browsers.
                  Some of the important features of Bokeh are as follows −
                  Flexibility
                  Bokeh is useful for common plotting requirements as
                  well as custom and complex use-cases.
                  Productivity
                  Bokeh can easily interact with other popular Pydata
                  tools such as Pandas and Jupyter notebook.
                  Interactivity
                  This is an important advantage of Bokeh over Matplotlib and
                  Seaborn, both produce static plots. Bokeh
                  creates interactive plots that change when the user
                  interacts with them. You can give your audience a
                  wide range of options and tools for inferring and
                  looking at data from various angles so that user can
                  perform “what if” analysis.
                  Powerful
                  By adding custom JavaScript, it is possible to generate
                  visualizations for specialised use-cases.
                  Sharable
                  Plots can be embedded in output of Flask or Django
                  enabled web applications. They can also be rendered in
                  Jupyter notebooks.
                  Open source
                  Bokeh is an open source project. It is distributed under
                  Berkeley Source Distribution (BSD) license. Its
                  source code is available on https://github.com/bokeh/bokeh
               </div>
            </div>
            <div class="col">
               <div class="p-3 border bg-light">
                  <h1>Simple Bokeh Graph</h1>
                  {{ div| safe}}
               </div>
            </div>
         </div>
      </div>
      <script src="https://cdn.jsdelivr.net/npm/[email protected]/dist/js/bootstrap.bundle.min.js"
         integrity="sha384-gtEjrD/SeCtmISkJkNUaaKMoLD0//ElJ19smozuHV6z3Iehds+3Ulb9Bn9Plx0x4"
         crossorigin="anonymous"></script>
   </body>
   <script src="https://cdn.bokeh.org/bokeh/release/bokeh-2.3.2.min.js"></script>
   <script src="https://cdn.bokeh.org/bokeh/release/bokeh-widgets-2.3.2.min.js"></script>
   <script src="https://cdn.bokeh.org/bokeh/release/bokeh-tables-2.3.2.min.js"></script>
   <script src="https://cdn.bokeh.org/bokeh/release/bokeh-api-2.3.2.min.js"></script>
   {{script| safe}}
</html>
Output:
Similar Reads
Interactive visualization of data using Bokeh
Bokeh is a Python library for creating interactive data visualizations in a web browser. It offers human-readable and fast presentation of data in an visually pleasing manner. If you’ve worked with visualization in Python before, it’s likely that you have used matplotlib. But Bokeh differs from matp
4 min read
Interactive Data Visualization with Python and Bokeh
In this article, we'll learn how to do Interactive Data Visualization with Bokeh. Bokeh is a Python library that is used for creating interactive visualizations for modern web browsers. It handles custom or specialized use cases very simply. Â It provides high-performance interactive charts and plots
8 min read
How To Integrate Ajax with Django Applications
Django is one of the most popular web frameworks for building robust and scalable web applications. However, many modern applications require asynchronous features, enabling real-time interactions without the need to reload the entire page. This is where Ajax (Asynchronous JavaScript and XML) comes
5 min read
Python - Data visualization using Bokeh
Bokeh is a data visualization library in Python that provides high-performance interactive charts and plots. Bokeh output can be obtained in various mediums like notebook, html and server. It is possible to embed bokeh plots in Django and flask apps. Bokeh provides two visualization interfaces to us
4 min read
Build a Clock Application using Django and React
The clock project aims to develop a simple yet functional clock application using modern web technologies. It combines the frontend capabilities of React.js for creating dynamic user interfaces with the styling power of Tailwind CSS for a sleek and responsive design. Additionally, the backend is bui
4 min read
Python Bokeh tutorial - Interactive Data Visualization with Bokeh
Python Bokeh is a Data Visualization library that provides interactive charts and plots. Bokeh renders its plots using HTML and JavaScript that uses modern web browsers for presenting elegant, concise construction of novel graphics with high-level interactivity. Features of Bokeh: Flexibility: Boke
15+ min read
Build a To-Do application Using Django, React and Tailwind
This article will guide you in creating a To-Do application using React and Tailwind with the Django Framework. We’ll explore the integration of Django, React, and Tailwind, and go through the step-by-step process of implementing the To-Do application. What is a To-Do application?A To-Do application
6 min read
Embed pygal charts in Django Application
Suppose we are developing a web application using the Django framework and we have some data and want to visualize it on the webpage We can embed it in Django templates and render it to the web browser using Python. Embed Pygal Charts in Django ApplicationEmbedding Pygal charts in a Django template
6 min read
How to use Jinja for Data Visualization
Jinja is a powerful templating engine for rendering text whether it be HTML, LaTeX, or just anything that is just pure text. This article provides an introduction to how to utilize Jinja for Data Visualization. First, it presents the idea and finally provides an example of rendering a simple bar gra
5 min read
How to Deploy Django application on Heroku ?
Django is an MVT web framework used to build web applications. It is robust, simple, and helps web developers to write clean, efficient, and powerful code. In this article, we will learn how to deploy a Django project on Heroku in simple steps. For this, a Django project should be ready, visit the f
4 min read