
![J.Bagyamani, K. Thangavel & R. Rathipriya
International Journal of Biometrics and Bioinformatics (IJBB), Volume (4): Issue (6) 202
inferences. Expressions of genes under different conditions serve as valuable clues to
understand the cell differentiation, pathological and genetic behavior. For most functionally
related genes, tight correlation occurs under specific experimental conditions. Clustering deals
with finding patterns in a collection of unlabeled data. Traditional clustering algorithms consider all
of the dimensions of an input dataset in an attempt to learn as much as possible about each
object described. According to Kerr et. al [12], clustering the microarray matrix can be achieved
in two ways: (i) genes can form a group which show similar expression across conditions, (ii)
samples can form a group which show similarity across all genes. This gives rise to global
clustering or traditional clustering where a gene or sample is grouped across all dimensions.
Biclustering [15, 21], a relatively new unsupervised learning technique, cluster the objects under
subset of attributes. It allows the assignment of individual objects to multiple clusters. Co-
expressed genes, i.e., genes with similar expression patterns, can be clustered together and
manifest similar cellular functions. Hence biclustering aims to find sub-matrices with coexpressed
expression values.
1.1 Query driven Biclustering
In this Query driven Biclustering technique, usually a query gene is given as input, and a single
bicluster which consists of a set of genes and a subset of conditions / samples that are similar to
the query gene is extracted. The resultant bicluster that include the query gene answer the
following questions which are not answered by most existing biclustering methods in which
biologists are interested in [7].
(i) “Which genes involved in a specific protein complex is co expressed?”
(ii) “Given a set of known disease genes, how to select new candidate genes that may be
linked to the same disease?”
Given a specific gene or set of genes (seed genes) known or expected to be related to some
common biological pathway or function:
(i) “Which genes are (functionally) related to the seed genes and which features (conditions)
are relevant for this biological function?”
1.2 Biological Significance
An Open Reading Frame (ORF) is a DNA sequence that contains a start codon and a stop
codon in the same reading frame. ORF is supposed to be a gene which encodes a protein, but in
some cases encoded protein for ORFs are not known. The yeast Saccharomyces cerevisiae [13]
is an excellent organism for this type of experiment because its genome has been sequenced
and all of the ORFs have been determined. Each study determines the expression level of every
ORF at a series of time points. The resulting dataset must be analyzed to determine the roles of
specific genes in the process of interest. Genes coding for elements of a protein complex are
likely to have similar expression patterns. Hence, grouping ORFs with similar expression levels
can reveal the function of previously uncharacterized genes.
1.3 Coherent Bicluster
Genes involved in common processes are often co-expressed. In this paper, constant bicluster
with reference to the query gene and coherent bicluster with reference to the query gene are
extracted. The biological significance of both the biclusters with reference to the same query gene
is identified. Comparison of the biological significance shows that coherent bicluster has more
biological significance than the constant bicluster. Hence the focus in identifying coherent (i.e.,
patterns that rise and fall concordantly) bicluster is that co-expression may reveal much about the
genes' regulatory systems. Coherent bicluster [1] has more biological significance than constant
bicluster.](https://image.slidesharecdn.com/ijbb-80-160207143706/85/Biological-Significance-of-Gene-Expression-Data-Using-Similarity-Based-Biclustering-Algorithm-2-320.jpg)
![J.Bagyamani, K. Thangavel & R. Rathipriya
International Journal of Biometrics and Bioinformatics (IJBB), Volume (4): Issue (6) 203
1 2 5 0
2 3 6 1
4 5 8 3
5 6 9 4
Additive Coherent Bicluster
TABLE 1: Additive Coherent Bicluster and Multiplicative coherent Bicluster
This paper is organized as follows: Section 2 details the preliminary of gene expression data
along with literature survey. Section 3 explains the proposed work and the evaluation measures.
Section 4 provides the experimental results of Yeast Saccharomyces Cervisiae expression data.
Biological validation of the genes within the bicluster is provided in terms of gene ontology in
Section 5. Section 6 concludes the article.
2. Background
2.1 Microarray Gene Expression Data
Genes are how living organisms inherit features from their ancestors. The information within a
particular gene is not always exactly the same between one organism and another, so different
copies of a gene do not always give exactly the same instructions. Gene expression levels can be
determined for samples taken (i) at multiple time instants of a biological process (different phases
of cell division) or (ii) under various conditions (e.g., tumor samples with different
histopathological diagnosis). A gene expression database can be regarded as consisting of three
parts – the gene expression data matrix, gene annotation and sample / condition annotation.
2.2 Problem statement
A gene expression matrix A = [ aij ] of size m x n where each element represents the expression
level of gene ‘i’ under condition ‘j’ is considered. Let I be the set of genes and J the set of
conditions of A. Biclustering identification is to find a submatrix AI’J’ = A ( I’, J’) with sets of rows
I’ I and sets of columns J’ J . . In general, the problem can be defined as one of finding large
sets of rows and columns such that the rows show unusual similarities along the dimensions
characterized by columns and vice-versa. The bicluster cardinality or volume of bicluster is simply
the product of the number of genes and number of conditions in the bicluster.
2.3 Nature of biclustering Algorithms
Biclustering, which has been applied intensively in molecular biology research recently, provides
a framework for finding hidden substructures in large high dimensional matrices Tanay et al. [19,
20] defined a bicluster as a subset of genes that jointly respond upon a subset of conditions.
Biclustering algorithms may have two different objectives: to identify one bicluster or to identify a
given number of biclusters. This proposed method identifies one bicluster at a time.
Many biclustering methods [3] such as iterative row column [6,8] divide and conquer [9],
exhaustive bicluster enumeration, distribution parameter identification exist in literature. Greedy
iterative search methods are based on the idea of creating biclusters by adding or removing
rows/columns from them, that optimizes the given criteria. They may make wrong decisions and
loose good biclusters, but they have the potential to be very fast.
Cheng and Church [5] used a greedy procedure starting from the entire data matrix and
successively removing columns or rows contributing most to the mean squared residue score.
They used both single node deletion and multiple node deletion methods in order to arrive one
bicluster at a time and mask the previously discovered biclusters. Iterative Signature Algorithm
(ISA) by Ihmels et al [11] has been found to be very effective in identifying (Transcription Module)
TMs in yeast expression data. However, the major problem with the algorithm is that it starts with
a totally random input gene seed and hence can result in non-meaningful TMs. Thus to gain
confidence in the quality of TMs they run their algorithm for a large number of seeds and report a
1 2 0.5 1.5
2 4 1 3
4 8 2 6
3 6 1.5 4.5
Multiplicative coherent Bicluster](https://image.slidesharecdn.com/ijbb-80-160207143706/85/Biological-Significance-of-Gene-Expression-Data-Using-Similarity-Based-Biclustering-Algorithm-3-320.jpg)
![J.Bagyamani, K. Thangavel & R. Rathipriya
International Journal of Biometrics and Bioinformatics (IJBB), Volume (4): Issue (6) 204
TM only if it is obtained. Dhollander et al. [7] introduced a model-based query-driven module
discovery tool QDB, but it is aimed at performing informed biclustering instead of pattern
matching, and it does not take into account the complex correlation patterns such as inverse
patterns. Owen et al. [16] proposed a score-based search algorithm called Gene Recommender
(GR) to find genes that are co expressed with a given set of genes using data from large
microarray datasets. GR first selects a subset of experiments in which the query genes are most
strongly co-regulated. Hence multiple query genes are required. Hu et al. [10] developed model-
based gene expression query algorithm BEST (Bayesian Expression Search Tool) built under the
Bayesian model selection framework. It is capable of detecting co-expression profiles under a
subset of samples/experimental conditions. In MSB [14] the maximum similarity bicluster for
query gene or reference gene i* is computed, by trying the algorithm for all the conditions j* and
then identifying bicluster with maximum similarity. The advantage of MSB is that it is unnecessary
to mask previously discovered biclusters. SIMBIC [2] algorithm is an improvement of MSB in
terms of computational efficiency but the biclusters obtained by both the methods are same.
Instead of single row / column deletion, multiple rows / columns are deleted. Also for a specific
reference gene i*, the algorithm need not be executed for all the reference condition j* but j* can
be restricted to n/2 conditions that has high contribution entropy. This proposed SIMBIC+
algorithm is an improved version of SIMBIC in the sense that it uses novel ‘ratio’ based similarity
measure, applied on conditions with high contribution entropy. Also multiple rows or multiple
columns are deleted in each iteration until the gene expression matrix reduces to a single
element. Then bicluster with maximum similarity is identified and evaluated using ACV (Average
Correlation Variation) measure. The biological significance and p - value of each obtained
bicluster are evaluated. The Gene Ontology (GO) of the biclusters obtained by the proposed
SIMBIC+ and MSB are compared and the comparison shows that SIMBIC+ outperforms SIMBIC
and MSB.
3. PROPOSED WORK
3.1 Condition selection
Preprocessing often involves some operation on feature-space in order to reduce the
dimensionality of the data. This is referred to as feature selection [17]. The features are sorted
based on the contribution entropy value. SVD-based entropy [18] of the dataset is defined as
follows. Let sj denote the singular values of the matrix A. sj
2
are then the eigen values of the n x n
matrix AA
T
. The values are normalized by using (1).
(1)
and the resulting dataset entropy is
E = (2)
where N is the total number of attributes. This entropy varies between 0 and 1. The minimal value
E = 0 corresponds to an ultra ordered dataset and E = 1 corresponds to unordered dataset. The
contribution of the ith
feature to the entropy CEi is defined by a leave-one-out comparison
according to
CEi = E(A[n x m]) – E(A[n x (m-1)]) (3)
where, in the last matrix, the i
th
feature is removed. Thus the features are sorted by their relative
contribution to the entropy. Simple ranking (SR) method sorts the features. Select ‘n/2’ features /
conditions according to the highest ranking order of their CEi values.
3.2 Ratio based Similarity between genes
Gene selection is critical in molecular class prediction. In a cellular process, only a relatively
small set of genes are active. So select genes i* which has specific functional importance in gene](https://image.slidesharecdn.com/ijbb-80-160207143706/85/Biological-Significance-of-Gene-Expression-Data-Using-Similarity-Based-Biclustering-Algorithm-4-320.jpg)
![J.Bagyamani, K. Thangavel & R. Rathipriya
International Journal of Biometrics and Bioinformatics (IJBB), Volume (4): Issue (6) 205
ontology viz. Cellular component, Biological process, Molecular function. Let i* be a reference
gene / query gene.
Let j* be the reference condition. j* may be chosen in such a way that it has high contribution
entropy. The contribution entropy of all the conditions are computed and j* is chosen from the
selected ‘n/2’ conditions of the expression data that has high contribution entropy. Because there
is a dependency between co-expression and functional relation, co-expressed genes provide
excellent candidates for further study. However, the dependency is complex, and it cannot be
used to identify the best choice of similarity measure. In [2, 14], the similarity measure is based
on the absolute value of the difference. This measure would help us to identify constant and
additive biclusters. In order to identify a coherent pattern (shifting and scaling pattern), similarity
measure is defined in terms of ratio.
For an element aij of expression matrix A (I, J) and a reference gene i* I,
dij = abs ( aij / ai*j ) and davg =
where | . | refers to number of elements. The similarity between two genes sij is defined as
(4)
If dij > davg, then the two elements aij and ai*j are not similar and the similarity sij is set to 0.
3.3 Ratio based Similarity score for a bicluster
Let S (I, J) be an m x n similarity matrix of A (I, J). The similarity score S (I, J) of the bicluster AIJ
is defined as below.
For row i I, the similarity score of row ‘i’ is S (i, J) = (5)
For row j J’, the similarity score of column ‘j’ is S (I, j) = (6)
The similarity score of bicluster S (I, J) = min min S (i, J), min S (I, j)} (7)
If this minimum is min(S(i, J)) find the index of all the rows corresponding to this minimum and
remove all those rows from A(I, J) to get A(I’, J) else find the index of the columns corresponding
to column minimum and remove all those columns from A(I, J) to get A(I, J’). Then A (I, J) is
updated as A (I, J’) or A (I’, J). Multiple row / column deletion is performed until the the row size
(mr) or column size (mc) is less than or equal to 1. Identify the bicluster which has high similarity
score as maximum similarity bicluster. Popular measures used for evaluating quality of a bicluster
are MSR (Mean Squared Residue)[5] and ACV (Average Correlation Variation)[4] measure. MSR
measures well all types of constant biclusters [1] and ACV is perfect measure for coherent
biclusters.
SIMBIC+ Algorithm
Constant bicluster:
Input
1. Gene expression matrix A(I, J)
2. Reference gene i* which has GO functional importance.
3. Reference condition j* from selected (n/2) features.
Output a maximum similarity bicluster.
Procedure
1. Compute similarity matrix S (I, J) using (4) for the reference gene i*.](https://image.slidesharecdn.com/ijbb-80-160207143706/85/Biological-Significance-of-Gene-Expression-Data-Using-Similarity-Based-Biclustering-Algorithm-5-320.jpg)
![J.Bagyamani, K. Thangavel & R. Rathipriya
International Journal of Biometrics and Bioinformatics (IJBB), Volume (4): Issue (6) 206
2. Parameters (mr, mc) = size (A (I, J)).
3. While (mr ≤ 1 or mc ≤ 1)
4. Compute row_sim, S(i, J)
5. Compute col_sim, S(I, j) =
6. find min(S(i, J) and find min S(I, j)
7. Find min { min(S(i, J’) & min S(I’, j)}
8. If this minimum is min(S(i, J’)) find the index of the rows corresponding to this minimum
and remove all those rows from A(I , J) to get A(I’, J)
9. else find the index of the columns corresponding to column minimum and remove all
those columns from A(I , J) to get A(I , J’).
10. Update A(I, J) = A(I’, J) or A(I, J) = A(I, J’) and S(I, J) = S(I’, J) or S(I, J) = S(I, J’)
11. Find the similarity of bicluster using (7) for the updated S (I, J).
12. Update mr, mc.
13. End while
14. Extract the bicluster with maximum similarity A (I’, J’).
15. Compute ACV and MSR of A (I’, J’).
3.4 Comparison of SIMBIC+ with MSB
MSB SIMBIC+
Every row is considered as a reference
gene i*.
Only genes with functional importance are
considered as reference gene i*
Every column is considered as a reference
column j*.
The (n/2) conditions that have more
contribution entropy are considered as j*.
Number of iterations is m+n-2. Number of iterations is very less.
Single node deletion method is used. Multiple node deletion method is used.
Distance measure is the absolute
difference between the reference gene and
other genes.
Distance measure is the ratio between the
reference gene and other genes.
Similarity measure depends on the
parameters α and β.
No such parameters used for bicluster
identification.
More complex. Complexity and number of iterations are
reduced.
Biclusters have biological significance. Biclusters have still more biological
significance.
TABLE 2: Comparison of MSB and SIMBIC+
This SIMBIC+ algorithm is implemented in Matlab, 2GHz processor with 3 GB RAM.
4. Experimental analysis
4.1 Dataset
In order to test the efficiency of the proposed algorithm the Yeast Saccharomyces Cerevisiae
data with 2884 genes and 17 conditions was considered wherein the missing values are replaced
by -1. [http://arep.med.harvard.edu/biclustering/]
4.2 Bicluster Evaluation Measures
Two types of biclusters namely constant and additive coherent are identified using this algorithm.
It is observed from Table 3 that additive biclusters have more biological significance than the
constant biclusters. The performance of the algorithm is validated using MSR and the ACV. For
each bicluster, MSR and ACV are computed using the formulae](https://image.slidesharecdn.com/ijbb-80-160207143706/85/Biological-Significance-of-Gene-Expression-Data-Using-Similarity-Based-Biclustering-Algorithm-6-320.jpg)


Biological Significance of Gene Expression Data Using Similarity Based Biclustering Algorithm
- 1. J.Bagyamani, K. Thangavel & R. Rathipriya International Journal of Biometrics and Bioinformatics (IJBB), Volume (4): Issue (6) 201 Biological Significance of Gene Expression Data using Similarity based Biclustering Algorithm J.Bagyamani [email protected] Government Arts College, Dharmapuri - 636705, TamilNadu, India K. Thangavel [email protected] Department of Computer Science, Periyar University, Salem - 636 011, TamilNadu, India R. Rathipriya [email protected] Department of Computer Science, Periyar University Salem - 636 011, TamilNadu, India Abstract Unlocking the complexity of a living organism’s biological processes, functions and genetic network is vital in learning how to improve the health of humankind. Genetic analysis, especially biclustering, is a significant step in this process. Though many biclustering methods exist, only few provide a query based approach for biologists to search the biclusters which contain a certain gene of interest. This proposed query based biclustering algorithm SIMBIC+ first identifies a functionally rich query gene. After identifying the query gene, sets of genes including query gene that show coherent expression patterns across subsets of experimental conditions is identified. It performs simultaneous clustering on both row and column dimension to extract biclusters using Top down approach. Since it uses novel ‘ratio’ based similarity measure, biclusters with more coherence and with more biological meaning are identified. SIMBIC+ uses score based approach with an aim of maximizing the similarity of the bicluster. Contribution entropy based condition selection and multiple row / column deletion methods are used to reduce the complexity of the algorithm to identify biclusters with maximum similarity value. Experiments are conducted on Yeast Saccharomyces dataset and the biclusters obtained are compared with biclusters of popular MSB (Maximum Similarity Bicluster) algorithm. The biological significance of the biclusters obtained by the proposed algorithm and MSB are compared and the comparison proves that SIMBIC+ identifies biclusters with more significant GO (Gene Ontology). Keywords: Data Mining, Bioinformatics, Biclustering, Gene Expression Data, Gene Selection, Top-Down Approach, Gene Ontology. 1. INTRODUCTION Gene expression is conversion of information encoded in a gene. Gene expression data is a valuable resource for researchers who are focusing on clustering of genes to draw meaningful
- 2. J.Bagyamani, K. Thangavel & R. Rathipriya International Journal of Biometrics and Bioinformatics (IJBB), Volume (4): Issue (6) 202 inferences. Expressions of genes under different conditions serve as valuable clues to understand the cell differentiation, pathological and genetic behavior. For most functionally related genes, tight correlation occurs under specific experimental conditions. Clustering deals with finding patterns in a collection of unlabeled data. Traditional clustering algorithms consider all of the dimensions of an input dataset in an attempt to learn as much as possible about each object described. According to Kerr et. al [12], clustering the microarray matrix can be achieved in two ways: (i) genes can form a group which show similar expression across conditions, (ii) samples can form a group which show similarity across all genes. This gives rise to global clustering or traditional clustering where a gene or sample is grouped across all dimensions. Biclustering [15, 21], a relatively new unsupervised learning technique, cluster the objects under subset of attributes. It allows the assignment of individual objects to multiple clusters. Co- expressed genes, i.e., genes with similar expression patterns, can be clustered together and manifest similar cellular functions. Hence biclustering aims to find sub-matrices with coexpressed expression values. 1.1 Query driven Biclustering In this Query driven Biclustering technique, usually a query gene is given as input, and a single bicluster which consists of a set of genes and a subset of conditions / samples that are similar to the query gene is extracted. The resultant bicluster that include the query gene answer the following questions which are not answered by most existing biclustering methods in which biologists are interested in [7]. (i) “Which genes involved in a specific protein complex is co expressed?” (ii) “Given a set of known disease genes, how to select new candidate genes that may be linked to the same disease?” Given a specific gene or set of genes (seed genes) known or expected to be related to some common biological pathway or function: (i) “Which genes are (functionally) related to the seed genes and which features (conditions) are relevant for this biological function?” 1.2 Biological Significance An Open Reading Frame (ORF) is a DNA sequence that contains a start codon and a stop codon in the same reading frame. ORF is supposed to be a gene which encodes a protein, but in some cases encoded protein for ORFs are not known. The yeast Saccharomyces cerevisiae [13] is an excellent organism for this type of experiment because its genome has been sequenced and all of the ORFs have been determined. Each study determines the expression level of every ORF at a series of time points. The resulting dataset must be analyzed to determine the roles of specific genes in the process of interest. Genes coding for elements of a protein complex are likely to have similar expression patterns. Hence, grouping ORFs with similar expression levels can reveal the function of previously uncharacterized genes. 1.3 Coherent Bicluster Genes involved in common processes are often co-expressed. In this paper, constant bicluster with reference to the query gene and coherent bicluster with reference to the query gene are extracted. The biological significance of both the biclusters with reference to the same query gene is identified. Comparison of the biological significance shows that coherent bicluster has more biological significance than the constant bicluster. Hence the focus in identifying coherent (i.e., patterns that rise and fall concordantly) bicluster is that co-expression may reveal much about the genes' regulatory systems. Coherent bicluster [1] has more biological significance than constant bicluster.
- 3. J.Bagyamani, K. Thangavel & R. Rathipriya International Journal of Biometrics and Bioinformatics (IJBB), Volume (4): Issue (6) 203 1 2 5 0 2 3 6 1 4 5 8 3 5 6 9 4 Additive Coherent Bicluster TABLE 1: Additive Coherent Bicluster and Multiplicative coherent Bicluster This paper is organized as follows: Section 2 details the preliminary of gene expression data along with literature survey. Section 3 explains the proposed work and the evaluation measures. Section 4 provides the experimental results of Yeast Saccharomyces Cervisiae expression data. Biological validation of the genes within the bicluster is provided in terms of gene ontology in Section 5. Section 6 concludes the article. 2. Background 2.1 Microarray Gene Expression Data Genes are how living organisms inherit features from their ancestors. The information within a particular gene is not always exactly the same between one organism and another, so different copies of a gene do not always give exactly the same instructions. Gene expression levels can be determined for samples taken (i) at multiple time instants of a biological process (different phases of cell division) or (ii) under various conditions (e.g., tumor samples with different histopathological diagnosis). A gene expression database can be regarded as consisting of three parts – the gene expression data matrix, gene annotation and sample / condition annotation. 2.2 Problem statement A gene expression matrix A = [ aij ] of size m x n where each element represents the expression level of gene ‘i’ under condition ‘j’ is considered. Let I be the set of genes and J the set of conditions of A. Biclustering identification is to find a submatrix AI’J’ = A ( I’, J’) with sets of rows I’ I and sets of columns J’ J . . In general, the problem can be defined as one of finding large sets of rows and columns such that the rows show unusual similarities along the dimensions characterized by columns and vice-versa. The bicluster cardinality or volume of bicluster is simply the product of the number of genes and number of conditions in the bicluster. 2.3 Nature of biclustering Algorithms Biclustering, which has been applied intensively in molecular biology research recently, provides a framework for finding hidden substructures in large high dimensional matrices Tanay et al. [19, 20] defined a bicluster as a subset of genes that jointly respond upon a subset of conditions. Biclustering algorithms may have two different objectives: to identify one bicluster or to identify a given number of biclusters. This proposed method identifies one bicluster at a time. Many biclustering methods [3] such as iterative row column [6,8] divide and conquer [9], exhaustive bicluster enumeration, distribution parameter identification exist in literature. Greedy iterative search methods are based on the idea of creating biclusters by adding or removing rows/columns from them, that optimizes the given criteria. They may make wrong decisions and loose good biclusters, but they have the potential to be very fast. Cheng and Church [5] used a greedy procedure starting from the entire data matrix and successively removing columns or rows contributing most to the mean squared residue score. They used both single node deletion and multiple node deletion methods in order to arrive one bicluster at a time and mask the previously discovered biclusters. Iterative Signature Algorithm (ISA) by Ihmels et al [11] has been found to be very effective in identifying (Transcription Module) TMs in yeast expression data. However, the major problem with the algorithm is that it starts with a totally random input gene seed and hence can result in non-meaningful TMs. Thus to gain confidence in the quality of TMs they run their algorithm for a large number of seeds and report a 1 2 0.5 1.5 2 4 1 3 4 8 2 6 3 6 1.5 4.5 Multiplicative coherent Bicluster
- 4. J.Bagyamani, K. Thangavel & R. Rathipriya International Journal of Biometrics and Bioinformatics (IJBB), Volume (4): Issue (6) 204 TM only if it is obtained. Dhollander et al. [7] introduced a model-based query-driven module discovery tool QDB, but it is aimed at performing informed biclustering instead of pattern matching, and it does not take into account the complex correlation patterns such as inverse patterns. Owen et al. [16] proposed a score-based search algorithm called Gene Recommender (GR) to find genes that are co expressed with a given set of genes using data from large microarray datasets. GR first selects a subset of experiments in which the query genes are most strongly co-regulated. Hence multiple query genes are required. Hu et al. [10] developed model- based gene expression query algorithm BEST (Bayesian Expression Search Tool) built under the Bayesian model selection framework. It is capable of detecting co-expression profiles under a subset of samples/experimental conditions. In MSB [14] the maximum similarity bicluster for query gene or reference gene i* is computed, by trying the algorithm for all the conditions j* and then identifying bicluster with maximum similarity. The advantage of MSB is that it is unnecessary to mask previously discovered biclusters. SIMBIC [2] algorithm is an improvement of MSB in terms of computational efficiency but the biclusters obtained by both the methods are same. Instead of single row / column deletion, multiple rows / columns are deleted. Also for a specific reference gene i*, the algorithm need not be executed for all the reference condition j* but j* can be restricted to n/2 conditions that has high contribution entropy. This proposed SIMBIC+ algorithm is an improved version of SIMBIC in the sense that it uses novel ‘ratio’ based similarity measure, applied on conditions with high contribution entropy. Also multiple rows or multiple columns are deleted in each iteration until the gene expression matrix reduces to a single element. Then bicluster with maximum similarity is identified and evaluated using ACV (Average Correlation Variation) measure. The biological significance and p - value of each obtained bicluster are evaluated. The Gene Ontology (GO) of the biclusters obtained by the proposed SIMBIC+ and MSB are compared and the comparison shows that SIMBIC+ outperforms SIMBIC and MSB. 3. PROPOSED WORK 3.1 Condition selection Preprocessing often involves some operation on feature-space in order to reduce the dimensionality of the data. This is referred to as feature selection [17]. The features are sorted based on the contribution entropy value. SVD-based entropy [18] of the dataset is defined as follows. Let sj denote the singular values of the matrix A. sj 2 are then the eigen values of the n x n matrix AA T . The values are normalized by using (1). (1) and the resulting dataset entropy is E = (2) where N is the total number of attributes. This entropy varies between 0 and 1. The minimal value E = 0 corresponds to an ultra ordered dataset and E = 1 corresponds to unordered dataset. The contribution of the ith feature to the entropy CEi is defined by a leave-one-out comparison according to CEi = E(A[n x m]) – E(A[n x (m-1)]) (3) where, in the last matrix, the i th feature is removed. Thus the features are sorted by their relative contribution to the entropy. Simple ranking (SR) method sorts the features. Select ‘n/2’ features / conditions according to the highest ranking order of their CEi values. 3.2 Ratio based Similarity between genes Gene selection is critical in molecular class prediction. In a cellular process, only a relatively small set of genes are active. So select genes i* which has specific functional importance in gene
- 5. J.Bagyamani, K. Thangavel & R. Rathipriya International Journal of Biometrics and Bioinformatics (IJBB), Volume (4): Issue (6) 205 ontology viz. Cellular component, Biological process, Molecular function. Let i* be a reference gene / query gene. Let j* be the reference condition. j* may be chosen in such a way that it has high contribution entropy. The contribution entropy of all the conditions are computed and j* is chosen from the selected ‘n/2’ conditions of the expression data that has high contribution entropy. Because there is a dependency between co-expression and functional relation, co-expressed genes provide excellent candidates for further study. However, the dependency is complex, and it cannot be used to identify the best choice of similarity measure. In [2, 14], the similarity measure is based on the absolute value of the difference. This measure would help us to identify constant and additive biclusters. In order to identify a coherent pattern (shifting and scaling pattern), similarity measure is defined in terms of ratio. For an element aij of expression matrix A (I, J) and a reference gene i* I, dij = abs ( aij / ai*j ) and davg = where | . | refers to number of elements. The similarity between two genes sij is defined as (4) If dij > davg, then the two elements aij and ai*j are not similar and the similarity sij is set to 0. 3.3 Ratio based Similarity score for a bicluster Let S (I, J) be an m x n similarity matrix of A (I, J). The similarity score S (I, J) of the bicluster AIJ is defined as below. For row i I, the similarity score of row ‘i’ is S (i, J) = (5) For row j J’, the similarity score of column ‘j’ is S (I, j) = (6) The similarity score of bicluster S (I, J) = min min S (i, J), min S (I, j)} (7) If this minimum is min(S(i, J)) find the index of all the rows corresponding to this minimum and remove all those rows from A(I, J) to get A(I’, J) else find the index of the columns corresponding to column minimum and remove all those columns from A(I, J) to get A(I, J’). Then A (I, J) is updated as A (I, J’) or A (I’, J). Multiple row / column deletion is performed until the the row size (mr) or column size (mc) is less than or equal to 1. Identify the bicluster which has high similarity score as maximum similarity bicluster. Popular measures used for evaluating quality of a bicluster are MSR (Mean Squared Residue)[5] and ACV (Average Correlation Variation)[4] measure. MSR measures well all types of constant biclusters [1] and ACV is perfect measure for coherent biclusters. SIMBIC+ Algorithm Constant bicluster: Input 1. Gene expression matrix A(I, J) 2. Reference gene i* which has GO functional importance. 3. Reference condition j* from selected (n/2) features. Output a maximum similarity bicluster. Procedure 1. Compute similarity matrix S (I, J) using (4) for the reference gene i*.
- 6. J.Bagyamani, K. Thangavel & R. Rathipriya International Journal of Biometrics and Bioinformatics (IJBB), Volume (4): Issue (6) 206 2. Parameters (mr, mc) = size (A (I, J)). 3. While (mr ≤ 1 or mc ≤ 1) 4. Compute row_sim, S(i, J) 5. Compute col_sim, S(I, j) = 6. find min(S(i, J) and find min S(I, j) 7. Find min { min(S(i, J’) & min S(I’, j)} 8. If this minimum is min(S(i, J’)) find the index of the rows corresponding to this minimum and remove all those rows from A(I , J) to get A(I’, J) 9. else find the index of the columns corresponding to column minimum and remove all those columns from A(I , J) to get A(I , J’). 10. Update A(I, J) = A(I’, J) or A(I, J) = A(I, J’) and S(I, J) = S(I’, J) or S(I, J) = S(I, J’) 11. Find the similarity of bicluster using (7) for the updated S (I, J). 12. Update mr, mc. 13. End while 14. Extract the bicluster with maximum similarity A (I’, J’). 15. Compute ACV and MSR of A (I’, J’). 3.4 Comparison of SIMBIC+ with MSB MSB SIMBIC+ Every row is considered as a reference gene i*. Only genes with functional importance are considered as reference gene i* Every column is considered as a reference column j*. The (n/2) conditions that have more contribution entropy are considered as j*. Number of iterations is m+n-2. Number of iterations is very less. Single node deletion method is used. Multiple node deletion method is used. Distance measure is the absolute difference between the reference gene and other genes. Distance measure is the ratio between the reference gene and other genes. Similarity measure depends on the parameters α and β. No such parameters used for bicluster identification. More complex. Complexity and number of iterations are reduced. Biclusters have biological significance. Biclusters have still more biological significance. TABLE 2: Comparison of MSB and SIMBIC+ This SIMBIC+ algorithm is implemented in Matlab, 2GHz processor with 3 GB RAM. 4. Experimental analysis 4.1 Dataset In order to test the efficiency of the proposed algorithm the Yeast Saccharomyces Cerevisiae data with 2884 genes and 17 conditions was considered wherein the missing values are replaced by -1. [http://arep.med.harvard.edu/biclustering/] 4.2 Bicluster Evaluation Measures Two types of biclusters namely constant and additive coherent are identified using this algorithm. It is observed from Table 3 that additive biclusters have more biological significance than the constant biclusters. The performance of the algorithm is validated using MSR and the ACV. For each bicluster, MSR and ACV are computed using the formulae
- 7. J.Bagyamani, K. Thangavel & R. Rathipriya International Journal of Biometrics and Bioinformatics (IJBB), Volume (4): Issue (6) 207 (8) where rij = aij - µik - µjk + µk, µik is the row mean, µjk is the column mean and µk is the mean of the bicluster. (9) where c_rowij is the correlation coefficient between rows i and j and c_colpq is the correlation coefficient between columns p and q. Bicluster with low MSR and high ACV (i.e., ACV approaching 1) is a good bicluster. ‘P’ value of a bicluster provides the biological significance of a bicluster. It provides the probability of including genes of a given category in a cluster by chance. Thus overrepresented bicluster is a cluster of genes which is very unlikely to be obtained randomly. Suppose that we have a total population of N genes, in which M have a particular annotation. If we observe x genes with that annotation, in a sample of n genes, then we can calculate the probability of that observation, using the hyper geometric distribution. Thus the probability of getting x or more genes with an annotation, out of n, given that M in the population of N have that annotation, is: ∑ − = − − − 1 0 1=_ x j n N jn MN j M valuep (10) The gene ontology namely Biological Process (BP), Molecular Function (MF) and Cellular Component (CC) of the bicluster can be identified using GOTermfinder. 4.3 Performance of SIMBIC+ Algorithm Table 3 gives the comparison of the performance of the proposed algorithm for corresponding reference gene i* and reference condition j* for identifying a maximum similarity bicluster of Yeast Saccharomyces Cerevisiae dataset. It is observed that the first four biclusters of Table 3 identified by the proposed SIMBIC+ are highly correlated compared to bicluster obtained from MSB for the same reference gene and reference condition. Even though the last two biclusters of Table 3 identified by MSB are more correlated (with high ACV) the volume of the bicluster is comparatively less i.e., statistically these are good biclusters. Statistical significance alone does not decide the quality of the bicluster. Statistical measures evaluate a bicluster theoretically, but the biological significance proves the real quality of the bicluster obtained. Hence the biological significance of the biclusters obtained by the proposed SIMBIC+ and MSB are tabulated in Table 4 and Table 5 respectively. i* j* Nature of bicluster SIMBIC+ MSB No. of Iterations ACV Size of bicluster No. of Iterations ACV Size of bicluster 210 14 Constant 1903 0.4864 20 x 17 2899 0.3165 25 x 17 210 14 Additive 2647 0.9553 18 x 16 2899 0.7020 15 x 12 288 14 Constant 1903 0.3556 22 x 17 2899 0.2519 22 x 16 288 14 Additive 2583 0.9684 19 x 16 2899 0.9224 19 x 14 2462 9 Additive 1759 0.9300 19 x 17 2899 0.9988 29 x 8 1459 17 Additive 2455 0.9199 19 x 16 2899 1.0000 6 x 6 TABLE 3: Comparison of performance of SIMBIC+ with MSB The selected conditions of yeast Saccharomyces data based on the contribution entropy are 6, 7, 8, 9, 12, 13, 14, 15 and 17. Bicluster plots or parallel coordinate plot and heatmaps provide the
- 8. J.Bagyamani, K. Thangavel & R. Rathipriya International Journal of Biometrics and Bioinformatics (IJBB), Volume (4): Issue (6) 208 visual representation of the bicluster. Figures 1, 3, 5, 7 are the bicluster plots of biclusters obtained by the proposed SIMBIC+ algorithm and Figures 2, 4, 6, 8 are the bicluster plots of biclusters obtained by MSB. Figure 1 is the bicluster plot of additive bicluster with 19 genes, 16 conditions when i* is chosen as 288 (gene ID ‘YBR198C’ which has the functional importance of SLIK (SAGA like complex) and reference condition j* is chosen as 14. This bicluster has ACV = 0.9684 and MSR= 9.7747 x 10 4 . Figure 2 is the bicluster plot of additive bicluster with 19 genes, 14 conditions for the same reference gene and reference condition. This bicluster has ACV = 0.9224 and MSR = 5.3994 x 10⁴ . Figure 3 shows the bicluster plot of additive bicluster with 19 genes and 16 conditions when i* is chosen as 210 and reference condition j* is chosen as 14. This bicluster has ACV= 0.9553 and MSR= 7.6272 x 10 4 . Figure 4 shows the bicluster plot of additive bicluster with 15 genes and 12 conditions for the same reference gene and reference condition. This bicluster has ACV= 0.7020 and MSR= 4.6092 x 10 4 . 0 2 4 6 8 10 12 14 16 18 20 0 100 200 300 400 500 600 Genes Expressionvalues Bicluster plot of Yeastdata using SIMBIC PLUS i*=288 j*=14 0 2 4 6 8 10 12 14 16 18 20 100 150 200 250 300 350 400 Genes Expressionvalues bicluster plot of Yeast data using RMSBE i* = 288 j* =14 Type : Additive FIGURE 1: Additive Bicluster using SIMBIC+ FIGURE 2: Additive Bicluster using MSB with i*=288 with i*=288 0 2 4 6 8 10 12 14 16 18 0 50 100 150 200 250 300 350 400 Genes Expressionvalues Bicluster plot of yeast data using SIMBIC PLUS i* = 210 j*=14 0 5 10 15 100 150 200 250 300 350 Genes Expressionvalues bicluster plot of Yeast data using RMSBE i* = 210 j* = 14 Type: Additive FIGURE 3: Additive Bicluster using SIMBIC+ FIGURE 4: Additive Bicluster using MSB with i*=210 and j*=14 with i*=210 and j*=14 Figure5 shows the bicluster plot constant bicluster with 22 genes and 17 conditions when i* is chosen as 288 and reference condition j* is chosen as 14. This bicluster has ACV= 0.3556 and MSR= 1.0717 x 10⁵ . Figure 6 shows the bicluster plot of constant bicluster with 22 genes and 16
- 9. J.Bagyamani, K. Thangavel & R. Rathipriya International Journal of Biometrics and Bioinformatics (IJBB), Volume (4): Issue (6) 209 conditions for the same reference gene and reference condition. This bicluster has ACV= 0.2519 and MSR= 8.8503 x 10⁴ . Figure7 shows the bicluster plot of constant bicluster with 20 genes and 17 conditions when i* is chosen as 210 and reference condition j* is chosen as 14. This bicluster has ACV = 0.4864 and MSR = 9.9778 x 10 4 . Figure 8 shows the bicluster plot of constant with 25 genes, 17 conditions for the same reference gene and reference condition. This bicluster has ACV= 0.3165 and MSR= 1.204 x 10⁵ . 0 5 10 15 20 25 60 80 100 120 140 160 180 200 220 240 260 Genes Expressionvalues Bicluster plot of Yeast data using SIMBIC PLUS i*=288 j*=14 Constant bicluster 0 5 10 15 20 25 100 120 140 160 180 200 220 240 260 280 300 Genes Expressionvalues Bicluster plot of yeast data using RMSBE i* = 288 j* = 14 type : Constant FIGURE 5: Constant Bicluster using SIMBIC+ FIGURE 6: Constant Bicluster using MSB with i*=288 and j*=14 with i*=288 and j*=14 0 2 4 6 8 10 12 14 16 18 20 60 80 100 120 140 160 180 200 220 240 Conditions Expressionvalues Bicluster plot of Yeast data using SIMBIC PLUS i*=210 , j*=14 Constant bicluster 0 5 10 15 20 25 100 120 140 160 180 200 220 240 260 280 300 Genes Expressionvalues Bicluster plot of Yeast data using RMSBE i* = 210 j* = 14 Type: Constant FIGURE 7: Constant Bicluster using SIMBIC+ FIGURE 8: Constant Bicluster using MSB with i*=210 and j*=14 with i*=210 and j*=14
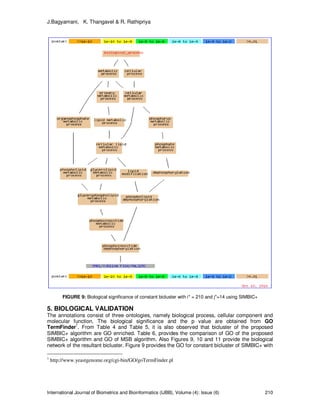
- 10. J.Bagyamani, K. Thangavel & R. Rathipriya International Journal of Biometrics and Bioinformatics (IJBB), Volume (4): Issue (6) 210 FIGURE 9: Biological significance of constant bicluster with i* = 210 and j*=14 using SIMBIC+ 5. BIOLOGICAL VALIDATION The annotations consist of three ontologies, namely biological process, cellular component and molecular function. The biological significance and the p value are obtained from GO TermFinder1 . From Table 4 and Table 5, it is also observed that bicluster of the proposed SIMBIC+ algorithm are GO enriched. Table 6, provides the comparison of GO of the proposed SIMBIC+ algorithm and GO of MSB algorithm. Also Figures 9, 10 and 11 provide the biological network of the resultant bicluster. Figure 9 provides the GO for constant bicluster of SIMBIC+ with 1 http://www.yeastgenome.org/cgi-bin/GO/goTermFinder.pl
- 11. J.Bagyamani, K. Thangavel & R. Rathipriya International Journal of Biometrics and Bioinformatics (IJBB), Volume (4): Issue (6) 211 i* = 210. The genes involved in this bicluster are responsible for biological processes phospholipid dephosphorylation and phosphoinositide dephosphorylation. Figure 10 provides the GO (cellular function) for additive bicluster of SIMBIC+ with i*=210 and j*=14. Figure 11 provide the GO (molecular function) for additive bicluster of SIMBIC+ with i*=288 and j*=14. The genes involved in this bicluster are responsible for ATPase activity, coupled to transmembrane movement of ions, phosphorylative mechanism. FIGURE 10: Biological significance of additive bicluster i* = 210 and j*=14 using SIMBIC+
- 12. J.Bagyamani, K. Thangavel & R. Rathipriya International Journal of Biometrics and Bioinformatics (IJBB), Volume (4): Issue (6) 212 FIGURE 11: Biological significance of additive bicluster i* = 288 and j*=14 using SIMBIC+
- 13. J.Bagyamani, K. Thangavel & R. Rathipriya International Journal of Biometrics and Bioinformatics (IJBB), Volume (4): Issue (6) 213 Reference gene i*=210 , reference condition j*=14 , alpha=.2 beta = .2 gamma=.9, volume= 15x 12 MSR 46092 ACV=0.7020 , Type : Additive bicluster, GO: Biological Process GOID GO_term Cluster frequency P-value FDR 19236 response to pheromone 3 out of 15 genes, 20.0% 0.09218 0.22 Nature of GO: Molecular Function 4519 endonuclease activity 2 out of 15 genes, 13.3% 0.04723 0.6 Nature of GO: Cellular component unknown Reference gene i*=210 , reference condition j*=14 , alpha=.2 beta = .2 gamma=.9, volume= 25x 17 MSR 120400 ACV=0.3165 , Type :Constant bicluster. Biological Process - Unknown Molecular Function - Unknown Cellular component - Unknown TABLE 4: Biological significance of Biclusters of Yeast Dataset obtained from MSB
- 14. J.Bagyamani, K. Thangavel & R. Rathipriya International Journal of Biometrics and Bioinformatics (IJBB), Volume (4): Issue (6) 214 Reference gene i*= 210, Reference condition j* = 14 , volume = 20 *17 = 340 ,MSR =98960 ACV=.4953 Type: constant Bicluster Nature of GO: Biological Process GOID GO_term Cluster frequency P-value FDR 46839 phospholipid dephosphorylation 2 out of 20 genes, 10.0% 0.02953 0.18 46856 phosphoinositide dephosphorylation 2 out of 20 genes, 10.0% 0.02953 0.09 9987 cellular process 20 out of 20 genes, 100.0% 0.06939 0.09 Nature of GO: Molecular Function 3682 chromatin binding 4 out of 20 genes, 20.0% 0.00084 0 Nature of GO: Cellular Component 4437 inositol or phosphatidylinositol phosphatase activity 2 out of 20 genes, 10.0% 0.00723 0.02 Reference gene i*= 210, Reference condition j* = 14 , volume = 18 *16 = 288 ,MSR =76272 , ACV=.9553 Type: Additive Bicluster Nature of GO:Cellular Component Nature of GO: Biological Process 6814 sodium ion transport 2 out of 18 genes, 11.1% 0.00848 0 15672 monovalent inorganic cation transport 3 out of 18 genes, 16.7% 0.00902 0 Nature of GO: Molecular Function 15662 ATPase activity, coupled to transmembrane movement of ions, phosphorylative mechanism 2 out of 18 genes, 11.1% 0.01372 0.12 42625 ATPase activity, coupled to transmembrane movement of ions 2 out of 18 genes, 11.1% 0.06971 0.19 44451 nucleoplasm part 6 out of 20 genes, 30.0% 0.00237 0 5654 nucleoplasm 6 out of 20 genes, 30.0% 0.00394 0 43234 protein complex 11 out of 20 genes, 55.0% 0.00874 0 44428 nuclear part 10 out of 20 genes, 50.0% 0.02298 0 46695 SLIK (SAGA-like) complex 2 out of 20 genes, 10.0% 0.04023 0.02 44422 organelle part 14 out of 20 genes, 70.0% 0.04762 0.01 44446 intracellular organelle part 14 out of 20 genes, 70.0% 0.04762 0.01 124 SAGA complex 2 out of 20 genes, 10.0% 0.05593 0.01 70461 SAGA-type complex 2 out of 20 genes, 10.0% 0.06171 0.02 32991 macromolecular complex 12 out of 20 genes, 60.0% 0.08059 0.01 TABLE 5: Biological significance of Biclusters of Yeast Dataset obtained from SIMBIC+ Table:4 provides the biological significance constant and additive biclusters of yeast data for the reference gene i*=210. Table:5 provides the biological significance constant and additive biclusters of yeast data for the reference gene i*=210. There are 2 biological significances for MSB and 19 biological significances for SIMBIC+.Table:6 provides the comparison of GO enrichment of Biclusters of Yeast Dataset obtained by proposed SIMBIC+ and existing MSB algorithms. It is observed that highly correlated biclusters have more biological significance than biclusters with similar values. Also the proposed SIMBIC+ algorithm identifies biclusters with more biological significance (with low ‘p’ value and less False Discovery Rate).
- 15. J.Bagyamani, K. Thangavel & R. Rathipriya International Journal of Biometrics and Bioinformatics (IJBB), Volume (4): Issue (6) 215 i* j* Type SIMBIC + MSB 210 - Constant 3 1 1 0 0 0 210 14 Additive 2 2 10 1 1 0 2462 9 Additive 5 3 1 2 1 2 1459 17 Additive 4 2 6 1 1 3 288 14 Constant 2 1 3 2 1 3 288 14 Additive 3 2 5 2 2 4 TABLE :6 Comparison of GO enrichment of Biclusters of Yeast Dataset obtained by SIMBIC+ and MSB 6. CONCLUSION AND FUTURE WORK This proposed algorithm identifies biclusters of gene expression data with more biological significance. The multiple node deletion method based on the new similarity score applied on the extracted features / conditions, makes the algorithm very efficient and less time consuming. The biological significance of the biclusters and ‘p’ value are obtained using GO-Term Finder. Results prove that the proposed SIMBIC+ algorithm is computationally efficient and biologically significant. Also the results prove that biclusters with scaling pattern are more biologically significant than the biclusters with shifting pattern. Acknowledgement The first author acknowledges the UGC, SERO, Hyderabad to carry out this research under FIP. The second author acknowledges the UGC, New Delhi for financial assistance under major research project grant No. F-34-105/2008. 7. REFERENCES 1. W. Ayadi, M. Elloumi, J.K Hao. “A biclustering algorithm based on a Bicluster Enumeration Tree: application to DNA microarray data”. Biodata Mining, 2:9, 2009 2. J. Bagyamani, K. Thangavel. “SIMBIC: SIMilarity Based BIClustering of Expression Data”. Information Processing and Management Communications in Computer and Information Science, 70, 437-441, 2010 3. A. Ben-Dor, B. Benny Chor, R. Karp, and Z. Yakhini , “Discovering local structure in gene expression data: The order–preserving sub matrix problem”. Journal of Computational Biology, 373–84 4. K, Cheng, N. Law, W. Siu and A. Liew. “Identification of coherent patterns in gene expression data using an efficient biclustering algorithm and parallel coordinate visualization” BMC Bioinformatics, 9:210, 2008 5. Y. Cheng, G.M Church, “Biclustering of expression data”. Proceedings of 8th International Conference on Intelligent Systems for Molecular Biology, ISMB-00, 93-103, 2000 6. Chun Tang, Li Zhang, Idon Zhang, and Murali Ramanathan, “Interrelated two-way clustering: an unsupervised approach for gene expression data analysis”. Proceedings of the 2nd IEEE International Symposium on Bioinformatics and Bioengineering, 41–48, 2001 7. T. Dhollander, Q. Sheng, K. Lemmens, B.D. Moor and K. Marchal et al., “Query-driven module discovery in microarray data”. Bioinformatics, 2007 8. G. Getz, E. Levine and E. Domany, “Coupled two-way clustering analysis of gene microarray data”. Proceedings of the Natural Academy of Sciences USA, 12079-12084, 2000 9. J.A. Hartigan. "Direct clustering of a data matrix". Journal of the American Statistical Association Statistical Assoc. (JASA), 67, 123-129, 1972
- 16. J.Bagyamani, K. Thangavel & R. Rathipriya International Journal of Biometrics and Bioinformatics (IJBB), Volume (4): Issue (6) 216 10. M. Hu, and Z.S. Qin. ”Query Large Scale Microarray Compendium Datasets using a Model- Based Bayesian Approach with Variable Selection”, PLoS ONE 4(2) e4495, 2009. 11. J. Ihmels et al. ”Defining transcription modules using large-scale gene expressiondata”. Bioinformatics, 20,2004 12. G. Kerr, H.J. Ruskin, M. Crane and P. Doolan, “Techniques for clustering gene expression data”. Computers in Biology and Medicine, .38 (3), 283-293, 2008 13. J. Laurie Heyer, Semyon Kruglyak, and Shibu Yooseph, “Exploring Expression Data: Identification and Analysis of Coexpressed Genes”. ISMB, Bioinformatics, 22(14), e507-513, 2006 14. X. Liu and L. Wang, “Computing maximum similarity biclusters of gene expression data”, Bioinformatics, 23(1),50-56, 2007 15. S.C. Madeira and A.L Oliveira. “Biclustering algorithms for biological data analysis: a survey”. IEEE Transactions on Computational Biology and Bioinformatics,1(1) 24-45, 2004 16. A.B. Owen, J. Stuart, K. Mach, A.M Villeneuve and S. Kim. “A gene recommender algorithm to identify co expressed genes in C. elegans”. Genome Res 13: 1828–1837, 2003 17. P.M Pardalos, S. Busygin and O.A Prokopyev. “On biclustering with feature selection for microarray data sets”. BIOMAT2005—International Symposium on Mathematical and Computational Biology, World Scientific, 367–78, 2006 18. Roy Varshavsky, Assaf Gottlieb, Michal Linial and David Horn. “Novel Unsupervised Feature Filtering of Biological Data”. Bioinformatics, 22(14), e507-e513, 2006 19. A. Tanay, R. Sharan and R. Shamir. “Biclustering Algorithms: A Survey”. Handbook of Computational Molecular Biology, 2004 20. A. Tanay, R. Sharan and R. Shamir. “Discovering statistically significant biclusters in gene expression data”. Bioinformatics, 18, 136-144, 2002 21. J. Yang, H. Wang, W. Wang and P.S Yu “An improved biclustering method for analyzing gene expression”. International Journal on Artificial Intelligence Tools, 14(5), 771-789, 2005.