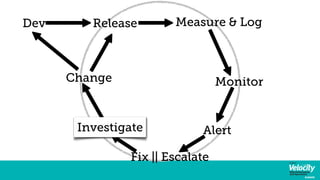
Just enough web ops for web developers
0 likes599 views

Datadog is monitoring that does not suck. It's metrics friendly, people friendly and developer friendly monitoring. Learn more at https://www.datadoghq.com/
1 of 60
Download to read offline


Ad
Recommended
Lifting the Blinds: Monitoring Windows Server 2012
Lifting the Blinds: Monitoring Windows Server 2012Datadog Operating systems monitor resources continuously in order to effectively schedule processes.
In this webinar, Evan Mouzakitis (Datadog) discusses how to get operational data from Windows Server 2012 using a variety of native tools.
Docker Usage Patterns - Meetup Docker Paris - November, 10th 2015
Docker Usage Patterns - Meetup Docker Paris - November, 10th 2015Datadog Go through the result of our latest large-scale study about Docker usage in real environment. Analyze and see the impact for operations and monitoring.
Datadog- Monitoring In Motion 
Datadog- Monitoring In Motion Cloud Native Apps SF This document summarizes a presentation about monitoring challenges with Kubernetes and containers. The presentation covered:
- Monitoring 101 concepts like categorizing issues and focusing on symptoms to find root causes.
- Challenges of monitoring dynamic container infrastructure like increased operational complexity from many ephemeral containers and scaling to monitor thousands of metrics.
- Approaches for container monitoring including taking a service-centric rather than host-centric view and using tags to query metrics flexibly across infrastructure attributes.
- Features of Datadog for container monitoring like automatic discovery of containers and metadata, off-the-shelf integrations, and dashboards for visualizing metrics and alerts.
The Data Mullet: From all SQL to No SQL back to Some SQL
The Data Mullet: From all SQL to No SQL back to Some SQLDatadog This document discusses Datadog's data architecture, which uses a combination of SQL and NoSQL databases. It initially used all SQL (Postgres) but found it did not scale well. It added Cassandra for durable storage and Redis for in-memory storage to improve performance and scalability. While Cassandra provided large-scale durable storage, it had issues with I/O latency on EC2. The document examines different database choices and how Datadog addressed scaling and latency issues through a hybrid "data mullet" approach using different databases for their strengths.
Application Monitoring using Datadog
Application Monitoring using DatadogMukta Aphale Application monitoring is being talked about a lot these days and it helps provide key information that is helpful in developing better software and also in taking some key business decision. Datadog offers monitoring as a service.
Series of Unfortunate Netflix Container Events - QConNYC17
Series of Unfortunate Netflix Container Events - QConNYC17aspyker Project Titus is Netflix's container runtime on top of Amazon EC2. Titus powers algorithm research through massively parallel model training, media encoding, data research notebooks, ad hoc reporting, NodeJS UI services, stream processing and general micro-services. As an update from last year's talk, we will focus on the lessons learned operating one of the largest container runtimes on a public cloud. We'll cover the migration we've seen of applications and frameworks from VM's to containers. We will cover the operational issues with containers that only showed after we reached the large scale (1000's of container hosts, 100's of thousands of containers launched weekly) we are currently supporting. We'll touch base on the unique features we have added to help both batch and microservices run across a variety of runtimes (Java, R, NodeJS, Python, etc) and how higher level frameworks have taken advantage of Titus's scheduling capabilities.
Netflix OSS Meetup Season 5 Episode 1
Netflix OSS Meetup Season 5 Episode 1aspyker Topics:
• RepoKid
Netflix’s Open-source Strategy to Rightsizing Cloud Permissions at Scale
• BetterTLS
A test suite for HTTPS clients implementing verification of the Name Constraints certificate extension
• Authorization at Netflix
Netflix’s architecture for implementing Authorization at scale
• Open Policy Agent
An open source, general-purpose policy engine that enables unified, context-aware policy enforcement across the entire stack. (www.openpolicyagent.org)
• Introducing PADME (Policy Access Decision Management Engine)
A modern policy management for distributed heterogenous systems. (www.padme.io)
Demo Stations:
• Stethoscope
Personalized, user-focused recommendations for employee information security.
• HubCommander
Slack bot for GitHub organization management -- and other things too!
• Open Policy Agent
An open source, general-purpose policy engine that enables unified, context-aware policy enforcement across the entire stack.
Netflix Cloud Architecture and Open Source
Netflix Cloud Architecture and Open Sourceaspyker Netflix has over 109 million members and uses over 500 microservices running on 100,000 virtual machines across 3 regions to stream over 100 million hours of content per day. Netflix open sources many of its cloud projects to improve engineering, recruit talent, and align with industry standards. Some of Netflix's notable open source projects include Chaos Monkey for testing high availability, Spinnaker for continuous delivery, and Security Monkey for monitoring security policies. While Netflix's cloud architecture and security practices were discussed, areas like big data, data persistence, UI engineering, personalization algorithms, and studio applications were not covered.
Scalable and Reliable Logging at Pinterest
Scalable and Reliable Logging at PinterestKrishna Gade Pinterest uses Kafka as the central logging system to collect over 120 billion messages per day from thousands of hosts. They developed Singer, a lightweight logging agent, to reliably upload application logs to Kafka with low latency. Data is then moved from Kafka to cloud storage using systems like Secor and Merced that ensure exactly-once processing. Maintaining high log quality requires monitoring for anomalies, auditing new features, and catching issues both before and after releases through automated tooling.
Scaling monitoring with Datadog
Scaling monitoring with Datadogalexismidon Datadog is a monitoring service that helps scale monitoring through pre-canned tools like integrations and dashboards, templated dashboards that can be reused across environments, and a powerful API. The API allows monitoring to be coded and integrated with provisioning tools like CloudFormation, version controlled, and tracked like any other code. This improves monitoring by bringing development practices like testing, versioning, and avoiding duplication to monitoring configuration and resources.
Netflix Open Source: Building a Distributed and Automated Open Source Program
Netflix Open Source: Building a Distributed and Automated Open Source Programaspyker Netflix has been using and contributing to open source for several years. Over the years, Netflix has released over one hundred Netflix Open Source (aka NetflixOSS) libraries, servers, and technologies. Netflix engineers benefit by accepting contributions and gathering feedback with key collaborators around the world. Users of NetflixOSS from many industries benefit from our solutions including Big Data, Build and Delivery Tools, Runtime Services and Libraries, Data Persistence, Insight, Reliability and Performance, Security and User Interface. With such a large and mature open source program, Netflix has worked on approaches and tools that help manage and improve the NetflixOSS source offerings and communities. Netflix has taken a different approach to building support for open source as compared to other Internet scale companies. Come to this session to learn about the unique approaches Netflix has taken to both distribute and automate the responsibilities of building a world-class open source program.
Securing Databases with Dynamic Credentials and HashiCorp Vault
Securing Databases with Dynamic Credentials and HashiCorp VaultMitchell Pronschinske Dynamic credentials and secrets—meaning credentials that are automatically rotated over a reasonable period of time—are crucial to a strong security posture. Without them, an attacker could move around in your network for months or years with valid credentials.
Frequently rotating credentials can be a major hassle, but HashiCorp Vault is changing that. In this solutions engineering hangout session, Thomas Kula, an SE at HashiCorp will demo how to use Vault to deliver dynamic database credentials in an easy, automated manner.
20140708 - Jeremy Edberg: How Netflix Delivers Software
20140708 - Jeremy Edberg: How Netflix Delivers SoftwareDevOps Chicago Netflix delivers software through fully automated processes and a service-oriented architecture. They hire responsible developers and give them freedom and responsibility. Netflix builds everything to withstand failures through redundancy, automation, and a philosophy of "automate all the things."
Testing at Stream-Scale
Testing at Stream-ScaleAll Things Open This document discusses testing strategies for data pipelines at scale. It recommends (1) communicating a testing strategy, (2) removing barriers to testing, (3) pursuing great staging environments, and (4) continuous end-to-end testing using a tool called Kafka Detective. Kafka Detective enables end-to-end testing by comparing data between staging and production Kafka topics and reporting any differences. The author details how Kafka Detective has found real issues in their pipelines and shares its features and roadmap for supporting more use cases.
The Art of Decomposing Monoliths - Kfir Bloch, Wix
The Art of Decomposing Monoliths - Kfir Bloch, WixCodemotion Tel Aviv Kfir Bloch discusses considerations for decomposing monolithic applications into microservices at Wix. He outlines four main reasons for decomposing: 1) to isolate resources for high availability, 2) to support different release cycles, 3) to reuse and share logic, and 4) to have single team responsibility over services. Bloch also discusses mitigations for challenges like partial deployments and increased failure points. He emphasizes starting the decomposition gradually and monitoring services from the beginning.
Migrating big data
Migrating big datalauraxthomson The document summarizes Mozilla's migration of its Socorro crash analysis system from its original infrastructure to a new architecture. It describes Socorro and its purpose of analyzing crash data. It then discusses the rationale for migrating to improve stability, the planning process, building out the new infrastructure with automation and configuration management, load testing the new system, troubleshooting issues during the migration, and lessons learned from the process.
Pivoting Spring XD to Spring Cloud Data Flow with Sabby Anandan
Pivoting Spring XD to Spring Cloud Data Flow with Sabby AnandanPivotalOpenSourceHub Pivoting Spring XD to Spring Cloud Data Flow: A microservice based architecture for stream processing
Microservice based architectures are not just for distributed web applications! They are also a powerful approach for creating distributed stream processing applications. Spring Cloud Data Flow enables you to create and orchestrate standalone executable applications that communicate over messaging middleware such as Kafka and RabbitMQ that when run together, form a distributed stream processing application. This allows you to scale, version and operationalize stream processing applications following microservice based patterns and practices on a variety of runtime platforms such as Cloud Foundry, Apache YARN and others.
About Sabby Anandan
Sabby Anandan is a Product Manager at Pivotal. Sabby is focused on building products that eliminate the barriers between application development, cloud, and big data.
The inherent complexity of stream processing
The inherent complexity of stream processingnathanmarz The document discusses approaches for computing unique visitors to web pages over time ranges while dealing with changing user ID mappings.
Initially, three approaches are presented using a key-value store: storing user IDs in sets indexed by URL and hour bucket (Approach 1), using HyperLogLogs for more efficient storage (Approach 2), and storing at multiple granularities to reduce lookups (Approach 3).
The problem is made harder by the presence of "equiv" records that map one user ID to another. Later approaches try to incrementally normalize user IDs, sample user IDs, or maintain separate indexes.
Ultimately, a hybrid approach is proposed using batch computation over the entire dataset to build robust indexes,
Monitoring Big Data Systems Done "The Simple Way" - Demi Ben-Ari - Codemotion...
Monitoring Big Data Systems Done "The Simple Way" - Demi Ben-Ari - Codemotion...Codemotion Once you start working with Big Data systems, you discover a whole bunch of problems you won’t find in monolithic systems. Monitoring all of the components becomes a big data problem itself. In the talk, we’ll mention all of the aspects that you should take into consideration when monitoring a distributed system using tools like Web Services, Spark, Cassandra, MongoDB, AWS. Not only the tools, what should you monitor about the actual data that flows in the system? We’ll cover the simplest solution with your day to day open source tools, the surprising thing, that it comes not from an Ops Guy.
Winston - Netflix's event driven auto remediation and diagnostics tool
Winston - Netflix's event driven auto remediation and diagnostics toolVinay Shah This was a slide deck on Winston presented at a meetup on auto remediation and diagnostics: https://www.meetup.com/Auto-Remediation-and-Event-Driven-Automation/events/234628846/
Container orchestration: the cold war - Giulio De Donato - Codemotion Rome 2017
Container orchestration: the cold war - Giulio De Donato - Codemotion Rome 2017Codemotion L’ecosistema degli orchestratori di container è in rapido movimento, una galassia di piattaforme e framework. Come si fa a scegliere quello giusto per le vostre esigenze? Vediamo tutti gli orchestratori in commercio, con i loro pro e contro: DC/OS, Kubernetes, Docker e anche quelli meno famosi ma saranno promesse, e anche le dinamiche e le scelte fatte.
Python & Cassandra - Best Friends
Python & Cassandra - Best FriendsJon Haddad This document discusses the benefits of using Python and Cassandra together. It provides an overview of using virtual environments in Python to isolate projects. It also summarizes the Python driver for Cassandra, which allows connecting to Cassandra clusters and executing queries, and cqlengine, an object mapper that simplifies working with Cassandra from Python.
Open Source Monitoring Tools Shootout
Open Source Monitoring Tools Shootouttomdc The Open source market is getting overcrowded with different Network monitoring solutions, and not without reason, monitoring your infrastructure become more important each day, you have to know what's going on for your boss, your customers and for yourself. Nagios started the evolution, but today OpenNMS, Zabix, Zenoss, Groundworks, Hyperic and different others are showing up in the market. Do you want lightweight, or feature full, how far do you want to go with your monitoring, just on os level, or do you want to dig into your applications, do you want to know how many query per seconds your MySQL database is serving, or do you want to know about the internal state of your JBoss, or be triggered if the OOM killer will start working soon. This presentation will guide the audience trough the different alternatives, based on our experiences in the field. We will be looking both at alerting and trending and how easy or difficult it is to deploy such an environment.
Cassandra Day Denver 2014: Setting up a DataStax Enterprise Instance on Micro...
Cassandra Day Denver 2014: Setting up a DataStax Enterprise Instance on Micro...DataStax Academy Speaker: Joey Filichia, Business Intelligence Consultant
There are many options for Cloud Providers, but according to the Gartner Magic Quadrant 2014 for IaaS Solutions, Amazon AWS and Microsoft Azure are both leaders and visionaries. DataStax provides instructions for provisioning an Amazon Machine Image. This discussion will provide guidance on setting up a single-node DataStax Enterprise cluster using an Ubuntu 14.04 Server and a Windows Azure Virtual Machine. Using the DataStax Enterprise production installation in text mode, we will install DSE end to end during the presentation.
Advanced A/B Testing at Wix - Aviran Mordo and Sagy Rozman, Wix.com
Advanced A/B Testing at Wix - Aviran Mordo and Sagy Rozman, Wix.comDevOpsDays Tel Aviv While A/B test is a very known and familiar methodology for conducting experiments on production when you do that on a large scale it has many challenges in the organization level and operational level.
At Wix we are practicing continuous delivery for over 4 years. Conducting A/B tests and writing feature toggles is at the core of our development process. However when doing so on a large scale, with over 1000 experiments every month, it holds many challenges and affect everyone in the company, from developers, product managers, QA, marketing and management.
In this talk we will explain what is the lifecycle of an experiment, some of the challenges we faced and the effect on our development process.
* How an experiment begins its life
* How an experiment is defined
* How do you let non technical people control the experiment while preventing mistakes
* How an experiment go live, what is the lifecycle of an experiment from beginning to end
* What is the difference between client and server experiments
* How do you keep the user experience and not confuse them
* How does it affect the development process
* How can QA test an environment that changes every 9 minutes
* How can support help users when every user may be part of different experiment
* How can we find if an experiment is causing errors when you have millions of permutations [at least 2^(number of active experiments)]
* What are the effects of always having multiple experiments on system architecture
* What are the development patterns when working with AB test
At Wix we have developed our 3rd generation experiment system called PETRI, which is (will be) open sourced, that helps us maintain some order in a chaotic system that keep changing. We will also explain how PETRI works, what are the patterns in conducting experiments that will have a minimal effect on performance and user experience.
Webinar Slides: Real time Recommendations with Redis, Java and Websockets
Webinar Slides: Real time Recommendations with Redis, Java and WebsocketsRedis Labs WebSockets connect the browser to your app server. But what if the processing happens on some other server? In that case you need to connect the worker process to the app process via a messaging system. After experimenting with RabbitMQ, we settled on Redis as a great pub sub and a caching system.
In this webinar you will learn:
* How to use Java, Spring, and Redis ( spring-websockets and spring-data-redis) to power a real time recommendations system
* How many users are currently using your system in real time
KubeSecOps
KubeSecOpsKarthik Gaekwad Karthik Gaekwad gave a presentation on securing Kubernetes clusters. He discussed reducing the attack surface by hardening hosts, using official container images with specific versions, limiting privileges, and periodically checking for vulnerabilities. He explained how Kubernetes features like TLS, authentication, authorization, auditing, network policies and pod security policies can help. Open source tools like Clair, Kube-bench, Kubesec and Kubeaudit were presented to analyze vulnerabilities and check configuration best practices. The overall message was to take a layered approach to security using the platform capabilities and tooling available.
Serverless in production, an experience report (codemotion milan)
Serverless in production, an experience report (codemotion milan)Yan Cui This document provides guidance and best practices for deploying AWS Lambda functions to production environments. It discusses principles for deployment such as having zero downtime and independent, loosely coupled features. It also covers practices for testing, monitoring, logging, configuration management and optimizing Lambda performance. Testing practices include unit, integration and acceptance tests. Metrics and logs should be centralized and made searchable. Distributed tracing helps identify issues between functions. Configuration changes should be propagated easily. Cold starts can be avoided through techniques like health checks and state caching.
I <3 graphs in 20 slides
I <3 graphs in 20 slidesDatadog The document discusses the author's interest in graphs and how they began exploring graphs after receiving an email. It then mentions Redis, memory, and alerts, along with a quote about wanting to see a graph. The rest of the document contains log messages about saving in the background being unable to allocate memory at first, but then succeeding. It emphasizes how graphs allow for correlation and joy, whereas without them there is no correlation or joy.
Alerting: more signal, less noise, less pain
Alerting: more signal, less noise, less painDatadog Is this talk for me?
✓I am or will be on-call
✓I don’t like being alerted
✓I want the pain to go away
The next 40 minutes
1. Alerts == pain?
2. Measure alerts
3. Concrete (& fun) steps
Learn more about Datadog's infrastructure monitoring as a service at https://www.datadoghq.com.
Ad
More Related Content
What's hot (20)
Scalable and Reliable Logging at Pinterest
Scalable and Reliable Logging at PinterestKrishna Gade Pinterest uses Kafka as the central logging system to collect over 120 billion messages per day from thousands of hosts. They developed Singer, a lightweight logging agent, to reliably upload application logs to Kafka with low latency. Data is then moved from Kafka to cloud storage using systems like Secor and Merced that ensure exactly-once processing. Maintaining high log quality requires monitoring for anomalies, auditing new features, and catching issues both before and after releases through automated tooling.
Scaling monitoring with Datadog
Scaling monitoring with Datadogalexismidon Datadog is a monitoring service that helps scale monitoring through pre-canned tools like integrations and dashboards, templated dashboards that can be reused across environments, and a powerful API. The API allows monitoring to be coded and integrated with provisioning tools like CloudFormation, version controlled, and tracked like any other code. This improves monitoring by bringing development practices like testing, versioning, and avoiding duplication to monitoring configuration and resources.
Netflix Open Source: Building a Distributed and Automated Open Source Program
Netflix Open Source: Building a Distributed and Automated Open Source Programaspyker Netflix has been using and contributing to open source for several years. Over the years, Netflix has released over one hundred Netflix Open Source (aka NetflixOSS) libraries, servers, and technologies. Netflix engineers benefit by accepting contributions and gathering feedback with key collaborators around the world. Users of NetflixOSS from many industries benefit from our solutions including Big Data, Build and Delivery Tools, Runtime Services and Libraries, Data Persistence, Insight, Reliability and Performance, Security and User Interface. With such a large and mature open source program, Netflix has worked on approaches and tools that help manage and improve the NetflixOSS source offerings and communities. Netflix has taken a different approach to building support for open source as compared to other Internet scale companies. Come to this session to learn about the unique approaches Netflix has taken to both distribute and automate the responsibilities of building a world-class open source program.
Securing Databases with Dynamic Credentials and HashiCorp Vault
Securing Databases with Dynamic Credentials and HashiCorp VaultMitchell Pronschinske Dynamic credentials and secrets—meaning credentials that are automatically rotated over a reasonable period of time—are crucial to a strong security posture. Without them, an attacker could move around in your network for months or years with valid credentials.
Frequently rotating credentials can be a major hassle, but HashiCorp Vault is changing that. In this solutions engineering hangout session, Thomas Kula, an SE at HashiCorp will demo how to use Vault to deliver dynamic database credentials in an easy, automated manner.
20140708 - Jeremy Edberg: How Netflix Delivers Software
20140708 - Jeremy Edberg: How Netflix Delivers SoftwareDevOps Chicago Netflix delivers software through fully automated processes and a service-oriented architecture. They hire responsible developers and give them freedom and responsibility. Netflix builds everything to withstand failures through redundancy, automation, and a philosophy of "automate all the things."
Testing at Stream-Scale
Testing at Stream-ScaleAll Things Open This document discusses testing strategies for data pipelines at scale. It recommends (1) communicating a testing strategy, (2) removing barriers to testing, (3) pursuing great staging environments, and (4) continuous end-to-end testing using a tool called Kafka Detective. Kafka Detective enables end-to-end testing by comparing data between staging and production Kafka topics and reporting any differences. The author details how Kafka Detective has found real issues in their pipelines and shares its features and roadmap for supporting more use cases.
The Art of Decomposing Monoliths - Kfir Bloch, Wix
The Art of Decomposing Monoliths - Kfir Bloch, WixCodemotion Tel Aviv Kfir Bloch discusses considerations for decomposing monolithic applications into microservices at Wix. He outlines four main reasons for decomposing: 1) to isolate resources for high availability, 2) to support different release cycles, 3) to reuse and share logic, and 4) to have single team responsibility over services. Bloch also discusses mitigations for challenges like partial deployments and increased failure points. He emphasizes starting the decomposition gradually and monitoring services from the beginning.
Migrating big data
Migrating big datalauraxthomson The document summarizes Mozilla's migration of its Socorro crash analysis system from its original infrastructure to a new architecture. It describes Socorro and its purpose of analyzing crash data. It then discusses the rationale for migrating to improve stability, the planning process, building out the new infrastructure with automation and configuration management, load testing the new system, troubleshooting issues during the migration, and lessons learned from the process.
Pivoting Spring XD to Spring Cloud Data Flow with Sabby Anandan
Pivoting Spring XD to Spring Cloud Data Flow with Sabby AnandanPivotalOpenSourceHub Pivoting Spring XD to Spring Cloud Data Flow: A microservice based architecture for stream processing
Microservice based architectures are not just for distributed web applications! They are also a powerful approach for creating distributed stream processing applications. Spring Cloud Data Flow enables you to create and orchestrate standalone executable applications that communicate over messaging middleware such as Kafka and RabbitMQ that when run together, form a distributed stream processing application. This allows you to scale, version and operationalize stream processing applications following microservice based patterns and practices on a variety of runtime platforms such as Cloud Foundry, Apache YARN and others.
About Sabby Anandan
Sabby Anandan is a Product Manager at Pivotal. Sabby is focused on building products that eliminate the barriers between application development, cloud, and big data.
The inherent complexity of stream processing
The inherent complexity of stream processingnathanmarz The document discusses approaches for computing unique visitors to web pages over time ranges while dealing with changing user ID mappings.
Initially, three approaches are presented using a key-value store: storing user IDs in sets indexed by URL and hour bucket (Approach 1), using HyperLogLogs for more efficient storage (Approach 2), and storing at multiple granularities to reduce lookups (Approach 3).
The problem is made harder by the presence of "equiv" records that map one user ID to another. Later approaches try to incrementally normalize user IDs, sample user IDs, or maintain separate indexes.
Ultimately, a hybrid approach is proposed using batch computation over the entire dataset to build robust indexes,
Monitoring Big Data Systems Done "The Simple Way" - Demi Ben-Ari - Codemotion...
Monitoring Big Data Systems Done "The Simple Way" - Demi Ben-Ari - Codemotion...Codemotion Once you start working with Big Data systems, you discover a whole bunch of problems you won’t find in monolithic systems. Monitoring all of the components becomes a big data problem itself. In the talk, we’ll mention all of the aspects that you should take into consideration when monitoring a distributed system using tools like Web Services, Spark, Cassandra, MongoDB, AWS. Not only the tools, what should you monitor about the actual data that flows in the system? We’ll cover the simplest solution with your day to day open source tools, the surprising thing, that it comes not from an Ops Guy.
Winston - Netflix's event driven auto remediation and diagnostics tool
Winston - Netflix's event driven auto remediation and diagnostics toolVinay Shah This was a slide deck on Winston presented at a meetup on auto remediation and diagnostics: https://www.meetup.com/Auto-Remediation-and-Event-Driven-Automation/events/234628846/
Container orchestration: the cold war - Giulio De Donato - Codemotion Rome 2017
Container orchestration: the cold war - Giulio De Donato - Codemotion Rome 2017Codemotion L’ecosistema degli orchestratori di container è in rapido movimento, una galassia di piattaforme e framework. Come si fa a scegliere quello giusto per le vostre esigenze? Vediamo tutti gli orchestratori in commercio, con i loro pro e contro: DC/OS, Kubernetes, Docker e anche quelli meno famosi ma saranno promesse, e anche le dinamiche e le scelte fatte.
Python & Cassandra - Best Friends
Python & Cassandra - Best FriendsJon Haddad This document discusses the benefits of using Python and Cassandra together. It provides an overview of using virtual environments in Python to isolate projects. It also summarizes the Python driver for Cassandra, which allows connecting to Cassandra clusters and executing queries, and cqlengine, an object mapper that simplifies working with Cassandra from Python.
Open Source Monitoring Tools Shootout
Open Source Monitoring Tools Shootouttomdc The Open source market is getting overcrowded with different Network monitoring solutions, and not without reason, monitoring your infrastructure become more important each day, you have to know what's going on for your boss, your customers and for yourself. Nagios started the evolution, but today OpenNMS, Zabix, Zenoss, Groundworks, Hyperic and different others are showing up in the market. Do you want lightweight, or feature full, how far do you want to go with your monitoring, just on os level, or do you want to dig into your applications, do you want to know how many query per seconds your MySQL database is serving, or do you want to know about the internal state of your JBoss, or be triggered if the OOM killer will start working soon. This presentation will guide the audience trough the different alternatives, based on our experiences in the field. We will be looking both at alerting and trending and how easy or difficult it is to deploy such an environment.
Cassandra Day Denver 2014: Setting up a DataStax Enterprise Instance on Micro...
Cassandra Day Denver 2014: Setting up a DataStax Enterprise Instance on Micro...DataStax Academy Speaker: Joey Filichia, Business Intelligence Consultant
There are many options for Cloud Providers, but according to the Gartner Magic Quadrant 2014 for IaaS Solutions, Amazon AWS and Microsoft Azure are both leaders and visionaries. DataStax provides instructions for provisioning an Amazon Machine Image. This discussion will provide guidance on setting up a single-node DataStax Enterprise cluster using an Ubuntu 14.04 Server and a Windows Azure Virtual Machine. Using the DataStax Enterprise production installation in text mode, we will install DSE end to end during the presentation.
Advanced A/B Testing at Wix - Aviran Mordo and Sagy Rozman, Wix.com
Advanced A/B Testing at Wix - Aviran Mordo and Sagy Rozman, Wix.comDevOpsDays Tel Aviv While A/B test is a very known and familiar methodology for conducting experiments on production when you do that on a large scale it has many challenges in the organization level and operational level.
At Wix we are practicing continuous delivery for over 4 years. Conducting A/B tests and writing feature toggles is at the core of our development process. However when doing so on a large scale, with over 1000 experiments every month, it holds many challenges and affect everyone in the company, from developers, product managers, QA, marketing and management.
In this talk we will explain what is the lifecycle of an experiment, some of the challenges we faced and the effect on our development process.
* How an experiment begins its life
* How an experiment is defined
* How do you let non technical people control the experiment while preventing mistakes
* How an experiment go live, what is the lifecycle of an experiment from beginning to end
* What is the difference between client and server experiments
* How do you keep the user experience and not confuse them
* How does it affect the development process
* How can QA test an environment that changes every 9 minutes
* How can support help users when every user may be part of different experiment
* How can we find if an experiment is causing errors when you have millions of permutations [at least 2^(number of active experiments)]
* What are the effects of always having multiple experiments on system architecture
* What are the development patterns when working with AB test
At Wix we have developed our 3rd generation experiment system called PETRI, which is (will be) open sourced, that helps us maintain some order in a chaotic system that keep changing. We will also explain how PETRI works, what are the patterns in conducting experiments that will have a minimal effect on performance and user experience.
Webinar Slides: Real time Recommendations with Redis, Java and Websockets
Webinar Slides: Real time Recommendations with Redis, Java and WebsocketsRedis Labs WebSockets connect the browser to your app server. But what if the processing happens on some other server? In that case you need to connect the worker process to the app process via a messaging system. After experimenting with RabbitMQ, we settled on Redis as a great pub sub and a caching system.
In this webinar you will learn:
* How to use Java, Spring, and Redis ( spring-websockets and spring-data-redis) to power a real time recommendations system
* How many users are currently using your system in real time
KubeSecOps
KubeSecOpsKarthik Gaekwad Karthik Gaekwad gave a presentation on securing Kubernetes clusters. He discussed reducing the attack surface by hardening hosts, using official container images with specific versions, limiting privileges, and periodically checking for vulnerabilities. He explained how Kubernetes features like TLS, authentication, authorization, auditing, network policies and pod security policies can help. Open source tools like Clair, Kube-bench, Kubesec and Kubeaudit were presented to analyze vulnerabilities and check configuration best practices. The overall message was to take a layered approach to security using the platform capabilities and tooling available.
Serverless in production, an experience report (codemotion milan)
Serverless in production, an experience report (codemotion milan)Yan Cui This document provides guidance and best practices for deploying AWS Lambda functions to production environments. It discusses principles for deployment such as having zero downtime and independent, loosely coupled features. It also covers practices for testing, monitoring, logging, configuration management and optimizing Lambda performance. Testing practices include unit, integration and acceptance tests. Metrics and logs should be centralized and made searchable. Distributed tracing helps identify issues between functions. Configuration changes should be propagated easily. Cold starts can be avoided through techniques like health checks and state caching.
Viewers also liked (17)
I <3 graphs in 20 slides
I <3 graphs in 20 slidesDatadog The document discusses the author's interest in graphs and how they began exploring graphs after receiving an email. It then mentions Redis, memory, and alerts, along with a quote about wanting to see a graph. The rest of the document contains log messages about saving in the background being unable to allocate memory at first, but then succeeding. It emphasizes how graphs allow for correlation and joy, whereas without them there is no correlation or joy.
Alerting: more signal, less noise, less pain
Alerting: more signal, less noise, less painDatadog Is this talk for me?
✓I am or will be on-call
✓I don’t like being alerted
✓I want the pain to go away
The next 40 minutes
1. Alerts == pain?
2. Measure alerts
3. Concrete (& fun) steps
Learn more about Datadog's infrastructure monitoring as a service at https://www.datadoghq.com.
Monitoring MySQL at scale
Monitoring MySQL at scaleOvais Tariq This document discusses monitoring MySQL databases at scale. It begins with background on Lithium Technologies and their MySQL architecture. It then covers the challenges of monitoring in dynamic environments, monitoring 101 theory, and a real incident triage at Lithium. Key points discussed include the need for automation, metrics collection from all layers, and sharing knowledge. Monitoring hundreds or thousands of MySQL instances requires collecting 350+ metrics from each to gain necessary insights.
Treating Infrastructure as Garbage
Treating Infrastructure as GarbageDatadog In this presentation, Mike walks through the philosophical shift of treating the servers that you have in-house as if they were part of a “cloud” and disposable, and then jumps into a technical demonstration of how to actually tear down and reconstruct your infrastructure at a moment’s notice.
Fact based monitoring
Fact based monitoringDatadog This document discusses moving from host-centric monitoring to fact-based monitoring using Puppet facts. It argues that hosts should not be the center of the monitoring universe, but rather facts should be. Effective monitoring uses queries against existing facts and metrics to express conditions like ensuring web servers respond quickly or PostgreSQL processes are running. This mirrors how Puppet, SQL, and MCollective improved systems management by moving from imperative programming to declarative queries based on available facts and metadata.
Deep dive into Nagios analytics
Deep dive into Nagios analyticsDatadog Performance metrics + Nagios traffic + other sources + Datadog in the cloud = real time graphs + analytics
DevOps, continuous delivery, & the new composable enterprise
DevOps, continuous delivery, & the new composable enterpriseDonnie Berkholz DevOps focuses on tearing down silos between development and operations teams through practices like continuous integration, delivery, and deployment. This allows organizations to deliver new features and updates more frequently while minimizing risk. It also promotes treating infrastructure as code and using automation. DevOps has been widely adopted by technology companies and is beginning to spread to other industries. It helps organizations improve profitability, market share, and productivity through higher performing systems that can quickly adapt to change.
Big (IT) data
Big (IT) dataDatadog This document summarizes how information technology (IT) infrastructure and operations have changed from expensive and slow on-premise systems to cheaper and faster cloud-based systems. It notes that IT used to require renting and maintaining thousands of servers, but now services allow provisioning servers quickly and returning them just as fast. Where systems used to support small numbers of users, they now must scale to massive "web scale." Tool usage has proliferated from using just a few tools to manage dependencies to using many different monitoring and analytics tools. Delivery cycles have accelerated from biannual releases to continuous delivery. It promotes a next-generation monitoring solution to help development and operations teams address these modern cloud-era challenges through data aggregation, correlation, collaboration
Monitoring Docker at Scale - Docker San Francisco Meetup - August 11, 2015
Monitoring Docker at Scale - Docker San Francisco Meetup - August 11, 2015Datadog In this session I showed building a multi-container app from beginning to end, using Docker, Docker-Machine, Docker-Compose and everything in between. You can even try it out yourself using the link in the deck to a repo on GitHub.
Events and metrics the Lifeblood of Webops
Events and metrics the Lifeblood of WebopsDatadog This document summarizes a presentation about using events and metrics to manage web operations. It discusses how the presenter's company Datadog aggregates and correlates metrics and events data from multiple sources to provide visibility and insights for developers and operations teams. It describes some of the challenges of dealing with large and diverse data streams. It also covers some of the tradeoffs and techniques for managing infrastructure in both on-premise and cloud environments, particularly around networking, storage, and scaling of compute and data resources.
Making Cassandra Perform as a Time Series Database - Cassandra Summit 15
Making Cassandra Perform as a Time Series Database - Cassandra Summit 15SignalFx SignalFx engineer Paul Ingram presented these slides at Cassandra Summit 2015.
SignalFx ingests, processes runs analytics against, (and ultimately stores) massive numbers of time series streaming in parallel into our service which provides an analytics-based monitoring platform for modern applications.
We've chose to build our time series database (TSDB) on Cassandra for it's read and write performance at high load. This presentation will go over our evolution of optimizations to squeeze the most performance out of the TSDB to date and some steps we'll be taking in the future.
Read more: http://blog.signalfx.com/making-cassandra-perform-as-a-tsdb
Customer Ops: DevOps <3 customer support
Customer Ops: DevOps <3 customer supportDatadog This document summarizes a presentation about how DevOps engineers at Datadog provide customer support. Some key points discussed include:
- Datadog got customers through word-of-mouth due to the quality of their product and support provided by DevOps engineers.
- Datadog treats customers like they treat themselves by answering all questions thoroughly and making sure issues are fully resolved.
- Engineers spend a week at a time helping with customer support to continuously learn.
- Datadog uses a variety of tools like IRC, email, in-app chat, and social media to engage with customers and share information.
- Metrics like response time, resolution time, and channel volume are analyzed monthly to improve support.
Effective monitoring with StatsD
Effective monitoring with StatsDDatadog Best practices for monitoring your IT infrastructure using StatsD. Find dashboard examples here: https://p.datadoghq.com/sb/9b246c4ade
Monitor StatsD easily with Datadog. Learn more at https://www.datadoghq.com
Monitoring Docker containers - Docker NYC Feb 2015
Monitoring Docker containers - Docker NYC Feb 2015Datadog Alexis goals this presentation are three-fold:
1) Dive into key Docker metrics
2) Explain operational complexity. In other words I want to take what we have seen on the field and show you where the pain points will be.
3) Rethink monitoring of Docker containers. The old tricks won’t work.
Monitoring NGINX (plus): key metrics and how-to
Monitoring NGINX (plus): key metrics and how-toDatadog NGINX just works and that's why we use it. That does not mean that it should be left unmonitored. As a web server, it plays a central role in a modern infrastructure. As a gatekeeper, it sees every interaction with the application. If you monitor it properly it can explain a lot about what is happening in the rest of your infrastructure.
In this talk you will learn more about NGINX (plus) metrics, what they mean and how to use them. You will also learn different methods (status, statsd, logs) to monitor NGINX with their pros and cons, illustrated with real data coming from real servers.
PyData NYC 2015 - Automatically Detecting Outliers with Datadog 
PyData NYC 2015 - Automatically Detecting Outliers with Datadog Datadog Monitoring even a modestly-sized systems infrastructure quickly becomes untenable without automated alerting. For many metrics it is nontrivial to define ahead of time what constitutes “normal” versus “abnormal” values. This is especially true for metrics whose baseline value fluctuates over time. To make this problem more tractable, Datadog provides outlier detection functionality to automatically identify any host (or group of hosts) that is behaving abnormally compared to its peers.
These slides cover the algorithms we use for outlier detection, and show how easy they are to implement using Python. This presentation also covers the lessons we've learned from using outlier detection on our own systems, along with some real-life examples on how to avoid false positives and negatives.
Learn more at www.datadoghq.com.
How to measure everything - a million metrics per second with minimal develop...
How to measure everything - a million metrics per second with minimal develop...Jos Boumans Krux is an infrastructure provider for many of the websites you
use online today, like NYTimes.com, WSJ.com, Wikia and NBCU. For
every request on those properties, Krux will get one or more as
well. We grew from zero traffic to several billion requests per
day in the span of 2 years, and we did so exclusively in AWS.
To make the right decisions in such a volatile environment, we
knew that data is everything; without it, you can't possibly make
informed decisions. However, collecting it efficiently, at scale,
at minimal cost and without burdening developers is a tremendous
challenge.
Join me in this session to learn how we overcame this challenge
at Krux; I will share with you the details of how we set up our
global infrastructure, entirely managed by Puppet, to capture over
a million data points every second on virtually every part of the
system, including inside the web server, user apps and Puppet itself,
for under $2000/month using off the shelf Open Source software and
some code we've released as Open Source ourselves. In addition, I’ll
show you how you can take (a subset of) these metrics and send them
to advanced analytics and alerting tools like Circonus or Zabbix.
This content will be applicable for anyone collecting or desiring to
collect vast amounts of metrics in a cloud or datacenter setting and
making sense of them.
Ad
Similar to Just enough web ops for web developers (20)
Data-Driven DevOps: Mining Machine Data for 'Metrics that Matter' in a DevOps...
Data-Driven DevOps: Mining Machine Data for 'Metrics that Matter' in a DevOps...Splunk IT organizations are increasingly using machine data - including in DevOps practices - to get away from 'vanity metrics' and instead to generate 'metrics that matter'. These metrics provide visibility into the delivery of new application code and the business value of DevOps, to both IT and business stakeholders.
Machine data provides DevOps teams and others - including QA, secops, CxOs and LOB leaders - with meaningful and actionable metrics. This allows stakeholders to monitor, measure, and continuously improve the velocity and quality of code throughout the software lifecycle, from dev/test to customer-facing outcomes and business impact.
In this session Andi Mann, chief technology advocate at Splunk, will share core methodologies, interesting case studies, key success factors and 'gotcha' moments from real-world experience with mining machine data to produce 'metrics that matter' in a DevOps context.
Building an Open Source AppSec Pipeline - 2015 Texas Linux Fest
Building an Open Source AppSec Pipeline - 2015 Texas Linux FestMatt Tesauro Take the ideas of DevOps and the notion of a delivery pipeline and combine them for an AppSec Pipeline. This talk covers the open source components used to create an AppSec Pipeline and the benefits we received from its implementation.
Dev ops
Dev opsEslam El Husseiny DevOps aims to bridge the gap between development and operations by fostering collaboration. Key aspects of DevOps include establishing a collaborative culture through open communication and engagement between teams, automating processes like builds, deployments, testing and system configuration, and implementing monitoring of applications and infrastructure through metrics and logging to ensure stability and enable issues to be quickly identified and addressed. Tools like Puppet, Munin, Graphite, Logstash and Graylog can help operationalize these aspects of DevOps.
Data-Driven DevOps: Improve Velocity and Quality of Software Delivery with Me...
Data-Driven DevOps: Improve Velocity and Quality of Software Delivery with Me...Splunk Much of the value of DevOps comes from a (renewed) focus on measurement, sharing, and continuous feedback loops. In increasingly complex DevOps workflows and environments, and especially in larger, regulated, or more crystallized organizations, these core concepts become even more critical.
This session will show how, by focusing on 'metrics that matter,' you can provide objective, transparent, and meaningful feedback on DevOps processes to all stakeholders. Learn from real-life examples how to use the data generated throughout application delivery to continuously identify, measure, and improve deployment speed, code quality, process efficiency, outsourcing value, security coverage, audit success, customer satisfaction, and business alignment.
Continuous Deployment
Continuous DeploymentBrian Henerey Continuous Deployment involves shipping code as frequently as possible, even multiple times per day. It allows for smaller changes with less risk, faster feedback, and a competitive advantage. To achieve this, companies optimize their deployment process, automate testing and deployments, and measure everything to learn and improve continuously. This approach is enabled by technologies like cloud computing and embraced by companies like Google, Amazon, and Facebook.
Taking AppSec to 11 - BSides Austin 2016
Taking AppSec to 11 - BSides Austin 2016Matt Tesauro This document summarizes Matt Tesauro's presentation "Taking AppSec to 11" given at Bsidess Austin 2016. The presentation discusses implementing application security (AppSec) pipelines to improve workflows and optimize critical resources like AppSec personnel. Key points include automating repetitive tasks, driving consistency, increasing visibility and metrics, and reducing friction between development and AppSec teams. An AppSec pipeline provides a reusable and consistent process for security activities to follow through intake, testing, and reporting stages. The goal is to optimize people's time spent on customization and analysis rather than setup and configuration.
OSSF 2018 - Brandon Jung of GitLab - Is Your DevOps 'Tool Tax' Weighing You D...
OSSF 2018 - Brandon Jung of GitLab - Is Your DevOps 'Tool Tax' Weighing You D...FINOS The document discusses how a single application that handles the entire software development lifecycle can help alleviate the "DevOps tool tax" caused by managing and integrating multiple point solutions. It provides an overview of GitLab's Auto DevOps feature which automates the build, test, security, deployment, and monitoring pipelines in a single system. By consolidating tools and processes, Auto DevOps helps reduce integration complexity and accelerate development cycles.
Taking AppSec to 11: AppSec Pipeline, DevOps and Making Things Better
Taking AppSec to 11: AppSec Pipeline, DevOps and Making Things BetterMatt Tesauro This document summarizes Matt Tesauro's presentation on improving application security (AppSec) through the use of AppSec pipelines and DevOps strategies. The key points are:
1. AppSec pipelines are designed to optimize AppSec personnel by automating tasks and increasing consistency, tracking, flow and visibility of work. This allows AppSec teams to focus on custom work rather than setup.
2. Integrating AppSec tools and workflows into development pipelines can help drive up consistency, reduce friction with developers, and increase the number of assessments an AppSec team can complete without increasing headcount.
3. Continual experimentation and optimizing the critical resource - in this case AppSec personnel - is important for
What is going on?
Application Diagnostics on Azure - Copenhagen .NET User Group
What is going on?
Application Diagnostics on Azure - Copenhagen .NET User GroupMaarten Balliauw
We all like building and deploying cloud applications. But what happens once that’s done? How do we know if our application behaves like we expect it to behave? Of course, logging! But how do we get that data off of our machines? How do we sift through a bunch of seemingly meaningless diagnostics? In this session, we’ll look at how we can keep track of our Azure application using structured logging, AppInsights and AppInsights analytics to make all that data more meaningful.
Observability foundations in dynamically evolving architectures
Observability foundations in dynamically evolving architecturesBoyan Dimitrov Holistic application health monitoring, request tracing across distributed systems, instrumentation, business process SLAs - all of them are integral parts of today’s technical stacks. Nevertheless many teams decide to integrate observability last which makes it an almost impossible challenge - especially if you have to deal with hundreds and thousands of services. Therefore starting early is essential and in this talk we are going to see how we can solve those challenges early and explore the foundations of building and evolving complex microservices platforms in respect to observability.
We are going to share some of the best practices and quick wins that allow us to correlate different telemetry systems and gradually build up towards more sophisticated use-cases.
We are also going to look at some of the standard AWS services such as X-Ray and Cloudwatch that help us get going "for free" and then discuss more complex tooling and integrations building up towards a fully integrated ecosystem. As part of this talk we are also going to share some of the learnings we have made at Sixt on this topic and we are going to introduce some of the solutions that help us operate our microservices stack
Innovate Better Through Machine data Analytics
Innovate Better Through Machine data AnalyticsHal Rottenberg This talk was presented at IP Expo Manchester in May, 2016. the themes discussed are:
- how does machine data relate to devops?
- how can tracking this data lead to better outcomes?
- what types of data are important to track?
Learn to see, measure and automate with value stream management
Learn to see, measure and automate with value stream managementLance Knight This document discusses using value stream management to see, measure, and automate software delivery processes. It begins by explaining that traditional value stream maps can physically show material and information flows, but software delivery value streams are less tangible. The presentation then demonstrates how to map different flows in a software value stream, including request, development, and operations flows. It also discusses the importance of measuring key metrics in each flow in order to identify improvement opportunities. Finally, it explains how applying lean principles like reducing waste and creating flow can help optimize the software delivery value stream to improve outcomes like quality, speed, and productivity.
The Magic Of Application Lifecycle Management In Vs Public
The Magic Of Application Lifecycle Management In Vs PublicDavid Solivan The document discusses challenges with software development projects and how tools from Microsoft can help address these challenges. It notes that most projects fail or are over budget and challenges include poor requirements gathering and testing. However, tools like Visual Studio and Team Foundation Server that integrate requirements, work tracking, source control, testing and other functions can help make successful projects more possible by facilitating team collaboration. The document outlines features of these tools and how they aim to make application lifecycle management a routine part of development.
TrailblazerDX Motihari.pptx
TrailblazerDX Motihari.pptxOm Prakash This document summarizes an agenda for a Salesforce Developer Group meetup in Motihari, India. The agenda includes beginner sessions on Salesforce topics, highlights from the TrailblazerDX conference, career guidance questions and answers, highlights for Summer '22, and time for lunch, photos, fun and networking. Guest speakers will provide trailblazer talks on their Salesforce careers. The goal is to inspire and educate attendees on Salesforce development.
Thinking DevOps in the era of the Cloud - Demi Ben-Ari
Thinking DevOps in the era of the Cloud - Demi Ben-AriDemi Ben-Ari The lines between Development and Operations people have gotten blurry and lots of skills needs to be held by both sides.
In the talk we'll talk about all of the considerations that are needed to be taken when creating a development and production environment, mentioning Continuous Integration, Continuous Deployment and the Buzzword "DevOps", also talking about some real implementations in the industry.
Of course how can we leave out the real enabler of the whole deal,
"The Cloud", Giving us a tool set that makes life much easier when implementing all of these practices.
Build a complete security operations and compliance program using a graph dat...
Build a complete security operations and compliance program using a graph dat...Erkang Zheng Attackers think in graphs; defenders operate with lists. That’s why attackers win.
What if we could have a graph-based, data-driven security and compliance platform that can:
· intelligently analyze my environment,
· automatically keep up with the constant changes,
· help us understand and navigate that complexity, and
· manage compliance in a data-driven, continuous way.
This presentation describes how my security team built our security operations and automate compliance evidence collection using a graph database. There are also actual screenshots from the JupiterOne platform showing the discovery of thousands of assets from connected AWS accounts and other cloud providers; the configuration analysis of these resources; the query and search with graphs to visualize the relevant relationships; as well as the alerts, findings, and compliance mapping. All without the need for additional 3rd party solutions.
From Monoliths to Microservices at Realestate.com.au
From Monoliths to Microservices at Realestate.com.auevanbottcher Presented by Jon Eaves (REA), Beth Skurrie (Dius) and Evan Bottcher (ThoughtWorks) at Yow! conference December 2014.
Improve your productivity with Microsoft Fow - Power to the people
Improve your productivity with Microsoft Fow - Power to the peopleserge luca This document discusses Microsoft Flow and how it can be used to boost productivity. It provides an overview of creating and managing flows in Flow, using templates, and approval escalation workflows. The document also covers limitations, how Flow can interact with on-premises data using the data gateway, extensibility options, pricing plans, and the roadmap for future enhancements. Key highlights include expanded SharePoint integration, improved approvals functionality, and leveraging other Microsoft services like PowerApps and Power BI.
Performance monitoring in a DevOps World
Performance monitoring in a DevOps WorldSolidify Wouldn’t it be good to know how your application or service is being used and is performing while its running live? It is essential to have more insights into the running application as the cycle time for delivering new features and releases speed up. We will cover how to detect, triage and diagnose different scenarios and provide the necessary input to quickly and correctly act to resolve situations. The focus is on web applications or services running on-premise or hosted in the cloud.
An Architecture for Agile Machine Learning in Real-Time Applications
An Architecture for Agile Machine Learning in Real-Time ApplicationsJohann Schleier-Smith Presented at KDD, August 11, 2015.
Abstract of the paper:
Machine learning techniques have proved effective in recommender systems and other applications, yet teams working to deploy them lack many of the advantages that those in more established software disciplines today take for granted. The well-known Agile methodology advances projects in a chain of rapid development cycles, with subsequent steps often informed by production experiments. Support for such workflow in machine learning applications remains primitive.
The platform developed at if(we) embodies a specific machine learning approach and a rigorous data architecture constraint, so allowing teams to work in rapid iterative cycles. We require models to consume data from a time-ordered event history, and we focus on facilitating creative feature engineering. We make it practical for data scientists to use the same model code in development and in production deployment, and make it practical for them to collaborate on complex models.
We deliver real-time recommendations at scale, returning top results from among 10,000,000 candidates with sub-second response times and incorporating new updates in just a few seconds. Using the approach and architecture described here, our team can routinely go from ideas for new models to production-validated results within two weeks.
Ad
More from Datadog (13)
What it Means to be a Next-Generation Managed Service Provider
What it Means to be a Next-Generation Managed Service ProviderDatadog - The webinar will last 60 minutes with Q&A at the end. Questions should be asked via the chat panel and participants should keep their lines muted. The webinar will be recorded.
- John Gray from Datadog, Thomas Robinson from AWS, and Patrick Hannah from CloudHesive will present on monitoring tools and strategies across cloud infrastructure and the AWS Managed Service Provider program.
- Next-generation managed service providers need comprehensive monitoring across customers' infrastructure to quickly resolve issues, improve efficiency, and provide value. Tools like Datadog allow for unified monitoring across platforms and environments.
Monitoring kubernetes across data center and cloud
Monitoring kubernetes across data center and cloudDatadog This document summarizes a presentation about monitoring Kubernetes clusters across data centers and cloud platforms using Datadog. It discusses how Kubernetes provides container-centric infrastructure and flexibility for hybrid cloud deployments. It also describes how monitoring works in Google Container Engine using cAdvisor, Heapster, and Stackdriver. Finally, it discusses how Datadog and Tectonic can be used to extend Kubernetes monitoring capabilities for enterprises.
Datadog + VictorOps Webinar
Datadog + VictorOps WebinarDatadog A granular look into The Do's and Don't of Post Incident Analysis, featuring Jason Hand - DevOps Evangelist - from VictorOps and Jason Yee - Technical Writer/Evangelist - from Datadog.
Topics include a breakdown of the process in the following order:
- Service disruptions
- Detection
- Diagnosis
- Post-incident analysis
- Framework
Dataday Texas 2016 - Datadog
Dataday Texas 2016 - DatadogDatadog Data scientist Homin Lee talks about automatically detecing infrastructure anomalies and outliers in real-time with Datadog at Dataday Texas 2016.
Running & Monitoring Docker at Scale
Running & Monitoring Docker at ScaleDatadog Containerization (à la Docker) is increasing the elastic nature of cloud infrastructure by an order of magnitude. If you have adopted Docker, or are considering it, you are probably facing questions like:
- How many containers can you run on a given Amazon EC2 instance type?
- Which metric should you look at to measure contention?
- How do you manage fleets of containers at scale?
Datadog’s CTO, Alexis Lê-Quôc, presents the challenges and benefits of running Docker containers at scale. Alexis explains how to use quantitative performance patterns to monitor your infrastructure at the new level of magnitude and increased complexity introduced by containerization.
Fact-Based Monitoring
Fact-Based MonitoringDatadog Your configuration management is fact-based.
Your orchestration is fact-based.
Is your monitoring fact-based?
What does that even mean? Monitoring is very similar to configuration, at least in its expression. Configuration cares about files, services, and hosts being present and in a certain state (""nginx should be running with the following configuration""). Monitoring cares about services being present, running, and in a certain state. Both describe your infrastructure as it should be (""nginx should be running and respond in less than 200ms"").
Fact-based monitoring is about being able to control monitoring with the same facts that Puppet uses (""monitor nginx latency wherever Puppet says it should run""). This is in contrast with imperative monitoring (""monitor nginx on host a, b and c"") that gets out of sync and leads to mailbox meltdowns from spurious alerts.
Using open source and commercial examples, this talk will help you express your monitoring in a way that will feel very natural to your Puppet configuration.
What’s in this Cookbook? - Mike Fiedler
What’s in this Cookbook? - Mike FiedlerDatadog The document discusses versioning policies for Chef cookbooks. It introduces the Cookbook Versioning Policy (CVP) which provides guidelines for assigning version numbers to cookbooks based on the type and impact of changes. Major versions are for breaking changes, minor versions are for adding non-breaking features, and patch versions are for fixing bugs. The CVP aims to prevent breaking changes from surprising users and encourage transparent and consistent versioning practices.
I Love Graphs - Alexis Lê-Quôc
I Love Graphs - Alexis Lê-QuôcDatadog The document discusses the author's experience opening their email to find alerts about memory issues with Redis, leaving them wanting graphs but unable to generate them due to memory constraints. It then briefly mentions graphs, correlation, joy, and a monkey portrait exhibition without further context.
Virtualization at Gilt - Rangarajan Radhakrishnan
Virtualization at Gilt - Rangarajan RadhakrishnanDatadog Gilt uses virtualization including LXC containers and CloudStack to improve efficiency and reliability. They aim to automate provisioning, use immutable containers, and avoid repeated config enforcement. Currently they use LXC containers provisioned through CloudStack and their in-house Galactica system, which integrates with services like Puppet, LDAP, DNS and load balancers. They are testing provisioning LXC containers on different Linux distros and configurations to optimize performance.
Why Puppet Sucks - Rob Terhaar
Why Puppet Sucks - Rob TerhaarDatadog This document outlines several complaints about the configuration management tool Puppet. It argues that Puppet's DSL is not really a programming language and tries to do too much. It also complains that writing custom types and providers, sharing modules, code reuse, and writing portable modules are all too difficult in Puppet. The document further complains about the quality of some modules in Puppet's module forge and the lack of a module versioning standard. It concludes by complaining about the difficulty of orchestration and managing controlled state changes with Puppet.
Welcome to a Computing Revolution - Alex Lesser
Welcome to a Computing Revolution - Alex LesserDatadog Alex talks about the evolution of PSSC from his parent’s garage into a tier one high performance computing manufacturer.
Cosa Nostra - Tom Santero
Cosa Nostra - Tom SanteroDatadog The document discusses various aspects of working in the technology industry including enjoying one's job, the importance of continuous education, and attending conferences and meetups. It notes that many companies have taken venture capital investment and that this can lead to four possible outcomes - becoming cash flow positive, an initial public offering, acquisition, or bankruptcy. It also discusses several cognitive biases like fundamental attribution error and confirmation bias that can impact work in this industry. Overall it presents both positives and challenges of working in technology.
Bulk Exporting from Cassandra - Carlo Cabanilla
Bulk Exporting from Cassandra - Carlo CabanillaDatadog This document discusses various methods for bulk exporting data from Cassandra databases including taking snapshots of sstables and converting them to JSON or CSV formats. It recommends using tools like sstable2json, sstable2csv, and ionice to reduce load on live clusters during export. The document also provides suggestions for storing the exported data such as on EBS volumes or S3 using tools like S3cmd, and methods for deduplicating the data including using Hadoop. File formats and naming conventions are suggested for storage as well.
Recently uploaded (20)
Rusty Waters: Elevating Lakehouses Beyond Spark
Rusty Waters: Elevating Lakehouses Beyond Sparkcarlyakerly1 Spark is a powerhouse for large datasets, but when it comes to smaller data workloads, its overhead can sometimes slow things down. What if you could achieve high performance and efficiency without the need for Spark?
At S&P Global Commodity Insights, having a complete view of global energy and commodities markets enables customers to make data-driven decisions with confidence and create long-term, sustainable value. 🌍
Explore delta-rs + CDC and how these open-source innovations power lightweight, high-performance data applications beyond Spark! 🚀
Andrew Marnell: Transforming Business Strategy Through Data-Driven Insights
Andrew Marnell: Transforming Business Strategy Through Data-Driven InsightsAndrew Marnell With expertise in data architecture, performance tracking, and revenue forecasting, Andrew Marnell plays a vital role in aligning business strategies with data insights. Andrew Marnell’s ability to lead cross-functional teams ensures businesses achieve sustainable growth and operational excellence.
Transcript: #StandardsGoals for 2025: Standards & certification roundup - Tec...
Transcript: #StandardsGoals for 2025: Standards & certification roundup - Tec...BookNet Canada Book industry standards are evolving rapidly. In the first part of this session, we’ll share an overview of key developments from 2024 and the early months of 2025. Then, BookNet’s resident standards expert, Tom Richardson, and CEO, Lauren Stewart, have a forward-looking conversation about what’s next.
Link to recording, presentation slides, and accompanying resource: https://bnctechforum.ca/sessions/standardsgoals-for-2025-standards-certification-roundup/
Presented by BookNet Canada on May 6, 2025 with support from the Department of Canadian Heritage.
Noah Loul Shares 5 Steps to Implement AI Agents for Maximum Business Efficien...
Noah Loul Shares 5 Steps to Implement AI Agents for Maximum Business Efficien...Noah Loul Artificial intelligence is changing how businesses operate. Companies are using AI agents to automate tasks, reduce time spent on repetitive work, and focus more on high-value activities. Noah Loul, an AI strategist and entrepreneur, has helped dozens of companies streamline their operations using smart automation. He believes AI agents aren't just tools—they're workers that take on repeatable tasks so your human team can focus on what matters. If you want to reduce time waste and increase output, AI agents are the next move.
TrustArc Webinar: Consumer Expectations vs Corporate Realities on Data Broker...
TrustArc Webinar: Consumer Expectations vs Corporate Realities on Data Broker...TrustArc Most consumers believe they’re making informed decisions about their personal data—adjusting privacy settings, blocking trackers, and opting out where they can. However, our new research reveals that while awareness is high, taking meaningful action is still lacking. On the corporate side, many organizations report strong policies for managing third-party data and consumer consent yet fall short when it comes to consistency, accountability and transparency.
This session will explore the research findings from TrustArc’s Privacy Pulse Survey, examining consumer attitudes toward personal data collection and practical suggestions for corporate practices around purchasing third-party data.
Attendees will learn:
- Consumer awareness around data brokers and what consumers are doing to limit data collection
- How businesses assess third-party vendors and their consent management operations
- Where business preparedness needs improvement
- What these trends mean for the future of privacy governance and public trust
This discussion is essential for privacy, risk, and compliance professionals who want to ground their strategies in current data and prepare for what’s next in the privacy landscape.
HCL Nomad Web – Best Practices and Managing Multiuser Environments
HCL Nomad Web – Best Practices and Managing Multiuser Environmentspanagenda Webinar Recording: https://www.panagenda.com/webinars/hcl-nomad-web-best-practices-and-managing-multiuser-environments/
HCL Nomad Web is heralded as the next generation of the HCL Notes client, offering numerous advantages such as eliminating the need for packaging, distribution, and installation. Nomad Web client upgrades will be installed “automatically” in the background. This significantly reduces the administrative footprint compared to traditional HCL Notes clients. However, troubleshooting issues in Nomad Web present unique challenges compared to the Notes client.
Join Christoph and Marc as they demonstrate how to simplify the troubleshooting process in HCL Nomad Web, ensuring a smoother and more efficient user experience.
In this webinar, we will explore effective strategies for diagnosing and resolving common problems in HCL Nomad Web, including
- Accessing the console
- Locating and interpreting log files
- Accessing the data folder within the browser’s cache (using OPFS)
- Understand the difference between single- and multi-user scenarios
- Utilizing Client Clocking
Manifest Pre-Seed Update | A Humanoid OEM Deeptech In France
Manifest Pre-Seed Update | A Humanoid OEM Deeptech In Francechb3 The latest updates on Manifest's pre-seed stage progress.
Special Meetup Edition - TDX Bengaluru Meetup #52.pptx
Special Meetup Edition - TDX Bengaluru Meetup #52.pptxshyamraj55 We’re bringing the TDX energy to our community with 2 power-packed sessions:
🛠️ Workshop: MuleSoft for Agentforce
Explore the new version of our hands-on workshop featuring the latest Topic Center and API Catalog updates.
📄 Talk: Power Up Document Processing
Dive into smart automation with MuleSoft IDP, NLP, and Einstein AI for intelligent document workflows.

Vaibhav Gupta BAML: AI work flows without Hallucinations
Vaibhav Gupta BAML: AI work flows without Hallucinationsjohn409870 Shipping Agents
Vaibhav Gupta
Cofounder @ Boundary
in/vaigup
boundaryml/baml
Imagine if every API call you made
failed only 5% of the time
boundaryml/baml
Imagine if every LLM call you made
failed only 5% of the time
boundaryml/baml
Imagine if every LLM call you made
failed only 5% of the time
boundaryml/baml
Fault tolerant systems are hard
but now everything must be
fault tolerant
boundaryml/baml
We need to change how we
think about these systems
Aaron Villalpando
Cofounder @ Boundary
Boundary
Combinator
boundaryml/baml
We used to write websites like this:
boundaryml/baml
But now we do this:
boundaryml/baml
Problems web dev had:
boundaryml/baml
Problems web dev had:
Strings. Strings everywhere.
boundaryml/baml
Problems web dev had:
Strings. Strings everywhere.
State management was impossible.
boundaryml/baml
Problems web dev had:
Strings. Strings everywhere.
State management was impossible.
Dynamic components? forget about it.
boundaryml/baml
Problems web dev had:
Strings. Strings everywhere.
State management was impossible.
Dynamic components? forget about it.
Reuse components? Good luck.
boundaryml/baml
Problems web dev had:
Strings. Strings everywhere.
State management was impossible.
Dynamic components? forget about it.
Reuse components? Good luck.
Iteration loops took minutes.
boundaryml/baml
Problems web dev had:
Strings. Strings everywhere.
State management was impossible.
Dynamic components? forget about it.
Reuse components? Good luck.
Iteration loops took minutes.
Low engineering rigor
boundaryml/baml
React added engineering rigor
boundaryml/baml
The syntax we use changes how we
think about problems
boundaryml/baml
We used to write agents like this:
boundaryml/baml
Problems agents have:
boundaryml/baml
Problems agents have:
Strings. Strings everywhere.
Context management is impossible.
Changing one thing breaks another.
New models come out all the time.
Iteration loops take minutes.
boundaryml/baml
Problems agents have:
Strings. Strings everywhere.
Context management is impossible.
Changing one thing breaks another.
New models come out all the time.
Iteration loops take minutes.
Low engineering rigor
boundaryml/baml
Agents need
the expressiveness of English,
but the structure of code
F*** You, Show Me The Prompt.
boundaryml/baml
<show don’t tell>
Less prompting +
More engineering
=
Reliability +
Maintainability
BAML
Sam
Greg Antonio
Chris
turned down
openai to join
ex-founder, one
of the earliest
BAML users
MIT PhD
20+ years in
compilers
made his own
database, 400k+
youtube views
Vaibhav Gupta
in/vaigup
[email protected]
boundaryml/baml
Thank you!
Splunk Security Update | Public Sector Summit Germany 2025
Splunk Security Update | Public Sector Summit Germany 2025Splunk Splunk Security Update
Sprecher: Marcel Tanuatmadja
Are Cloud PBX Providers in India Reliable for Small Businesses (1).pdf
Are Cloud PBX Providers in India Reliable for Small Businesses (1).pdfTelecoms Supermarket Discover how reliable cloud PBX providers in India are for small businesses. Explore benefits, top vendors, and integration with modern tools.
Dev Dives: Automate and orchestrate your processes with UiPath Maestro
Dev Dives: Automate and orchestrate your processes with UiPath MaestroUiPathCommunity This session is designed to equip developers with the skills needed to build mission-critical, end-to-end processes that seamlessly orchestrate agents, people, and robots.
📕 Here's what you can expect:
- Modeling: Build end-to-end processes using BPMN.
- Implementing: Integrate agentic tasks, RPA, APIs, and advanced decisioning into processes.
- Operating: Control process instances with rewind, replay, pause, and stop functions.
- Monitoring: Use dashboards and embedded analytics for real-time insights into process instances.
This webinar is a must-attend for developers looking to enhance their agentic automation skills and orchestrate robust, mission-critical processes.
👨🏫 Speaker:
Andrei Vintila, Principal Product Manager @UiPath
This session streamed live on April 29, 2025, 16:00 CET.
Check out all our upcoming Dev Dives sessions at https://community.uipath.com/dev-dives-automation-developer-2025/.
Cybersecurity Identity and Access Solutions using Azure AD
Cybersecurity Identity and Access Solutions using Azure ADVICTOR MAESTRE RAMIREZ Cybersecurity Identity and Access Solutions using Azure AD

Designing Low-Latency Systems with Rust and ScyllaDB: An Architectural Deep Dive
Designing Low-Latency Systems with Rust and ScyllaDB: An Architectural Deep DiveScyllaDB Want to learn practical tips for designing systems that can scale efficiently without compromising speed?
Join us for a workshop where we’ll address these challenges head-on and explore how to architect low-latency systems using Rust. During this free interactive workshop oriented for developers, engineers, and architects, we’ll cover how Rust’s unique language features and the Tokio async runtime enable high-performance application development.
As you explore key principles of designing low-latency systems with Rust, you will learn how to:
- Create and compile a real-world app with Rust
- Connect the application to ScyllaDB (NoSQL data store)
- Negotiate tradeoffs related to data modeling and querying
- Manage and monitor the database for consistently low latencies
The Evolution of Meme Coins A New Era for Digital Currency ppt.pdf
The Evolution of Meme Coins A New Era for Digital Currency ppt.pdfAbi john Analyze the growth of meme coins from mere online jokes to potential assets in the digital economy. Explore the community, culture, and utility as they elevate themselves to a new era in cryptocurrency.
Cyber Awareness overview for 2025 month of security
Cyber Awareness overview for 2025 month of securityriccardosl1 Cyber awareness training educates employees on risk associated with internet and malicious emails
UiPath Community Berlin: Orchestrator API, Swagger, and Test Manager API
UiPath Community Berlin: Orchestrator API, Swagger, and Test Manager APIUiPathCommunity Join this UiPath Community Berlin meetup to explore the Orchestrator API, Swagger interface, and the Test Manager API. Learn how to leverage these tools to streamline automation, enhance testing, and integrate more efficiently with UiPath. Perfect for developers, testers, and automation enthusiasts!
📕 Agenda
Welcome & Introductions
Orchestrator API Overview
Exploring the Swagger Interface
Test Manager API Highlights
Streamlining Automation & Testing with APIs (Demo)
Q&A and Open Discussion
Perfect for developers, testers, and automation enthusiasts!
👉 Join our UiPath Community Berlin chapter: https://community.uipath.com/berlin/
This session streamed live on April 29, 2025, 18:00 CET.
Check out all our upcoming UiPath Community sessions at https://community.uipath.com/events/.
AI Changes Everything – Talk at Cardiff Metropolitan University, 29th April 2...
AI Changes Everything – Talk at Cardiff Metropolitan University, 29th April 2...Alan Dix Talk at the final event of Data Fusion Dynamics: A Collaborative UK-Saudi Initiative in Cybersecurity and Artificial Intelligence funded by the British Council UK-Saudi Challenge Fund 2024, Cardiff Metropolitan University, 29th April 2025
https://alandix.com/academic/talks/CMet2025-AI-Changes-Everything/
Is AI just another technology, or does it fundamentally change the way we live and think?
Every technology has a direct impact with micro-ethical consequences, some good, some bad. However more profound are the ways in which some technologies reshape the very fabric of society with macro-ethical impacts. The invention of the stirrup revolutionised mounted combat, but as a side effect gave rise to the feudal system, which still shapes politics today. The internal combustion engine offers personal freedom and creates pollution, but has also transformed the nature of urban planning and international trade. When we look at AI the micro-ethical issues, such as bias, are most obvious, but the macro-ethical challenges may be greater.
At a micro-ethical level AI has the potential to deepen social, ethnic and gender bias, issues I have warned about since the early 1990s! It is also being used increasingly on the battlefield. However, it also offers amazing opportunities in health and educations, as the recent Nobel prizes for the developers of AlphaFold illustrate. More radically, the need to encode ethics acts as a mirror to surface essential ethical problems and conflicts.
At the macro-ethical level, by the early 2000s digital technology had already begun to undermine sovereignty (e.g. gambling), market economics (through network effects and emergent monopolies), and the very meaning of money. Modern AI is the child of big data, big computation and ultimately big business, intensifying the inherent tendency of digital technology to concentrate power. AI is already unravelling the fundamentals of the social, political and economic world around us, but this is a world that needs radical reimagining to overcome the global environmental and human challenges that confront us. Our challenge is whether to let the threads fall as they may, or to use them to weave a better future.
Just enough web ops for web developers
- 1. Just Enough WebOps for Developers Alexis Lê-Quôc @alq http://www.datadoghq.com
- 2. @alq
- 4. Datadog is Monitoring that does not suck... as a Service
- 5. Datadog is Monitoring that does not suck... as a Service “Metrics made social”
- 8. 930,000 350,000 Dev Ops 2010 US figures from BLS
- 9. The New Development Equation
- 10. The New Development Equation Code + + AWS =
- 11. The New Development Equation Code + + AWS = 3 months
- 12. The New Development Equation Code + + AWS = 3 months 5 minutes
- 14. Web Operations?
- 15. The New Development Equation Code + + AWS = 3 months 5 minutes
- 16. The New Development Equation Code + + AWS = 3 months 5 minutes Web Operations?
- 20. Common vocabulary between Dev & WebOps?
- 21. Users SysAdmin
- 22. “Come and get it” “We want root!”
- 23. Dev WebOps
- 24. WebOps and this is what I do
- 25. But first an important digression
- 26. Product Service
- 27. Service = Code + Infrastructure
- 28. Service = Product + Access
- 30. Provide access
- 31. Provide access
- 32. reliable, fast, cheap Provide access
- 33. reliable, fast, cheap Provide access
- 34. reliable, fast, cheap Provide access 24x7 without going crazy
- 35. 24x7 && !crazy
- 38. Delivery historically not the focus
- 41. Agile Cycle WDeebliOveprsy Cycle
- 42. WebOps and this is what I do
- 43. Dev Release Measure & Log Monitor Change WebOps Cycle Investigate Alert Fix || Escalate
- 44. (Release)
- 45. Dev Release Measure & Log Monitor Change Investigate Alert Fix || Escalate
- 46. Purpose Collect quantitative metrics Process Instrument servers Instrument code Instrument SaaS deps Automate collection Measure Risks Imprecise metric definition Manual collection “What does it mean?” Tools System (ganglia, collectd, munin, nagios, etc.) Code (metrics, statsd) SaaS (Datadog et al.)
- 47. Dev Release Measure & Log Monitor Change Investigate Alert Fix || Escalate
- 48. Purpose Collect meaningful, timestamped events Log Process All the time In one place Access for everyone Discipline Risks TiB of garbage Non-uniform timestamps Non-uniform formats Tools log4j et al. syslog et al. logstash, splunk + Logging-as-a-Service
- 49. Dev Release Measure & Log Change Investigate Alert Fix || Escalate Monitor
- 50. Purpose Watch actionable events & metrics Process Health of the app? Which metrics for health? Compute metrics Metric domain Access for everyone Pretty graphs Monitor Risks Non-actionable metrics Tools graphite, cubism et al. + services
- 51. Dev Release Measure & Log Monitor Change Investigate Alert Fix || Escalate
- 52. Purpose Bring human in the loop when automated fix does not work Alert Process Alert on vital monitors Add new alerts with new monitors Compute metrics from alerts Ruthlessly edit Risks Too many alerts Become desensitized Ignore alerts App crashes for real Pendulum swings back Tools nagios + services
- 53. Dev Release Measure & Log Monitor Change Investigate Alert Fix || Escalate
- 54. Purpose Fix issue or find someone who can Process (fix) capture actions as soon as possible (while or shortly after) (fix) runbooks (fix) automate fixes (escalation) on-call rotation (escalation) agree on rules Fix || Escalate Risks Burn out Tools PagerDuty Bug tracker
- 55. Dev Release Measure & Log Monitor Alert Change Investigate Fix || Escalate
- 56. Purpose Collect evidence Reconstruct what happened Process Start where/when problem 1st detected Work your way from there Capture relevant graphs/logs Investigate Risks Missing the starting point Lagging events/metrics Low-level events/metrics Blame game Tools Post-mortems
- 57. Dev Release Measure & Log Monitor Investigate Alert Fix || Escalate Change
- 58. Change Purpose Fewer alerts Better service Process Change infrastructure, code Infrastructure == code Add/Edit monitors & alerts Risks ad-hoc changes Tools ...
- 59. WebOps and this is what I do
- 60. Dev Release Measure & Log Monitor Change Questions? Comments? @alq Investigate Alert Fix || Escalate