Martin Junghans – Gradoop: Scalable Graph Analytics with Apache Flink
8 likes9,823 views

The document discusses Gradoop, a framework for scalable graph analytics using Apache Flink. It provides an overview of the Gradoop architecture, which includes an extended property graph data model, graph operators implemented as Flink operators, and a DSL for declaring analytical workflows. The architecture supports end-to-end graph analytics, including data integration, operator execution, and result representation.


![Combination
1: personGraph = db.G[0].combine(db.G[1]).combine(db.G[2])](https://image.slidesharecdn.com/gradoopflinkforward-151019133646-lva1-app6891/85/Martin-Junghans-Gradoop-Scalable-Graph-Analytics-with-Apache-Flink-30-320.jpg)
![Combination
1: personGraph = db.G[0].combine(db.G[1]).combine(db.G[2])](https://image.slidesharecdn.com/gradoopflinkforward-151019133646-lva1-app6891/85/Martin-Junghans-Gradoop-Scalable-Graph-Analytics-with-Apache-Flink-31-320.jpg)

![Summarization
1: personGraph = db.G[0].combine(db.G[1]).combine(db.G[2])
2: vertexGroupingKeys = {:type, “city”}
3: edgeGroupingKeys = {:type}
4: vertexAggFunc = (Vertex vSum, Set vertices => vSum[“count”] = |vertices|)
5: edgeAggFunc = (Edge eSum, Set edges => eSum[“count”] = |edges|)
6: sumGraph = personGraph.summarize(vertexGroupingKeys, vertexAggFunc,
edgeGroupingKeys, edgeAggFunc)](https://image.slidesharecdn.com/gradoopflinkforward-151019133646-lva1-app6891/85/Martin-Junghans-Gradoop-Scalable-Graph-Analytics-with-Apache-Flink-33-320.jpg)
![Summarization
1: personGraph = db.G[0].combine(db.G[1]).combine(db.G[2])
2: vertexGroupingKeys = {:type, “city”}
3: edgeGroupingKeys = {:type}
4: vertexAggFunc = (Vertex vSum, Set vertices => vSum[“count”] = |vertices|)
5: edgeAggFunc = (Edge eSum, Set edges => eSum[“count”] = |edges|)
6: sumGraph = personGraph.summarize(vertexGroupingKeys, vertexAggFunc,
edgeGroupingKeys, edgeAggFunc)](https://image.slidesharecdn.com/gradoopflinkforward-151019133646-lva1-app6891/85/Martin-Junghans-Gradoop-Scalable-Graph-Analytics-with-Apache-Flink-34-320.jpg)
![Graph Collection Operators
Operator GrALa notation
Collection
Selection collection.select(predicate) : Collection
Distinct collection.distinct() : Collection
Sort by collection.sortBy(key, [:asc|:desc]) : Collection
Top collection.top(limit) : Collection
Union collection.union(otherCollection) : Collection
Intersection collection.intersect(otherCollection) : Collection
Difference collection.difference(otherCollection) : Collection
Auxiliary
Apply collection.apply(unaryGraphOperator) : Collection
Reduce collection.reduce(binaryGraphOperator) : Graph
Call [graph|collection].callFor[Graph|Collection](
algorithm,parameters) : [Graph|Collection]](https://image.slidesharecdn.com/gradoopflinkforward-151019133646-lva1-app6891/85/Martin-Junghans-Gradoop-Scalable-Graph-Analytics-with-Apache-Flink-35-320.jpg)
![Selection
1: collection = <db.G[0],db.G[1],db.G[2]>
2: predicate = (Graph g => |g.V| > 3)
3: result = collection.select(predicate)](https://image.slidesharecdn.com/gradoopflinkforward-151019133646-lva1-app6891/85/Martin-Junghans-Gradoop-Scalable-Graph-Analytics-with-Apache-Flink-36-320.jpg)
![Selection
1: collection = <db.G[0],db.G[1],db.G[2]>
2: predicate = (Graph g => |g.V| > 3)
3: result = collection.select(predicate)](https://image.slidesharecdn.com/gradoopflinkforward-151019133646-lva1-app6891/85/Martin-Junghans-Gradoop-Scalable-Graph-Analytics-with-Apache-Flink-37-320.jpg)
![Graph Collection Operators
Operator GrALa notation
Collection
Selection collection.select(predicate) : Collection
Distinct collection.distinct() : Collection
Sort by collection.sortBy(key, [:asc|:desc]) : Collection
Top collection.top(limit) : Collection
Union collection.union(otherCollection) : Collection
Intersection collection.intersect(otherCollection) : Collection
Difference collection.difference(otherCollection) : Collection
Auxiliary
Apply collection.apply(unaryGraphOperator) : Collection
Reduce collection.reduce(binaryGraphOperator) : Graph
Call [graph|collection].callFor[Graph|Collection](
algorithm,parameters) : [Graph|Collection]](https://image.slidesharecdn.com/gradoopflinkforward-151019133646-lva1-app6891/85/Martin-Junghans-Gradoop-Scalable-Graph-Analytics-with-Apache-Flink-38-320.jpg)


![Summarization in Flink
VID City
0 L
1 L
2 D
3 D
4 D
5 B
EID S T
0 0 1
1 1 0
2 1 2
3 2 1
4 2 3
5 3 2
6 4 0
7 4 1
8 5 2
9 5 3
L [0,1]
D [2,3,4]
B [5]
VID City Count
0 L 2
2 D 3
5 B 1
VID Rep
0 0
1 0
2 2
3 2
4 2
5 5
ID S T
0 0 1
1 0 0
2 0 2
3 2 1
4 2 3
5 2 2
6 2 0
7 2 1
8 5 2
9 5 3
ID S T
0 0 0
1 0 0
2 0 2
3 2 0
4 2 2
5 2 2
6 2 0
7 2 0
8 5 2
9 5 2
0,0 [0,1]
0,2 [2]
2,0 [3,6,7]
2,2 [4,5]
5,2 [8,9]
EID S T Count
0 0 1 2
2 0 2 1
3 2 0 3
4 2 2 2
8 5 2 2
join(VID==S)
𝒱
ℰ’
𝒱′
ℰ
groupBy(City)
reduceGroup + filter + map
reduceGroup + filter + map
groupBy(S,T)
join(VID==T)](https://image.slidesharecdn.com/gradoopflinkforward-151019133646-lva1-app6891/85/Martin-Junghans-Gradoop-Scalable-Graph-Analytics-with-Apache-Flink-41-320.jpg)


![(3) BTG Clustering
// select profit and loss clusters
profitBtgs = btgs.select( Graph g => g[“Profit”] >= 0 )
lossBtgs = btgs.difference(profitBtgs)](https://image.slidesharecdn.com/gradoopflinkforward-151019133646-lva1-app6891/85/Martin-Junghans-Gradoop-Scalable-Graph-Analytics-with-Apache-Flink-59-320.jpg)
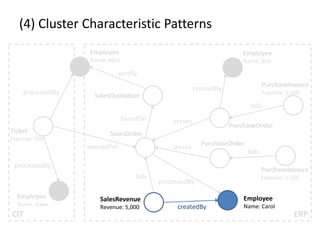


![(4) Cluster Characteristic Patterns
// select profit and loss clusters
profitBtgs = btgs.select( Graph g => g[“Profit”] >= 0 )
lossBtgs = btgs.difference(profitBtgs)
// apply magic
profitFreqPats = profitBtgs.callForCollection(
:FrequentSubgraphs , {“Threshold”:0.7}
)
lossFreqPats = lossBtgs.callForCollection(
:FrequentSubgraphs , {“Threshold”:0.7}
)
// determine cluster characteristic patterns
trivialPats = profitFreqPats.intersect(lossFreqPats)
profitCharPatterns = profitFreqPats.difference(trivialPats)
lossCharPatterns = lossFreqPats.difference(trivialPats)](https://image.slidesharecdn.com/gradoopflinkforward-151019133646-lva1-app6891/85/Martin-Junghans-Gradoop-Scalable-Graph-Analytics-with-Apache-Flink-63-320.jpg)


![Benchmarks Sneak Preview
0
200
400
600
800
1000
1200
1400
1 2 4 8 16
Time [s]
# Worker
Summarization (Vertex and Edge Labels)
16x Intel(R) Xeon(R) CPU E5-2430 v2 @ 2.50GHz (12 Cores), 48 GB RAM
Hadoop 2.5.2, Flink 0.9.0
slots (per node) 12
jobmanager.heap.mb 2048
taskmanager.heap.mb 40960
Foodbroker Graph (https://github.com/dbs-leipzig/foodbroker)
Generates BI process data
858,624,267 Vertices, 4,406,445,007 Edges, 663GB Payload](https://image.slidesharecdn.com/gradoopflinkforward-151019133646-lva1-app6891/85/Martin-Junghans-Gradoop-Scalable-Graph-Analytics-with-Apache-Flink-68-320.jpg)


Martin Junghans – Gradoop: Scalable Graph Analytics with Apache Flink
- 1. GRADOOP: Scalable Graph Analytics with Apache Flink Martin Junghanns University of Leipzig
- 2. About the speaker and the team 2011 Bachelor of Engineering Thesis: Partitioning of Dynamic Graphs 2014 Master of Science Thesis: Graph Database Systems for Business Intelligence Now: PhD Student, Database Group, University of Leipzig Distributed Systems Distributed Graph Data Management Graph Theory & Algorithms Professional Experience: sones GraphDB, SAP André, PhD Student Martin, PhD Student Kevin, M.Sc. StudentNiklas, M.Sc. Student
- 3. Motivation
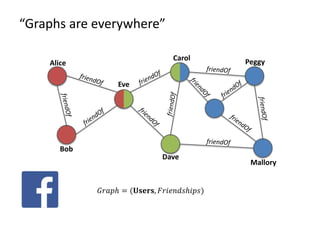
- 4. 𝑮𝑟𝑟𝑟𝑟 = (𝑽𝑒𝑒𝑒𝑒𝑒𝑒𝑒, 𝑬𝑑𝑑𝑑𝑑) “Graphs are everywhere”
- 5. 𝐺𝐺𝐺𝐺𝐺 = (𝐔𝐔𝐔𝐔𝐔, 𝐹𝐹𝐹𝐹𝐹𝐹𝐹𝐹𝐹𝐹𝐹) “Graphs are everywhere” Alice Bob Eve Dave Carol Mallory Peggy
- 6. 𝐺𝐺𝐺𝐺𝐺 = (𝐔𝐔𝐔𝐔𝐔, 𝐹𝐹𝐹𝐹𝐹𝐹𝐹𝐹𝐹𝐹𝐹) “Graphs are everywhere” Alice Bob Eve Dave Carol Mallory Peggy
- 7. 𝐺𝐺𝐺𝐺𝐺 = (𝐔𝐔𝐔𝐔𝐔, 𝐹𝐹𝐹𝐹𝐹𝐹𝐹𝐹𝐹𝐹𝐹) “Graphs are everywhere” Alice Bob Eve Dave Carol Mallory Peggy
- 8. 𝐺𝐺𝐺𝐺𝐺 = (𝐔𝐔𝐔𝐔𝐔, 𝐹𝐹𝐹𝐹𝐹𝐹𝐹𝐹𝐹𝐹𝐹) “Graphs are everywhere” Alice Bob Eve Dave Carol Mallory Peggy
- 9. 𝐺𝐺𝐺𝐺𝐺 = (𝐔𝐔𝐔𝐔𝐔, 𝐹𝐹𝐹𝐹𝐹𝐹𝐹𝐹𝐹) “Graphs are everywhere” Alice Bob Eve Dave Carol Mallory Peggy Trent
- 10. 𝐺𝐺𝐺𝐺𝐺 = (𝐔𝐔𝐔𝐔𝐔, 𝐹𝐹𝐹𝐹𝐹𝐹𝐹𝐹𝐹) “Graphs are everywhere” Alice Bob Eve Dave Carol Mallory Peggy Trent
- 11. 𝐺𝐺𝐺𝐺𝐺 = (𝐂𝐂𝐂𝐂𝐂𝐂, 𝐶𝐶𝐶𝐶𝐶𝐶𝐶𝐶𝐶𝐶𝐶) “Graphs are everywhere” Leipzig pop: 544K Dresden pop: 536K Berlin pop: 3.5M Hamburg pop: 1.7M Munich pop: 1.4M Chemnitz pop: 243K Nuremberg pop: 500K Cologne pop: 1M
- 12. World Wide Web ca. 1 billion websites “Graphs are large” Facebook ca. 1.49 billion active users ca. 340 friends per user
- 13. End-to-End Graph Analytics Data Integration Graph Analytics Representation
- 14. End-to-End Graph Analytics Data Integration Graph Analytics Representation Integrate data from one or more sources into a dedicated graph storage with common graph data model
- 15. End-to-End Graph Analytics Data Integration Graph Analytics Representation Integrate data from one or more sources into a dedicated graph storage with common graph data model Definition of analytical workflows from operator algebra
- 16. End-to-End Graph Analytics Data Integration Graph Analytics Representation Integrate data from one or more sources into a dedicated graph storage with common graph data model Definition of analytical workflows from operator algebra Result representation in a meaningful way
- 17. Graph Data Management Graph Database Systems Neo4j, OrientDB Graph Processing Systems Pregel, Giraph Distributed Workflow Systems Flink Gelly, Spark GraphX Data Model Rich Graph Models Generic Graph Models Generic Graph Models Focus Local ACID Operations Global Graph Operations Global Data and Graph Operations Query Language Yes No No Persistency Yes No No Scalability Vertical Horizontal Horizontal Workflows No No Yes Data Integration No No No Graph Analytics No Yes Yes Representation Yes No No
- 18. Graph Data Management Graph Database Systems Neo4j, OrientDB Graph Processing Systems Pregel, Giraph Distributed Workflow Systems Flink Gelly, Spark GraphX Data Model Rich Graph Models Generic Graph Models Generic Graph Models Focus Local ACID Operations Global Graph Operations Global Data and Graph Operations Query Language Yes No No Persistency Yes No No Scalability Vertical Horizontal Horizontal Workflows No No Yes Data Integration No No No Graph Analytics No Yes Yes Representation Yes No No
- 19. Graph Data Management Graph Database Systems Neo4j, OrientDB Graph Processing Systems Pregel, Giraph Distributed Workflow Systems Flink Gelly, Spark GraphX Data Model Rich Graph Models Generic Graph Models Generic Graph Models Focus Local ACID Operations Global Graph Operations Global Data and Graph Operations Query Language Yes No No Persistency Yes No No Scalability Vertical Horizontal Horizontal Workflows No No Yes Data Integration No No No Graph Analytics No Yes Yes Representation Yes No No
- 20. Graph Data Management Graph Database Systems Neo4j, OrientDB Graph Processing Systems Pregel, Giraph Distributed Workflow Systems Flink Gelly, Spark GraphX Data Model Rich Graph Models Generic Graph Models Generic Graph Models Focus Local ACID Operations Global Graph Operations Global Data and Graph Operations Query Language Yes No No Persistency Yes No No Scalability Vertical Horizontal Horizontal Workflows No No Yes Data Integration No No No Graph Analytics No Yes Yes Representation Yes No No
- 21. What‘s missing? An end-to-end framework and research platform for efficient, distributed and domain independent graph data management and analytics.
- 22. What‘s missing? An end-to-end framework and research platform for efficient, distributed and domain independent graph data management and analytics.
- 23. Gradoop Architecture & Data Model
- 24. High Level Architecture HDFS/YARN Cluster HBase Distributed Graph Store Extended Property Graph Model Flink Operator Implementations Data Integration Flink Operator Execution Workflow Declaration Visual GrALa DSL Representation Data flow Control flow Graph Analytics Representation Workflow Execution
- 25. High Level Architecture HBase Distributed Graph Store Extended Property Graph Model Flink Operator Implementations Data Integration Flink Operator Execution Workflow Declaration Visual GrALa DSL Representation Data flow Control flow Graph Analytics Representation Workflow Execution HDFS/YARN Cluster
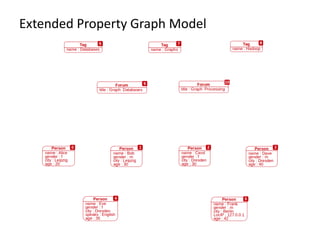
- 26. Extended Property Graph Model
- 27. Extended Property Graph Model
- 28. Extended Property Graph Model
- 29. Graph Operators Operator GrALa notation Binary Combination graph.combine(otherGraph) : Graph Overlap graph.overlap(otherGraph) : Graph Exclusion graph.exclude(otherGraph) : Graph Isomorphism graph.isIsomorphicTo(otherGraph) : Boolean Unary Pattern Matching graph.match(patternGraph,predicate) : Collection Aggregation graph.aggregate(propertyKey,aggregateFunction) : Graph Projection graph.project(vertexFunction,edgeFunction) : Graph Summarization graph.summarize( vertexGroupKeys,vertexAggregateFunction, edgeGroupKeys,edgeAggregateFunction) : Graph
- 30. Combination 1: personGraph = db.G[0].combine(db.G[1]).combine(db.G[2])
- 31. Combination 1: personGraph = db.G[0].combine(db.G[1]).combine(db.G[2])
- 32. Graph Operators Operator GrALa notation Binary Combination graph.combine(otherGraph) : Graph Overlap graph.overlap(otherGraph) : Graph Exclusion graph.exclude(otherGraph) : Graph Isomorphism graph.isIsomorphicTo(otherGraph) : Boolean Unary Pattern Matching graph.match(patternGraph,predicate) : Collection Aggregation graph.aggregate(propertyKey,aggregateFunction) : Graph Projection graph.project(vertexFunction,edgeFunction) : Graph Summarization graph.summarize( vertexGroupKeys,vertexAggregateFunction, edgeGroupKeys,edgeAggregateFunction) : Graph
- 33. Summarization 1: personGraph = db.G[0].combine(db.G[1]).combine(db.G[2]) 2: vertexGroupingKeys = {:type, “city”} 3: edgeGroupingKeys = {:type} 4: vertexAggFunc = (Vertex vSum, Set vertices => vSum[“count”] = |vertices|) 5: edgeAggFunc = (Edge eSum, Set edges => eSum[“count”] = |edges|) 6: sumGraph = personGraph.summarize(vertexGroupingKeys, vertexAggFunc, edgeGroupingKeys, edgeAggFunc)
- 34. Summarization 1: personGraph = db.G[0].combine(db.G[1]).combine(db.G[2]) 2: vertexGroupingKeys = {:type, “city”} 3: edgeGroupingKeys = {:type} 4: vertexAggFunc = (Vertex vSum, Set vertices => vSum[“count”] = |vertices|) 5: edgeAggFunc = (Edge eSum, Set edges => eSum[“count”] = |edges|) 6: sumGraph = personGraph.summarize(vertexGroupingKeys, vertexAggFunc, edgeGroupingKeys, edgeAggFunc)
- 35. Graph Collection Operators Operator GrALa notation Collection Selection collection.select(predicate) : Collection Distinct collection.distinct() : Collection Sort by collection.sortBy(key, [:asc|:desc]) : Collection Top collection.top(limit) : Collection Union collection.union(otherCollection) : Collection Intersection collection.intersect(otherCollection) : Collection Difference collection.difference(otherCollection) : Collection Auxiliary Apply collection.apply(unaryGraphOperator) : Collection Reduce collection.reduce(binaryGraphOperator) : Graph Call [graph|collection].callFor[Graph|Collection]( algorithm,parameters) : [Graph|Collection]
- 36. Selection 1: collection = <db.G[0],db.G[1],db.G[2]> 2: predicate = (Graph g => |g.V| > 3) 3: result = collection.select(predicate)
- 37. Selection 1: collection = <db.G[0],db.G[1],db.G[2]> 2: predicate = (Graph g => |g.V| > 3) 3: result = collection.select(predicate)
- 38. Graph Collection Operators Operator GrALa notation Collection Selection collection.select(predicate) : Collection Distinct collection.distinct() : Collection Sort by collection.sortBy(key, [:asc|:desc]) : Collection Top collection.top(limit) : Collection Union collection.union(otherCollection) : Collection Intersection collection.intersect(otherCollection) : Collection Difference collection.difference(otherCollection) : Collection Auxiliary Apply collection.apply(unaryGraphOperator) : Collection Reduce collection.reduce(binaryGraphOperator) : Graph Call [graph|collection].callFor[Graph|Collection]( algorithm,parameters) : [Graph|Collection]
- 39. Extended Property Graph Model in Flink ID Label Properties Graphs ID Label Properties Source Vertex Target Vertex Graphs VertexData EdgeData GraphData ID Label Properties POJO POJO POJO DataSet<Vertex<ID,VertexData>> DataSet<Edge<ID,EdgeData>> DataSet<Subgraph<ID,GraphData>> Gelly 𝒱 ℰ 𝒢 Pojo Representation
- 40. Extended Property Graph Model in Flink VertexData EdgeData GraphData POJO POJO POJO DataSet<Vertex<ID,VertexData>> DataSet<Edge<ID,EdgeData>> DataSet<Subgraph<ID,GraphData>> Gelly VertexData EdgeData GraphData Tuple Tuple Tuple DataSet<VertexData> DataSet<EdgeData> DataSet<GraphData> 𝒱 𝒱 ℰ ℰ 𝒢 𝒢 Pojo Representation Tuple Representation ID Label Properties Graphs ID Label Properties Source Vertex Target Vertex Graphs ID Label Properties ID Label Properties Graphs ID Label Properties Source Vertex Target Vertex Graphs ID Label Properties
- 41. Summarization in Flink VID City 0 L 1 L 2 D 3 D 4 D 5 B EID S T 0 0 1 1 1 0 2 1 2 3 2 1 4 2 3 5 3 2 6 4 0 7 4 1 8 5 2 9 5 3 L [0,1] D [2,3,4] B [5] VID City Count 0 L 2 2 D 3 5 B 1 VID Rep 0 0 1 0 2 2 3 2 4 2 5 5 ID S T 0 0 1 1 0 0 2 0 2 3 2 1 4 2 3 5 2 2 6 2 0 7 2 1 8 5 2 9 5 3 ID S T 0 0 0 1 0 0 2 0 2 3 2 0 4 2 2 5 2 2 6 2 0 7 2 0 8 5 2 9 5 2 0,0 [0,1] 0,2 [2] 2,0 [3,6,7] 2,2 [4,5] 5,2 [8,9] EID S T Count 0 0 1 2 2 0 2 1 3 2 0 3 4 2 2 2 8 5 2 2 join(VID==S) 𝒱 ℰ’ 𝒱′ ℰ groupBy(City) reduceGroup + filter + map reduceGroup + filter + map groupBy(S,T) join(VID==T)
- 42. Use Case: Graph Business Intelligence
- 43. Use Case: Graph Business Intelligence Business intelligence usually based on relational data warehouses Enterprise data is integrated within dimensional schema Analysis limited to predefined relationships No support for relationship-oriented data mining Facts Dim 1 Dim 2 Dim 3
- 44. Use Case: Graph Business Intelligence Business intelligence usually based on relational data warehouses Enterprise data is integrated within dimensional schema Analysis limited to predefined relationships No support for relationship-oriented data mining Graph-based approach Integrate data sources within an instance graph by preserving original relationships between data objects (transactional and master data) Determine subgraphs (business transaction graphs) related to business activities Analyze subgraphs or entire graphs with aggregation queries, mining relationship patterns, etc. Facts Dim 1 Dim 2 Dim 3
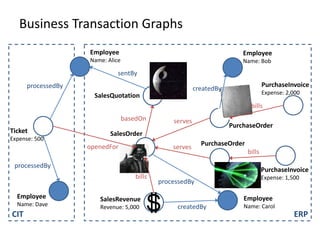
- 46. Business Transaction Graphs CIT ERP Employee Name: Dave Employee Name: Alice Employee Name: Bob Employee Name: Carol Ticket Expense: 500 SalesQuotation SalesOrder PurchaseOrder PurchaseOrder SalesRevenue Revenue: 5,000 PurchaseInvoice Expense: 2,000 PurchaseInvoice Expense: 1,500 sentBy createdBy processedBy createdBy openedFor processedBy basedOn serves serves bills bills bills processedBy
- 47. Business Transaction Graphs CIT ERP Employee Name: Dave Employee Name: Alice Employee Name: Bob Employee Name: Carol Ticket Expense: 500 SalesQuotation SalesOrder PurchaseOrder PurchaseOrder SalesRevenue Revenue: 5,000 PurchaseInvoice Expense: 2,000 PurchaseInvoice Expense: 1,500 sentBy createdBy processedBy createdBy openedFor processedBy processedBy basedOn serves serves bills bills bills
- 48. Business Transaction Graphs CIT ERP Employee Name: Dave Employee Name: Alice Employee Name: Bob Employee Name: Carol Ticket Expense: 500 SalesQuotation SalesOrder PurchaseOrder PurchaseOrder SalesRevenue Revenue: 5,000 PurchaseInvoice Expense: 2,000 PurchaseInvoice Expense: 1,500 sentBy createdBy processedBy createdBy openedFor processedBy processedBy basedOn serves serves bills bills bills
- 49. Business Transaction Graphs CIT ERP Employee Name: Dave Employee Name: Alice Employee Name: Bob Employee Name: Carol Ticket Expense: 500 SalesQuotation SalesOrder PurchaseOrder PurchaseOrder SalesRevenue Revenue: 5,000 PurchaseInvoice Expense: 2,000 PurchaseInvoice Expense: 1,500 sentBy createdBy processedBy createdBy openedFor processedBy processedBy basedOn serves serves bills bills bills
- 50. Business Transaction Graphs CIT ERP Employee Name: Dave Employee Name: Alice Employee Name: Bob Employee Name: Carol Ticket Expense: 500 SalesQuotation SalesOrder PurchaseOrder PurchaseOrder SalesRevenue Revenue: 5,000 PurchaseInvoice Expense: 2,000 PurchaseInvoice Expense: 1,500 sentBy createdBy processedBy createdBy openedFor processedBy processedBy basedOn serves serves bills bills bills
- 51. Business Transaction Graphs CIT ERP Employee Name: Dave Employee Name: Alice Employee Name: Bob Employee Name: Carol Ticket Expense: 500 SalesQuotation SalesOrder PurchaseOrder PurchaseOrder SalesRevenue Revenue: 5,000 PurchaseInvoice Expense: 2,000 PurchaseInvoice Expense: 1,500 sentBy createdBy processedBy createdBy openedFor processedBy processedBy basedOn serves serves bills bills bills
- 52. BTG 1 (1) BTG Extraction BTG 2 BTG 3 BTG 4 BTG 5 BTG n …
- 53. (1) BTG Extraction // generate base collection btgs = iig.callForCollection( :BusinessTransactionGraphs , {} )
- 54. (2) Profit Aggregation CIT ERP Employee Name: Dave Employee Name: Alice Employee Name: Bob Employee Name: Carol Ticket Expense: 500 SalesQuotation SalesOrder PurchaseOrder PurchaseOrder SalesRevenue Revenue: 5,000 PurchaseInvoice Expense: 2,000 PurchaseInvoice Expense: 1,500 sentBy createdBy processedBy createdBy openedFor processedBy processedBy basedOn serves serves bills bills bills
- 55. (2) Profit Aggregation // generate base collection btgs = iig.callForCollection( :BusinessTransactionGraphs , {} ) // define profit aggregate function aggFunc = ( Graph g => g.V.values(“Revenue").sum() - g.V.values(“Expense").sum() )
- 56. (2) Profit Aggregation BTG 1 BTG 2 BTG 3 BTG 4 BTG 5 BTG n … ∑ Revenue ∑ Expenses Net Profit 5,000 -3,000 2,000 9,000 -3,000 6,000 2,000 -1,500 500 5,000 -7,000 -2,000 10,000 -15,000 -5,000 … … … 8,000 -4,000 4,000
- 57. (2) Profit Aggregation // generate base collection btgs = iig.callForCollection( :BusinessTransactionGraphs , {} ) // define profit aggregate function aggFunc = ( Graph g => g.V.values(“Revenue").sum() - g.V.values(“Expense").sum() ) // apply aggregate function and store result at new property btgs = btgs.apply( Graph g => g.aggregate( “Profit“ , aggFunc ) )
- 58. (3) BTG Clustering BTG 1 BTG 2 BTG 3 BTG 4 BTG 5 BTG n … ∑ Revenue ∑ Expenses Net Profit 5,000 -3,000 2,000 9,000 -3,000 6,000 2,000 -1,500 500 5,000 -7,000 -2,000 10,000 -15,000 -5,000 … … … 8,000 -4,000 4,000
- 59. (3) BTG Clustering // select profit and loss clusters profitBtgs = btgs.select( Graph g => g[“Profit”] >= 0 ) lossBtgs = btgs.difference(profitBtgs)
- 60. (4) Cluster Characteristic Patterns CIT ERP Employee Name: Dave Employee Name: Alice Employee Name: Bob Employee Name: Carol Ticket Expense: 500 SalesQuotation SalesOrder PurchaseOrder PurchaseOrder SalesRevenue Revenue: 5,000 PurchaseInvoice Expense: 2,000 PurchaseInvoice Expense: 1,500 sentBy createdBy processedBy createdBy openedFor processedBy processedBy basedOn serves serves bills bills bills
- 61. (4) Cluster Characteristic Patterns CIT ERP Employee Name: Dave Employee Name: Alice Employee Name: Bob Employee Name: Carol Ticket Expense: 500 SalesQuotation SalesOrder PurchaseOrder PurchaseOrder SalesRevenue Revenue: 5,000 PurchaseInvoice Expense: 2,000 PurchaseInvoice Expense: 1,500 sentBy createdBy processedBy createdBy openedFor processedBy processedBy basedOn serves serves bills bills bills
- 62. (4) Cluster Characteristic Patterns BTG 1 BTG 2 BTG 3 BTG 4 BTG 5 BTG n … ∑ Revenue ∑ Expenses Net Profit 5,000 -3,000 2,000 9,000 -3,000 6,000 2,000 -1,500 500 5,000 -7,000 -2,000 10,000 -15,000 -5,000 … … … 8,000 -4,000 4,000 TicketAlice processedBy Bob createdBy PurchaseOrder
- 63. (4) Cluster Characteristic Patterns // select profit and loss clusters profitBtgs = btgs.select( Graph g => g[“Profit”] >= 0 ) lossBtgs = btgs.difference(profitBtgs) // apply magic profitFreqPats = profitBtgs.callForCollection( :FrequentSubgraphs , {“Threshold”:0.7} ) lossFreqPats = lossBtgs.callForCollection( :FrequentSubgraphs , {“Threshold”:0.7} ) // determine cluster characteristic patterns trivialPats = profitFreqPats.intersect(lossFreqPats) profitCharPatterns = profitFreqPats.difference(trivialPats) lossCharPatterns = lossFreqPats.difference(trivialPats)
- 64. Current State & Future Work
- 65. Current State 0.0.1 First Prototype (May 2015) Hadoop MapReduce and Giraph for operator implementations Too much complexity Performance loss through serialization in HDFS/HBase 0.0.2 Using Flink as execution layer (June 2015) Basic operators Currently 0.0.3-SNAPSHOT Performance improvements More operator implementations
- 66. Operator implementations (0.0.3-SNAPSHOT) Unary Pattern Matching Collection Selection Algorithms LabelPropagation Aggregation Distinct BTG Extraction Projection Sort by FSM Summarization Top Binary Combination Union Overlap Intersection Exclusion Difference Isomorphism Auxiliary Apply Reduce Call
- 67. Future Work Operator integration into Gelly Summarization FLINK-2411 Graph Sampling … Graph Operations on streams (Flink) Graph Partitioning (maybe together with the Gelly people) Graph Versioning (Storage) Benchmarking GrALa Interpreter / Web UI
- 68. Benchmarks Sneak Preview 0 200 400 600 800 1000 1200 1400 1 2 4 8 16 Time [s] # Worker Summarization (Vertex and Edge Labels) 16x Intel(R) Xeon(R) CPU E5-2430 v2 @ 2.50GHz (12 Cores), 48 GB RAM Hadoop 2.5.2, Flink 0.9.0 slots (per node) 12 jobmanager.heap.mb 2048 taskmanager.heap.mb 40960 Foodbroker Graph (https://github.com/dbs-leipzig/foodbroker) Generates BI process data 858,624,267 Vertices, 4,406,445,007 Edges, 663GB Payload
- 69. Web UI Sneak Preview
- 70. Contributions welcome Code Operator implementations Performance Tuning Storage layout Data! and Use Cases We are researchers, we assume ... Getting real data (especially BI data) is nearly impossible People Bachelor / Master / PhD Thesis
- 71. Thank you for building Flink! www.gradoop.com https://github.com/dbs-leipzig/gradoop http://dbs.uni-leipzig.de/file/GradoopTR.pdf http://dbs.uni-leipzig.de/file/biiig-vldb2014.pdf