SlideShare a Scribd company logo
2
Most read
3
Most read
8
Most read
Qlik Sense
BY
SANJANA
GONDANE(12H51A05A8)
UNDER THE GUIDANCE OF
Mr. RAJ KISHORE
INTRODUCTION
Business these days depend heavily on analytics
to answer questions about the performance of
different aspects of their business. To see data
you use partial views offered by query-based or
hierarchical tools.
Qlik Sense takes analytics to a new level of
power and flexibility, so that everyone in your
business is more informed and capable of
acting and reacting faster based on how you
view data
This is a visualization tool, useful to see reports
and dashboard. It extracts and plots data from
your data base in the form of bar graphs,
charts, tables and other smart visuals.
Helps you analyse huge and complex data to
answer your questions
The Qlik platform is powered by the Qlik Indexing Engine (QIX). It
optimizes in-memory speed, compressing data down to 10% of its
original size and makes faster calculations
MAIN FEATURES
 Cloud based application - Available for desktop, or cloud app,
accessed anywhere
 You can create your own customized reports to view specific
charts
 Helps you drill down more on the chart
 Used by multiple industries-
oHealthcare
oManufacturing
oCommunications
oFinancial services
oRetail
oEnergy & utilities
ADVANTAGES OF Qlik SENSE
Faster, scalable analysis
More exploration, less restrictions
Mobile done right
A rich platform to build on
Can create your own dashboards
WHY QLIK SENSE ?!?
Intuitive
Use simple drag-and-drop interfaces to create
flexible, interactive data visualizations. Explore data
with smart visualizations that automatically adapts to
the parameters you set — no need for developers,
data scientists or designers.
Smart Search
Use natural search to navigate complex information
to accelerate discovery.
Self-service creation
Drag-and-drop to create your own visualizations — without
scripting, complex SQL queries, or joins.
Centralized management
Find and share relevant analyses, including apps and stories,
through a centralized hub.
Data integration
Unify data sources for a complete view of information, without
gaps, and make it easier to discover hidden insights.
Secure
Flexible security for data and content across all devices.
THANK YOU!

More Related Content

POTX
Credon - Qlik Sense Presentation
PDF
Qlik Sense for Beginners - www.techstuffy.com - QlikView Next Generation
PDF
Qlik-Sense-Product-Presentation.compressed.pdf
PPTX
Qlik View Corporate Overview Ppt Presentation
PDF
Qlikview for Beginners
PDF
Data Driven Possibilities with Qlik
PDF
Introduction to Data Engineer and Data Pipeline at Credit OK
PDF
Trino: A Ludicrously Fast Query Engine - Pulsar Summit NA 2021
Credon - Qlik Sense Presentation
Qlik Sense for Beginners - www.techstuffy.com - QlikView Next Generation
Qlik-Sense-Product-Presentation.compressed.pdf
Qlik View Corporate Overview Ppt Presentation
Qlikview for Beginners
Data Driven Possibilities with Qlik
Introduction to Data Engineer and Data Pipeline at Credit OK
Trino: A Ludicrously Fast Query Engine - Pulsar Summit NA 2021

What's hot (20)

PPTX
Databricks Fundamentals
PDF
Make your data AI ready with Microsoft Fabric and Azure Databricks pitch deck...
PPTX
Flexible and Real-Time Stream Processing with Apache Flink
PDF
QlikView Tutorial For Beginners | What Is QlikView | Qlikview Tutorial | Qlik...
PDF
Getting started with BigQuery
PPTX
Data Lakehouse, Data Mesh, and Data Fabric (r2)
PDF
Accelerate and modernize your data pipelines
PDF
Wix's ML Platform
PDF
ETL Made Easy with Azure Data Factory and Azure Databricks
PDF
What’s New with Databricks Machine Learning
PDF
Data Mesh Part 4 Monolith to Mesh
PDF
Pipelines and Data Flows: Introduction to Data Integration in Azure Synapse A...
PPTX
Introduction to Power BI to make smart decisions
PDF
Putting the Ops in DataOps: Orchestrate the Flow of Data Across Data Pipelines
PPTX
Apache NiFi- MiNiFi meetup Slides
PDF
Apache Camel v3, Camel K and Camel Quarkus
PPTX
Data Sharing with Snowflake
PPTX
Frame - Feature Management for Productive Machine Learning
PDF
Webinar Data Mesh - Part 3
PPTX
Data mesh
Databricks Fundamentals
Make your data AI ready with Microsoft Fabric and Azure Databricks pitch deck...
Flexible and Real-Time Stream Processing with Apache Flink
QlikView Tutorial For Beginners | What Is QlikView | Qlikview Tutorial | Qlik...
Getting started with BigQuery
Data Lakehouse, Data Mesh, and Data Fabric (r2)
Accelerate and modernize your data pipelines
Wix's ML Platform
ETL Made Easy with Azure Data Factory and Azure Databricks
What’s New with Databricks Machine Learning
Data Mesh Part 4 Monolith to Mesh
Pipelines and Data Flows: Introduction to Data Integration in Azure Synapse A...
Introduction to Power BI to make smart decisions
Putting the Ops in DataOps: Orchestrate the Flow of Data Across Data Pipelines
Apache NiFi- MiNiFi meetup Slides
Apache Camel v3, Camel K and Camel Quarkus
Data Sharing with Snowflake
Frame - Feature Management for Productive Machine Learning
Webinar Data Mesh - Part 3
Data mesh
Ad

Viewers also liked (7)

PDF
A Synopsis Of Qlik Sense Software
PDF
Wp what-makes-qlik view-unique-en
DOCX
Official Carlos Reid Biography
PPTX
Qlik Sense dashboard. Chapter 2. Advanced Training
PPTX
Qlik Dev Group - Hexagonal Binning
PPTX
Qlik Sense Dashboard. Get started.
PPSX
QlikView vs Qlik Sense
A Synopsis Of Qlik Sense Software
Wp what-makes-qlik view-unique-en
Official Carlos Reid Biography
Qlik Sense dashboard. Chapter 2. Advanced Training
Qlik Dev Group - Hexagonal Binning
Qlik Sense Dashboard. Get started.
QlikView vs Qlik Sense
Ad

Similar to Qlik sense- Technical Seminar (20)

PDF
Getting Started with Qlik Sense® Cloud: Understanding the Basics
PDF
Ds qlik-sense-desktop-en
PDF
Ds qlik-sense-desktop-en
PDF
DS-Qlik-Sense-Desktop-EN
PDF
Ds qlik-sense-desktop-en
PDF
Ds qlik-sense-desktop-en
PPTX
Qlik_Sensxcscde_Sales_Presentation1.pptx
PDF
Detalhes Técnicos do Qlik Sense
PDF
Associative analytics
PDF
Making the most of your Snowflake Investment
DOCX
Why Choose Helical Insight for Data Visualization and Business Intelligence.docx
PDF
Why Choose Helical Insight for Data Visualization and Business Intelligence.pdf
PPTX
Why Choose Helical Insight for Data Visualization and Business Intelligence.pptx
DOCX
Can You Build Dashboards Using Open Source Visualization Tool.docx
PPTX
Can You Build Dashboards Using Open Source Visualization Tool.pptx
PDF
Can You Build Dashboards Using Open Source Visualization Tool.pdf
PPTX
Qlikview Online Training in Hyderabad
PPTX
Qlikview Online Training in Hyderabad
DOCX
Helical Insight The Best Open Source Chat-Based Data Visualization Tool in 20...
PDF
Helical Insight The Best Open Source Chat-Based Data Visualization Tool in 20...
Getting Started with Qlik Sense® Cloud: Understanding the Basics
Ds qlik-sense-desktop-en
DS-Qlik-Sense-Desktop-EN
Ds qlik-sense-desktop-en
Qlik_Sensxcscde_Sales_Presentation1.pptx
Detalhes Técnicos do Qlik Sense
Associative analytics
Making the most of your Snowflake Investment
Why Choose Helical Insight for Data Visualization and Business Intelligence.docx
Why Choose Helical Insight for Data Visualization and Business Intelligence.pdf
Why Choose Helical Insight for Data Visualization and Business Intelligence.pptx
Can You Build Dashboards Using Open Source Visualization Tool.docx
Can You Build Dashboards Using Open Source Visualization Tool.pptx
Can You Build Dashboards Using Open Source Visualization Tool.pdf
Qlikview Online Training in Hyderabad
Helical Insight The Best Open Source Chat-Based Data Visualization Tool in 20...

Qlik sense- Technical Seminar

  • 2. INTRODUCTION Business these days depend heavily on analytics to answer questions about the performance of different aspects of their business. To see data you use partial views offered by query-based or hierarchical tools.
  • 3. Qlik Sense takes analytics to a new level of power and flexibility, so that everyone in your business is more informed and capable of acting and reacting faster based on how you view data This is a visualization tool, useful to see reports and dashboard. It extracts and plots data from your data base in the form of bar graphs, charts, tables and other smart visuals. Helps you analyse huge and complex data to answer your questions
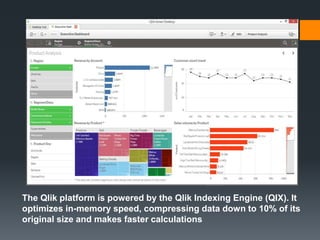
  • 4. The Qlik platform is powered by the Qlik Indexing Engine (QIX). It optimizes in-memory speed, compressing data down to 10% of its original size and makes faster calculations
  • 5. MAIN FEATURES  Cloud based application - Available for desktop, or cloud app, accessed anywhere  You can create your own customized reports to view specific charts  Helps you drill down more on the chart  Used by multiple industries- oHealthcare oManufacturing oCommunications oFinancial services oRetail oEnergy & utilities
  • 6. ADVANTAGES OF Qlik SENSE Faster, scalable analysis More exploration, less restrictions Mobile done right A rich platform to build on Can create your own dashboards
  • 8. Intuitive Use simple drag-and-drop interfaces to create flexible, interactive data visualizations. Explore data with smart visualizations that automatically adapts to the parameters you set — no need for developers, data scientists or designers. Smart Search Use natural search to navigate complex information to accelerate discovery.
  • 9. Self-service creation Drag-and-drop to create your own visualizations — without scripting, complex SQL queries, or joins. Centralized management Find and share relevant analyses, including apps and stories, through a centralized hub. Data integration Unify data sources for a complete view of information, without gaps, and make it easier to discover hidden insights. Secure Flexible security for data and content across all devices.