SlideShare a Scribd company logo
PROJECT CONCLUSION
1 Pending change request for new login screen Neel On Track
2
Tech Architecture needs alignment need to be
confirmed
Architect Concern
3 Customer impact assessment SME Delayed
4 Check the impact on delivery dates on other items Manager Concern
1 The business requirements have not been signed off. Shum On Track
2
The servers for the project have not been
commissioned
Support Concern
3 Business users for testing are not allowed Summer Delayed
4 Testing is not progressing as per the plan QA Lead Concern
5
On Track Concern Delayed
Task Meter
Milestones and Key Dates
Project Health Card
2
1
Development
complete
On Track 15-Dec
2 Testing Complete Concern 25-Dec
3 Planning for Change Delayed 23-Dec
4
5
1 Submit papers 12-Feb
2 Call helpdesk for Support ticket on Server H/W 12-Oct
3 Check system requirements 12-nov
4 Update Sponsor on budget changes 11-Dec
45
16
23
3
17
8
17
Neel
Kam
Zam
Sum
Sjum
Kum
Rum
Resource Work Load (Days)
Notes & To Do List
Open Actions and Change Requests
Top 5 Concerns (Risk or Issues)
Key Stakeholders Raj K, Sam Manh, Kim k, Zuhen Kahen, Mark Wall, Ruther Kem
Id Task Name Owner Start Date End Date Actual Forecast Duration Status
1 Analysis Neel 2-Oct 29-Oct 35 45 20
2 Testing Kam 10-Oct 26-Oct 20 25 12
3 Build Kam 12-Oct 15-Oct 78 75 4
4 QAT Zam 25-Oct 25-Oct 0 16 19
5 Performance Analysis Sjum 15-Oct 6-Nov 0 0 17
6 Team Reporting Sum 9-Nov 11-Nov 0 0 3
7 Generate Documentation Kum 22-Nov 1-Dec 0 0 8
8 Code Review Zam 2-Dec 7-Dec 0 0 4
9 Test Analysis Neel 10- Dec 23-Dec 0 0 10
10 Test Analysis Neel 5-Oct 23-Oct 0 53 15
11 Execute Rum 6-oct 27-Oct 0 44 16
12 Close project Rum 25-Dec 25-Dec 1 0 1
13
14
15
This covers the
overall project status
of different factors
associated with the
project, you can
alter them as per
your requirements
Project Dashboard
3
Primary Resources
Name Role
Sanjay H. Dev Lead & DBA
Joe Smith GUI Developer
Steve M. CU Developer
Amit K. API Developer
Jeff Wong GUI & API Developer
Melarie R. Graphic Artist
Philip R.S. QA Engineer
King Uber Project Sponsor
Tom the Grunt Project Manager
Objective
Primary
Manhattan Rollout
Main Focus
Usability improvements and new features, focusing on
more robust client/server architecture
Issues/ Risks
No current
risks identified
Key Discussion Items
Currently performing unit tests and validations of
primary architecture design concepts
Timeline
Milestone Start End Mar April May June July Aug
Project Charter Mar 1 …
Gather Requirements Mar 4 Mar 22
Design Discussions Mar 25 April 30
Primary Coding May 1 Aug 2
Testing Cycle Aug 5 Aug 16
Beta Release Aug 19 Aug 29
Roll out Aug 30 …
Project Status: Green
PROJECT: MANHATTAN
Complete
65%
This is a
representation of the
entire project in a gist
form capturing all the
important highlights of
the project. You can
alter this as per the
need
Performance Analysis
4
Actual project assignment, objectives and goals Ascertained results of the Project
Reasons & Causes of deviations & responsible
person
… … …
… … …
Planned Project Objective (Target) Actual Project Result (Actual) Deviation/ Cause
PROJECT NAME/ NO.
DATE <Date> PROJECT START <Date> PROJECT END <Date>
AUTHOR <Name 1> CLIENT <Name 2> PROJECT MANAGER <Name 3>
PROJECT MEMBERS <Name 4>, <Name 5>, <Name 6, …..>
This is an analysis
carried out to capture
the overall
performance of the
project and the
deviation between the
planned & actual
results
Deadlines/ Milestones
5
1.1 <Text> <Date> <Date>
Reasons & causes of
deviations & responsible
person
1.2 <Text> <Date> <Date>
…
1.3 <Text> <Date> <Date>
…
1.4 <Text> <Date> <Date>
…
1.5 <Text> <Date> <Date>
…
No. Date/ Milestone Date (Plan) Date (Actual) Deviations/ Cause
Your Text here
Project Name:
This is an analysis
carried out to capture
the milestones of the
project and the
deviation between the
planned & actual dates
of achieving the same
Budget/ Cost Analysis
6
Type of Cost Planned Costs Actual Costs Deviations/Causes
Staff Costs {internal} 00.000 00.000
Reasons and causes of deviations &
responsible person
Services {external} 00.000 00.000 …
Material 00.000 00.000 …
Travel Expenses 0.000 0.000 …
Advertising Expenses 0.000 0.000 …
Rent 0.000 0.000 …
Hardware 0.000 0.000 …
Software/ Licenses 0.000 0.000 …
Equipment 0.000 0.000 …
Other Costs 0.000 0.000 …
Total Costs 00.000 00.000 …
Track the actual &
planned cost involved
in the execution of the
project and also list
down the causes of
the deviations
Open Issues
7
Project Name:
No. TASK / DESCRIPTION DATE RESPONSIBLE
1.1 <Text> <Date> <Name>
1.2 <Text> <Date> <Name>
1.3 <Text> <Date> <Name>
Signature Client
01.01.18
Date Signature Project Manager
STILL PENDING ACTIVITIES / FOLLOW UPS
List down all the issues
which still needs to be
resolved in completing
the project and
mention the names of
people responsible in
resolving those issues
8
Coffee Break
This is a representative image, and should be replaced by
your own image. Just right click and replace image.
(11:00- 11:30)
9
Graph & charts
10
This slide is 100% editable. Adapt it to your needs and
capture your audience's attention.
Stacked Column
✓ Product 01
This slide is 100% editable. Adapt it to your needs and
capture your audience's attention.
✓ Product 02
30 40 60 80 100 120 140
180 200
80
110
140
170
206
230
260
270
370
0
50
100
150
200
250
300
350
400
450
500
550
600
FY 01 FY 02 FY 03 FY 04 FY 05 FY 06 FY 07 FY 08 FY 09
Dollars
(In
thousands)
Stacked Line With Markers
11
0
10
20
30
40
50
60
Task1 Task2 Task3 Task4 Task5 Task6 Task7 Task8 Task9 Task10 Task11 Task12
In
million
This graph/chart is linked to excel, and changes automatically based on data. Just left click on it and select “Edit Data”.
✓ Product 01
12
0 20 40 60 80 100
FY 01
FY 02
FY 03
FY 04 70%
55%
40%
30%
This slide is 100% editable. Adapt it to your needs and
capture your audience's attention.
Stacked Bar
✓ Product 01
This slide is 100% editable. Adapt it to your needs and
capture your audience's attention.
✓ Product 02
Combo Chart
13
0
1
2
3
4
5
6
7
8
9
10
$0
$10
$20
$30
$40
$50
$60
$70
$80
$90
$100
FYO1 FYO2 FYO3 FYO4 FYO5 FYO6 FYO7 FYO8
Sales
in
percentage
In
price
In years
This graph/chart is linked to excel, and changes automatically based on data. Just left click on it and select “Edit Data”.
✓ Product 01 ✓ Product 02 ✓ Product 03
14
0
1
2
3
4
5
6
7
8
9
10
FY01 FY02 FY03 FY04
In
percentage
Stacked Area-
Clustered Column
This slide is 100% editable. Adapt it to your needs and
capture your audience's attention.
✓ Product 01
This slide is 100% editable. Adapt it to your needs and
capture your audience's attention.
✓ Product 03
This slide is 100% editable. Adapt it to your needs and
capture your audience's attention.
✓ Product 02
Stacked Line Chart
15
0
10
20
30
40
50
60
70
80
FY 01 FY 02 FY 03 FY 04 FY 05 FY 06 FY 07 FY 08
In
millions
This slide is 100% editable. Adapt it to your needs and capture your audience's attention. This slide is 100% editable. Adapt it to your needs
and capture your audience's attention.
✓ Product 01 ✓ Product 02
16
0
5
10
15
20
25
30
35
05/02/2017
05/07/2017
05/12/2017
05/16/2017
05/22/2017
This graph/chart is linked to excel, and changes automatically based on
data. Just left click on it and select “Edit Data”.
This slide is 100% editable. Adapt it to your needs and
capture your audience's attention.
Radar Chart
✓ Product 01
This slide is 100% editable. Adapt it to your needs and
capture your audience's attention.
✓ Product 02
Volume High Low Close Chart
17
0
10
20
30
40
50
60
70
0
20
40
60
80
100
120
140
160
01/05/2017 01/06/2017 01/07/2017 01/08/2017 01/09/2017
Volume
Volume
High
Close
Low
This graph/chart is linked to excel, and changes automatically based on data. Just left click on it and select “Edit Data”.
✓ Product 01 ✓ Product 02
18
Additional Slides
19
19
Our Mission
This is a representative image, and
should be replaced by your own image.
Just right click and replace image.
Our Team
20
John Smith
Financial Manager
This slide is 100% editable.
Adapt it to your needs and
capture your audience's
attention.
Julie Hill
Marketing Manager
This slide is 100% editable.
Adapt it to your needs and
capture your audience's
attention.
Lilly William
Product Manager
This slide is 100% editable.
Adapt it to your needs and
capture your audience's
attention.
John Miles
Web Designer
This slide is 100% editable.
Adapt it to your needs and
capture your audience's
attention.
21
01
This slide is 100% editable. Adapt it
to your needs and capture your
audience's attention.
02
This slide is 100% editable. Adapt it
to your needs and capture your
audience's attention.
About Our
Company
✓ This is a representative image, and should be
replaced by your own image. Just right click and
replace image.
✓ This is a representative image, and should be
replaced by your own image. Just right click and
replace image.
Comparison
22
52%
Laptop User in 2017
This slide is 100% editable. Adapt
it to your needs and capture your
audience's attention.
65%
PC User in 2017
This slide is 100% editable. Adapt
it to your needs and capture your
audience's attention.
Mobile User in 2017
This slide is 100% editable. Adapt
it to your needs and capture your
audience's attention.
76%
Financial
23
Minimum
This slide is 100% editable. Adapt
it to your needs and capture your
audience's attention
60
%
This slide is 100% editable. Adapt
it to your needs and capture your
audience's attention
Medium
80
%
90
%
Maximum
This slide is 100% editable. Adapt
it to your needs and capture your
audience's attention
24
It’s not just about being better. It’s
about being different. You need to
give people a reason to choose your
business.
Tom Abbott
Dashboard
25
This slide is 100% editable.
Adapt it to your needs and
capture your audience's
attention.
80%
High
This slide is 100% editable.
Adapt it to your needs and
capture your audience's
attention.
65%
Medium
40%
Medium
This slide is 100% editable.
Adapt it to your needs and
capture your audience's
attention.
Location
26
USA
Montana
Texas
65%
This slide is 100% editable. Adapt it to
your needs and capture your
audience’s attention.
75%
This slide is 100% editable. Adapt it
to your needs and capture your
audience’s attention.
Our Goal
27
This slide is 100% editable. Adapt it to your needs and capture
your audience's attention.
This slide is 100% editable. Adapt it to your needs and capture
your audience's attention.
This slide is 100% editable. Adapt it to your needs and capture
your audience's attention.
This slide is 100% editable. Adapt it to your needs and capture
your audience's attention.
01
02
03
04
28
80%
90%
100%
95%
Mind Map
✓ This slide is 100% editable. Adapt it to your needs
and capture your audience's attention.
✓ This slide is 100% editable. Adapt it to your needs
and capture your audience's attention.
✓ This slide is 100% editable. Adapt it to your needs
and capture your audience's attention.
✓ This slide is 100% editable. Adapt it to your needs
and capture your audience's attention.
Magnifying Glass
29
This slide is 100% editable.
Adapt it to your needs and capture
your audience's attention.
This slide is 100% editable.
Adapt it to your needs and capture
your audience's attention.
This slide is 100% editable.
Adapt it to your needs and capture
your audience's attention.
30%
50%
100%
30
Thank You
Address
# street number, city, state
Contact Numbers:
0123456789
Email Address:
emailaddress@123.com

More Related Content

What's hot (7)

PPTX
Sazz
abhisek das
 
PPTX
Adaptive lighting system for automobiles
Md. Tasdikul Islam Khan
 
PPTX
Company Portfolio Example by i-pointing ltd.
i-pointing ltd.
 
PDF
LINE Chatbot - 活動報名報到設計分享
LINE Corporation
 
PDF
Doom Technical Review
Ali Salehi
 
PPTX
Intelligent traffic information and control system
SADEED AMEEN
 
PDF
Optical Transceivers for Datacom & Telecom 2020
Yole Developpement
 
Adaptive lighting system for automobiles
Md. Tasdikul Islam Khan
 
Company Portfolio Example by i-pointing ltd.
i-pointing ltd.
 
LINE Chatbot - 活動報名報到設計分享
LINE Corporation
 
Doom Technical Review
Ali Salehi
 
Intelligent traffic information and control system
SADEED AMEEN
 
Optical Transceivers for Datacom & Telecom 2020
Yole Developpement
 

Similar to Project Conclusion Powerpoint Presentation Slides (20)

PDF
Project Conclusion PowerPoint Presentation Slides
SlideTeam
 
PDF
Project Team Powerpoint Presentation Slides
SlideTeam
 
PDF
Change Management Budgeting Powerpoint Presentation Slides
SlideTeam
 
PDF
Change Management Budgeting PowerPoint Presentation Slides
SlideTeam
 
PDF
Engagement Summary PowerPoint Presentation Slides
SlideTeam
 
PDF
Suggestion Analysis PowerPoint Presentation Slides
SlideTeam
 
PDF
Change Management Financial Plan PowerPoint Presentation Slides
SlideTeam
 
PDF
New Product Overview PowerPoint Presentation Slides
SlideTeam
 
PDF
Success Metrics PowerPoint Presentation Slides
SlideTeam
 
PDF
Escalation Table PowerPoint Presentation Slides
SlideTeam
 
PDF
Project Budgeting PowerPoint Presentation Slides
SlideTeam
 
PDF
New Product Overview Powerpoint Presentation Slides
SlideTeam
 
PDF
Company Overview PowerPoint Presentation Slides
SlideTeam
 
PDF
Project Budgeting Powerpoint Presentation Slides
SlideTeam
 
PDF
Company Overview Powerpoint Presentation Slides
SlideTeam
 
PDF
Project Brief Summary PowerPoint Presentation Slides
SlideTeam
 
PDF
How to do agile roadmapping
Jeff Brantley
 
PDF
Product Idea Screening Overview PowerPoint Presentation Slides
SlideTeam
 
PDF
Product Launch Go To Market Strategy Powerpoint Presentation Slides
SlideTeam
 
PDF
Project Escalation Matrix PowerPoint Presentation Slides
SlideTeam
 
Project Conclusion PowerPoint Presentation Slides
SlideTeam
 
Project Team Powerpoint Presentation Slides
SlideTeam
 
Change Management Budgeting Powerpoint Presentation Slides
SlideTeam
 
Change Management Budgeting PowerPoint Presentation Slides
SlideTeam
 
Engagement Summary PowerPoint Presentation Slides
SlideTeam
 
Suggestion Analysis PowerPoint Presentation Slides
SlideTeam
 
Change Management Financial Plan PowerPoint Presentation Slides
SlideTeam
 
New Product Overview PowerPoint Presentation Slides
SlideTeam
 
Success Metrics PowerPoint Presentation Slides
SlideTeam
 
Escalation Table PowerPoint Presentation Slides
SlideTeam
 
Project Budgeting PowerPoint Presentation Slides
SlideTeam
 
New Product Overview Powerpoint Presentation Slides
SlideTeam
 
Company Overview PowerPoint Presentation Slides
SlideTeam
 
Project Budgeting Powerpoint Presentation Slides
SlideTeam
 
Company Overview Powerpoint Presentation Slides
SlideTeam
 
Project Brief Summary PowerPoint Presentation Slides
SlideTeam
 
How to do agile roadmapping
Jeff Brantley
 
Product Idea Screening Overview PowerPoint Presentation Slides
SlideTeam
 
Product Launch Go To Market Strategy Powerpoint Presentation Slides
SlideTeam
 
Project Escalation Matrix PowerPoint Presentation Slides
SlideTeam
 
Ad

More from SlideTeam (20)

PDF
Customer Support And Services Guide Powerpoint Presentation Slides
SlideTeam
 
PDF
Word Of Mouth WOM Marketing Strategies To Build Brand Awareness Powerpoint Pr...
SlideTeam
 
PDF
Strategic Staff Engagement Action Plan Powerpoint Presentation Slides
SlideTeam
 
PDF
Traditional Marketing Channel Analysis Powerpoint Presentation Slides Mkt Cd
SlideTeam
 
PDF
Integrating Asset Tracking System To Enhance Operational Effectiveness Comple...
SlideTeam
 
PDF
Designing And Implementing Brand Leadership Strategy Powerpoint Presentation ...
SlideTeam
 
PDF
How Amazon Generates Revenues Across Globe Powerpoint Presentation Slides Str...
SlideTeam
 
PDF
Guide For Effective Event Marketing Powerpoint Presentation Slides Mkt Cd
SlideTeam
 
PDF
Managing Business Customers Technology Powerpoint Presentation Slides
SlideTeam
 
PDF
Unearthing Apples Billion Dollar Branding Secret Powerpoint Presentation Slid...
SlideTeam
 
PDF
Developing Flexible Working Practices To Improve Employee Engagement Powerpoi...
SlideTeam
 
PDF
Product Corporate And Umbrella Branding Powerpoint Presentation Slides Brandi...
SlideTeam
 
PDF
Communication Channels And Strategies For Shareholder Engagement Powerpoint P...
SlideTeam
 
PDF
Responsible Tech Playbook To Leverage Business Ethics Powerpoint Presentation...
SlideTeam
 
PDF
Generating Leads Through Targeted Digital Marketing Campaign Powerpoint Prese...
SlideTeam
 
PDF
Boosting Profits With New And Effective Sales Strategic Plan Powerpoint Prese...
SlideTeam
 
PDF
ChatGPT IT Powerpoint Presentation Slides
SlideTeam
 
PDF
Methods To Implement Traditional Marketing Powerpoint Presentation Slides Mkt Cd
SlideTeam
 
PDF
Comprehensive Guide To Sports Marketing Strategy Powerpoint Presentation Slid...
SlideTeam
 
PDF
Global Shift Towards Flexible Working Powerpoint Presentation Slides
SlideTeam
 
Customer Support And Services Guide Powerpoint Presentation Slides
SlideTeam
 
Word Of Mouth WOM Marketing Strategies To Build Brand Awareness Powerpoint Pr...
SlideTeam
 
Strategic Staff Engagement Action Plan Powerpoint Presentation Slides
SlideTeam
 
Traditional Marketing Channel Analysis Powerpoint Presentation Slides Mkt Cd
SlideTeam
 
Integrating Asset Tracking System To Enhance Operational Effectiveness Comple...
SlideTeam
 
Designing And Implementing Brand Leadership Strategy Powerpoint Presentation ...
SlideTeam
 
How Amazon Generates Revenues Across Globe Powerpoint Presentation Slides Str...
SlideTeam
 
Guide For Effective Event Marketing Powerpoint Presentation Slides Mkt Cd
SlideTeam
 
Managing Business Customers Technology Powerpoint Presentation Slides
SlideTeam
 
Unearthing Apples Billion Dollar Branding Secret Powerpoint Presentation Slid...
SlideTeam
 
Developing Flexible Working Practices To Improve Employee Engagement Powerpoi...
SlideTeam
 
Product Corporate And Umbrella Branding Powerpoint Presentation Slides Brandi...
SlideTeam
 
Communication Channels And Strategies For Shareholder Engagement Powerpoint P...
SlideTeam
 
Responsible Tech Playbook To Leverage Business Ethics Powerpoint Presentation...
SlideTeam
 
Generating Leads Through Targeted Digital Marketing Campaign Powerpoint Prese...
SlideTeam
 
Boosting Profits With New And Effective Sales Strategic Plan Powerpoint Prese...
SlideTeam
 
ChatGPT IT Powerpoint Presentation Slides
SlideTeam
 
Methods To Implement Traditional Marketing Powerpoint Presentation Slides Mkt Cd
SlideTeam
 
Comprehensive Guide To Sports Marketing Strategy Powerpoint Presentation Slid...
SlideTeam
 
Global Shift Towards Flexible Working Powerpoint Presentation Slides
SlideTeam
 
Ad

Recently uploaded (20)

PPTX
美国学位证(OSU毕业证书)俄亥俄州立大学毕业证书如何办理
Taqyea
 
PDF
Digital Marketing Expert Training Program
marketing226932
 
PDF
JeevanCare Transforming Healthcare Interaction through UX/UI Design
YellowSlice1
 
PPTX
The Costly Mistakes Homeowners Make in Dining Room Renovations
anurag anand
 
PPTX
ArchitectingOnAWS_Module_13 goat bumrah i
m23aid005
 
PPTX
www ecommerce web based architecture.pptx
revathi148366
 
PPTX
6. PMES PORTFOLIO_PINK DESIGN_T1-TE_A4.pptx
GynnelNicanor1
 
PPTX
N-doped FSHC 2nrdddddddddddddddddrrrd.pptx
71762306019
 
PDF
Balance Your Home with These Vastu Tips!
https://homzinterio.in/
 
PDF
Design Social Change Creating Social Change
Eduardo Corrêa
 
PPTX
About Elizabethen and Heppel White furniture styles
Disha Agrawal
 
PPTX
QBDqbdqbdqbdqbdqbdqbdqbdqbdqbqdbqd .pptx
komoja3525
 
PPTX
CorelDRAW Graphics Suite 2021 Crack Free Version [Latest]
royeroye1122
 
PDF
IDES-502_Project-1-Home_Presentation-Boards_Codamon.pdf
codamona
 
PPTX
Presentationghjgghjhg (11)hcpckxgjt.pptx
ishafarikarbel
 
PPTX
原版一样(UCAM毕业证书)西班牙武康大学毕业证如何办理
Taqyea
 
PPTX
search engine optimization123244556.pptx
revathi148366
 
PDF
Sirisha .A Portfolio.
SirishaSiri487733
 
PDF
Introductory Plant Pathology Class Slides.pdf
tabishek325
 
PPTX
619813902-Fun-friday-Identify-Bollywood-movie-from-dialogues-deliver-the-dial...
in4withme
 
美国学位证(OSU毕业证书)俄亥俄州立大学毕业证书如何办理
Taqyea
 
Digital Marketing Expert Training Program
marketing226932
 
JeevanCare Transforming Healthcare Interaction through UX/UI Design
YellowSlice1
 
The Costly Mistakes Homeowners Make in Dining Room Renovations
anurag anand
 
ArchitectingOnAWS_Module_13 goat bumrah i
m23aid005
 
www ecommerce web based architecture.pptx
revathi148366
 
6. PMES PORTFOLIO_PINK DESIGN_T1-TE_A4.pptx
GynnelNicanor1
 
N-doped FSHC 2nrdddddddddddddddddrrrd.pptx
71762306019
 
Balance Your Home with These Vastu Tips!
https://homzinterio.in/
 
Design Social Change Creating Social Change
Eduardo Corrêa
 
About Elizabethen and Heppel White furniture styles
Disha Agrawal
 
QBDqbdqbdqbdqbdqbdqbdqbdqbdqbqdbqd .pptx
komoja3525
 
CorelDRAW Graphics Suite 2021 Crack Free Version [Latest]
royeroye1122
 
IDES-502_Project-1-Home_Presentation-Boards_Codamon.pdf
codamona
 
Presentationghjgghjhg (11)hcpckxgjt.pptx
ishafarikarbel
 
原版一样(UCAM毕业证书)西班牙武康大学毕业证如何办理
Taqyea
 
search engine optimization123244556.pptx
revathi148366
 
Sirisha .A Portfolio.
SirishaSiri487733
 
Introductory Plant Pathology Class Slides.pdf
tabishek325
 
619813902-Fun-friday-Identify-Bollywood-movie-from-dialogues-deliver-the-dial...
in4withme
 

Project Conclusion Powerpoint Presentation Slides

  • 2. 1 Pending change request for new login screen Neel On Track 2 Tech Architecture needs alignment need to be confirmed Architect Concern 3 Customer impact assessment SME Delayed 4 Check the impact on delivery dates on other items Manager Concern 1 The business requirements have not been signed off. Shum On Track 2 The servers for the project have not been commissioned Support Concern 3 Business users for testing are not allowed Summer Delayed 4 Testing is not progressing as per the plan QA Lead Concern 5 On Track Concern Delayed Task Meter Milestones and Key Dates Project Health Card 2 1 Development complete On Track 15-Dec 2 Testing Complete Concern 25-Dec 3 Planning for Change Delayed 23-Dec 4 5 1 Submit papers 12-Feb 2 Call helpdesk for Support ticket on Server H/W 12-Oct 3 Check system requirements 12-nov 4 Update Sponsor on budget changes 11-Dec 45 16 23 3 17 8 17 Neel Kam Zam Sum Sjum Kum Rum Resource Work Load (Days) Notes & To Do List Open Actions and Change Requests Top 5 Concerns (Risk or Issues) Key Stakeholders Raj K, Sam Manh, Kim k, Zuhen Kahen, Mark Wall, Ruther Kem Id Task Name Owner Start Date End Date Actual Forecast Duration Status 1 Analysis Neel 2-Oct 29-Oct 35 45 20 2 Testing Kam 10-Oct 26-Oct 20 25 12 3 Build Kam 12-Oct 15-Oct 78 75 4 4 QAT Zam 25-Oct 25-Oct 0 16 19 5 Performance Analysis Sjum 15-Oct 6-Nov 0 0 17 6 Team Reporting Sum 9-Nov 11-Nov 0 0 3 7 Generate Documentation Kum 22-Nov 1-Dec 0 0 8 8 Code Review Zam 2-Dec 7-Dec 0 0 4 9 Test Analysis Neel 10- Dec 23-Dec 0 0 10 10 Test Analysis Neel 5-Oct 23-Oct 0 53 15 11 Execute Rum 6-oct 27-Oct 0 44 16 12 Close project Rum 25-Dec 25-Dec 1 0 1 13 14 15 This covers the overall project status of different factors associated with the project, you can alter them as per your requirements
  • 3. Project Dashboard 3 Primary Resources Name Role Sanjay H. Dev Lead & DBA Joe Smith GUI Developer Steve M. CU Developer Amit K. API Developer Jeff Wong GUI & API Developer Melarie R. Graphic Artist Philip R.S. QA Engineer King Uber Project Sponsor Tom the Grunt Project Manager Objective Primary Manhattan Rollout Main Focus Usability improvements and new features, focusing on more robust client/server architecture Issues/ Risks No current risks identified Key Discussion Items Currently performing unit tests and validations of primary architecture design concepts Timeline Milestone Start End Mar April May June July Aug Project Charter Mar 1 … Gather Requirements Mar 4 Mar 22 Design Discussions Mar 25 April 30 Primary Coding May 1 Aug 2 Testing Cycle Aug 5 Aug 16 Beta Release Aug 19 Aug 29 Roll out Aug 30 … Project Status: Green PROJECT: MANHATTAN Complete 65% This is a representation of the entire project in a gist form capturing all the important highlights of the project. You can alter this as per the need
  • 4. Performance Analysis 4 Actual project assignment, objectives and goals Ascertained results of the Project Reasons & Causes of deviations & responsible person … … … … … … Planned Project Objective (Target) Actual Project Result (Actual) Deviation/ Cause PROJECT NAME/ NO. DATE <Date> PROJECT START <Date> PROJECT END <Date> AUTHOR <Name 1> CLIENT <Name 2> PROJECT MANAGER <Name 3> PROJECT MEMBERS <Name 4>, <Name 5>, <Name 6, …..> This is an analysis carried out to capture the overall performance of the project and the deviation between the planned & actual results
  • 5. Deadlines/ Milestones 5 1.1 <Text> <Date> <Date> Reasons & causes of deviations & responsible person 1.2 <Text> <Date> <Date> … 1.3 <Text> <Date> <Date> … 1.4 <Text> <Date> <Date> … 1.5 <Text> <Date> <Date> … No. Date/ Milestone Date (Plan) Date (Actual) Deviations/ Cause Your Text here Project Name: This is an analysis carried out to capture the milestones of the project and the deviation between the planned & actual dates of achieving the same
  • 6. Budget/ Cost Analysis 6 Type of Cost Planned Costs Actual Costs Deviations/Causes Staff Costs {internal} 00.000 00.000 Reasons and causes of deviations & responsible person Services {external} 00.000 00.000 … Material 00.000 00.000 … Travel Expenses 0.000 0.000 … Advertising Expenses 0.000 0.000 … Rent 0.000 0.000 … Hardware 0.000 0.000 … Software/ Licenses 0.000 0.000 … Equipment 0.000 0.000 … Other Costs 0.000 0.000 … Total Costs 00.000 00.000 … Track the actual & planned cost involved in the execution of the project and also list down the causes of the deviations
  • 7. Open Issues 7 Project Name: No. TASK / DESCRIPTION DATE RESPONSIBLE 1.1 <Text> <Date> <Name> 1.2 <Text> <Date> <Name> 1.3 <Text> <Date> <Name> Signature Client 01.01.18 Date Signature Project Manager STILL PENDING ACTIVITIES / FOLLOW UPS List down all the issues which still needs to be resolved in completing the project and mention the names of people responsible in resolving those issues
  • 8. 8 Coffee Break This is a representative image, and should be replaced by your own image. Just right click and replace image. (11:00- 11:30)
  • 10. 10 This slide is 100% editable. Adapt it to your needs and capture your audience's attention. Stacked Column ✓ Product 01 This slide is 100% editable. Adapt it to your needs and capture your audience's attention. ✓ Product 02 30 40 60 80 100 120 140 180 200 80 110 140 170 206 230 260 270 370 0 50 100 150 200 250 300 350 400 450 500 550 600 FY 01 FY 02 FY 03 FY 04 FY 05 FY 06 FY 07 FY 08 FY 09 Dollars (In thousands)
  • 11. Stacked Line With Markers 11 0 10 20 30 40 50 60 Task1 Task2 Task3 Task4 Task5 Task6 Task7 Task8 Task9 Task10 Task11 Task12 In million This graph/chart is linked to excel, and changes automatically based on data. Just left click on it and select “Edit Data”. ✓ Product 01
  • 12. 12 0 20 40 60 80 100 FY 01 FY 02 FY 03 FY 04 70% 55% 40% 30% This slide is 100% editable. Adapt it to your needs and capture your audience's attention. Stacked Bar ✓ Product 01 This slide is 100% editable. Adapt it to your needs and capture your audience's attention. ✓ Product 02
  • 13. Combo Chart 13 0 1 2 3 4 5 6 7 8 9 10 $0 $10 $20 $30 $40 $50 $60 $70 $80 $90 $100 FYO1 FYO2 FYO3 FYO4 FYO5 FYO6 FYO7 FYO8 Sales in percentage In price In years This graph/chart is linked to excel, and changes automatically based on data. Just left click on it and select “Edit Data”. ✓ Product 01 ✓ Product 02 ✓ Product 03
  • 14. 14 0 1 2 3 4 5 6 7 8 9 10 FY01 FY02 FY03 FY04 In percentage Stacked Area- Clustered Column This slide is 100% editable. Adapt it to your needs and capture your audience's attention. ✓ Product 01 This slide is 100% editable. Adapt it to your needs and capture your audience's attention. ✓ Product 03 This slide is 100% editable. Adapt it to your needs and capture your audience's attention. ✓ Product 02
  • 15. Stacked Line Chart 15 0 10 20 30 40 50 60 70 80 FY 01 FY 02 FY 03 FY 04 FY 05 FY 06 FY 07 FY 08 In millions This slide is 100% editable. Adapt it to your needs and capture your audience's attention. This slide is 100% editable. Adapt it to your needs and capture your audience's attention. ✓ Product 01 ✓ Product 02
  • 16. 16 0 5 10 15 20 25 30 35 05/02/2017 05/07/2017 05/12/2017 05/16/2017 05/22/2017 This graph/chart is linked to excel, and changes automatically based on data. Just left click on it and select “Edit Data”. This slide is 100% editable. Adapt it to your needs and capture your audience's attention. Radar Chart ✓ Product 01 This slide is 100% editable. Adapt it to your needs and capture your audience's attention. ✓ Product 02
  • 17. Volume High Low Close Chart 17 0 10 20 30 40 50 60 70 0 20 40 60 80 100 120 140 160 01/05/2017 01/06/2017 01/07/2017 01/08/2017 01/09/2017 Volume Volume High Close Low This graph/chart is linked to excel, and changes automatically based on data. Just left click on it and select “Edit Data”. ✓ Product 01 ✓ Product 02
  • 19. 19 19 Our Mission This is a representative image, and should be replaced by your own image. Just right click and replace image.
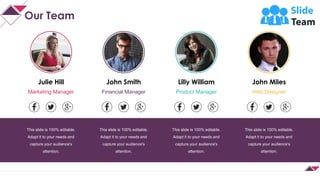
  • 20. Our Team 20 John Smith Financial Manager This slide is 100% editable. Adapt it to your needs and capture your audience's attention. Julie Hill Marketing Manager This slide is 100% editable. Adapt it to your needs and capture your audience's attention. Lilly William Product Manager This slide is 100% editable. Adapt it to your needs and capture your audience's attention. John Miles Web Designer This slide is 100% editable. Adapt it to your needs and capture your audience's attention.
  • 21. 21 01 This slide is 100% editable. Adapt it to your needs and capture your audience's attention. 02 This slide is 100% editable. Adapt it to your needs and capture your audience's attention. About Our Company ✓ This is a representative image, and should be replaced by your own image. Just right click and replace image. ✓ This is a representative image, and should be replaced by your own image. Just right click and replace image.
  • 22. Comparison 22 52% Laptop User in 2017 This slide is 100% editable. Adapt it to your needs and capture your audience's attention. 65% PC User in 2017 This slide is 100% editable. Adapt it to your needs and capture your audience's attention. Mobile User in 2017 This slide is 100% editable. Adapt it to your needs and capture your audience's attention. 76%
  • 23. Financial 23 Minimum This slide is 100% editable. Adapt it to your needs and capture your audience's attention 60 % This slide is 100% editable. Adapt it to your needs and capture your audience's attention Medium 80 % 90 % Maximum This slide is 100% editable. Adapt it to your needs and capture your audience's attention
  • 24. 24 It’s not just about being better. It’s about being different. You need to give people a reason to choose your business. Tom Abbott
  • 25. Dashboard 25 This slide is 100% editable. Adapt it to your needs and capture your audience's attention. 80% High This slide is 100% editable. Adapt it to your needs and capture your audience's attention. 65% Medium 40% Medium This slide is 100% editable. Adapt it to your needs and capture your audience's attention.
  • 26. Location 26 USA Montana Texas 65% This slide is 100% editable. Adapt it to your needs and capture your audience’s attention. 75% This slide is 100% editable. Adapt it to your needs and capture your audience’s attention.
  • 27. Our Goal 27 This slide is 100% editable. Adapt it to your needs and capture your audience's attention. This slide is 100% editable. Adapt it to your needs and capture your audience's attention. This slide is 100% editable. Adapt it to your needs and capture your audience's attention. This slide is 100% editable. Adapt it to your needs and capture your audience's attention. 01 02 03 04
  • 28. 28 80% 90% 100% 95% Mind Map ✓ This slide is 100% editable. Adapt it to your needs and capture your audience's attention. ✓ This slide is 100% editable. Adapt it to your needs and capture your audience's attention. ✓ This slide is 100% editable. Adapt it to your needs and capture your audience's attention. ✓ This slide is 100% editable. Adapt it to your needs and capture your audience's attention.
  • 29. Magnifying Glass 29 This slide is 100% editable. Adapt it to your needs and capture your audience's attention. This slide is 100% editable. Adapt it to your needs and capture your audience's attention. This slide is 100% editable. Adapt it to your needs and capture your audience's attention. 30% 50% 100%
  • 30. 30 Thank You Address # street number, city, state Contact Numbers: 0123456789 Email Address: [email protected]