SlideShare a Scribd company logo
Two New Uses for Payments Data in 
Applied Geographical Economics 
Micro and Macro Examples 
Joseph Potvin 
Chair, Management Education Working Group, Open Source Initiative (OSI) 
Founding Editor, The FLOW Syllabus 
President, Mobility Ottawa-Outaouais: Systems & Enterprises Inc. (Moose Inc.) 
Mobilité Outaouais-Ottawa: Systèmes & Entreprises Inc. 
Coordinator, ERA-ART: The Earth-Reserve Archetype (ERA) Developers Group 
Le Groupe de développeurs de l'Archétype d'une réserve de la Terre (ART) 
Doctoral Candidate, Université du Québec (DBA, Project Management) 
jpotvin@opman.ca 
Open Source 
Geospatial Foundation 
OSGeo-qc | OSGeo-Ottawa | LocationTech 
12-13 November 2014 | Gatineau 
Copyright 2014. Dual licensed CC-BY & GNU-FDL excluding graphics and charts attributed to others.
A Quick Introduction 
● Joseph Potvin 
● Doctoral Candidate, U Québec (DBA, Project Management) 
● M.Phil., Cambridge UK (Geographical Economics) 
● Hon BA, McGill (Economics); 
● Chair, Management Education Working Group, 
Open Source Initiative (Editor: “The FLOW Syllabus”); 
● Private sector work in 20 countries; 
● Six years on staff at Treasury Board Secretariat (expenditure 
analysis, strategic business design & cost control); 
● Previously contracted to various parts of The World Bank, and 
of sections of the International Development Research Centre; 
● Economist on drafting team for “Canada's Green Plan” (1990), 
(new fiscal instruments for ecological economics; extension of 
national accounts on ecosystem integrity, resource availability.
A Quick Introduction 
The Free/Libre/Open Way (FLOW)
A Quick Introduction 
APPLIED MICROECONOMICS 
Property-Powered Rail 
Open Development Model 
Dual Purpose: 
– Return on investment optimization in strategically 
located commercial and residential property; 
– Self-financing development of metropolitan transit 
systems and services based on unconstrained 
demand for metropolitan-scale mobility, and the 
market value of naturally constrained supply of 
property within walking distance of stations.
A Quick Introduction 
APPLIED MICROECONOMICS 
Mobility Ottawa-Outaouais: 
Systems & Enterprises Inc. 
● A federally-incorporated commercial firm (est. 2011); 
● Mission: To organize a consortium to bring about and operate a 
region-wide private-sector passenger railway service on 400 km 
of existing railway in the Greater National Capital Region, based 
on the Property-Powered Rail Open Development Model. 
Project 125 
● Identify property within walking distance of operational railway 
lines throughout Canada's Greater National Capital Region with 
potential for sustainable increases in revenue/asset value of at 
least 25 per cent as a verifiable result of direct access to 
integrated metropolitan-scale passenger railway services.
A Quick Introduction 
APPLIED MACROECONOMICS 
“Provide more flexibility for payers and payees 
to use multiple payment instruments”
A Quick Introduction 
APPLIED MACROECONOMICS 
Doctorat en administration - gestion de projet 
● Free/Libre/Open World Market Payment: From Project Cost 
Control Optimization to Macroeconomic Emergent Effects; 
● A project-centric agent-based computational economics 
research model to explore the potential for resolving some 
systemic problems by enabling choice in the six essential 
attributes of contractual payment. 
● Value-in-Exchange Benchmark Choices 
– Spot Currency Exchange Index (WM Reuters); 
– World Price Index (W. Coats); 
– Primary Commodities Index (B. Graham, N. Kaldor, L. Ussher, et.al.); 
– Global Equities Index (W. Engels, R. Pringle); 
– Earth Reserve Index (J. Potvin).
Real Property Value Optimization 
APPLIED MICROECONOMICS 
Property-Powered Rail 
Open Development Model
Consortium 
Agreement 
Supplier 
(e.g. fuel, 
Internet, etc.) 
Rail 
Access 
Leases 
Operating 
supplies 
Equipment 
& operation 
Fees 
Fees 
Advice 
analysis & 
assistance 
Train 
operators 
Rail access 
rights holders 
Professional 
service firms 
Marketing 
Expenses 
Transit Engineering 
analysis 
Cost-Effectiveness 
(Operational Expenses) 
The Property-Powered Rail 
Open Development Model 
CC-BY 4.0
Consortium 
Agreement 
Investments 
and loans 
Negotiated 
obligations 
Being part 
of the 
solution 
Municipal & 
Regional 
governments 
Member 
fees 
Private 
investors 
& lenders 
Affinity 
club 
members 
Return on Investment 
(Public/Private/Community Capital) 
Achievement of 
development 
objectives 
Loan 
Guarantees 
and Grants 
Aligned 
decisions 
The Property-Powered Rail 
Open Development Model 
CC-BY 4.0 
Aligned 
Decisions 
Fed- 
Prov/State 
governments
Consortium 
Agreement 
Investments 
and loans 
Negotiated 
obligations 
Being part 
of the 
solution 
Municipal & 
Regional 
governments 
Member 
fees 
Private 
investors 
& lenders 
Affinity 
club 
members 
Return on Investment 
(Public/Private/Community Capital) 
Achievement of 
development 
objectives 
Loan 
Guarantees 
and Grants 
Aligned 
decisions 
The Property-Powered Rail 
Open Development Model 
CC-BY 4.0 
Aligned 
Decisions 
Fed- 
Prov/State 
governments 
Required from Government: 
Aligned Decisions, Not Money
Consortium 
Agreement 
Negotiated 
revenue 
Business 
opportunity 
Negotiated 
revenue 
Comfortable 
safe, practical 
Negotiated 
revenue 
Statistical transportation 
increase 
in market 
value 
Station 
owners 
Enhanced travel 
experience 
Travellers 
Day trippers 
Frequent 
travellers 
Land/Property 
owners & 
developers 
Kiosk/Site 
provider 
Partner 
entities 
Passenger 
experience 
services 
Service 
sales 
Services 
Ancillary 
service 
providers 
Package 
transport 
links 
Marketable 
information 
services 
Food & 
beverage 
i 
Value-for-Money 
(Operating Revenue) 
License & 
Validation 
Business 
opportunity 
Negotiated 
revenue 
Insight Fees 
Research 
& planning 
clients 
Pay what 
you want 
The Property-Powered Rail 
Open Development Model 
CC-BY 4.0
Consortium 
Agreement 
Negotiated 
revenue 
Business 
opportunity 
Negotiated 
revenue 
Comfortable 
safe, practical 
Negotiated 
revenue 
Statistical transportation 
increase 
in market 
value 
Station 
owners 
Enhanced travel 
experience 
Travellers 
Day trippers 
Frequent 
travellers 
Land/Property 
owners & 
developers 
Kiosk/Site 
provider 
Partner 
entities 
Passenger 
experience 
services 
Service 
sales 
Services 
Ancillary 
service 
providers 
Package 
transport 
links 
Marketable 
information 
services 
Food & 
beverage 
i 
Value-for-Money 
(Operating Revenue) 
License & 
Validation 
Business 
opportunity 
Negotiated 
revenue 
Insight Fees 
Research 
& planning 
clients 
Pay what 
you want 
The Property-Powered Rail 
Open Development Model 
CC-BY 4.0 
25% + 
increase 
in market 
value
Source: Robert Dorion, P.Eng., MBA 
President, Knowledge Management 
Research, Valuation & Advisory, Altus Group Limited
Placement of Stations 
APPLIED MICROECONOMICS 
● Demand for mobility relatively high; 
● Supply of property “within walking distance” 
of a limited number of railway stations relatively low; 
● Data show value effect between –10% and +35%; 
● Both commercial and residential properties; 
● Stations can be located where income & asset values 
would likely increase by at least +25%; 
− Based on market analysis; 
− Assuming normal business risk; 
− Contingent on all usual governance rules, processes.
Placement of Stations 
APPLIED MICROECONOMICS 
● Value linkage greatest when railway development 
and property development are fully integrated; 
● Price competition begins with announcement that a 
station will be developed, in anticipation of service; 
● Owners earn more, even if they never use the train; 
● Percentage of value increase allocated to a 
“train-stopping fee” in the consortium agreement; 
● The consortium of property owners run their own 
railway business: THEY determine the optimal fee; 
● Requires optimization modeling.
REQ: Geospatial Multi-Agent Simulation 
FREE/LIBRE/OPEN SOURCE TRANSPORTATION 
SIMULATION AND VALIDATION SOFTWARE 
● Multi-Agent Transport Simulation 
http://www.matsim.org/
REQ: Geospatial Multi-Agent Simulation 
FREE/LIBRE/OPEN SOURCE TRANSPORTATION 
SIMULATION AND VALIDATION SOFTWARE 
● Multi-Agent Transport Simulation 
http://www.matsim.org/ 
● New Requirement: 
Add extensions for property 
value effects and optimization 
analysis based on empirical 
data from the regional market 
and from comparison markets.
REQ: Geospatial Mobility Data 
FREE/LIBRE/OPEN DATA + STRUCTURED MANAGEMENT 
● Whole-region anonymous travel data from mobile devices 
– Live data streaming via the WAZE platform 
http://www.waze.com/livemap/ 
– Historical data on main transportation arteries 
purchased from participating telecom companies (?) 
– Disclosure Control Resource Centre, Statistics Canada 
http://www.statcan.gc.ca/pub/12-539-x/2009001/control-controle- 
eng.htm 
– TravelR for ad hoc travel demand modeling 
https://r-forge.r-project.org/projects/travelr/ 
● Polarsys for Long-Term Life-Cycle Management 
http://polarsys.org/
http://openrailproperty.org 
Lieu de l'événement : 
Université du Québec en Outaouais (UQO), Pavillon C, Salle C0072 
283, boul Alexandre-Taché, Gatineau, Québec
GREENING TRANSIT
Real Trains, Real Tracks, Real Property 
APPLIED MICROECONOMICS
The Greater National Capital Region 
400 KM OF EXISTING RAILWAY INFRASTRUCTURE 
Montebello, QC 
La Pêche, QC 
(Wakefield) 
Bristol, QC 
Arnprior ON 
Smiths Falls, ON 
Alexandria, ON
The Greater National Capital Region 
400 KM OF EXISTING RAILWAY + OTTAWA LRT (STAGES 1&2) 
Montebello, QC 
La Pêche, QC 
(Wakefield) 
Bristol, QC 
Arnprior ON 
Smiths Falls, ON 
Alexandria, ON
The Greater National Capital Region 
Montebello, QC 
WHERE DO YOU LIVE? WORK? PLAY? 
La Pêche, QC 
(Wakefield) 
Freeman 
Lac Leamy Gréber 
Papineauville 
Plaisance 
Quyon 
Fitzroy 
Bayview CarleTtroenmblay 
Arnprior ON Casselman 
Terry 
Fox 
Smiths Falls, ON 
UQO/Taché 
Lorrain 
Navan 
March Rd. 
Urban Ottawa-Gatineau 
Rural & Semi-Rural 
Chelsea Masson 
Thurso 
Farm Point 
Vars 
Limoges 
Kinburn 
Blair 
Maxville 
Alexandria, ON 
Bells 
Corners 
Barrhaven 
Richmond 
Bristol, QC 
Tunney's Greenboro 
Merivale
PAYMENTS DATA 
From Geographical Microeconomics 
To Geographical Macroeconomics
Tweaking the Global Payments System 
APPLIED MACROECONOMICS 
Est. October 2014 
“Provide more flexibility for payers and payees 
to us e mu ltiple payment instrume nts”
Tweaking the Global Payments System 
APPLIED MACROECONOMICS 
“Discuss, research, prototype, create working systems 
... that allow people on the Web to send each other money 
as easily as they exchange instant messages and email today”
Choice in All Attributes of Payment 
APPLIED MACROECONOMICS 
Doctorat en administration - gestion de projet 
“work in progress” 
● Free/Libre/Open World Market Payment: 
From Project Cost Control Optimization to 
Macroeconomic Emergent Effects; 
● Algorithmic pricing with 
choice of value benchmark 
● Earth Reserve benchmark 
● Free/libre/open software: ERA-ART 
– Earth-Reserve Archetype (ERA) 
– l'Archétype d'une réserve de la terre (ART)
We're accustomed to perceiving 
country boundaries this way
The geography of each country is really 
defined by its “Exclusive Economic Zone” 
The geospatial boundaries of countries extend 
200 nautical miles beyond their shorelines.
The geography of each country is really 
defined by its “Exclusive Economic Zone” 
Source: http://td-architects.eu/projects/show/exclusive-economic-zone/
We're accustomed to perceiving 
national currencies this way 
Source: http://i.imgur.com/LIRDh.jpg
The geospatial boundaries of currencies 
overlap through trade relationships. 
Example: Italy 
2010 Imports 
Darker shade 
means greater 
proportion of 
Intermediary's 
currency in trade 
43.4% Intermediary's currency 
36.6% Importer's currency (€) 
20.0% Exporter's currency 
Source: Luigi Ventura and Mark David Witte. 2011. "An Empirical Examination of the Currency Denomination of Trade" 
https://editorialexpress.com/cgi-bin/conference/download.cgi?db_name=MWITFall2011&paper_id=70
The geospatial boundaries of currencies 
overlap through trade relationships. 
Example: Italy 
2010 Exports 
Darker shade 
means greater 
proportion of 
Intermediary's 
currency in trade 
19.6% Intermediary's currency 
7.7% Importer's currency 
72.2% Exporter's currency (€) 
Source: Luigi Ventura and Mark David Witte. 2011. "An Empirical Examination of the Currency Denomination of Trade" 
https://editorialexpress.com/cgi-bin/conference/download.cgi?db_name=MWITFall2011&paper_id=70
The geospatial boundaries of currencies 
overlap through trade relationships. 
Let's use the geospatial density of currency 
as a meaningful weighting factor for... 
Darker shade 
means greater 
proportion of 
Intermediary's 
currency in trade 
Source: Luigi Ventura and Mark David Witte. 2011. "An Empirical Examination of the Currency Denomination of Trade" 
https://editorialexpress.com/cgi-bin/conference/download.cgi?db_name=MWITFall2011&paper_id=70
Attribution for Frequency & Severity of 
Surface Temperature Anomalies 
Source: http://earthobservatory.nasa.gov/GlobalMaps/
Attribution for Positive & Negative 
Trends in Major Pollutants 
Source: http://earthobservatory.nasa.gov/GlobalMaps/
ERA-ART Associates Biophysical Change 
with Global Economic Activity, By Currency 
The Earth Reserve System 
uses currency composition of 
trade as a weighting factor to 
proportionately attribute 
biophysical changes in global 
ecosystem integrity, in a 
particular way, to the 
economic activity paid in 
each currency. 
Example: Near Infrared 
Reflectivity. Changes to remote 
sensing data on surface thermal 
reflectivity in Band 4 (Near 
Infrared 0.77-0.90 μm) reveal 
changes to biomass content.
ERA-ART Associates Biophysical Change 
with Global Economic Activity, By Currency 
Challenge: How might we represent 
the distributional density of multiple 
currencies at the same time? 
Darker shade 
means greater 
proportion of 
Intermediary's 
currency in trade 
$ € ¥ 
Source: Luigi Ventura and Mark David Witte. 2011. "An Empirical Examination of the Currency Denomination of Trade" 
https://editorialexpress.com/cgi-bin/conference/download.cgi?db_name=MWITFall2011&paper_id=70
Source: http://commons.wikimedia.org/wiki/File:Farbkreis_mit_CMYK-Werten.svg 
C.M.Y.K 
0.30.80.0
ERA-ART 
software will 
use BIS or IMF 
data on global 
payments 
(currency of 
invoicing) 
density to 
maintain EEZ-bounded 
frequency 
distributions 
as relative 
weights 0-100. 
Also, visually 
illustrate up 
to three 
currencies at 
a time: 
Assign C,M,Y 
K ≡ all others 
0 30 
0.30.80.0 
80 0
ERA-ART 
Hypothetical 
4-Currency Model 
C, M, Y and 
K≡All Others) 
(Note: This map's colours 
were assigned randomly.)
ERA-ART 
Hypothetical 
4-Currency Model 
C, M, Y and 
K≡All Others) 
(Note: This map's colours 
were assigned randomly.)
€ ¥ $ ¤
ERA-ART Associates Biophysical Change 
with Global Economic Activity, By Currency 
Exclusive Economic Zones 
Scientifically Verifiable Data 
On Ecosystems & Resources 
Currency Weighting System for the 
Earth Reserve Value Benchmark 
Auditable Data on the 
Currency of Payments
Choice in All Attributes of Payment 
APPLIED MACROECONOMICS 
Doctorat en administration - gestion de projet 
“work in progress” 
● Free/Libre/Open World Market Payment: 
From Project Cost Control Optimization to 
Macroeconomic Emergent Effects; 
● Relative resource/ecosystem 
degradation in a given 
currency's region of use, 
compared with the base year, will 
cause prices in that currency to become more 
expensive against prices in other currencies. 
● In general, jobs and export-oriented investment 
will be attracted towards currency zones where 
ecosystem integrity and resource availability are 
relatively improved from a base year.
CONNECTING 
Geographical Macroeconomics 
& 
Geographical Microeconomics
Carbon Emission Reduction 
CONNECTING THE MACRO AND THE MICRO 
Adapted from land-use supplied by the National 
Capital Commission Adapté d'une carte fournis 
par la Commission
Carbon Emission Reduction 
CONNECTING THE MACRO AND THE MICRO 
One Double-Deck Railway Coach: 
● 75 cars reduced from the roads (100 seated people) 
● 60 km return semi-rural terminus to downtown 
● 120 grams of carbon emission per km car traveller 
(× 1/1,000,000 because 1 metric tonne is a million grams) 
● 60 grams of carbon emission per km per diesel train 
traveller (× 1/1,000,000)
Carbon Emission Reduction 
CONNECTING THE MACRO AND THE MICRO 
75×60×(120-60)× 1/1,000,000 = 0.27 tonnes 
● More than a quarter tonne of net carbon 
emission reduction per coach, per trip 
between each semi-rural terminus and 
downtown Ottawa/Gatineau.
Carbon Emission Reduction 
CONNECTING THE MACRO AND THE MICRO 
18 return trips per day (service from 6 am to 11 pm) 
● 0.27×18 = 5 tonnes carbon emission reduction. 
...that's per coach, per day!
Carbon Emission Reduction 
CONNECTING THE MACRO AND THE MICRO 
3 coaches minimum per train 
18 trains per day (service from 6 am to 11 pm) 
● 5×3 = 15 tonnes carbon reduction. 
...that's per line, per day!
Carbon Emission Reduction 
CONNECTING THE MACRO AND THE MICRO 
6 lines radiate from downtown Ottawa/Gatineau 
● 15×6 = 90 tonnes of net carbon emission reduction 
per day for a 30 km radius from downtown. 
That's more than the 
weight capacity of three 
20' shipping containers.
Carbon Emission Reduction 
CONNECTING THE MACRO AND THE MICRO 
250 working days per year, 25 km radius 
90×250 = 22,500 tonnes of net 
carbon emission reduction per year. 
... not counting weekends & holidays.
Carbon Emission Reduction 
CONNECTING THE MACRO AND THE MICRO 
250 working days per year, 25 km radius 
90×250 = 22,500 tonnes of net 
carbon emission reduction per year. 
The Oceanex Connaigra 
The largest Canadian container 
ship can carry up to 19,500 tonnes, by comparison.
Carbon Emission Reduction 
CONNECTING THE MACRO AND THE MICRO 
Suppose these trains are running half empty... 
250 working days per year, 30 km radius 
22,500×(1/2) = 11,250 tonnes of net 
carbon emission reduction per year. 
... still, not counting weekends & holidays.
Carbon Emission Reduction 
CONNECTING THE MACRO AND THE MICRO 
Suppose these trains are running full capacity... 
250 working days per year, 25 km radius 
22,500×(1.5) = 33,750 tonnes of net 
carbon emission reduction per year. 
$20 per tonne carbon offset price gives: $675,000
Two New Uses for Payments Data in 
Applied Geographical Economics 
Micro and Macro Examples 
Joseph Potvin 
Chair, Management Education Working Group, Open Source Initiative (OSI) 
Founding Editor, The FLOW Syllabus 
President, Mobility Ottawa-Outaouais: Systems & Enterprises Inc. (Moose Inc.) 
Mobilité Outaouais-Ottawa: Systèmes & Entreprises Inc. 
Coordinator, ERA-ART: The Earth-Reserve Archetype (ERA) Developers Group 
Le Groupe de développeurs de l'Archétype d'une réserve de la Terre (ART) 
Doctoral Candidate, Université du Québec (DBA, Project Management) 
jpotvin@opman.ca 
Open Source 
Geospatial Foundation 
OSGeo-qc | OSGeo-Ottawa | LocationTech 
12-13 November 2014 | Gatineau 
Copyright 2014. Dual licensed CC-BY & GNU-FDL excluding graphics and charts attributed to others.

More Related Content

PDF
Rail brochure 2014
PPTX
The need for a multi-faceted appraisal framework for major public transport i...
PDF
Accelerating Operational Excellence in 2015: Optimize Manufacturing Processes...
PPTX
Smartcard and Information Programme (METRO)
PDF
F&S Rail Consulting Brochure 2017
PPTX
Cleveland Peer Exchange - Euclid Corridor Transformation
PPTX
The importance of Value of Time studies - a Dutch perspective
PPTX
Rail brochure 2014
The need for a multi-faceted appraisal framework for major public transport i...
Accelerating Operational Excellence in 2015: Optimize Manufacturing Processes...
Smartcard and Information Programme (METRO)
F&S Rail Consulting Brochure 2017
Cleveland Peer Exchange - Euclid Corridor Transformation
The importance of Value of Time studies - a Dutch perspective

What's hot (20)

PPTX
Big Data in Shift2Rail: Connective and in2Stempo projects
PPTX
The number 36 bus route - innovation in public transport
PPT
How can Open Data Revolutionise your Rail Travel?
PPTX
TransportAPI outline Jan 2015
PDF
Container Terminal Development on the Continent: Africa Perspective
 
PDF
Miami-Dade Accessibility Based Needs Assessment presentation
PPTX
Mobility Pricing: How to Harness Mobility Pricing to Reduce Congestion, Promo...
 
PPT
DDMA / Mapscape: Datakwaliteit
PDF
Stations as Places - designing & planning rail stations
PPTX
Transport api smartertravel-2015 v2
PDF
F&S verizon rail whitepaper
PPT
Disruptive open transport data
PDF
RTPI 2013 Julie Williams
PDF
GST – An End-to-end Architecture for Automotive Telematics Services - Peter V...
PDF
Horizon2020 Project “CITADEL” and the relevance for eGovernment Action Plan 2...
PDF
Peter Stoeveken-CV-2015
PDF
Big Data and Intel® Intelligent Systems Solution for Intelligent transportation
PPTX
PDF
Sss14duke BT Innovate Research Design
PDF
RTPI 2013 David Hytch
Big Data in Shift2Rail: Connective and in2Stempo projects
The number 36 bus route - innovation in public transport
How can Open Data Revolutionise your Rail Travel?
TransportAPI outline Jan 2015
Container Terminal Development on the Continent: Africa Perspective
 
Miami-Dade Accessibility Based Needs Assessment presentation
Mobility Pricing: How to Harness Mobility Pricing to Reduce Congestion, Promo...
 
DDMA / Mapscape: Datakwaliteit
Stations as Places - designing & planning rail stations
Transport api smartertravel-2015 v2
F&S verizon rail whitepaper
Disruptive open transport data
RTPI 2013 Julie Williams
GST – An End-to-end Architecture for Automotive Telematics Services - Peter V...
Horizon2020 Project “CITADEL” and the relevance for eGovernment Action Plan 2...
Peter Stoeveken-CV-2015
Big Data and Intel® Intelligent Systems Solution for Intelligent transportation
Sss14duke BT Innovate Research Design
RTPI 2013 David Hytch
Ad

Similar to Requirements for Geospatial Agent Simulation to Strengthen the 'Property-Powered Rail' Open Development Model (20)

PDF
Hyperconnected Travel and Transport in Action
PPTX
apidays LIVE Australia 2020 - Open Data Architecture in Mobility as a Service...
PDF
PTOLEMUS in a nutshell
PDF
Transport for London - Using Data to Keep London Moving
PPTX
Integrated Transport Competition - In field solutions elevator pitches (3 of 3)
PPTX
Smart City: A Call for a Shift in Mindset
PDF
The role of open data in driving sustainable mobility in nine smart cities
PDF
Keynote - OSGi as an Evolutionary Precursor for the Connected Vehicle - Darwi...
PDF
Connected Mobility Global Forecast 2016: findings and presentation
PDF
Opportunities for VAS in the mobility pricing market
PDF
Parkofon Introduction
PDF
Justin jenk theory and practice taxi wars uber_ raktas_case study_march 2015
PPT
Seg Fest Presentation
PDF
Inter-modal Transport Data Sharing in Hong Kong: Use Case Development Workshop
PDF
Multimodal in rail development: popularity and reaping benefits
PDF
Smart Cities and Smarter Transport: Urban mobility and access in the ICT-era
PPSX
BDE_SC4_WS3_4_Victor Corral - AutoMat Project
PPTX
Transit Oriented Development.
PPTX
Smart Mobility
PPTX
The Open Transport Initiative "Munch & Learn" presentation to Rail Innovation...
Hyperconnected Travel and Transport in Action
apidays LIVE Australia 2020 - Open Data Architecture in Mobility as a Service...
PTOLEMUS in a nutshell
Transport for London - Using Data to Keep London Moving
Integrated Transport Competition - In field solutions elevator pitches (3 of 3)
Smart City: A Call for a Shift in Mindset
The role of open data in driving sustainable mobility in nine smart cities
Keynote - OSGi as an Evolutionary Precursor for the Connected Vehicle - Darwi...
Connected Mobility Global Forecast 2016: findings and presentation
Opportunities for VAS in the mobility pricing market
Parkofon Introduction
Justin jenk theory and practice taxi wars uber_ raktas_case study_march 2015
Seg Fest Presentation
Inter-modal Transport Data Sharing in Hong Kong: Use Case Development Workshop
Multimodal in rail development: popularity and reaping benefits
Smart Cities and Smarter Transport: Urban mobility and access in the ICT-era
BDE_SC4_WS3_4_Victor Corral - AutoMat Project
Transit Oriented Development.
Smart Mobility
The Open Transport Initiative "Munch & Learn" presentation to Rail Innovation...
Ad

More from VisionGEOMATIQUE2014 (20)

PDF
Géomatique appliquée : revue des solutions novatrices mises en place en 2014
PDF
Indoor location with the Bluetooth Low Energy standard
PPT
ScribeUI: La productivité avec MapServer
PPTX
Fast, Distributed Geoprocessing with Scala, Spark and GeoTrellis
PDF
OpenGL ES pour le développement d’applications géospatiales sur Android
PDF
Accès ouvert aux données météorologiques d’Environnement Canada
PDF
LocationTech Data Commons
PPT
TDW FOSS GEO-STACK FOR MINERAL EXPLORATION
PPTX
Spatial Data processing with Hadoop
PPTX
Solution Geoctopus : améliorations et défis
PPTX
Infrastructure de géomatique ouverte (IGO) : un modèle inspirant de développe...
PPTX
GeoMesa: Scalable Geospatial Analytics
ODP
Montrajet.ca : une solution multimodale de covoiturage et de planification d'...
PPTX
Automatisation de la cartographie et de l'analyse des données de comptage de ...
PPT
MACHINE LEARNING FOR SATELLITE-GUIDED WATER QUALITY MONITORING
PPTX
Les contributions de la géomatique au développement de la ville intelligente
PPTX
SIGim la plateforme adaptée à la gestion municipale
PPTX
Optimisation et analyse des parcours de déneigement à la Ville de Shawinigan
PDF
AutoTri, une application automatisant l’analyse du stationnement de l’arrondi...
PPTX
JMap 6.0 : une solution complète et évolutive pour l'intégration, la diffusio...
Géomatique appliquée : revue des solutions novatrices mises en place en 2014
Indoor location with the Bluetooth Low Energy standard
ScribeUI: La productivité avec MapServer
Fast, Distributed Geoprocessing with Scala, Spark and GeoTrellis
OpenGL ES pour le développement d’applications géospatiales sur Android
Accès ouvert aux données météorologiques d’Environnement Canada
LocationTech Data Commons
TDW FOSS GEO-STACK FOR MINERAL EXPLORATION
Spatial Data processing with Hadoop
Solution Geoctopus : améliorations et défis
Infrastructure de géomatique ouverte (IGO) : un modèle inspirant de développe...
GeoMesa: Scalable Geospatial Analytics
Montrajet.ca : une solution multimodale de covoiturage et de planification d'...
Automatisation de la cartographie et de l'analyse des données de comptage de ...
MACHINE LEARNING FOR SATELLITE-GUIDED WATER QUALITY MONITORING
Les contributions de la géomatique au développement de la ville intelligente
SIGim la plateforme adaptée à la gestion municipale
Optimisation et analyse des parcours de déneigement à la Ville de Shawinigan
AutoTri, une application automatisant l’analyse du stationnement de l’arrondi...
JMap 6.0 : une solution complète et évolutive pour l'intégration, la diffusio...

Recently uploaded (20)

PPTX
PA Analog/Digital System: The Backbone of Modern Surveillance and Communication
PDF
Advanced methodologies resolving dimensionality complications for autism neur...
PDF
KodekX | Application Modernization Development
PDF
Sensors and Actuators in IoT Systems using pdf
PDF
Transforming Manufacturing operations through Intelligent Integrations
PPTX
Understanding_Digital_Forensics_Presentation.pptx
PDF
Per capita expenditure prediction using model stacking based on satellite ima...
PDF
NewMind AI Monthly Chronicles - July 2025
PDF
Spectral efficient network and resource selection model in 5G networks
PPTX
MYSQL Presentation for SQL database connectivity
PDF
Modernizing your data center with Dell and AMD
PDF
CIFDAQ's Market Insight: SEC Turns Pro Crypto
PDF
Advanced IT Governance
PDF
Peak of Data & AI Encore- AI for Metadata and Smarter Workflows
PDF
madgavkar20181017ppt McKinsey Presentation.pdf
PDF
How Onsite IT Support Drives Business Efficiency, Security, and Growth.pdf
PDF
GamePlan Trading System Review: Professional Trader's Honest Take
PDF
Diabetes mellitus diagnosis method based random forest with bat algorithm
PDF
Dropbox Q2 2025 Financial Results & Investor Presentation
PPTX
VMware vSphere Foundation How to Sell Presentation-Ver1.4-2-14-2024.pptx
PA Analog/Digital System: The Backbone of Modern Surveillance and Communication
Advanced methodologies resolving dimensionality complications for autism neur...
KodekX | Application Modernization Development
Sensors and Actuators in IoT Systems using pdf
Transforming Manufacturing operations through Intelligent Integrations
Understanding_Digital_Forensics_Presentation.pptx
Per capita expenditure prediction using model stacking based on satellite ima...
NewMind AI Monthly Chronicles - July 2025
Spectral efficient network and resource selection model in 5G networks
MYSQL Presentation for SQL database connectivity
Modernizing your data center with Dell and AMD
CIFDAQ's Market Insight: SEC Turns Pro Crypto
Advanced IT Governance
Peak of Data & AI Encore- AI for Metadata and Smarter Workflows
madgavkar20181017ppt McKinsey Presentation.pdf
How Onsite IT Support Drives Business Efficiency, Security, and Growth.pdf
GamePlan Trading System Review: Professional Trader's Honest Take
Diabetes mellitus diagnosis method based random forest with bat algorithm
Dropbox Q2 2025 Financial Results & Investor Presentation
VMware vSphere Foundation How to Sell Presentation-Ver1.4-2-14-2024.pptx

Requirements for Geospatial Agent Simulation to Strengthen the 'Property-Powered Rail' Open Development Model

  • 1. Two New Uses for Payments Data in Applied Geographical Economics Micro and Macro Examples Joseph Potvin Chair, Management Education Working Group, Open Source Initiative (OSI) Founding Editor, The FLOW Syllabus President, Mobility Ottawa-Outaouais: Systems & Enterprises Inc. (Moose Inc.) Mobilité Outaouais-Ottawa: Systèmes & Entreprises Inc. Coordinator, ERA-ART: The Earth-Reserve Archetype (ERA) Developers Group Le Groupe de développeurs de l'Archétype d'une réserve de la Terre (ART) Doctoral Candidate, Université du Québec (DBA, Project Management) [email protected] Open Source Geospatial Foundation OSGeo-qc | OSGeo-Ottawa | LocationTech 12-13 November 2014 | Gatineau Copyright 2014. Dual licensed CC-BY & GNU-FDL excluding graphics and charts attributed to others.
  • 2. A Quick Introduction ● Joseph Potvin ● Doctoral Candidate, U Québec (DBA, Project Management) ● M.Phil., Cambridge UK (Geographical Economics) ● Hon BA, McGill (Economics); ● Chair, Management Education Working Group, Open Source Initiative (Editor: “The FLOW Syllabus”); ● Private sector work in 20 countries; ● Six years on staff at Treasury Board Secretariat (expenditure analysis, strategic business design & cost control); ● Previously contracted to various parts of The World Bank, and of sections of the International Development Research Centre; ● Economist on drafting team for “Canada's Green Plan” (1990), (new fiscal instruments for ecological economics; extension of national accounts on ecosystem integrity, resource availability.
  • 3. A Quick Introduction The Free/Libre/Open Way (FLOW)
  • 4. A Quick Introduction APPLIED MICROECONOMICS Property-Powered Rail Open Development Model Dual Purpose: – Return on investment optimization in strategically located commercial and residential property; – Self-financing development of metropolitan transit systems and services based on unconstrained demand for metropolitan-scale mobility, and the market value of naturally constrained supply of property within walking distance of stations.
  • 5. A Quick Introduction APPLIED MICROECONOMICS Mobility Ottawa-Outaouais: Systems & Enterprises Inc. ● A federally-incorporated commercial firm (est. 2011); ● Mission: To organize a consortium to bring about and operate a region-wide private-sector passenger railway service on 400 km of existing railway in the Greater National Capital Region, based on the Property-Powered Rail Open Development Model. Project 125 ● Identify property within walking distance of operational railway lines throughout Canada's Greater National Capital Region with potential for sustainable increases in revenue/asset value of at least 25 per cent as a verifiable result of direct access to integrated metropolitan-scale passenger railway services.
  • 6. A Quick Introduction APPLIED MACROECONOMICS “Provide more flexibility for payers and payees to use multiple payment instruments”
  • 7. A Quick Introduction APPLIED MACROECONOMICS Doctorat en administration - gestion de projet ● Free/Libre/Open World Market Payment: From Project Cost Control Optimization to Macroeconomic Emergent Effects; ● A project-centric agent-based computational economics research model to explore the potential for resolving some systemic problems by enabling choice in the six essential attributes of contractual payment. ● Value-in-Exchange Benchmark Choices – Spot Currency Exchange Index (WM Reuters); – World Price Index (W. Coats); – Primary Commodities Index (B. Graham, N. Kaldor, L. Ussher, et.al.); – Global Equities Index (W. Engels, R. Pringle); – Earth Reserve Index (J. Potvin).
  • 8. Real Property Value Optimization APPLIED MICROECONOMICS Property-Powered Rail Open Development Model
  • 9. Consortium Agreement Supplier (e.g. fuel, Internet, etc.) Rail Access Leases Operating supplies Equipment & operation Fees Fees Advice analysis & assistance Train operators Rail access rights holders Professional service firms Marketing Expenses Transit Engineering analysis Cost-Effectiveness (Operational Expenses) The Property-Powered Rail Open Development Model CC-BY 4.0
  • 10. Consortium Agreement Investments and loans Negotiated obligations Being part of the solution Municipal & Regional governments Member fees Private investors & lenders Affinity club members Return on Investment (Public/Private/Community Capital) Achievement of development objectives Loan Guarantees and Grants Aligned decisions The Property-Powered Rail Open Development Model CC-BY 4.0 Aligned Decisions Fed- Prov/State governments
  • 11. Consortium Agreement Investments and loans Negotiated obligations Being part of the solution Municipal & Regional governments Member fees Private investors & lenders Affinity club members Return on Investment (Public/Private/Community Capital) Achievement of development objectives Loan Guarantees and Grants Aligned decisions The Property-Powered Rail Open Development Model CC-BY 4.0 Aligned Decisions Fed- Prov/State governments Required from Government: Aligned Decisions, Not Money
  • 12. Consortium Agreement Negotiated revenue Business opportunity Negotiated revenue Comfortable safe, practical Negotiated revenue Statistical transportation increase in market value Station owners Enhanced travel experience Travellers Day trippers Frequent travellers Land/Property owners & developers Kiosk/Site provider Partner entities Passenger experience services Service sales Services Ancillary service providers Package transport links Marketable information services Food & beverage i Value-for-Money (Operating Revenue) License & Validation Business opportunity Negotiated revenue Insight Fees Research & planning clients Pay what you want The Property-Powered Rail Open Development Model CC-BY 4.0
  • 13. Consortium Agreement Negotiated revenue Business opportunity Negotiated revenue Comfortable safe, practical Negotiated revenue Statistical transportation increase in market value Station owners Enhanced travel experience Travellers Day trippers Frequent travellers Land/Property owners & developers Kiosk/Site provider Partner entities Passenger experience services Service sales Services Ancillary service providers Package transport links Marketable information services Food & beverage i Value-for-Money (Operating Revenue) License & Validation Business opportunity Negotiated revenue Insight Fees Research & planning clients Pay what you want The Property-Powered Rail Open Development Model CC-BY 4.0 25% + increase in market value
  • 14. Source: Robert Dorion, P.Eng., MBA President, Knowledge Management Research, Valuation & Advisory, Altus Group Limited
  • 15. Placement of Stations APPLIED MICROECONOMICS ● Demand for mobility relatively high; ● Supply of property “within walking distance” of a limited number of railway stations relatively low; ● Data show value effect between –10% and +35%; ● Both commercial and residential properties; ● Stations can be located where income & asset values would likely increase by at least +25%; − Based on market analysis; − Assuming normal business risk; − Contingent on all usual governance rules, processes.
  • 16. Placement of Stations APPLIED MICROECONOMICS ● Value linkage greatest when railway development and property development are fully integrated; ● Price competition begins with announcement that a station will be developed, in anticipation of service; ● Owners earn more, even if they never use the train; ● Percentage of value increase allocated to a “train-stopping fee” in the consortium agreement; ● The consortium of property owners run their own railway business: THEY determine the optimal fee; ● Requires optimization modeling.
  • 17. REQ: Geospatial Multi-Agent Simulation FREE/LIBRE/OPEN SOURCE TRANSPORTATION SIMULATION AND VALIDATION SOFTWARE ● Multi-Agent Transport Simulation http://www.matsim.org/
  • 18. REQ: Geospatial Multi-Agent Simulation FREE/LIBRE/OPEN SOURCE TRANSPORTATION SIMULATION AND VALIDATION SOFTWARE ● Multi-Agent Transport Simulation http://www.matsim.org/ ● New Requirement: Add extensions for property value effects and optimization analysis based on empirical data from the regional market and from comparison markets.
  • 19. REQ: Geospatial Mobility Data FREE/LIBRE/OPEN DATA + STRUCTURED MANAGEMENT ● Whole-region anonymous travel data from mobile devices – Live data streaming via the WAZE platform http://www.waze.com/livemap/ – Historical data on main transportation arteries purchased from participating telecom companies (?) – Disclosure Control Resource Centre, Statistics Canada http://www.statcan.gc.ca/pub/12-539-x/2009001/control-controle- eng.htm – TravelR for ad hoc travel demand modeling https://r-forge.r-project.org/projects/travelr/ ● Polarsys for Long-Term Life-Cycle Management http://polarsys.org/
  • 20. http://openrailproperty.org Lieu de l'événement : Université du Québec en Outaouais (UQO), Pavillon C, Salle C0072 283, boul Alexandre-Taché, Gatineau, Québec
  • 22. Real Trains, Real Tracks, Real Property APPLIED MICROECONOMICS
  • 23. The Greater National Capital Region 400 KM OF EXISTING RAILWAY INFRASTRUCTURE Montebello, QC La Pêche, QC (Wakefield) Bristol, QC Arnprior ON Smiths Falls, ON Alexandria, ON
  • 24. The Greater National Capital Region 400 KM OF EXISTING RAILWAY + OTTAWA LRT (STAGES 1&2) Montebello, QC La Pêche, QC (Wakefield) Bristol, QC Arnprior ON Smiths Falls, ON Alexandria, ON
  • 25. The Greater National Capital Region Montebello, QC WHERE DO YOU LIVE? WORK? PLAY? La Pêche, QC (Wakefield) Freeman Lac Leamy Gréber Papineauville Plaisance Quyon Fitzroy Bayview CarleTtroenmblay Arnprior ON Casselman Terry Fox Smiths Falls, ON UQO/Taché Lorrain Navan March Rd. Urban Ottawa-Gatineau Rural & Semi-Rural Chelsea Masson Thurso Farm Point Vars Limoges Kinburn Blair Maxville Alexandria, ON Bells Corners Barrhaven Richmond Bristol, QC Tunney's Greenboro Merivale
  • 26. PAYMENTS DATA From Geographical Microeconomics To Geographical Macroeconomics
  • 27. Tweaking the Global Payments System APPLIED MACROECONOMICS Est. October 2014 “Provide more flexibility for payers and payees to us e mu ltiple payment instrume nts”
  • 28. Tweaking the Global Payments System APPLIED MACROECONOMICS “Discuss, research, prototype, create working systems ... that allow people on the Web to send each other money as easily as they exchange instant messages and email today”
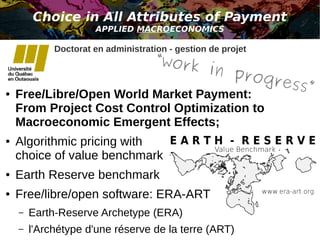
  • 29. Choice in All Attributes of Payment APPLIED MACROECONOMICS Doctorat en administration - gestion de projet “work in progress” ● Free/Libre/Open World Market Payment: From Project Cost Control Optimization to Macroeconomic Emergent Effects; ● Algorithmic pricing with choice of value benchmark ● Earth Reserve benchmark ● Free/libre/open software: ERA-ART – Earth-Reserve Archetype (ERA) – l'Archétype d'une réserve de la terre (ART)
  • 30. We're accustomed to perceiving country boundaries this way
  • 31. The geography of each country is really defined by its “Exclusive Economic Zone” The geospatial boundaries of countries extend 200 nautical miles beyond their shorelines.
  • 32. The geography of each country is really defined by its “Exclusive Economic Zone” Source: http://td-architects.eu/projects/show/exclusive-economic-zone/
  • 33. We're accustomed to perceiving national currencies this way Source: http://i.imgur.com/LIRDh.jpg
  • 34. The geospatial boundaries of currencies overlap through trade relationships. Example: Italy 2010 Imports Darker shade means greater proportion of Intermediary's currency in trade 43.4% Intermediary's currency 36.6% Importer's currency (€) 20.0% Exporter's currency Source: Luigi Ventura and Mark David Witte. 2011. "An Empirical Examination of the Currency Denomination of Trade" https://editorialexpress.com/cgi-bin/conference/download.cgi?db_name=MWITFall2011&paper_id=70
  • 35. The geospatial boundaries of currencies overlap through trade relationships. Example: Italy 2010 Exports Darker shade means greater proportion of Intermediary's currency in trade 19.6% Intermediary's currency 7.7% Importer's currency 72.2% Exporter's currency (€) Source: Luigi Ventura and Mark David Witte. 2011. "An Empirical Examination of the Currency Denomination of Trade" https://editorialexpress.com/cgi-bin/conference/download.cgi?db_name=MWITFall2011&paper_id=70
  • 36. The geospatial boundaries of currencies overlap through trade relationships. Let's use the geospatial density of currency as a meaningful weighting factor for... Darker shade means greater proportion of Intermediary's currency in trade Source: Luigi Ventura and Mark David Witte. 2011. "An Empirical Examination of the Currency Denomination of Trade" https://editorialexpress.com/cgi-bin/conference/download.cgi?db_name=MWITFall2011&paper_id=70
  • 37. Attribution for Frequency & Severity of Surface Temperature Anomalies Source: http://earthobservatory.nasa.gov/GlobalMaps/
  • 38. Attribution for Positive & Negative Trends in Major Pollutants Source: http://earthobservatory.nasa.gov/GlobalMaps/
  • 39. ERA-ART Associates Biophysical Change with Global Economic Activity, By Currency The Earth Reserve System uses currency composition of trade as a weighting factor to proportionately attribute biophysical changes in global ecosystem integrity, in a particular way, to the economic activity paid in each currency. Example: Near Infrared Reflectivity. Changes to remote sensing data on surface thermal reflectivity in Band 4 (Near Infrared 0.77-0.90 μm) reveal changes to biomass content.
  • 40. ERA-ART Associates Biophysical Change with Global Economic Activity, By Currency Challenge: How might we represent the distributional density of multiple currencies at the same time? Darker shade means greater proportion of Intermediary's currency in trade $ € ¥ Source: Luigi Ventura and Mark David Witte. 2011. "An Empirical Examination of the Currency Denomination of Trade" https://editorialexpress.com/cgi-bin/conference/download.cgi?db_name=MWITFall2011&paper_id=70
  • 42. ERA-ART software will use BIS or IMF data on global payments (currency of invoicing) density to maintain EEZ-bounded frequency distributions as relative weights 0-100. Also, visually illustrate up to three currencies at a time: Assign C,M,Y K ≡ all others 0 30 0.30.80.0 80 0
  • 43. ERA-ART Hypothetical 4-Currency Model C, M, Y and K≡All Others) (Note: This map's colours were assigned randomly.)
  • 44. ERA-ART Hypothetical 4-Currency Model C, M, Y and K≡All Others) (Note: This map's colours were assigned randomly.)
  • 45. € ¥ $ ¤
  • 46. ERA-ART Associates Biophysical Change with Global Economic Activity, By Currency Exclusive Economic Zones Scientifically Verifiable Data On Ecosystems & Resources Currency Weighting System for the Earth Reserve Value Benchmark Auditable Data on the Currency of Payments
  • 47. Choice in All Attributes of Payment APPLIED MACROECONOMICS Doctorat en administration - gestion de projet “work in progress” ● Free/Libre/Open World Market Payment: From Project Cost Control Optimization to Macroeconomic Emergent Effects; ● Relative resource/ecosystem degradation in a given currency's region of use, compared with the base year, will cause prices in that currency to become more expensive against prices in other currencies. ● In general, jobs and export-oriented investment will be attracted towards currency zones where ecosystem integrity and resource availability are relatively improved from a base year.
  • 48. CONNECTING Geographical Macroeconomics & Geographical Microeconomics
  • 49. Carbon Emission Reduction CONNECTING THE MACRO AND THE MICRO Adapted from land-use supplied by the National Capital Commission Adapté d'une carte fournis par la Commission
  • 50. Carbon Emission Reduction CONNECTING THE MACRO AND THE MICRO One Double-Deck Railway Coach: ● 75 cars reduced from the roads (100 seated people) ● 60 km return semi-rural terminus to downtown ● 120 grams of carbon emission per km car traveller (× 1/1,000,000 because 1 metric tonne is a million grams) ● 60 grams of carbon emission per km per diesel train traveller (× 1/1,000,000)
  • 51. Carbon Emission Reduction CONNECTING THE MACRO AND THE MICRO 75×60×(120-60)× 1/1,000,000 = 0.27 tonnes ● More than a quarter tonne of net carbon emission reduction per coach, per trip between each semi-rural terminus and downtown Ottawa/Gatineau.
  • 52. Carbon Emission Reduction CONNECTING THE MACRO AND THE MICRO 18 return trips per day (service from 6 am to 11 pm) ● 0.27×18 = 5 tonnes carbon emission reduction. ...that's per coach, per day!
  • 53. Carbon Emission Reduction CONNECTING THE MACRO AND THE MICRO 3 coaches minimum per train 18 trains per day (service from 6 am to 11 pm) ● 5×3 = 15 tonnes carbon reduction. ...that's per line, per day!
  • 54. Carbon Emission Reduction CONNECTING THE MACRO AND THE MICRO 6 lines radiate from downtown Ottawa/Gatineau ● 15×6 = 90 tonnes of net carbon emission reduction per day for a 30 km radius from downtown. That's more than the weight capacity of three 20' shipping containers.
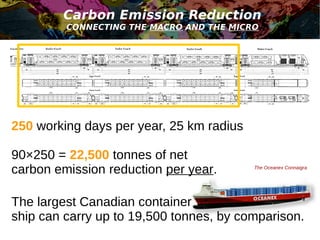
  • 55. Carbon Emission Reduction CONNECTING THE MACRO AND THE MICRO 250 working days per year, 25 km radius 90×250 = 22,500 tonnes of net carbon emission reduction per year. ... not counting weekends & holidays.
  • 56. Carbon Emission Reduction CONNECTING THE MACRO AND THE MICRO 250 working days per year, 25 km radius 90×250 = 22,500 tonnes of net carbon emission reduction per year. The Oceanex Connaigra The largest Canadian container ship can carry up to 19,500 tonnes, by comparison.
  • 57. Carbon Emission Reduction CONNECTING THE MACRO AND THE MICRO Suppose these trains are running half empty... 250 working days per year, 30 km radius 22,500×(1/2) = 11,250 tonnes of net carbon emission reduction per year. ... still, not counting weekends & holidays.
  • 58. Carbon Emission Reduction CONNECTING THE MACRO AND THE MICRO Suppose these trains are running full capacity... 250 working days per year, 25 km radius 22,500×(1.5) = 33,750 tonnes of net carbon emission reduction per year. $20 per tonne carbon offset price gives: $675,000
  • 59. Two New Uses for Payments Data in Applied Geographical Economics Micro and Macro Examples Joseph Potvin Chair, Management Education Working Group, Open Source Initiative (OSI) Founding Editor, The FLOW Syllabus President, Mobility Ottawa-Outaouais: Systems & Enterprises Inc. (Moose Inc.) Mobilité Outaouais-Ottawa: Systèmes & Entreprises Inc. Coordinator, ERA-ART: The Earth-Reserve Archetype (ERA) Developers Group Le Groupe de développeurs de l'Archétype d'une réserve de la Terre (ART) Doctoral Candidate, Université du Québec (DBA, Project Management) [email protected] Open Source Geospatial Foundation OSGeo-qc | OSGeo-Ottawa | LocationTech 12-13 November 2014 | Gatineau Copyright 2014. Dual licensed CC-BY & GNU-FDL excluding graphics and charts attributed to others.