Using PowerPivot instead o VLOOKUP
Download as PPTX, PDF2 likes3,890 views

The document presents a solution for analyzing data from multiple tables in Excel without using VLOOKUP, specifically through PowerPivot. It details the steps for preparing the data, adding it to the PowerPivot model, creating relationships among the tables, and generating a pivot table that efficiently summarizes total sales by country and product. PowerPivot improves performance, reduces file size, and can handle large datasets effectively.


Using PowerPivot instead o VLOOKUP
- 1. Blog Using PowerPivot instead of VLOOKUP Dr Nitin Paranjape Office System MVP
- 2. The Scenario: Two tables We have two tables We want to analyze data from both tables
- 4. Master tables: Products and Countries
- 5. We need this report Total sales by Country (in columns) and Products (in rows) Problem: Pivot Table cannot be created on three separate blocks of data. Solution: We have to combine all three tables into a single table But how?
- 7. Disadvantages of this approach 1. File size increases 2. If there are many transactions, the performance slows down 3. Workaround? Paste as values to solve the above problems… But it is additional work every time you add more data
- 8. Solution: Use PowerPivot This demo is based upon Excel 2013. For 2010 menu names are different the procedure is also different
- 9. Prepare the data 1. Each block of data must be a Table 2. Each table must have a legible name 1. Transactions 2. Countries 3. Products
- 10. Add tables to Data Model (PowerPivot) 1. Click inside each table 2. Open PowerPivot tab 3. Click Add to Data Model 4. Repeat this for all three tables
- 11. Now all tables are visible in PowerPivot 1. A separate window opens to show PowerPivot data 2. Three sheets contain three tables 3. The link sign indicates these are connected to the Excel Tables
- 12. Now we have to create relationships 1. Relationship means informing PowerPivot about linkages between data tables 2. It is like a database relationship 3. The only difference is that you are doing it WITHIN Excel 4. This eliminates the need to use an external database
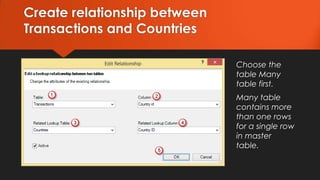
- 13. Create relationship between Transactions and Countries
- 14. Create relationship between Transactions and Countries Choose the table Many table first. Many table contains more than one rows for a single row in master table.
- 15. Create relationship between Transactions and Products
- 16. Create a Pivot Table
- 17. Notice that this Pivot Table is different It shows all Tables
- 19. Summary PowerPivot allows you to create relationship between two tables This eliminates the use of VLOOKUP PowerPivot can handle millions of rows with very good speed The file size is also reduced by using PowerPivot Try this with your data and see the difference Always work on a copy of your data to prevent damaging the original file while learning
- 20. Thank you Read my daily blog http://efficiency365.wordpress.com Post your queries on my FB page https://www.facebook.com/groups/117666161675053/ Follow me on Twitter @drnitinp Blog