SlideShare a Scribd company logo
Geo-Data in R 
From visualization to analysis 
Massimiliano Ruocco, PhD! 
ruoccoma et gmail dot com!
Outline 
Introduc)on 
(10 
min) 
Basic 
R 
(30 
min) 
Geo-­‐Data 
Visualiza)on 
Geo-­‐Data 
Analysis 
(20 
min) 
(20 
min) 
R 
for 
Big 
Data 
(10 
min) 
2
Introduc)on 
(10 
min)
Introduction 
What is R 
• Dialect of S-language: 20 years old 
• Language + Environment for statistical computing 
• Flexibility: package based 
– Cran Task views 
• Object-Oriented language 
• Free! (Open Source) 
4
Introduction 
Getting Started 
• Painless Installation 
• Start it up: 
– Rprofile.site file 
• Workspace: 
– .Rdata file 
• History: 
– .Rhistory file 
• Layout: 
– Console 
– RStudio 
5
Introduction 
R Commands 
• Case sensitive 
• Expression or Assignment 
• Comments starting with # 
• Quit command: q() 
6
Introduction 
Need Help? 
• Help commands: 
– help(…) 
– help.search(…) 
– apropos(…) 
– example(…) 
7
Introduction 
The working directory 
• getwd() 
• setwd(…) 
8
Introduction 
R Session 
• Start R in your working directory 
– Rprofile.site 
– .Rhystory 
– .RData 
• Use R: 
– Instantiate objects/variables 
– Make computation 
– Visualization 
• Quit: 
– Save/NotSave workspace 
– Rprofile.site 
– .Rhystory 
– -.RData 
Working dir 
Start 
R 
Rprofila.site 
.Rhystory 
.RData 
Use 
R 
.Rhystory 
.RData 
Quit 
R 
Rprofila.site 
.Rhystory 
.RData 
9
Basic 
R 
(20 
min)
Basic R 
Basic operations 
• Addition: + 
• Subtraction: - 
• Multiplication: * 
• Division: / 
• Exponentiation: ^ 
• Modulo: %% 
11
Basic R 
Basic operations 
> 1+1 # Addition 
[1] 2 
> 4 - 3 # Subtraction 
[1] 1 
> 4 * 2 + 1 # Operator precedence 
[1] 9 
> 6 ^ 2 # Exponentiation 
[1] 36 
> sqrt(5) # Math function 
[1] 2.236068 
12
Basic R 
Objects 
• ls() 
• Objects() 
13
Basic R 
Vectors 
• Sequence of ordered numbers 
> x <- c(23,22,10,5.4,22.1) 
> x = c(23,22,10,5.4,22.1) 
> c(23,22,10,5.4,22.1) -> x 
> x = assign(“x”,c(23,22,10,5.4,22.1)) 
14
Basic R 
Vectors 
• Arithmetic 
– Vectors of same length 
> x <- c(3,4,1) 
> x = x + 4 
> y = c(10,11) 
> z = x + y 
15 
What about z?
Basic R 
Vectors 
• Arithmetic 
– +,*,-,/,^ 
– sqrt, log, exp, sin, cos, tan, 
min, max, length, sum, mean, var 
16
Basic R 
Vectors 
• Sequence 
17 
> 1:10 
[1] 1 2 3 4 5 6 7 8 9 10 
> 10:1 
[1] 10 9 8 7 6 5 4 3 2 1 
> seq(from = 1, to = 10) 
[1] 1 2 3 4 5 6 7 8 9 10 
> seq(from = 10, to = 1) 
[1] 10 9 8 7 6 5 4 3 2 1 
> seq(from = 1, length = 10, by =4) 
[1] 1 5 9 13 17 21 25 29 33 37
Basic R 
Vectors 
• Logical vectors 
> x = seq(from=1, to=10) 
> x 
[1] 1 2 3 4 5 6 7 8 9 10 
> y = (x %% 3 == 0) 
> y 
[1] FALSE FALSE TRUE FALSE FALSE TRUE 
FALSE FALSE TRUE FALSE 
18
Basic R 
Vectors 
• Index vectors 
– Access by index 
– From 1 
– Logical condition 
19 
> x = c(2,5,7,9) 
> x[1] 
[1] 2 
> x[c(2,4)] 
[1] 5 9 
> x[x<7] 
[1] 2 5
Basic R 
Arrays and Matrices in R 
• Matrix 
– A matrix is a two-dimensional object 
– matrix function 
20 
> matrixA = matrix(data = c(1:10), ncol = 2, nrow = 5) 
> matrixA 
[,1] [,2] 
[1,] 1 6 
[2,] 2 7 
[3,] 3 8 
[4,] 4 9 
[5,] 5 10
Basic R 
Arrays and Matrices in R 
• Array 
– A matrix is a n-dimensional object 
– array function + dim 
> x = c(1:18) 
> x 
[1] 1 2 3 4 5 6 7 8 9 10 11 12 13 14 15 16 17 18 
> y = array(data=x, dim=c(2,3,3)) 
21
Basic R 
Arrays and Matrices in R 
• Accessing by index 
22 
> x <- array(data=c(1:12), dim=c(3,4)) #generate 3 by 4 matrix 
> x 
[,1] [,2] [,3] [,4] 
[1,] 1 4 7 10 
[2,] 2 5 8 11 
[3,] 3 6 9 12 
> i <- array(c(1:3,3:1), dim=c(3,2)) 
> i 
> [,1] [,2] 
> [1,] 1 3 
> [2,] 2 2 
> [3,] 3 1 
> x[i] 
[1] 7 5 3 
> x[i] <- -1 
> x 
[,1] [,2] [,3] [,4] 
[1,] 1 4 -1 10 
[2,] 2 -1 8 11 
[3,] -1 6 9 12
Basic R 
Lists 
• A list is a collection of objects (components) 
• Components can be of different types 
• Each element in a list can be a(n): 
– Vector 
– matrix 
– array 
– dataframe 
– list 
23
Basic R 
Lists 
• Example: 
24 
> lst = list(name="Massimiliano", surname="Ruocco", 
> age=99, birthplace="Italy") 
> lst$name 
[1] "Massimiliano” 
> lst[1] 
$name 
[1] "Massimiliano"
Basic R 
Data Frames 
• Matrix with certain restrictions 
– Each column contains a vector 
– First row named header 
• Used for storing/reading data from tables 
25 
> prices = c(3.0, 4.5, 5.1, 3.7) 
> squaremeters = c(80, 120, 110, 90) 
> cities = c("Trondheim", "Trondheim", "Oslo", "Bergen") 
> data.frame(cities, squaremeters, prices) 
cities squaremeters prices 
1 Trondheim 80 3.0 
2 Trondheim 120 4.5 
3 Oslo 110 5.1 
4 Bergen 90 3.7
Basic R 
Data Frames 
• Accessing as a normal matrix 
26 
> apartmentPrices[2,1] 
[1] Trondheim 
Levels: Bergen Oslo Trondheim 
> apartmentPrices[1,] 
cities squaremeters prices 
1 Trondheim 80 3 
> apartmentPrices$prices 
[1] 3.0 4.5 5.1 3.7
Basic R 
Data Frames 
• Visualizing part of data frame 
27 
> head(apartmentPrices,n = 2) 
cities squaremeters prices 
1 Trondheim 80 3.0 
2 Trondheim 120 4.5
Basic R 
Read Data from Table 
• Read data from external files 
• read.table() function 
• Form of the external file: 
– First line: name of the column 
– N-line: row label + value for each variable 
28
Basic R 
Read Data from Table 
> houseprices = read.table(”houseprices.dat", header=TRUE) 
> houseprices 
29 
Price Floor Area Rooms Age Cent.heat 
1 52.00 111 830 5 6.2 no 
2 54.75 128 710 5 7.5 no 
3 57.50 101 1000 5 4.2 no 
4 57.50 131 690 6 8.8 no 
5 59.75 93 900 5 1.9 yes
Basic R 
Functions 
30 
• General structure 
myfun <- function(arg1, arg2, ... ){ 
# statements 
return(object) 
}
Basic R 
Functions 
31 
• Storing/Using function from file 
– source function 
• Create functions/s 
• Save on file 
• Use it by source(<filename>) call
Basic R 
Graphics in R 
• Examine Data 
• Several functions/packages 
• plot() function 
32
Basic R 
Graphics in R 
• Saving graphs on a png/jpg file 
33 
> png(”cosine.png”) 
> plot(cos, -2*pi, 2*pi) 
> dev.off()
Basic R 
Installing packages 
• install.packages + library functions 
34 
> install.packages(”ggmap”) 
… 
> library(ggmap)
Visualiza)on 
of 
Geo-­‐Data 
in 
R 
(20 
min)
Visualization of Geo-Data in R 
Visualizing Maps 
• maps (http://cran.r-project.org/web/packages/maps/) 
• creating maps of countries and regions of the world 
• latitude and longitude 
• Low resolution maps 
• Main usage: 
> map(database=“world”, region=“.”) 
36
Visualization of Geo-Data in R 
Visualizing Maps 
• maps (http://cran.r-project.org/web/packages/maps/) 
• Example 1: Visualize Map of San Francisco 
> map(database = "state", regions = "california”) 
37
Visualization of Geo-Data in R 
Visualizing Maps 
• maps (http://cran.r-project.org/web/packages/maps/) 
• Example 2: Visualize World Map without inside boundaries 
> map(database = "world", interior = FALSE ) 
38
Visualization of Geo-Data in R 
Visualizing Maps 
• mapdata (http://cran.r-project.org/web/packages/mapdata/) 
• Larger/higher resolution map db 
39
Visualization of Geo-Data in R 
Visualizing Maps 
• mapdata (http://cran.r-project.org/web/packages/mapdata/) 
• Example 2: Visualize map of Japan with interior line in gray 
> map(database = ”japan", interior = FALSE) 
> map(database = ”japan", boundary = FALSE, 
interior=TRUE, col=“gray”, add=TRUE) 
40
Visualization of Geo-Data in R 
Visualizing Maps 
• ggmap (http://cran.r-project.org/web/packages/ggmap/) 
• GoogleMap + Open Street Map 
41
Visualization of Geo-Data in R 
Visualizing Maps 
• ggmap (http://cran.r-project.org/web/packages/ggmap/) 
• Example 1: Visualize Map of Trondheim from GoogleMaps 
> map <- get_map(location = 'Trondheim', zoom = 16) 
> ggmap(map) 
42
Visualization of Geo-Data in R 
Visualizing Maps 
• rworldmap (http://cran.r-project.org/web/packages/rworldmap/) 
• Visualizing world data (country code or gridded) 
43
Visualization of Geo-Data in R 
Visualizing Maps 
• rworldmap (http://cran.r-project.org/web/packages/rworldmap/) 
• Example 1: Visualize Map of Europe 
> newmap <- getMap(resolution = ”low") 
> plot(newmap, xlim = c(-20, 59), ylim = c(35, 71), asp = 1) 
44
Visualization of Geo-Data in R 
Geocoding 
• “Enriching a description of a location, most typically a postal 
address or place name, with geographic coordinates” 
• Extreme points of Europe 
45 
> europe.limits <- geocode(c("CapeFligely,RudolfIsland,Franz 
Josef Land,Russia","Gavdos,Greece","Faja 
Grande,Azores","SevernyIsland,Novaya Zemlya,Russia")) 
… 
> europe.limits 
lon lat 
1 55.00000 81.00000 
2 24.08464 34.83469 
3 -31.26192 39.45479 
4 60.00000 75.50000
Visualization of Geo-Data in R 
Visualizing Maps 
• rworldmap (http://cran.r-project.org/web/packages/rworldmap/) 
• Example 1: Visualize Map of Europe 
> plot(newmap, xlim = range(europe.limits$lon), ylim = 
range(europe.limits$lat), asp = 1) 
46
Visualization of Geo-Data in R 
Yes…but now? 
• Maps useless without Data! 
47
Visualization of Geo-Data in R 
Packages 
• ggplot2 (http://docs.ggplot2.org/current/) 
• powerful graphics language for creating elegant and complex plots 
• univariate and multivariate numerical and categorical data 
• Grammar of Graphics (Wilkinson, 2005) 
• Designed to work in a layered fashion 
48
Visualization of Geo-Data in R 
Packages 
• ggplot2 (http://docs.ggplot2.org/current/) 
– Plot point pattern on a map 
– geom_point() function 
49
Analysis 
of 
Geo-­‐Data 
in 
R 
(20 
min)
Analysis of Geo-Data in R 
Introduction 
• Exploratory Analysis 
– Explore the structure of geographical distributed set of points 
• Point Process Statistics 
– Spatial Point Pattern 
– Spatial Point Process 
– Complete Spatial Randomness (CSR) Test 
– Ripley’s K-function 
51
Analysis of Geo-Data in R 
Exploratory Analysis of Geo-Data 
• Spatial Point Pattern 
– set of spatial point, not regularly distributed in an area A R2 
Chorley−Ribble Data 
! 
! 
! 
! 
! 
! 
! 
! 
! 
! 
! 
! 
! 
! 
! 
! 
! 
! 
! 
! 
! 
! 
! 
! 
! 
! 
! 
! 
! 
! 
! 
! 
! 
! ! 
! 
! 
! 
! 
! 
! 
! ! 
! 
! 
! 
! 
! 
! 
! 
! 
! 
! 
! !! ! 
! 
japanesepines 
! ! 
! 
! ! 
! 
! 
! 
!! 
! ! 
! ! 
! ! 
! ! 
! 
! ! 
! 
! 
! 
! 
! 
! 
! 
! 
! 
! 
! 
! 
! ! 
! 
! 
! ! ! 
! 
! ! ! ! ! ! 
! 
! ! 
! 
! 
! ! 
! 
! 
! 
! 
! ! 
!! 
! ! ! 
redwoodfull 
! 
! 
! 
! !!! ! 
! ! ! ! ! ! ! !! ! ! !! ! ! ! !! !! 
! ! 
! ! 
! 
! !! 
! !! ! !!! !! ! ! ! ! ! !!! !!!! ! ! ! ! ! 
! ! 
! 
! 
! 
! 
! 
! ! 
! ! ! ! !! ! 
! ! !! 
! ! 
! ! ! 
! ! 
! 
! ! 
! !! ! 
! 
! ! ! 
! 
! 
! 
!! ! ! ! ! 
! ! 
! !! ! ! ! 
! 
! 
! 
! 
! ! !!! !! ! ! !! ! ! !! 
!! ! ! ! ! ! ! ! ! ! !! ! ! ! ! ! ! 
!!! ! 
!!!! 
! !! 
! 
! 
! 
!! !!!! ! ! ! ! !! 
! 
! 
!!! !! !! 
!!!!! 
52
Analysis of Geo-Data in R 
Exploratory Analysis of Geo-Data 
• Point Process 
– Stochastic process used to model an irregular point pattern 
P(N(B)=n), n=0,1,2,… 
53
Analysis of Geo-Data in R 
Exploratory Analysis of Geo-Data 
• Point Pattern Analysis 
– Stochastic process used to model an irregular point pattern 
! 
! 
! 
! 
!! 
! 
! 
! 
! 
! 
! 
! 
! 
! 
! 
! 
! 
! 
! 
! 
! 
! ! 
! 
! ! 
! 
! 
! 
! 
! 
! 
! 
! 
! 
! 
! ! 
! 
! 
! 
!! 
! ! 
! 
! 
! 
! 
! 
! 
! 
! 
! 
! 
! 
! 
! 
0 5 10 15 20 
0 5 10 15 20 
! 
! 
! 
! 
! 
! 
! 
! 
! 
! 
! 
! ! 
! 
! 
! 
! 
! 
! 
! 
! 
! 
! 
! 
! 
! 
! 
! 
! 
! 
0 5 10 15 20 
0 5 10 15 20 
! ! ! ! ! ! 
! ! ! ! ! ! 
! ! ! ! ! ! 
! ! ! ! ! ! 
! ! ! ! ! ! 
! ! ! ! ! ! 
0 5 10 15 20 
0 5 10 15 20 
(a) Clustered! (b) Random! (c) Regular! 
54
Analysis of Geo-Data in R 
Exploratory Analysis of Geo-Data 
• Point Pattern Analysis: Objective 
– Determine if a given set of spatial points (Spatial Point Pattern) 
exhibits clustering, regularity or are randomly distributed within an 
area A, subspace of R2 
! 
! 
! 
! 
!! 
! 
! 
! 
! 
! 
! 
! 
! 
! 
! 
! 
! 
! 
! 
! 
! 
! ! 
! 
! ! 
! 
! 
! 
! 
! 
! 
! 
! 
! 
! 
! ! 
! 
! 
! 
!! 
! ! 
! 
! 
! 
! 
! 
! 
! 
! 
! 
! 
! 
! 
! 
0 5 10 15 20 
0 5 10 15 20 
! 
! 
! 
! 
! 
! 
! 
! 
! 
! 
! 
! ! 
! 
! 
! 
! 
! 
! 
! 
! 
! 
! 
! 
! 
! 
! 
! 
! 
! 
0 5 10 15 20 
0 5 10 15 20 
! ! ! ! ! ! 
! ! ! ! ! ! 
! ! ! ! ! ! 
! ! ! ! ! ! 
! ! ! ! ! ! 
! ! ! ! ! ! 
0 5 10 15 20 
0 5 10 15 20 
(a) Clustered! (b) Random! (c) Regular! 
55
Analysis of Geo-Data in R 
Exploratory Analysis of Geo-Data 
• Poisson Point Process 
– Theoretical model for Complete Spatial Randomness 
! 
! ! 
! 
! 
! 
! 
! 
! 
! 
! 
! 
! 
! 
! 
! 
! 
! 
! 
! 
! 
! 
! 
! 
! 
! 
! 
! 
! 
! 
! 
! 
! 
! 
! 
! 
! 
! 
! 
! 
! 
! 
! 
! 
! 
! 
! 
! 
! 
! 
! 
! 
! 
! 
! 
! 
! 
! 
! 
! 
! 
! 
! 
! 
! 
! 
! 
! 
! 
! 
! 
! 
! 
! 
! 
! 
! 
! 
! 
! 
! 
! 
! 
! 
! 
! 
! 
! 
! 
! 
! 
! 
! 
! 
! 
! 
! 
! 
! 
! 
! 
! 
! 
! 
! 
! 
! 
! 
! 
! 
! ! 
! 
! 
! 
! 
! 
! 
! 
! 
! 
! 
! 
! 
! 
! 
! 
! 
! 
! 
! 
! 
! 
! 
! 
! 
! 
! 
! 
! 
! 
! 
! 
! 
! 
! 
! 
! 
! 
! 
! 
! 
! 
! 
! 
! 
! 
! 
! 
! 
! 
! 
! 
! 
! 
! 
! 
! 
! 
! 
! 
! 
! 
! 
! 
! 
! 
! 
! 
! 
! 
! 
! 
! 
! 
! 
! 
! 
! 
! 
! 
! 
! 
! 
! 
! 
! 
! 
! 
! 
! 
! 
! 
! 
! 
! ! 
! 
! 
! 
! 
! 
! 
! 
! 
! 
! 
! 
! 
! 
! 
! 
! 
! 
! 
! 
! 
! 
! 
! 
! 
! 
! 
! 
! 
! 
! 
! 
! 
! 
! 
! 
! 
! 
! 
! 
! 
! 
! 
! 
! 
! 
! 
! 
! 
! 
! 
! 
! 
! 
! 
! 
! 
! 
! 
! 
! 
! 
! 
! 
! 
! 
! 
! 
! 
! 
! 
! 
! 
! 
! 
! 
! 
! 
! 
! ! 
! 
! 
! 
! 
! 
! 
! 
! 
! 
! 
! 
! 
! 
! 
! 
! 
! 
!! 
! 
! ! 
! 
! 
! 
! ! 
! 
! 
! 
! 
! 
! 
! 
! 
! 
! 
! 
! 
! 
! 
! 
! 
! 
! 
! 
! 
! 
! 
! 
! 
! 
! 
! 
! 
! 
! 
! 
! 
! 
! 
! 
! 
! 
! 
! 
! 
! 
! 
! 
! 
! 
! 
! 
! 
! ! 
! 
! 
! 
! 
! ! 
! 
! 
! 
! 
! 
! 
! 
! 
! 
! 
! 
! 
! 
! 
! 
! 
! 
! 
! ! 
! 
! 
! 
! 
! 
! 
! 
! 
! 
! 
! 
! 
! 
! 
! 
! 
! 
! 
! 
! 
! 
! 
! 
! 
! 
! 
! 
! 
! 
! 
! 
! 
! 
! 
! 
! 
! 
! 
! 
! 
! 
! 
! 
! 
! 
! 
! 
! 
! 
! 
! 
! 
! 
! 
! 
! 
! 
! 
! 
! 
! 
! 
! 
! 
! 
! 
! 
! 
! 
! 
! 
! 
! 
! 
! 
! 
! 
! 
! 
! 
! 
Realizations of a Poisson Point Process with case = 100 
56
Analysis of Geo-Data in R 
Exploratory Analysis of Geo-Data 
• Ripley K-function K(h) 
– Second-order function summarizing a Spatial Point Pattern 
– Over a scale h 
h 
(#(pi within h from p)) 
Definition 
Estimation 
57
Analysis of Geo-Data in R 
Exploratory Analysis of Geo-Data 
• Ripley K-function K(h): CSR Test 
– Poisson process as benchmark 
- K(h) >hπ2 clustering at scale h 
- K(h) <hπ2 dispersion at scale h 
58
Analysis of Geo-Data in R 
Exploratory Analysis of Geo-Data 
• Ripley K-function K(h): CSR Test 
– Poisson process as benchmark 
– Standardized 
- K(h) >hπ2 clustering at scale h 
- K(h) <hπ2 dispersion at scale h 
59
Analysis of Geo-Data in R 
Exploratory Analysis of Geo-Data 
• Ripley K-function K(h): CSR Test 
– Poisson process as benchmark 
– Standardized 
- L(h) >0 clustering at scale h 
- L(h) <0 dispersion at scale h 
60
Analysis of Geo-Data in R 
Exploratory Analysis of Geo-Data 
• Ripley K-function K12(h) 
– Second-order function summarizing interaction between TWO Spatial 
Point Pattern 
– Over a scale h 
61
Analysis of Geo-Data in R 
Exploratory Analysis of Geo-Data 
• Ripley K-Cross function K12(h): CSR Test 
– Poisson process as benchmark 
- K12(h) >hπ2 attraction at scale h 
- K12(h) <hπ2 repulsion at scale h 
62
Analysis of Geo-Data in R 
Exploratory Analysis of Geo-Data 
• Ripley K-Cross function K12(h): CSR Test 
– Poisson process as benchmark 


63
Spa)al 
distribu)on 
of 
the 
Tag 
Point 
PaPerns 
related 
to 
the 
tag 
Old Naval College 
and 
the 
tag 
University of Greenwich !
Basic R 
Exploratory Analysis of Geo-Data 
• R Package: 
– Spatstat 
• ppp(): for representing a spatial point pattern 
• Kest(): Ripley’s K function estimation 
• Kcross(): Ripley’s K-cross function estimation 
64
Big 
Data 
and 
R 
(10 
min)
Big Data and R 
Introduction 
• How to tackle big data? 
– Sampling 
– Bigger Hardware 
– Store objects on hard disc and analyze it chunkwise 
(ScaleR and ff package) 
– Integration with higher performing languages 
66
Big Data and R 
Bigmemory package 
• Functions for creation, managing and exploration of 
massive matrices 
• data structures allocated to shared memory 
• multiple R sessions on the same machine access to 
shared mem 
• Big.matrix compatible with standard matrices 
67
Big Data and R 
RHadoop 
68
Summary
Summary 
• What is R: environment + language 
– Package-based 
– Free! 
• Briefly introduction on R Language 
– Data structures 
– Function 
– Graphics 
• Geo-Data Visualization 
– Plot real data on a map 
• Geo-Data Analysis 
– Exploratory analysis 
• R and Big Data 
– Managing large matrix 
– Revolutionary Analytics 
70
A bit of Exercises 
Massimiliano Ruocco, PhD! 
ruoccoma et gmail dot com!
Outline 
• 9 Koan 
• Increasing degree of difficulty 
72
Koan 
1
Koan 1 
Install R and RStudio 
• Install R: 
– http://www.r-project.org/ : project website 
– http://cran.uib.no/ : download 
• Install RStudio: 
– http://www.rstudio.com/ : project website 
– Desktop version 
74
Koan 
2
Koan 2 
Basic R (1) 
• calculate average of vector without using 
mean function. Compare the result with 
the value obtained by using the function 
mean() 
76
Koan 
3
Koan 3 
Basic R (2) 
• create a vector with only odd numbers 
from 1 to 100 
• create a vector [1,2,3,...,100]. Extract 
from this the vector with only odd 
numbers 
• Compare the two resulting vectors 
78
Koan 
4
Koan 4 
Basic R (3) 
• read table piccadilly.txt. Add column 
names lat, lan, time” to the table. 
Visualize a preview of the data.frame with 
the function head() 
• Ingredients: colnames(), head() 
80
Koan 
5
Koan 5 
Basic R (4) 
• Create a function reading a table from a file 
and returning its length. Try using it from 
external file and for getting the length of the 
the table in file “piccadilly.txt” 
82
Koan 
6
Koan 6 
Visualization (1) 
• Visualize the map of USA without region border. 
Save on png file 
• Visualize the map of USA with region border in 
red. Save on png file. 
• Ingredients: mapdata, maps, png 
84
Koan 
7
Koan 7 
Visualization (2) 
• Visualize Map of Oslo in Google Maps. Save 
on a png file 
• Visualize the map of Norway. Save on a png 
file. 
• Ingredients: ggmap, gplot2, png, plot 
86
Koan 
8
Koan 8 
Visualization (3) 
• Visualize pictures tagged with piccadilly on 
London Map (file “piccadilly.txt”) 
• Visualize pictures tagged with ”britishlibrary” 
and pictures tagged with “piccadilly” on 
London Map 
• Ingredients: ggmap(), geom_point() 
88
Koan 
9
Koan 9 
Analysis 
• Read data related to term piccadilly as 
dataframe 
• Visualize on Map of London 
• Estimate Ripley´s K function 
• Plot on a graph 
• Save on png file 
• Ingredients: ggmap(), geom_point(), 
Kest(), png 
90
Koan 2 
Package Installation 
 install.packages(ggplot2”) 
also installing the dependencies 'colorspace', 'Rcpp', 
'stringr', 'RColorBrewer’, 'dichromat', 'munsell', 'labeling', 
'plyr', 'digest', 'gtable', 'reshape2', 'scales', 'proto' 
trying URL 'http://cran.rstudio.com/bin/macosx/mavericks/ 
contrib/3.1/colorspace_1.2-4.tgz' 
Content type 'application/x-gzip' length 391920 bytes (382 Kb) 
opened URL 
====================================== 
… 
The downloaded binary packages are in 
/var/folders/s1/pl6plczj1pv0cwzg4q3kkjg80000gn //RtmpxvpfhL/ 
downloaded_packages 
 library(ggplot2) 
91
Introduc)on 
GeRng 
Started 
• Layout: Console 
92
Introduc)on 
GeRng 
Started 
• Layout: RStudio 
93
Ad

More Related Content

What's hot (20)

CLUSTERGRAM
CLUSTERGRAMCLUSTERGRAM
CLUSTERGRAM
Dr. Volkan OBAN
 
Advanced data structures slide 1 2
Advanced data structures slide 1 2Advanced data structures slide 1 2
Advanced data structures slide 1 2
jomerson remorosa
 
Data Structure: Algorithm and analysis
Data Structure: Algorithm and analysisData Structure: Algorithm and analysis
Data Structure: Algorithm and analysis
Dr. Rajdeep Chatterjee
 
Otter 2016-11-14-ss
Otter 2016-11-14-ssOtter 2016-11-14-ss
Otter 2016-11-14-ss
Ruo Ando
 
Basic_analysis.ppt
Basic_analysis.pptBasic_analysis.ppt
Basic_analysis.ppt
SoumyaJ3
 
Advanced data structure
Advanced data structureAdvanced data structure
Advanced data structure
Shakil Ahmed
 
20170317 functional programming in julia
20170317 functional programming in julia20170317 functional programming in julia
20170317 functional programming in julia
岳華 杜
 
Spatial Analysis with R - the Good, the Bad, and the Pretty
Spatial Analysis with R - the Good, the Bad, and the PrettySpatial Analysis with R - the Good, the Bad, and the Pretty
Spatial Analysis with R - the Good, the Bad, and the Pretty
Noam Ross
 
peRm R group. Review of packages for r for market data downloading and analysis
peRm R group. Review of packages for r for market data downloading and analysispeRm R group. Review of packages for r for market data downloading and analysis
peRm R group. Review of packages for r for market data downloading and analysis
Vyacheslav Arbuzov
 
Surface3d in R and rgl package.
Surface3d in R and rgl package.Surface3d in R and rgl package.
Surface3d in R and rgl package.
Dr. Volkan OBAN
 
Seminar PSU 10.10.2014 mme
Seminar PSU 10.10.2014 mmeSeminar PSU 10.10.2014 mme
Seminar PSU 10.10.2014 mme
Vyacheslav Arbuzov
 
Lowest common ancestor
Lowest common ancestorLowest common ancestor
Lowest common ancestor
Shakil Ahmed
 
R-ggplot2 package Examples
R-ggplot2 package ExamplesR-ggplot2 package Examples
R-ggplot2 package Examples
Dr. Volkan OBAN
 
Applicationof datastructures
Applicationof datastructuresApplicationof datastructures
Applicationof datastructures
Hitesh Wagle
 
20170714 concurrency in julia
20170714 concurrency in julia20170714 concurrency in julia
20170714 concurrency in julia
岳華 杜
 
Soft Heaps
Soft HeapsSoft Heaps
Soft Heaps
⌨️ Andrey Goder
 
Presentation OCIP2014
Presentation OCIP2014Presentation OCIP2014
Presentation OCIP2014
Fabian Froehlich
 
Applied numerical methods lec2
Applied numerical methods lec2Applied numerical methods lec2
Applied numerical methods lec2
Yasser Ahmed
 
Python (1)
Python (1)Python (1)
Python (1)
abduldestiny
 
Seminar psu 20.10.2013
Seminar psu 20.10.2013Seminar psu 20.10.2013
Seminar psu 20.10.2013
Vyacheslav Arbuzov
 
Advanced data structures slide 1 2
Advanced data structures slide 1 2Advanced data structures slide 1 2
Advanced data structures slide 1 2
jomerson remorosa
 
Data Structure: Algorithm and analysis
Data Structure: Algorithm and analysisData Structure: Algorithm and analysis
Data Structure: Algorithm and analysis
Dr. Rajdeep Chatterjee
 
Otter 2016-11-14-ss
Otter 2016-11-14-ssOtter 2016-11-14-ss
Otter 2016-11-14-ss
Ruo Ando
 
Basic_analysis.ppt
Basic_analysis.pptBasic_analysis.ppt
Basic_analysis.ppt
SoumyaJ3
 
Advanced data structure
Advanced data structureAdvanced data structure
Advanced data structure
Shakil Ahmed
 
20170317 functional programming in julia
20170317 functional programming in julia20170317 functional programming in julia
20170317 functional programming in julia
岳華 杜
 
Spatial Analysis with R - the Good, the Bad, and the Pretty
Spatial Analysis with R - the Good, the Bad, and the PrettySpatial Analysis with R - the Good, the Bad, and the Pretty
Spatial Analysis with R - the Good, the Bad, and the Pretty
Noam Ross
 
peRm R group. Review of packages for r for market data downloading and analysis
peRm R group. Review of packages for r for market data downloading and analysispeRm R group. Review of packages for r for market data downloading and analysis
peRm R group. Review of packages for r for market data downloading and analysis
Vyacheslav Arbuzov
 
Surface3d in R and rgl package.
Surface3d in R and rgl package.Surface3d in R and rgl package.
Surface3d in R and rgl package.
Dr. Volkan OBAN
 
Lowest common ancestor
Lowest common ancestorLowest common ancestor
Lowest common ancestor
Shakil Ahmed
 
R-ggplot2 package Examples
R-ggplot2 package ExamplesR-ggplot2 package Examples
R-ggplot2 package Examples
Dr. Volkan OBAN
 
Applicationof datastructures
Applicationof datastructuresApplicationof datastructures
Applicationof datastructures
Hitesh Wagle
 
20170714 concurrency in julia
20170714 concurrency in julia20170714 concurrency in julia
20170714 concurrency in julia
岳華 杜
 
Applied numerical methods lec2
Applied numerical methods lec2Applied numerical methods lec2
Applied numerical methods lec2
Yasser Ahmed
 

Viewers also liked (20)

Django Third party packages
Django Third party packagesDjango Third party packages
Django Third party packages
Andy Dai
 
Visualisation functions in R
Visualisation functions in RVisualisation functions in R
Visualisation functions in R
Veneficus
 
Text Mining
Text MiningText Mining
Text Mining
rueshyna
 
Data_Visualization_LP Result_Dashboard_Using_R_Graphics
Data_Visualization_LP Result_Dashboard_Using_R_GraphicsData_Visualization_LP Result_Dashboard_Using_R_Graphics
Data_Visualization_LP Result_Dashboard_Using_R_Graphics
Noli Sicad
 
Science Online 2013: Data Visualization Using R
Science Online 2013: Data Visualization Using RScience Online 2013: Data Visualization Using R
Science Online 2013: Data Visualization Using R
William Gunn
 
Search search search
Search search searchSearch search search
Search search search
Andy Dai
 
DATA VISUALIZATION WITH R PACKAGES
DATA VISUALIZATION WITH R PACKAGESDATA VISUALIZATION WITH R PACKAGES
DATA VISUALIZATION WITH R PACKAGES
Fatma ÇINAR
 
Data Visualization With R
Data Visualization With RData Visualization With R
Data Visualization With R
Rsquared Academy
 
Data Visualization With R: Learn To Combine Multiple Graphs
Data Visualization With R: Learn To Combine Multiple GraphsData Visualization With R: Learn To Combine Multiple Graphs
Data Visualization With R: Learn To Combine Multiple Graphs
Rsquared Academy
 
RHadoop
RHadoopRHadoop
RHadoop
Praveen Kumar Donta
 
Facebook data analysis using r
Facebook data analysis using rFacebook data analysis using r
Facebook data analysis using r
Praveen Kumar Donta
 
電腦不只會幫你選土豆,還會幫你選新聞
電腦不只會幫你選土豆,還會幫你選新聞電腦不只會幫你選土豆,還會幫你選新聞
電腦不只會幫你選土豆,還會幫你選新聞
Andy Dai
 
圖書館趨勢觀察
圖書館趨勢觀察圖書館趨勢觀察
圖書館趨勢觀察
Ted Lin (林泰宏)
 
Data Visualization for the Public Sector
Data Visualization for the Public SectorData Visualization for the Public Sector
Data Visualization for the Public Sector
JESS3
 
常用內建模組
常用內建模組常用內建模組
常用內建模組
Justin Lin
 
如何用 grs 擷取台灣上市股票股價資訊 PyCon APAC 2014
如何用 grs 擷取台灣上市股票股價資訊 PyCon APAC 2014如何用 grs 擷取台灣上市股票股價資訊 PyCon APAC 2014
如何用 grs 擷取台灣上市股票股價資訊 PyCon APAC 2014
Toomore
 
Data visualization
Data visualizationData visualization
Data visualization
Jan Willem Tulp
 
Big Data Visualization
Big Data VisualizationBig Data Visualization
Big Data Visualization
Raffael Marty
 
Data Visualization and Discovery
Data Visualization and DiscoveryData Visualization and Discovery
Data Visualization and Discovery
Datavail
 
Introduction to Data Mining and Big Data Analytics
Introduction to Data Mining and Big Data AnalyticsIntroduction to Data Mining and Big Data Analytics
Introduction to Data Mining and Big Data Analytics
Big Data Engineering, Faculty of Engineering, Dhurakij Pundit University
 
Django Third party packages
Django Third party packagesDjango Third party packages
Django Third party packages
Andy Dai
 
Visualisation functions in R
Visualisation functions in RVisualisation functions in R
Visualisation functions in R
Veneficus
 
Text Mining
Text MiningText Mining
Text Mining
rueshyna
 
Data_Visualization_LP Result_Dashboard_Using_R_Graphics
Data_Visualization_LP Result_Dashboard_Using_R_GraphicsData_Visualization_LP Result_Dashboard_Using_R_Graphics
Data_Visualization_LP Result_Dashboard_Using_R_Graphics
Noli Sicad
 
Science Online 2013: Data Visualization Using R
Science Online 2013: Data Visualization Using RScience Online 2013: Data Visualization Using R
Science Online 2013: Data Visualization Using R
William Gunn
 
Search search search
Search search searchSearch search search
Search search search
Andy Dai
 
DATA VISUALIZATION WITH R PACKAGES
DATA VISUALIZATION WITH R PACKAGESDATA VISUALIZATION WITH R PACKAGES
DATA VISUALIZATION WITH R PACKAGES
Fatma ÇINAR
 
Data Visualization With R: Learn To Combine Multiple Graphs
Data Visualization With R: Learn To Combine Multiple GraphsData Visualization With R: Learn To Combine Multiple Graphs
Data Visualization With R: Learn To Combine Multiple Graphs
Rsquared Academy
 
電腦不只會幫你選土豆,還會幫你選新聞
電腦不只會幫你選土豆,還會幫你選新聞電腦不只會幫你選土豆,還會幫你選新聞
電腦不只會幫你選土豆,還會幫你選新聞
Andy Dai
 
Data Visualization for the Public Sector
Data Visualization for the Public SectorData Visualization for the Public Sector
Data Visualization for the Public Sector
JESS3
 
常用內建模組
常用內建模組常用內建模組
常用內建模組
Justin Lin
 
如何用 grs 擷取台灣上市股票股價資訊 PyCon APAC 2014
如何用 grs 擷取台灣上市股票股價資訊 PyCon APAC 2014如何用 grs 擷取台灣上市股票股價資訊 PyCon APAC 2014
如何用 grs 擷取台灣上市股票股價資訊 PyCon APAC 2014
Toomore
 
Big Data Visualization
Big Data VisualizationBig Data Visualization
Big Data Visualization
Raffael Marty
 
Data Visualization and Discovery
Data Visualization and DiscoveryData Visualization and Discovery
Data Visualization and Discovery
Datavail
 
Ad

Similar to Big datacourse (20)

Introduction to R.pptx
Introduction to R.pptxIntroduction to R.pptx
Introduction to R.pptx
karthikks82
 
R for hadoopers
R for hadoopersR for hadoopers
R for hadoopers
Gwen (Chen) Shapira
 
R
RR
R
exsuns
 
Rtutorial
RtutorialRtutorial
Rtutorial
Dheeraj Dwivedi
 
R tutorial for a windows environment
R tutorial for a windows environmentR tutorial for a windows environment
R tutorial for a windows environment
Yogendra Chaubey
 
Profiling and optimization
Profiling and optimizationProfiling and optimization
Profiling and optimization
g3_nittala
 
Introduction to R
Introduction to RIntroduction to R
Introduction to R
Happy Garg
 
Data analysis with R
Data analysis with RData analysis with R
Data analysis with R
ShareThis
 
R programming & Machine Learning
R programming & Machine LearningR programming & Machine Learning
R programming & Machine Learning
AmanBhalla14
 
R1-Intro (2udsjhfkjdshfkjsdkfhsdkfsfsffs
R1-Intro (2udsjhfkjdshfkjsdkfhsdkfsfsffsR1-Intro (2udsjhfkjdshfkjsdkfhsdkfsfsffs
R1-Intro (2udsjhfkjdshfkjsdkfhsdkfsfsffs
sabari Giri
 
Exploratory Analysis Part1 Coursera DataScience Specialisation
Exploratory Analysis Part1 Coursera DataScience SpecialisationExploratory Analysis Part1 Coursera DataScience Specialisation
Exploratory Analysis Part1 Coursera DataScience Specialisation
Wesley Goi
 
On Beyond (PostgreSQL) Data Types
On Beyond (PostgreSQL) Data TypesOn Beyond (PostgreSQL) Data Types
On Beyond (PostgreSQL) Data Types
Jonathan Katz
 
Learning notes of r for python programmer (Temp1)
Learning notes of r for python programmer (Temp1)Learning notes of r for python programmer (Temp1)
Learning notes of r for python programmer (Temp1)
Chia-Chi Chang
 
A Workshop on R
A Workshop on RA Workshop on R
A Workshop on R
Ajay Ohri
 
Introduction2R
Introduction2RIntroduction2R
Introduction2R
Aureliano Bombarely
 
Ggplot2 v3
Ggplot2 v3Ggplot2 v3
Ggplot2 v3
Josh Doyle
 
R basics
R basicsR basics
R basics
Sagun Baijal
 
R language, an introduction
R language, an introductionR language, an introduction
R language, an introduction
Venkatesh Prasad Ranganath
 
R Language Introduction
R Language IntroductionR Language Introduction
R Language Introduction
Khaled Al-Shamaa
 
Python 101 language features and functional programming
Python 101 language features and functional programmingPython 101 language features and functional programming
Python 101 language features and functional programming
Lukasz Dynowski
 
Introduction to R.pptx
Introduction to R.pptxIntroduction to R.pptx
Introduction to R.pptx
karthikks82
 
R tutorial for a windows environment
R tutorial for a windows environmentR tutorial for a windows environment
R tutorial for a windows environment
Yogendra Chaubey
 
Profiling and optimization
Profiling and optimizationProfiling and optimization
Profiling and optimization
g3_nittala
 
Introduction to R
Introduction to RIntroduction to R
Introduction to R
Happy Garg
 
Data analysis with R
Data analysis with RData analysis with R
Data analysis with R
ShareThis
 
R programming & Machine Learning
R programming & Machine LearningR programming & Machine Learning
R programming & Machine Learning
AmanBhalla14
 
R1-Intro (2udsjhfkjdshfkjsdkfhsdkfsfsffs
R1-Intro (2udsjhfkjdshfkjsdkfhsdkfsfsffsR1-Intro (2udsjhfkjdshfkjsdkfhsdkfsfsffs
R1-Intro (2udsjhfkjdshfkjsdkfhsdkfsfsffs
sabari Giri
 
Exploratory Analysis Part1 Coursera DataScience Specialisation
Exploratory Analysis Part1 Coursera DataScience SpecialisationExploratory Analysis Part1 Coursera DataScience Specialisation
Exploratory Analysis Part1 Coursera DataScience Specialisation
Wesley Goi
 
On Beyond (PostgreSQL) Data Types
On Beyond (PostgreSQL) Data TypesOn Beyond (PostgreSQL) Data Types
On Beyond (PostgreSQL) Data Types
Jonathan Katz
 
Learning notes of r for python programmer (Temp1)
Learning notes of r for python programmer (Temp1)Learning notes of r for python programmer (Temp1)
Learning notes of r for python programmer (Temp1)
Chia-Chi Chang
 
A Workshop on R
A Workshop on RA Workshop on R
A Workshop on R
Ajay Ohri
 
Python 101 language features and functional programming
Python 101 language features and functional programmingPython 101 language features and functional programming
Python 101 language features and functional programming
Lukasz Dynowski
 
Ad

Recently uploaded (20)

DPR_Expert_Recruitment_notice_Revised.pdf
DPR_Expert_Recruitment_notice_Revised.pdfDPR_Expert_Recruitment_notice_Revised.pdf
DPR_Expert_Recruitment_notice_Revised.pdf
inmishra17121973
 
Safety Innovation in Mt. Vernon A Westchester County Model for New Rochelle a...
Safety Innovation in Mt. Vernon A Westchester County Model for New Rochelle a...Safety Innovation in Mt. Vernon A Westchester County Model for New Rochelle a...
Safety Innovation in Mt. Vernon A Westchester County Model for New Rochelle a...
James Francis Paradigm Asset Management
 
Day 1 - Lab 1 Reconnaissance Scanning with NMAP, Vulnerability Assessment wit...
Day 1 - Lab 1 Reconnaissance Scanning with NMAP, Vulnerability Assessment wit...Day 1 - Lab 1 Reconnaissance Scanning with NMAP, Vulnerability Assessment wit...
Day 1 - Lab 1 Reconnaissance Scanning with NMAP, Vulnerability Assessment wit...
Abodahab
 
VKS-Python Basics for Beginners and advance.pptx
VKS-Python Basics for Beginners and advance.pptxVKS-Python Basics for Beginners and advance.pptx
VKS-Python Basics for Beginners and advance.pptx
Vinod Srivastava
 
Data Science Courses in India iim skills
Data Science Courses in India iim skillsData Science Courses in India iim skills
Data Science Courses in India iim skills
dharnathakur29
 
VKS-Python-FIe Handling text CSV Binary.pptx
VKS-Python-FIe Handling text CSV Binary.pptxVKS-Python-FIe Handling text CSV Binary.pptx
VKS-Python-FIe Handling text CSV Binary.pptx
Vinod Srivastava
 
Stack_and_Queue_Presentation_Final (1).pptx
Stack_and_Queue_Presentation_Final (1).pptxStack_and_Queue_Presentation_Final (1).pptx
Stack_and_Queue_Presentation_Final (1).pptx
binduraniha86
 
Molecular methods diagnostic and monitoring of infection - Repaired.pptx
Molecular methods diagnostic and monitoring of infection  -  Repaired.pptxMolecular methods diagnostic and monitoring of infection  -  Repaired.pptx
Molecular methods diagnostic and monitoring of infection - Repaired.pptx
7tzn7x5kky
 
Classification_in_Machinee_Learning.pptx
Classification_in_Machinee_Learning.pptxClassification_in_Machinee_Learning.pptx
Classification_in_Machinee_Learning.pptx
wencyjorda88
 
computer organization and assembly language.docx
computer organization and assembly language.docxcomputer organization and assembly language.docx
computer organization and assembly language.docx
alisoftwareengineer1
 
183409-christina-rossetti.pdfdsfsdasggsag
183409-christina-rossetti.pdfdsfsdasggsag183409-christina-rossetti.pdfdsfsdasggsag
183409-christina-rossetti.pdfdsfsdasggsag
fardin123rahman07
 
03 Daniel 2-notes.ppt seminario escatologia
03 Daniel 2-notes.ppt seminario escatologia03 Daniel 2-notes.ppt seminario escatologia
03 Daniel 2-notes.ppt seminario escatologia
Alexander Romero Arosquipa
 
Ch3MCT24.pptx measure of central tendency
Ch3MCT24.pptx measure of central tendencyCh3MCT24.pptx measure of central tendency
Ch3MCT24.pptx measure of central tendency
ayeleasefa2
 
chapter3 Central Tendency statistics.ppt
chapter3 Central Tendency statistics.pptchapter3 Central Tendency statistics.ppt
chapter3 Central Tendency statistics.ppt
justinebandajbn
 
Cleaned_Lecture 6666666_Simulation_I.pdf
Cleaned_Lecture 6666666_Simulation_I.pdfCleaned_Lecture 6666666_Simulation_I.pdf
Cleaned_Lecture 6666666_Simulation_I.pdf
alcinialbob1234
 
CTS EXCEPTIONSPrediction of Aluminium wire rod physical properties through AI...
CTS EXCEPTIONSPrediction of Aluminium wire rod physical properties through AI...CTS EXCEPTIONSPrediction of Aluminium wire rod physical properties through AI...
CTS EXCEPTIONSPrediction of Aluminium wire rod physical properties through AI...
ThanushsaranS
 
How iCode cybertech Helped Me Recover My Lost Funds
How iCode cybertech Helped Me Recover My Lost FundsHow iCode cybertech Helped Me Recover My Lost Funds
How iCode cybertech Helped Me Recover My Lost Funds
ireneschmid345
 
Secure_File_Storage_Hybrid_Cryptography.pptx..
Secure_File_Storage_Hybrid_Cryptography.pptx..Secure_File_Storage_Hybrid_Cryptography.pptx..
Secure_File_Storage_Hybrid_Cryptography.pptx..
yuvarajreddy2002
 
Thingyan is now a global treasure! See how people around the world are search...
Thingyan is now a global treasure! See how people around the world are search...Thingyan is now a global treasure! See how people around the world are search...
Thingyan is now a global treasure! See how people around the world are search...
Pixellion
 
Adobe Analytics NOAM Central User Group April 2025 Agent AI: Uncovering the S...
Adobe Analytics NOAM Central User Group April 2025 Agent AI: Uncovering the S...Adobe Analytics NOAM Central User Group April 2025 Agent AI: Uncovering the S...
Adobe Analytics NOAM Central User Group April 2025 Agent AI: Uncovering the S...
gmuir1066
 
DPR_Expert_Recruitment_notice_Revised.pdf
DPR_Expert_Recruitment_notice_Revised.pdfDPR_Expert_Recruitment_notice_Revised.pdf
DPR_Expert_Recruitment_notice_Revised.pdf
inmishra17121973
 
Safety Innovation in Mt. Vernon A Westchester County Model for New Rochelle a...
Safety Innovation in Mt. Vernon A Westchester County Model for New Rochelle a...Safety Innovation in Mt. Vernon A Westchester County Model for New Rochelle a...
Safety Innovation in Mt. Vernon A Westchester County Model for New Rochelle a...
James Francis Paradigm Asset Management
 
Day 1 - Lab 1 Reconnaissance Scanning with NMAP, Vulnerability Assessment wit...
Day 1 - Lab 1 Reconnaissance Scanning with NMAP, Vulnerability Assessment wit...Day 1 - Lab 1 Reconnaissance Scanning with NMAP, Vulnerability Assessment wit...
Day 1 - Lab 1 Reconnaissance Scanning with NMAP, Vulnerability Assessment wit...
Abodahab
 
VKS-Python Basics for Beginners and advance.pptx
VKS-Python Basics for Beginners and advance.pptxVKS-Python Basics for Beginners and advance.pptx
VKS-Python Basics for Beginners and advance.pptx
Vinod Srivastava
 
Data Science Courses in India iim skills
Data Science Courses in India iim skillsData Science Courses in India iim skills
Data Science Courses in India iim skills
dharnathakur29
 
VKS-Python-FIe Handling text CSV Binary.pptx
VKS-Python-FIe Handling text CSV Binary.pptxVKS-Python-FIe Handling text CSV Binary.pptx
VKS-Python-FIe Handling text CSV Binary.pptx
Vinod Srivastava
 
Stack_and_Queue_Presentation_Final (1).pptx
Stack_and_Queue_Presentation_Final (1).pptxStack_and_Queue_Presentation_Final (1).pptx
Stack_and_Queue_Presentation_Final (1).pptx
binduraniha86
 
Molecular methods diagnostic and monitoring of infection - Repaired.pptx
Molecular methods diagnostic and monitoring of infection  -  Repaired.pptxMolecular methods diagnostic and monitoring of infection  -  Repaired.pptx
Molecular methods diagnostic and monitoring of infection - Repaired.pptx
7tzn7x5kky
 
Classification_in_Machinee_Learning.pptx
Classification_in_Machinee_Learning.pptxClassification_in_Machinee_Learning.pptx
Classification_in_Machinee_Learning.pptx
wencyjorda88
 
computer organization and assembly language.docx
computer organization and assembly language.docxcomputer organization and assembly language.docx
computer organization and assembly language.docx
alisoftwareengineer1
 
183409-christina-rossetti.pdfdsfsdasggsag
183409-christina-rossetti.pdfdsfsdasggsag183409-christina-rossetti.pdfdsfsdasggsag
183409-christina-rossetti.pdfdsfsdasggsag
fardin123rahman07
 
Ch3MCT24.pptx measure of central tendency
Ch3MCT24.pptx measure of central tendencyCh3MCT24.pptx measure of central tendency
Ch3MCT24.pptx measure of central tendency
ayeleasefa2
 
chapter3 Central Tendency statistics.ppt
chapter3 Central Tendency statistics.pptchapter3 Central Tendency statistics.ppt
chapter3 Central Tendency statistics.ppt
justinebandajbn
 
Cleaned_Lecture 6666666_Simulation_I.pdf
Cleaned_Lecture 6666666_Simulation_I.pdfCleaned_Lecture 6666666_Simulation_I.pdf
Cleaned_Lecture 6666666_Simulation_I.pdf
alcinialbob1234
 
CTS EXCEPTIONSPrediction of Aluminium wire rod physical properties through AI...
CTS EXCEPTIONSPrediction of Aluminium wire rod physical properties through AI...CTS EXCEPTIONSPrediction of Aluminium wire rod physical properties through AI...
CTS EXCEPTIONSPrediction of Aluminium wire rod physical properties through AI...
ThanushsaranS
 
How iCode cybertech Helped Me Recover My Lost Funds
How iCode cybertech Helped Me Recover My Lost FundsHow iCode cybertech Helped Me Recover My Lost Funds
How iCode cybertech Helped Me Recover My Lost Funds
ireneschmid345
 
Secure_File_Storage_Hybrid_Cryptography.pptx..
Secure_File_Storage_Hybrid_Cryptography.pptx..Secure_File_Storage_Hybrid_Cryptography.pptx..
Secure_File_Storage_Hybrid_Cryptography.pptx..
yuvarajreddy2002
 
Thingyan is now a global treasure! See how people around the world are search...
Thingyan is now a global treasure! See how people around the world are search...Thingyan is now a global treasure! See how people around the world are search...
Thingyan is now a global treasure! See how people around the world are search...
Pixellion
 
Adobe Analytics NOAM Central User Group April 2025 Agent AI: Uncovering the S...
Adobe Analytics NOAM Central User Group April 2025 Agent AI: Uncovering the S...Adobe Analytics NOAM Central User Group April 2025 Agent AI: Uncovering the S...
Adobe Analytics NOAM Central User Group April 2025 Agent AI: Uncovering the S...
gmuir1066
 

Big datacourse

  • 1. Geo-Data in R From visualization to analysis Massimiliano Ruocco, PhD! ruoccoma et gmail dot com!
  • 2. Outline Introduc)on (10 min) Basic R (30 min) Geo-­‐Data Visualiza)on Geo-­‐Data Analysis (20 min) (20 min) R for Big Data (10 min) 2
  • 4. Introduction What is R • Dialect of S-language: 20 years old • Language + Environment for statistical computing • Flexibility: package based – Cran Task views • Object-Oriented language • Free! (Open Source) 4
  • 5. Introduction Getting Started • Painless Installation • Start it up: – Rprofile.site file • Workspace: – .Rdata file • History: – .Rhistory file • Layout: – Console – RStudio 5
  • 6. Introduction R Commands • Case sensitive • Expression or Assignment • Comments starting with # • Quit command: q() 6
  • 7. Introduction Need Help? • Help commands: – help(…) – help.search(…) – apropos(…) – example(…) 7
  • 8. Introduction The working directory • getwd() • setwd(…) 8
  • 9. Introduction R Session • Start R in your working directory – Rprofile.site – .Rhystory – .RData • Use R: – Instantiate objects/variables – Make computation – Visualization • Quit: – Save/NotSave workspace – Rprofile.site – .Rhystory – -.RData Working dir Start R Rprofila.site .Rhystory .RData Use R .Rhystory .RData Quit R Rprofila.site .Rhystory .RData 9
  • 10. Basic R (20 min)
  • 11. Basic R Basic operations • Addition: + • Subtraction: - • Multiplication: * • Division: / • Exponentiation: ^ • Modulo: %% 11
  • 12. Basic R Basic operations > 1+1 # Addition [1] 2 > 4 - 3 # Subtraction [1] 1 > 4 * 2 + 1 # Operator precedence [1] 9 > 6 ^ 2 # Exponentiation [1] 36 > sqrt(5) # Math function [1] 2.236068 12
  • 13. Basic R Objects • ls() • Objects() 13
  • 14. Basic R Vectors • Sequence of ordered numbers > x <- c(23,22,10,5.4,22.1) > x = c(23,22,10,5.4,22.1) > c(23,22,10,5.4,22.1) -> x > x = assign(“x”,c(23,22,10,5.4,22.1)) 14
  • 15. Basic R Vectors • Arithmetic – Vectors of same length > x <- c(3,4,1) > x = x + 4 > y = c(10,11) > z = x + y 15 What about z?
  • 16. Basic R Vectors • Arithmetic – +,*,-,/,^ – sqrt, log, exp, sin, cos, tan, min, max, length, sum, mean, var 16
  • 17. Basic R Vectors • Sequence 17 > 1:10 [1] 1 2 3 4 5 6 7 8 9 10 > 10:1 [1] 10 9 8 7 6 5 4 3 2 1 > seq(from = 1, to = 10) [1] 1 2 3 4 5 6 7 8 9 10 > seq(from = 10, to = 1) [1] 10 9 8 7 6 5 4 3 2 1 > seq(from = 1, length = 10, by =4) [1] 1 5 9 13 17 21 25 29 33 37
  • 18. Basic R Vectors • Logical vectors > x = seq(from=1, to=10) > x [1] 1 2 3 4 5 6 7 8 9 10 > y = (x %% 3 == 0) > y [1] FALSE FALSE TRUE FALSE FALSE TRUE FALSE FALSE TRUE FALSE 18
  • 19. Basic R Vectors • Index vectors – Access by index – From 1 – Logical condition 19 > x = c(2,5,7,9) > x[1] [1] 2 > x[c(2,4)] [1] 5 9 > x[x<7] [1] 2 5
  • 20. Basic R Arrays and Matrices in R • Matrix – A matrix is a two-dimensional object – matrix function 20 > matrixA = matrix(data = c(1:10), ncol = 2, nrow = 5) > matrixA [,1] [,2] [1,] 1 6 [2,] 2 7 [3,] 3 8 [4,] 4 9 [5,] 5 10
  • 21. Basic R Arrays and Matrices in R • Array – A matrix is a n-dimensional object – array function + dim > x = c(1:18) > x [1] 1 2 3 4 5 6 7 8 9 10 11 12 13 14 15 16 17 18 > y = array(data=x, dim=c(2,3,3)) 21
  • 22. Basic R Arrays and Matrices in R • Accessing by index 22 > x <- array(data=c(1:12), dim=c(3,4)) #generate 3 by 4 matrix > x [,1] [,2] [,3] [,4] [1,] 1 4 7 10 [2,] 2 5 8 11 [3,] 3 6 9 12 > i <- array(c(1:3,3:1), dim=c(3,2)) > i > [,1] [,2] > [1,] 1 3 > [2,] 2 2 > [3,] 3 1 > x[i] [1] 7 5 3 > x[i] <- -1 > x [,1] [,2] [,3] [,4] [1,] 1 4 -1 10 [2,] 2 -1 8 11 [3,] -1 6 9 12
  • 23. Basic R Lists • A list is a collection of objects (components) • Components can be of different types • Each element in a list can be a(n): – Vector – matrix – array – dataframe – list 23
  • 24. Basic R Lists • Example: 24 > lst = list(name="Massimiliano", surname="Ruocco", > age=99, birthplace="Italy") > lst$name [1] "Massimiliano” > lst[1] $name [1] "Massimiliano"
  • 25. Basic R Data Frames • Matrix with certain restrictions – Each column contains a vector – First row named header • Used for storing/reading data from tables 25 > prices = c(3.0, 4.5, 5.1, 3.7) > squaremeters = c(80, 120, 110, 90) > cities = c("Trondheim", "Trondheim", "Oslo", "Bergen") > data.frame(cities, squaremeters, prices) cities squaremeters prices 1 Trondheim 80 3.0 2 Trondheim 120 4.5 3 Oslo 110 5.1 4 Bergen 90 3.7
  • 26. Basic R Data Frames • Accessing as a normal matrix 26 > apartmentPrices[2,1] [1] Trondheim Levels: Bergen Oslo Trondheim > apartmentPrices[1,] cities squaremeters prices 1 Trondheim 80 3 > apartmentPrices$prices [1] 3.0 4.5 5.1 3.7
  • 27. Basic R Data Frames • Visualizing part of data frame 27 > head(apartmentPrices,n = 2) cities squaremeters prices 1 Trondheim 80 3.0 2 Trondheim 120 4.5
  • 28. Basic R Read Data from Table • Read data from external files • read.table() function • Form of the external file: – First line: name of the column – N-line: row label + value for each variable 28
  • 29. Basic R Read Data from Table > houseprices = read.table(”houseprices.dat", header=TRUE) > houseprices 29 Price Floor Area Rooms Age Cent.heat 1 52.00 111 830 5 6.2 no 2 54.75 128 710 5 7.5 no 3 57.50 101 1000 5 4.2 no 4 57.50 131 690 6 8.8 no 5 59.75 93 900 5 1.9 yes
  • 30. Basic R Functions 30 • General structure myfun <- function(arg1, arg2, ... ){ # statements return(object) }
  • 31. Basic R Functions 31 • Storing/Using function from file – source function • Create functions/s • Save on file • Use it by source(<filename>) call
  • 32. Basic R Graphics in R • Examine Data • Several functions/packages • plot() function 32
  • 33. Basic R Graphics in R • Saving graphs on a png/jpg file 33 > png(”cosine.png”) > plot(cos, -2*pi, 2*pi) > dev.off()
  • 34. Basic R Installing packages • install.packages + library functions 34 > install.packages(”ggmap”) … > library(ggmap)
  • 36. Visualization of Geo-Data in R Visualizing Maps • maps (http://cran.r-project.org/web/packages/maps/) • creating maps of countries and regions of the world • latitude and longitude • Low resolution maps • Main usage: > map(database=“world”, region=“.”) 36
  • 37. Visualization of Geo-Data in R Visualizing Maps • maps (http://cran.r-project.org/web/packages/maps/) • Example 1: Visualize Map of San Francisco > map(database = "state", regions = "california”) 37
  • 38. Visualization of Geo-Data in R Visualizing Maps • maps (http://cran.r-project.org/web/packages/maps/) • Example 2: Visualize World Map without inside boundaries > map(database = "world", interior = FALSE ) 38
  • 39. Visualization of Geo-Data in R Visualizing Maps • mapdata (http://cran.r-project.org/web/packages/mapdata/) • Larger/higher resolution map db 39
  • 40. Visualization of Geo-Data in R Visualizing Maps • mapdata (http://cran.r-project.org/web/packages/mapdata/) • Example 2: Visualize map of Japan with interior line in gray > map(database = ”japan", interior = FALSE) > map(database = ”japan", boundary = FALSE, interior=TRUE, col=“gray”, add=TRUE) 40
  • 41. Visualization of Geo-Data in R Visualizing Maps • ggmap (http://cran.r-project.org/web/packages/ggmap/) • GoogleMap + Open Street Map 41
  • 42. Visualization of Geo-Data in R Visualizing Maps • ggmap (http://cran.r-project.org/web/packages/ggmap/) • Example 1: Visualize Map of Trondheim from GoogleMaps > map <- get_map(location = 'Trondheim', zoom = 16) > ggmap(map) 42
  • 43. Visualization of Geo-Data in R Visualizing Maps • rworldmap (http://cran.r-project.org/web/packages/rworldmap/) • Visualizing world data (country code or gridded) 43
  • 44. Visualization of Geo-Data in R Visualizing Maps • rworldmap (http://cran.r-project.org/web/packages/rworldmap/) • Example 1: Visualize Map of Europe > newmap <- getMap(resolution = ”low") > plot(newmap, xlim = c(-20, 59), ylim = c(35, 71), asp = 1) 44
  • 45. Visualization of Geo-Data in R Geocoding • “Enriching a description of a location, most typically a postal address or place name, with geographic coordinates” • Extreme points of Europe 45 > europe.limits <- geocode(c("CapeFligely,RudolfIsland,Franz Josef Land,Russia","Gavdos,Greece","Faja Grande,Azores","SevernyIsland,Novaya Zemlya,Russia")) … > europe.limits lon lat 1 55.00000 81.00000 2 24.08464 34.83469 3 -31.26192 39.45479 4 60.00000 75.50000
  • 46. Visualization of Geo-Data in R Visualizing Maps • rworldmap (http://cran.r-project.org/web/packages/rworldmap/) • Example 1: Visualize Map of Europe > plot(newmap, xlim = range(europe.limits$lon), ylim = range(europe.limits$lat), asp = 1) 46
  • 47. Visualization of Geo-Data in R Yes…but now? • Maps useless without Data! 47
  • 48. Visualization of Geo-Data in R Packages • ggplot2 (http://docs.ggplot2.org/current/) • powerful graphics language for creating elegant and complex plots • univariate and multivariate numerical and categorical data • Grammar of Graphics (Wilkinson, 2005) • Designed to work in a layered fashion 48
  • 49. Visualization of Geo-Data in R Packages • ggplot2 (http://docs.ggplot2.org/current/) – Plot point pattern on a map – geom_point() function 49
  • 50. Analysis of Geo-­‐Data in R (20 min)
  • 51. Analysis of Geo-Data in R Introduction • Exploratory Analysis – Explore the structure of geographical distributed set of points • Point Process Statistics – Spatial Point Pattern – Spatial Point Process – Complete Spatial Randomness (CSR) Test – Ripley’s K-function 51
  • 52. Analysis of Geo-Data in R Exploratory Analysis of Geo-Data • Spatial Point Pattern – set of spatial point, not regularly distributed in an area A R2 Chorley−Ribble Data ! ! ! ! ! ! ! ! ! ! ! ! ! ! ! ! ! ! ! ! ! ! ! ! ! ! ! ! ! ! ! ! ! ! ! ! ! ! ! ! ! ! ! ! ! ! ! ! ! ! ! ! ! ! !! ! ! japanesepines ! ! ! ! ! ! ! ! !! ! ! ! ! ! ! ! ! ! ! ! ! ! ! ! ! ! ! ! ! ! ! ! ! ! ! ! ! ! ! ! ! ! ! ! ! ! ! ! ! ! ! ! ! ! ! ! ! ! ! !! ! ! ! redwoodfull ! ! ! ! !!! ! ! ! ! ! ! ! ! !! ! ! !! ! ! ! !! !! ! ! ! ! ! ! !! ! !! ! !!! !! ! ! ! ! ! !!! !!!! ! ! ! ! ! ! ! ! ! ! ! ! ! ! ! ! ! ! !! ! ! ! !! ! ! ! ! ! ! ! ! ! ! ! !! ! ! ! ! ! ! ! ! !! ! ! ! ! ! ! ! !! ! ! ! ! ! ! ! ! ! !!! !! ! ! !! ! ! !! !! ! ! ! ! ! ! ! ! ! !! ! ! ! ! ! ! !!! ! !!!! ! !! ! ! ! !! !!!! ! ! ! ! !! ! ! !!! !! !! !!!!! 52
  • 53. Analysis of Geo-Data in R Exploratory Analysis of Geo-Data • Point Process – Stochastic process used to model an irregular point pattern P(N(B)=n), n=0,1,2,… 53
  • 54. Analysis of Geo-Data in R Exploratory Analysis of Geo-Data • Point Pattern Analysis – Stochastic process used to model an irregular point pattern ! ! ! ! !! ! ! ! ! ! ! ! ! ! ! ! ! ! ! ! ! ! ! ! ! ! ! ! ! ! ! ! ! ! ! ! ! ! ! ! ! !! ! ! ! ! ! ! ! ! ! ! ! ! ! ! ! 0 5 10 15 20 0 5 10 15 20 ! ! ! ! ! ! ! ! ! ! ! ! ! ! ! ! ! ! ! ! ! ! ! ! ! ! ! ! ! ! 0 5 10 15 20 0 5 10 15 20 ! ! ! ! ! ! ! ! ! ! ! ! ! ! ! ! ! ! ! ! ! ! ! ! ! ! ! ! ! ! ! ! ! ! ! ! 0 5 10 15 20 0 5 10 15 20 (a) Clustered! (b) Random! (c) Regular! 54
  • 55. Analysis of Geo-Data in R Exploratory Analysis of Geo-Data • Point Pattern Analysis: Objective – Determine if a given set of spatial points (Spatial Point Pattern) exhibits clustering, regularity or are randomly distributed within an area A, subspace of R2 ! ! ! ! !! ! ! ! ! ! ! ! ! ! ! ! ! ! ! ! ! ! ! ! ! ! ! ! ! ! ! ! ! ! ! ! ! ! ! ! ! !! ! ! ! ! ! ! ! ! ! ! ! ! ! ! ! 0 5 10 15 20 0 5 10 15 20 ! ! ! ! ! ! ! ! ! ! ! ! ! ! ! ! ! ! ! ! ! ! ! ! ! ! ! ! ! ! 0 5 10 15 20 0 5 10 15 20 ! ! ! ! ! ! ! ! ! ! ! ! ! ! ! ! ! ! ! ! ! ! ! ! ! ! ! ! ! ! ! ! ! ! ! ! 0 5 10 15 20 0 5 10 15 20 (a) Clustered! (b) Random! (c) Regular! 55
  • 56. Analysis of Geo-Data in R Exploratory Analysis of Geo-Data • Poisson Point Process – Theoretical model for Complete Spatial Randomness ! ! ! ! ! ! ! ! ! ! ! ! ! ! ! ! ! ! ! ! ! ! ! ! ! ! ! ! ! ! ! ! ! ! ! ! ! ! ! ! ! ! ! ! ! ! ! ! ! ! ! ! ! ! ! ! ! ! ! ! ! ! ! ! ! ! ! ! ! ! ! ! ! ! ! ! ! ! ! ! ! ! ! ! ! ! ! ! ! ! ! ! ! ! ! ! ! ! ! ! ! ! ! ! ! ! ! ! ! ! ! ! ! ! ! ! ! ! ! ! ! ! ! ! ! ! ! ! ! ! ! ! ! ! ! ! ! ! ! ! ! ! ! ! ! ! ! ! ! ! ! ! ! ! ! ! ! ! ! ! ! ! ! ! ! ! ! ! ! ! ! ! ! ! ! ! ! ! ! ! ! ! ! ! ! ! ! ! ! ! ! ! ! ! ! ! ! ! ! ! ! ! ! ! ! ! ! ! ! ! ! ! ! ! ! ! ! ! ! ! ! ! ! ! ! ! ! ! ! ! ! ! ! ! ! ! ! ! ! ! ! ! ! ! ! ! ! ! ! ! ! ! ! ! ! ! ! ! ! ! ! ! ! ! ! ! ! ! ! ! ! ! ! ! ! ! ! ! ! ! ! ! ! ! ! ! ! ! ! ! ! ! ! ! ! ! ! ! ! ! ! ! ! ! !! ! ! ! ! ! ! ! ! ! ! ! ! ! ! ! ! ! ! ! ! ! ! ! ! ! ! ! ! ! ! ! ! ! ! ! ! ! ! ! ! ! ! ! ! ! ! ! ! ! ! ! ! ! ! ! ! ! ! ! ! ! ! ! ! ! ! ! ! ! ! ! ! ! ! ! ! ! ! ! ! ! ! ! ! ! ! ! ! ! ! ! ! ! ! ! ! ! ! ! ! ! ! ! ! ! ! ! ! ! ! ! ! ! ! ! ! ! ! ! ! ! ! ! ! ! ! ! ! ! ! ! ! ! ! ! ! ! ! ! ! ! ! ! ! ! ! ! ! ! ! ! ! ! ! ! ! ! ! ! ! ! ! ! ! ! Realizations of a Poisson Point Process with case = 100 56
  • 57. Analysis of Geo-Data in R Exploratory Analysis of Geo-Data • Ripley K-function K(h) – Second-order function summarizing a Spatial Point Pattern – Over a scale h h (#(pi within h from p)) Definition Estimation 57
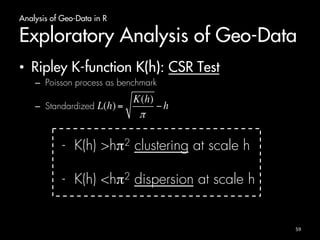
  • 58. Analysis of Geo-Data in R Exploratory Analysis of Geo-Data • Ripley K-function K(h): CSR Test – Poisson process as benchmark - K(h) >hπ2 clustering at scale h - K(h) <hπ2 dispersion at scale h 58
  • 59. Analysis of Geo-Data in R Exploratory Analysis of Geo-Data • Ripley K-function K(h): CSR Test – Poisson process as benchmark – Standardized - K(h) >hπ2 clustering at scale h - K(h) <hπ2 dispersion at scale h 59
  • 60. Analysis of Geo-Data in R Exploratory Analysis of Geo-Data • Ripley K-function K(h): CSR Test – Poisson process as benchmark – Standardized - L(h) >0 clustering at scale h - L(h) <0 dispersion at scale h 60
  • 61. Analysis of Geo-Data in R Exploratory Analysis of Geo-Data • Ripley K-function K12(h) – Second-order function summarizing interaction between TWO Spatial Point Pattern – Over a scale h 61
  • 62. Analysis of Geo-Data in R Exploratory Analysis of Geo-Data • Ripley K-Cross function K12(h): CSR Test – Poisson process as benchmark - K12(h) >hπ2 attraction at scale h - K12(h) <hπ2 repulsion at scale h 62
  • 63. Analysis of Geo-Data in R Exploratory Analysis of Geo-Data • Ripley K-Cross function K12(h): CSR Test – Poisson process as benchmark 63
  • 64. Spa)al distribu)on of the Tag Point PaPerns related to the tag Old Naval College and the tag University of Greenwich !
  • 65. Basic R Exploratory Analysis of Geo-Data • R Package: – Spatstat • ppp(): for representing a spatial point pattern • Kest(): Ripley’s K function estimation • Kcross(): Ripley’s K-cross function estimation 64
  • 66. Big Data and R (10 min)
  • 67. Big Data and R Introduction • How to tackle big data? – Sampling – Bigger Hardware – Store objects on hard disc and analyze it chunkwise (ScaleR and ff package) – Integration with higher performing languages 66
  • 68. Big Data and R Bigmemory package • Functions for creation, managing and exploration of massive matrices • data structures allocated to shared memory • multiple R sessions on the same machine access to shared mem • Big.matrix compatible with standard matrices 67
  • 69. Big Data and R RHadoop 68
  • 71. Summary • What is R: environment + language – Package-based – Free! • Briefly introduction on R Language – Data structures – Function – Graphics • Geo-Data Visualization – Plot real data on a map • Geo-Data Analysis – Exploratory analysis • R and Big Data – Managing large matrix – Revolutionary Analytics 70
  • 72. A bit of Exercises Massimiliano Ruocco, PhD! ruoccoma et gmail dot com!
  • 73. Outline • 9 Koan • Increasing degree of difficulty 72
  • 75. Koan 1 Install R and RStudio • Install R: – http://www.r-project.org/ : project website – http://cran.uib.no/ : download • Install RStudio: – http://www.rstudio.com/ : project website – Desktop version 74
  • 77. Koan 2 Basic R (1) • calculate average of vector without using mean function. Compare the result with the value obtained by using the function mean() 76
  • 79. Koan 3 Basic R (2) • create a vector with only odd numbers from 1 to 100 • create a vector [1,2,3,...,100]. Extract from this the vector with only odd numbers • Compare the two resulting vectors 78
  • 81. Koan 4 Basic R (3) • read table piccadilly.txt. Add column names lat, lan, time” to the table. Visualize a preview of the data.frame with the function head() • Ingredients: colnames(), head() 80
  • 83. Koan 5 Basic R (4) • Create a function reading a table from a file and returning its length. Try using it from external file and for getting the length of the the table in file “piccadilly.txt” 82
  • 85. Koan 6 Visualization (1) • Visualize the map of USA without region border. Save on png file • Visualize the map of USA with region border in red. Save on png file. • Ingredients: mapdata, maps, png 84
  • 87. Koan 7 Visualization (2) • Visualize Map of Oslo in Google Maps. Save on a png file • Visualize the map of Norway. Save on a png file. • Ingredients: ggmap, gplot2, png, plot 86
  • 89. Koan 8 Visualization (3) • Visualize pictures tagged with piccadilly on London Map (file “piccadilly.txt”) • Visualize pictures tagged with ”britishlibrary” and pictures tagged with “piccadilly” on London Map • Ingredients: ggmap(), geom_point() 88
  • 91. Koan 9 Analysis • Read data related to term piccadilly as dataframe • Visualize on Map of London • Estimate Ripley´s K function • Plot on a graph • Save on png file • Ingredients: ggmap(), geom_point(), Kest(), png 90
  • 92. Koan 2 Package Installation install.packages(ggplot2”) also installing the dependencies 'colorspace', 'Rcpp', 'stringr', 'RColorBrewer’, 'dichromat', 'munsell', 'labeling', 'plyr', 'digest', 'gtable', 'reshape2', 'scales', 'proto' trying URL 'http://cran.rstudio.com/bin/macosx/mavericks/ contrib/3.1/colorspace_1.2-4.tgz' Content type 'application/x-gzip' length 391920 bytes (382 Kb) opened URL ====================================== … The downloaded binary packages are in /var/folders/s1/pl6plczj1pv0cwzg4q3kkjg80000gn //RtmpxvpfhL/ downloaded_packages library(ggplot2) 91
  • 93. Introduc)on GeRng Started • Layout: Console 92
  • 94. Introduc)on GeRng Started • Layout: RStudio 93
  • 95. Visualization of Geo-Data in R Introduction • Real Data! – Flickr Dataset – Metadata: • Geographical tag • Tags – Geographical distribution of terms – Why? • POI-related terms 94