SlideShare a Scribd company logo
COMPUTER GRAPHICS
1 COMPUTER GRAPHICS.ppt
What Is Computer Graphics?
The creation , manipulation , analysis , and interaction with pictorial
representations of objects and data using computers.
More precisely: image synthesis
WHY COMPUTER GRAPHICS?
•About 50% of the brain neurons are associated with vision
•Dominant form of computer output
•Enrich the discovery process and facilitate new inventions
GOALS OF COMPUTER GRAPHICS
 Generate synthetic images
 Do it in a practical way & scientifically sound.
 And make it look easy…
1 COMPUTER GRAPHICS.ppt
1. APPLICATIONS
USES OF GRAPHICS
• Special effects
• Feature animation
• Computer Games
• Virtual environments
• Visualization
(science, business, cartography, ...)
• Design
• Interaction
ENGINEERING DESIGN
SCIETIFIC VISUALIZATION
SCIENTIFIC VISUALIZATION / SIMULATION
ELECTROMAGNETIC POTENTIAL FIELD COMPUTATIONAL FLUID DYNAMICS
(CFD)
VIRTUAL REALITY
Virtual tour of historical remains
IMAGE PROCESSING, ANALYSIS, AND
SYNTHESIS
COMPUTER ART-DIGITAL CALLIGRAPHY
MEDICAL APPLICATIONS
ARCHITECTURAL IMAGE
MOVIES
If you can image it, it can be done with computer graphics!
More than one billion dollars on special effects.
No end in sight for this trend!
2. HARDWARE AND
SYSTEM
ARCHITECTURE
1 COMPUTER GRAPHICS.ppt
3. ANIMATION
ANIMATION
Model how things move
• Temporal change of
– Objects (position, orientation, size, shape, color, etc.)
– Camera (position, direction, angle, focus, etc.)
– Illumination (position, direction, color, brightness)
• Represent motion
– Sequence of stills
– Parameter curves
4. MODELING
MODELLING
MODELING
How to represent real environments
– Geometry: curves, surfaces, volumes
– Photometry: light, color, reflectance
• How to build these representations
– Interactive: sculpt it
– Algorithmic: let it grow (fractals, extraction)
– Scanning: via 3D sensing
• Generate primitives
– Lines, triangles, quads, patches
– Cylinder, spheres
– Higher-order primitives
1 COMPUTER GRAPHICS.ppt
5. RENDERING
RENDERING
COMPUTER GRAPHICS
BASIC
PRINCIPLES AND
CONCEPTS
1. PIXEL
Pixels are placed on a regular 2-dimensional grid,
and are often represented using dots or squares.
Each pixel is a sample of an original image, where
more samples typically provide a more accurate
representation of the original.
The intensity of each pixel is variable; in color
systems, each pixel has typically three
components such as red, green, and blue.
2. GRAPHICS
 Graphics are visual presentations on a surface, such as a
computer screen. Examples are photographs, drawing, graphics
designs, maps, engineering drawings, or other images.
 Graphics often combine text and illustration. Graphic design
consist of the deliberate selection, creation.
3. RENDERING
 Rendering is the generation of a 2D image from a 3D model by means of
computer programs.
 A scene file contains objects in a strictly defined language or data structure;
it would contain geometry, viewpoint, texture, lighting, and shading information
as a description of the virtual scene.
 The rendering program is usually built into the computer graphics software.
The term "rendering" may be by analogy with an "artist's rendering" of a scene.
VARIOUS RENDERING QUALITIES
1 COMPUTER GRAPHICS.ppt
4. 3D PROJECTION
 3D PROJECTIONS is a method
of mapping 3D points to a 2D
plane.
 Current methods for
displaying graphical data are
based on planar two
dimensional media, the use of
this type of projection is
widespread, especially in
C.G, engineering and
5. RAY TRACING
 Ray tracing is a method for creating
an image by tracing the path of light
via pixels in an image plane.
 The technique is able of creating a high
degree of photorealism; commonly higher
than that of usual scan line
rendering methods with a
greater computational cost.
6. SHADING
 Shading refers to depicting depth in three
dimensional models by changing levels
of darkness.
 There are different techniques of shading
with cross hatching where perpendicular lines of
changing closeness are drawn in a grid pattern to
shade a boundary.
 The closer the lines are jointly, the darker
the area shows. Likewise, the beyond apart the
lines are, the lighter the area shows.
7. TEXTURE MAPPING
Texture mapping is the process of mapping an image onto a triangle
in order to increase the detail of the rendering.
The image that gets mapped onto the triangle is called a texture
map or texture and is usually a regular color image.
THANK U

More Related Content

Similar to 1 COMPUTER GRAPHICS.ppt (20)

PPTX
Image Processing Training in Chandigarh
E2Matrix
 
PPTX
CG MODULE 1 NOTES ppppppppppppppppppppppppppppppp.pptx
TheertheshTheertha1
 
PPTX
Matlab Training in Jalandhar | Matlab Training in Phagwara
E2Matrix
 
PPTX
Matlab Training in Chandigarh
E2Matrix
 
PDF
Lecture1
Mobeen Mustafa
 
PPTX
Steam presentation deux 3 d prints from photographs
Scott Eastellerson
 
PPTX
Computer Graphics Power Point using Open GL and C Programming
kemal678348
 
PPTX
COMPUTER GRAPHICS DAY1
Barnali Gupta Banik
 
PPTX
On constructing z dimensional Image By DIBR Synthesized Images
Jayakrishnan U
 
PPT
Game development terminologies
Ahmed Badr
 
PPTX
3D Modelling and Animation
Saif Rehman Nasir
 
DOCX
Reviewer in com graphics
Tricia Andrea Lorena Pongyan
 
PPTX
CG.pptx
AdityaBisht34
 
PDF
cad 2jjkuigugjgugufygmbjgufjhjbjghnkihiu.pdf
220110072
 
PPTX
Computer Graphics Unit 1 for BCA IV SEM.pptx
dgojms
 
PDF
427lects
Praveen Kumar
 
PDF
CG Module-01 Ntes Search Creators and .pdf
ISTEJCE
 
PDF
Computer Graphics in Mechanical engineering
RandomVideos22
 
PPTX
Normal Mapping / Computer Graphics - IK
Ilgın Kavaklıoğulları
 
PPTX
Overview of Computer Graphics
United International University
 
Image Processing Training in Chandigarh
E2Matrix
 
CG MODULE 1 NOTES ppppppppppppppppppppppppppppppp.pptx
TheertheshTheertha1
 
Matlab Training in Jalandhar | Matlab Training in Phagwara
E2Matrix
 
Matlab Training in Chandigarh
E2Matrix
 
Lecture1
Mobeen Mustafa
 
Steam presentation deux 3 d prints from photographs
Scott Eastellerson
 
Computer Graphics Power Point using Open GL and C Programming
kemal678348
 
COMPUTER GRAPHICS DAY1
Barnali Gupta Banik
 
On constructing z dimensional Image By DIBR Synthesized Images
Jayakrishnan U
 
Game development terminologies
Ahmed Badr
 
3D Modelling and Animation
Saif Rehman Nasir
 
Reviewer in com graphics
Tricia Andrea Lorena Pongyan
 
CG.pptx
AdityaBisht34
 
cad 2jjkuigugjgugufygmbjgufjhjbjghnkihiu.pdf
220110072
 
Computer Graphics Unit 1 for BCA IV SEM.pptx
dgojms
 
427lects
Praveen Kumar
 
CG Module-01 Ntes Search Creators and .pdf
ISTEJCE
 
Computer Graphics in Mechanical engineering
RandomVideos22
 
Normal Mapping / Computer Graphics - IK
Ilgın Kavaklıoğulları
 
Overview of Computer Graphics
United International University
 

Recently uploaded (20)

PDF
Halide Perovskites’ Multifunctional Properties: Coordination Engineering, Coo...
TaameBerhe2
 
PPTX
Mechanical Design of shell and tube heat exchangers as per ASME Sec VIII Divi...
shahveer210504
 
PDF
Basic_Concepts_in_Clinical_Biochemistry_2018كيمياء_عملي.pdf
AdelLoin
 
PPT
Testing and final inspection of a solar PV system
MuhammadSanni2
 
PDF
3rd International Conference on Machine Learning and IoT (MLIoT 2025)
ClaraZara1
 
PPTX
How Industrial Project Management Differs From Construction.pptx
jamespit799
 
PPTX
Final Major project a b c d e f g h i j k l m
bharathpsnab
 
PPTX
Knowledge Representation : Semantic Networks
Amity University, Patna
 
PPTX
Distribution reservoir and service storage pptx
dhanashree78
 
PPTX
Water Resources Engineering (CVE 728)--Slide 4.pptx
mohammedado3
 
PPTX
Numerical-Solutions-of-Ordinary-Differential-Equations.pptx
SAMUKTHAARM
 
PDF
SERVERLESS PERSONAL TO-DO LIST APPLICATION
anushaashraf20
 
PPTX
Introduction to Internal Combustion Engines - Types, Working and Camparison.pptx
UtkarshPatil98
 
PPTX
澳洲电子毕业证澳大利亚圣母大学水印成绩单UNDA学生证网上可查学历
Taqyea
 
PDF
methodology-driven-mbse-murphy-july-hsv-huntsville6680038572db67488e78ff00003...
henriqueltorres1
 
PDF
Data structures notes for unit 2 in computer science.pdf
sshubhamsingh265
 
PDF
Submit Your Papers-International Journal on Cybernetics & Informatics ( IJCI)
IJCI JOURNAL
 
PPTX
What is Shot Peening | Shot Peening is a Surface Treatment Process
Vibra Finish
 
PDF
20ES1152 Programming for Problem Solving Lab Manual VRSEC.pdf
Ashutosh Satapathy
 
PPTX
Water Resources Engineering (CVE 728)--Slide 3.pptx
mohammedado3
 
Halide Perovskites’ Multifunctional Properties: Coordination Engineering, Coo...
TaameBerhe2
 
Mechanical Design of shell and tube heat exchangers as per ASME Sec VIII Divi...
shahveer210504
 
Basic_Concepts_in_Clinical_Biochemistry_2018كيمياء_عملي.pdf
AdelLoin
 
Testing and final inspection of a solar PV system
MuhammadSanni2
 
3rd International Conference on Machine Learning and IoT (MLIoT 2025)
ClaraZara1
 
How Industrial Project Management Differs From Construction.pptx
jamespit799
 
Final Major project a b c d e f g h i j k l m
bharathpsnab
 
Knowledge Representation : Semantic Networks
Amity University, Patna
 
Distribution reservoir and service storage pptx
dhanashree78
 
Water Resources Engineering (CVE 728)--Slide 4.pptx
mohammedado3
 
Numerical-Solutions-of-Ordinary-Differential-Equations.pptx
SAMUKTHAARM
 
SERVERLESS PERSONAL TO-DO LIST APPLICATION
anushaashraf20
 
Introduction to Internal Combustion Engines - Types, Working and Camparison.pptx
UtkarshPatil98
 
澳洲电子毕业证澳大利亚圣母大学水印成绩单UNDA学生证网上可查学历
Taqyea
 
methodology-driven-mbse-murphy-july-hsv-huntsville6680038572db67488e78ff00003...
henriqueltorres1
 
Data structures notes for unit 2 in computer science.pdf
sshubhamsingh265
 
Submit Your Papers-International Journal on Cybernetics & Informatics ( IJCI)
IJCI JOURNAL
 
What is Shot Peening | Shot Peening is a Surface Treatment Process
Vibra Finish
 
20ES1152 Programming for Problem Solving Lab Manual VRSEC.pdf
Ashutosh Satapathy
 
Water Resources Engineering (CVE 728)--Slide 3.pptx
mohammedado3
 
Ad

1 COMPUTER GRAPHICS.ppt

  • 3. What Is Computer Graphics? The creation , manipulation , analysis , and interaction with pictorial representations of objects and data using computers. More precisely: image synthesis
  • 4. WHY COMPUTER GRAPHICS? •About 50% of the brain neurons are associated with vision •Dominant form of computer output •Enrich the discovery process and facilitate new inventions
  • 5. GOALS OF COMPUTER GRAPHICS  Generate synthetic images  Do it in a practical way & scientifically sound.  And make it look easy…
  • 8. USES OF GRAPHICS • Special effects • Feature animation • Computer Games • Virtual environments • Visualization (science, business, cartography, ...) • Design • Interaction
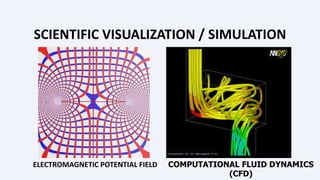
  • 11. SCIENTIFIC VISUALIZATION / SIMULATION ELECTROMAGNETIC POTENTIAL FIELD COMPUTATIONAL FLUID DYNAMICS (CFD)
  • 12. VIRTUAL REALITY Virtual tour of historical remains
  • 17. MOVIES If you can image it, it can be done with computer graphics! More than one billion dollars on special effects. No end in sight for this trend!
  • 21. ANIMATION Model how things move • Temporal change of – Objects (position, orientation, size, shape, color, etc.) – Camera (position, direction, angle, focus, etc.) – Illumination (position, direction, color, brightness) • Represent motion – Sequence of stills – Parameter curves
  • 24. MODELING How to represent real environments – Geometry: curves, surfaces, volumes – Photometry: light, color, reflectance • How to build these representations – Interactive: sculpt it – Algorithmic: let it grow (fractals, extraction) – Scanning: via 3D sensing • Generate primitives – Lines, triangles, quads, patches – Cylinder, spheres – Higher-order primitives
  • 29. 1. PIXEL Pixels are placed on a regular 2-dimensional grid, and are often represented using dots or squares. Each pixel is a sample of an original image, where more samples typically provide a more accurate representation of the original. The intensity of each pixel is variable; in color systems, each pixel has typically three components such as red, green, and blue.
  • 30. 2. GRAPHICS  Graphics are visual presentations on a surface, such as a computer screen. Examples are photographs, drawing, graphics designs, maps, engineering drawings, or other images.  Graphics often combine text and illustration. Graphic design consist of the deliberate selection, creation.
  • 31. 3. RENDERING  Rendering is the generation of a 2D image from a 3D model by means of computer programs.  A scene file contains objects in a strictly defined language or data structure; it would contain geometry, viewpoint, texture, lighting, and shading information as a description of the virtual scene.  The rendering program is usually built into the computer graphics software. The term "rendering" may be by analogy with an "artist's rendering" of a scene.
  • 38. 4. 3D PROJECTION  3D PROJECTIONS is a method of mapping 3D points to a 2D plane.  Current methods for displaying graphical data are based on planar two dimensional media, the use of this type of projection is widespread, especially in C.G, engineering and
  • 39. 5. RAY TRACING  Ray tracing is a method for creating an image by tracing the path of light via pixels in an image plane.  The technique is able of creating a high degree of photorealism; commonly higher than that of usual scan line rendering methods with a greater computational cost.
  • 40. 6. SHADING  Shading refers to depicting depth in three dimensional models by changing levels of darkness.  There are different techniques of shading with cross hatching where perpendicular lines of changing closeness are drawn in a grid pattern to shade a boundary.  The closer the lines are jointly, the darker the area shows. Likewise, the beyond apart the lines are, the lighter the area shows.
  • 41. 7. TEXTURE MAPPING Texture mapping is the process of mapping an image onto a triangle in order to increase the detail of the rendering. The image that gets mapped onto the triangle is called a texture map or texture and is usually a regular color image.