2. GIS
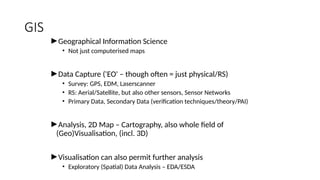
►Geographical Information Science
• Not just computerised maps
►Data Capture ('EO' – though often = just physical/RS)
• Survey: GPS, EDM, Laserscanner
• RS: Aerial/Satellite, but also other sensors, Sensor Networks
• Primary Data, Secondary Data (verification techniques/theory/PAI)
►Analysis, 2D Map – Cartography, also whole field of
(Geo)Visualisation, (incl. 3D)
►Visualisation can also permit further analysis
• Exploratory (Spatial) Data Analysis – EDA/ESDA
3. GIS – Three or Four Kinds
►Desktop Application / Full Package
►Web Mapping / Feature Server / Server GIS
►Web Browser with GIS Tools / Thick Client
►Apps, Mashups, APIs – Distributed GIS
4. Spatial Phenomena
►Land Use – Urban, Rural, Building Types
►Flood Risk, Water Transport, Soil Type
►Topography – Elevation, Slope, Aspect
• How does topog’ affect ‘occurrence’ in landscape
►People – Travel to work, shop, emergency services
5. Modelling
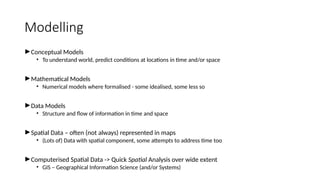
►Conceptual Models
• To understand world, predict conditions at locations in time and/or space
►Mathematical Models
• Numerical models where formalised - some idealised, some less so
►Data Models
• Structure and flow of information in time and space
►Spatial Data – often (not always) represented in maps
• (Lots of) Data with spatial component, some attempts to address time too
►Computerised Spatial Data -> Quick Spatial Analysis over wide extent
• GIS – Geographical Information Science (and/or Systems)
6. GIS History / Software
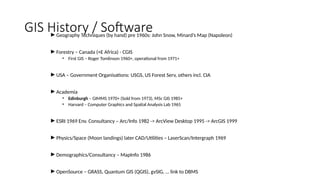
►Geography Techniques (by hand) pre 1960s: John Snow, Minard’s Map (Napoleon)
►Forestry – Canada (+E Africa) - CGIS
• First GIS – Roger Tomlinson 1960+, operational from 1971+
►USA – Government Organisations: USGS, US Forest Serv, others incl. CIA
►Academia
• Edinburgh – GIMMS 1970+ (Sold from 1973), MSc GIS 1985+
• Harvard – Computer Graphics and Spatial Analysis Lab 1965
►ESRI 1969 Env. Consultancy – Arc/Info 1982 -> ArcView Desktop 1995 -> ArcGIS 1999
►Physics/Space (Moon landings) later CAD/Utilities – LaserScan/Intergraph 1969
►Demographics/Consultancy – MapInfo 1986
►OpenSource – GRASS, Quantum GIS (QGIS), gvSIG, … link to DBMS
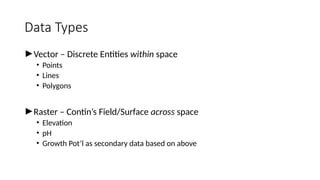
7. Data Types
►Vector – Discrete Entities within space
• Points
• Lines
• Polygons
►Raster – Contin’s Field/Surface across space
• Elevation
• pH
• Growth Pot’l as secondary data based on above
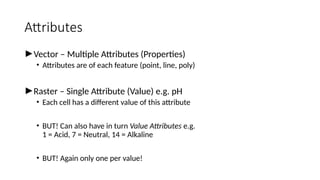
8. Attributes
►Vector – Multiple Attributes (Properties)
• Attributes are of each feature (point, line, poly)
►Raster – Single Attribute (Value) e.g. pH
• Each cell has a different value of this attribute
• BUT! Can also have in turn Value Attributes e.g.
1 = Acid, 7 = Neutral, 14 = Alkaline
• BUT! Again only one per value!
9. Model Framework to use – 1?
►Q. For mapping HGVs across Europe?
• Ans: Lines – A Linear Network (Vector)
• Lorries constrained to linear road network
• Each road can have multiple attributes: speed limit, length, width, number of
lanes
10. Model Framework to use – 2
►Q. To model flow/drainage in moorland?
• Ans: Raster Grid – A continuous surface
• Each cell can have a flow direction
• Need multiple spatially co-incident grids to combine in order to achieve end
result (answer)
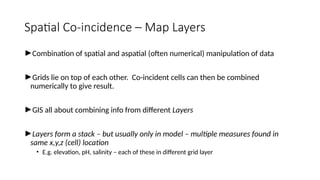
11. Spatial Co-incidence – Map Layers
►Combination of spatial and aspatial (often numerical) manipulation of data
►Grids lie on top of each other. Co-incident cells can then be combined
numerically to give result.
►GIS all about combining info from different Layers
►Layers form a stack – but usually only in model – multiple measures found in
same x,y,z (cell) location
• E.g. elevation, pH, salinity – each of these in different grid layer
12. Overlay – Attribute Transfer
►Can convert between raster + vector but limited and tend to be
treated in isolation but can be viewed together easily
►Can however easily combine vector layers – mathematical
combination of geometry – easy to cut-up and intersect => Vector
Overlay
►Vector Overlay all about Attribute Transfer
13. Overlay – Point in Polygon
►Which district has the most towns?
• Count the number of town points in each
district poly
►In which district does this town lie?
• Attribute (verb) each town with the name of
the district polygon in which it falls
►Points 'lie on top' of solid coloured polys
in our stack
14. Overlay – Polygon Overlay
►Degree of overlap between different districts/zones/catchment areas
►E.g. Erase SSSI polygons from potential Golf Course polygons (unless
you are a Trump)
►Intersect pollution zones with population zones (> 10,000 pop) to get
danger zones!
15. Co-ord’te Reference Systems (CRS) –
Map Projections, Datums
►Spatial Data can be measured/located in:
• Angular Units – Lat, Long, e.g. 56º23'4'' (dms), 56.38º (dd)
• Linear Units – Flat Grid-based: Easting, Northing, e.g. metres, ft
►Spherical (Angular) = 'Geographic' CRS (unprojected)
►Flat Planar (Linear) = 'Projected' CRS, e.g. BNG, UTM
►All CRS based on a reference datum – a model of the Earth’s surface/shape. This MUST be
correctly defined, for any later projection (curved to flat) to WORK correctly.
►If collecting GPS data in Britain, we want to end up in BNG but MUST define source data as
WGS84 datum / geographic sys as THAT is what the GPS uses. Once source data defined we can
project to BNG.
16. Simple GIS – Google Earth
►Last point less of an issue if using Simple GIS – Google Earth – uses WGS84 lat long; loads in KML
files – now often saved by GPS software directly. E.g. GPS Utility. Or just write raw KML or use
converter prog.
►Simple annotation / measurement tools etc. but also clever features, e.g. timestamp allows
animation/viewing change through time
►Beware – Google Maps uses its own Mercator projection but you can link to KML URL in Google
Maps
►Can make 'mashups': Google Maps, JavaScript, WMS, Scanned Maps
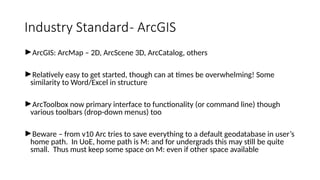
17. Industry Standard- ArcGIS
►ArcGIS: ArcMap – 2D, ArcScene 3D, ArcCatalog, others
►Relatively easy to get started, though can at times be overwhelming! Some
similarity to Word/Excel in structure
►ArcToolbox now primary interface to functionality (or command line) though
various toolbars (drop-down menus) too
►Beware – from v10 Arc tries to save everything to a default geodatabase in user’s
home path. In UoE, home path is M: and for undergrads this may still be quite
small. Thus must keep some space on M: even if other space available
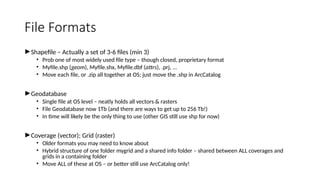
18. File Formats
►Shapefile – Actually a set of 3-6 files (min 3)
• Prob one of most widely used file type – though closed, proprietary format
• Myfile.shp (geom), Myfile.shx, Myfile.dbf (attrs), .prj, ...
• Move each file, or .zip all together at OS; just move the .shp in ArcCatalog
►Geodatabase
• Single file at OS level – neatly holds all vectors & rasters
• File Geodatabase now 1Tb (and there are ways to get up to 256 Tb!)
• In time will likely be the only thing to use (other GIS still use shp for now)
►Coverage (vector); Grid (raster)
• Older formats you may need to know about
• Hybrid structure of one folder mygrid and a shared info folder – shared between ALL coverages and
grids in a containing folder
• Move ALL of these at OS – or better still use ArcCatalog only!
19. Data Storage Theory
►Hybrid Arc/Info model based on storing correct type of data in best place for that
►Data can be re-joined when required
►Same principle means store only relevant info in a table of particular feature
types and join these at query/display time – also use key tables & numbers to
reduce data vols
►Relational DBs good for this and can store spatial data – Many offer spatial
extensions with spatial analysis functions
20. Database Storage
►Can connect GIS to RDBMS for:
• Better querying
• Robust storage
• Multi-user access and sophisticated control (only one user edits electoral
district at a time!)
►Examples:
• ArcSDE – Create GeoDatabase in RDBMS
• SPIT – Connects QGIS to PostgreSQL(PostGIS)
21. Open (Source) GIS
►PostGIS, MySQL – Open Source DBMS – implement OGC standards
►OGC – Consortium of 482 Companies/Orgs – Define Open Standards
►OSGeo Found’n – Support develop’t of op’n source Geospatial software
►GRASS – Orig. US Army, now project of OS Geo
►GDAL (Conversion), GEOS (Geometry), rasdaman (rasters)
►Quantum GIS (QGIS) – Another OSGeo Project
• MapServer export, OpenStreetMap editor, Run GRASS datasets/tools within
►MapTiler (uses GDAL2Tiles) – Create OpenLayers/Google Maps Tilesets
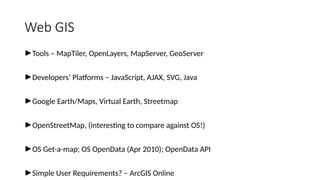
22. Web GIS
►Tools – MapTiler, OpenLayers, MapServer, GeoServer
►Developers’ Platforms – JavaScript, AJAX, SVG, Java
►Google Earth/Maps, Virtual Earth, Streetmap
►OpenStreetMap, (interesting to compare against OS!)
►OS Get-a-map; OS OpenData (Apr 2010); OpenData API
►Simple User Requirements? – ArcGIS Online
23. The Future 1 – PDAs, AR, Apps
►Move from mainframe to desktop to distributed desktops, and
distributed servers
►PDAs and Phones – ArcPad, GPS Maps
►Augmented Reality – Scan horizon, Utilities
►AIS – Ships, Planes – Track in Google Earth
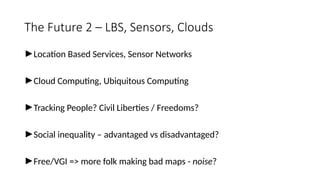
24. The Future 2 – LBS, Sensors, Clouds
►Location Based Services, Sensor Networks
►Cloud Computing, Ubiquitous Computing
►Tracking People? Civil Liberties / Freedoms?
►Social inequality – advantaged vs disadvantaged?
►Free/VGI => more folk making bad maps - noise?
26. Fundamentals of GIS
GIS for Spatial Planning
Training for Ministry of Transport
Mozambique
Maputo, Mozambique
2-13 July 2018
Geoinformation and Sectoral Statistics
27. 27
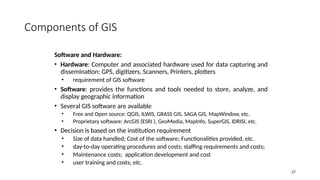
Components of GIS
Software and Hardware:
• Hardware: Computer and associated hardware used for data capturing and
dissemination: GPS, digitizers, Scanners, Printers, plotters
• requirement of GIS software
• Software: provides the functions and tools needed to store, analyze, and
display geographic information
• Several GIS software are available
• Free and Open source: QGIS, ILWIS, GRASS GIS, SAGA GIS, MapWindow, etc.
• Proprietary software: ArcGIS (ESRI ), GeoMedia, MapInfo, SuperGIS, IDRISI, etc.
• Decision is based on the institution requirement
• Size of data handled; Cost of the software; Functionalities provided, etc.
• day-to-day operating procedures and costs; staffing requirements and costs;
• Maintenance costs; application development and cost
• user training and costs; etc.
28. 28
Components of GIS
• Data: is important part of a GIS
• The most expensive component of a GIS.
• due to the high costs of data acquisition, especially using
remotely sensing earth observation satellites.
• Building the database also takes a lot of time, and
large amount of money.
• Implementing a Geospatial database requires
planning and choosing the right information base for
the particular application of an organization/business.
29. 29
Components of GIS
• The people: transform the geographic/(geo)spatial data in
a form usable by every one, the geospatial information.
• GIS is an interdisciplinary field that requires varied
backgrounds of expertise (the people) depending on the
applications in use
• Policies and Institutional frameworks: also important for
a functional GIS.
• The interest and willingness of decision makers to exploit GIS
technology, and
• The organizational setup for collecting spatial data, analyzing, and
using the results for planning and implementation
30. • GIS Data input, storage and retrieval
• Data manipulation and analysis
• Data output/display or visualization
• Database management
30
Functionalities of GIS
31. • Spatial /Geospatial data is raw data distinguished by
the presence of a geographic link; connected to a
known place on the earth
• Represent objects or phenomena with specific
location in space
• Geospatial data is geographically/spatially referenced
in some consistent manner, such as by means of
latitude and longitude, a national coordinate system,
postal codes, or electoral area
• Geographic information/Geo-information is a specific
type of information resulting form interpretation of
spatial data/geospatial data 31
Geospatial Data
32. • Two important components of geospatial data:
geographic position and attributes or properties
• Geographic position specifies the location of a
feature or phenomenon by using a coordinate system
(x, y, z)
• Attributes /non spatial data refer to the various
properties of the phenomenon or feature
• GIS software use database management systems to
handle attribute or non-spatial data
• Provides the link between the geographic
position/spatial data and attribute/non-spatial data 32
Geospatial Data
33. 33
Geospatial Data Sources
• GIS handles different data from different
sources to produce new information
• Geospatial data acquired using different
sources
• Common data sources:
Paper maps,
Existing digital data
Aerial photographs
GPS (Global Positioning
Systems)
Surveying instruments, e.g. Total
Station
Imageries from Remote-sensing
satellites/ Earth observation
satellites and
Laser Scanners, usually mounted
in Aircrafts
Drones and UAVs
34. 34
Geospatial Data Sources
• Earth observation data: most commonly used data
sources
• Earth observation is gathering of information about
the planet earth
• Earth observation satellites are satellites specifically
designed to observe Earth from space
• Data from Earth observation satellites/ Remote
sensing satellites are processed into images: remote
sensing images, satellite imageries or satellite data
35. 35
• Data collected using GPS can be imported in to a GIS
system
• Global Positioning Systems (GPS) used for data
collection and capture
• GPS is a space-based satellite navigation system that
provides location and time information
Geospatial Data Sources
GPS is one of the Global Navigation
Satellite Systems (GNSS);
Other GNSS include: GLONASS
(Russia), Galileo(Europe), Beidou
(China)
36. 36
• Existing digital data are available in different formats
• Features extracted from satellite images using image
processing techniques, already existing in different
databases
• Most GIS databases created with data converted
from paper maps/ Arial photo
• Digital maps, datasets and image data are available in
the Internet, in different data portals
Geospatial Data Sources
37. 37
• 80% of all data are related to a geographical position
• Nearly every problem has some component of
location information
• GIS technology is used by a variety of professionals
for a broad range of applications
• Users: Government offices, research organizations &
academia, International/UN agencies, etc. for
decisions support, planning, research, etc.
Applications of GIS
38. 38
Examples of applications:
• Water Resource Management
• Land degradation, Land use and Land cover change
• Disaster Risk Management
• Climate Change Mitigation and Adaptation
• Food Security and Poverty Reduction
• Health and Telemedicine
• Land Administration/Cadastre,
• Socio-Economic mapping,
• Utility Management,
• Transport
• Media (e.g. TV: for Reporting, Marketing, Advertising, etc.)
Applications of GIS
Editor's Notes
#28:Data is not only important part of a GIS but also the most expensive component of a GIS
This is due to the generally high costs of data acquisition, especially using remotely sensing earth observation satellites
#29:People enter, manipulate, analyze and transform the data into information usable by every one.
Besides the technical components, policies and institutional frameworks are important for a functional GIS
not only the necessary investments in hardware and software, but also in the retraining and/or hiring of personnel to utilize the new technology in the proper organizational context
new tools can only be used effectively if they are properly integrated into the entire business strategy and operation
#30:Data created or imported into the GIS and stored in files or databases
Data manipulation including conversion of formats, from one data format into another; integration of the different data types and formats, etc.
Analysis of the data to find new information and trends; several anlysis techniques and tools are available in GIS systems
The most important feature of GIS is the display/ visualization. It is the visualization of the data which makes it unique from other information systems. Maps and graphic displays are associated with the data
GIS uses special types of databases to handle the data and the location information; manging the database is one important functions
#32:suitable to visualize the data as a table and the spatial component of the features as maps on the screen
#35:Global Navigation Satellite System (GNSS) refers to a constellation of satellites providing signals from space that transmit positioning and timing data to GNSS receivers. The receivers then use this data to determine location.
#36:We can make use of such resources with little or no cost
#37:GIS is a useful tool for nearly every field of knowledge. GIS benefits organizations of all sizes and in almost every industry.
#38:Water resource management: assessment of water resources; watersheds and basin level management
Health sector benefit in mapping vulnerability and prevalence, in malaria, disease outbreak, identify risk areas, etc.
To decide where best to build new schools based on population density and proximity to health facilities
Utility companies use maps to keep an accurate and up-to-date record of their infrastructure for maintenance and planning purposes