This document discusses feature engineering, which is the process of transforming raw data into features that better represent the underlying problem for predictive models. It covers feature engineering categories like feature selection, feature transformation, and feature extraction. Specific techniques covered include imputation, handling outliers, binning, log transforms, scaling, and feature subset selection methods like filter, wrapper, and embedded methods. The goal of feature engineering is to improve machine learning model performance by preparing proper input data compatible with algorithm requirements.
Python software development provides ease of programming to the developers and gives quick results for any kind of projects. Suma Soft is an expert company providing complete Python software development services for small, mid and big level companies. It holds an expertise for 19 years and is backed up by a strong patronage. To know more- https://www.sumasoft.com/python-software-development
The document discusses the key steps involved in data pre-processing for machine learning:
1. Data cleaning involves removing noise from data by handling missing values, smoothing outliers, and resolving inconsistencies.
2. Data transformation strategies include data aggregation, feature scaling, normalization, and feature selection to prepare the data for analysis.
3. Data reduction techniques like dimensionality reduction and sampling are used to reduce large datasets size by removing redundant features or clustering data while maintaining most of the information.
IRJET - An Overview of Machine Learning Algorithms for Data ScienceIRJET Journal
This document provides an overview of machine learning algorithms that are commonly used for data science. It discusses both supervised and unsupervised algorithms. For supervised algorithms, it describes decision trees, k-nearest neighbors, and linear regression. Decision trees create a hierarchical structure to classify data, k-nearest neighbors classifies new data based on similarity to existing data, and linear regression finds a linear relationship between variables. Unsupervised algorithms like clustering are also briefly mentioned. The document aims to familiarize data science enthusiasts with basic machine learning techniques.
Feature Engineering in Machine LearningKnoldus Inc.
In this Knolx we are going to explore Data Preprocessing and Feature Engineering Techniques. We will also understand what is Feature Engineering and its importance in Machine Learning. How Feature Engineering can help in getting the best results from the algorithms.
IRJET - An User Friendly Interface for Data Preprocessing and Visualizati...IRJET Journal
This document presents a tool for preprocessing and visualizing data using machine learning models. It aims to simplify the preprocessing steps for users by performing tasks like data cleaning, transformation, and reduction. The tool takes in a raw dataset, cleans it by removing missing values, outliers, etc. It then allows users to apply machine learning algorithms like linear regression, KNN, random forest for analysis. The processed and predicted data can be visualized. The tool is intended to save time by automating preprocessing and providing visual outputs for analysis using machine learning models on large datasets.
This brief work is aimed in the direction of basics of data sciences and model building with focus on implementation on fairly sizable dataset. It focuses on cleaning the data, visualization, EDA, feature scaling, feature normalization, k-nearest neighbor, logistic regression, random forests, cross validation without delving too deep into any of them but giving a start to a new learner.
Data Warehousing and Business Intelligence is one of the hottest skills today, and is the cornerstone for reporting, data science, and analytics. This course teaches the fundamentals with examples plus a project to fully illustrate the concepts.
Data preprocessing is required because real-world data is often incomplete, noisy, inconsistent, and in an aggregate form. The goals of data preprocessing include handling missing data, smoothing out noisy data, resolving inconsistencies, computing aggregate attributes, reducing data volume to improve mining performance, and improving overall data quality. Key techniques for data preprocessing include data cleaning, data integration, data transformation, and data reduction.
Machine Learning Approaches and its Challengesijcnes
Real world data sets considerably is not in a proper manner. They may lead to have incomplete or missing values. Identifying a missed attributes is a challenging task. To impute the missing data, data preprocessing has to be done. Data preprocessing is a data mining process to cleanse the data. Handling missing data is a crucial part in any data mining techniques. Major industries and many real time applications hardly worried about their data. Because loss of data leads the company growth goes down. For example, health care industry has many datas about the patient details. To diagnose the particular patient we need an exact data. If these exist missing attribute values means it is very difficult to retain the datas. Considering the drawback of missing values in the data mining process, many techniques and algorithms were implemented and many of them not so efficient. This paper tends to elaborate the various techniques and machine learning approaches in handling missing attribute values and made a comparative analysis to identify the efficient method.
Exploratory Data Analysis (EDA) is used to analyze datasets and summarize their main characteristics visually. EDA involves data sourcing, cleaning, univariate analysis with visualization to understand single variables, bivariate analysis with visualization to understand relationships between two variables, and deriving new metrics from existing data. EDA is an important first step for understanding data and gaining confidence before building machine learning models. It helps detect errors, anomalies, and map data structures to inform question asking and data manipulation for answering questions.
Data Science & AI Road Map by Python & Computer science tutor in MalaysiaAhmed Elmalla
The slides were used in a trial session for a student aiming to learn python to do Data science projects .
The session video can be watched from the link below
https://youtu.be/CwCe1pKOVI8
I have over 20 years of experience in both teaching & in completing computer science projects with certificates from Stanford, Alberta, Pennsylvania, California Irvine universities.
I teach the following subjects:
1) IGCSE A-level 9618 / AS-Level
2) AP Computer Science exam A
3) Python (basics, automating staff, Data Analysis, AI & Flask)
4) Java (using Duke University syllabus)
5) Descriptive statistics using SQL
6) PHP, SQL, MYSQL & Codeigniter framework (using University of Michigan syllabus)
7) Android Apps development using Java
8) C / C++ (using University of Colorado syllabus)
Check Trial Classes:
1) A-Level Trial Class : https://youtu.be/v3k7A0nNb9Q
2) AS level trial Class : https://youtu.be/wj14KpfbaPo
3) 0478 IGCSE class : https://youtu.be/sG7PrqagAes
4) AI & Data Science class: https://youtu.be/CwCe1pKOVI8
https://elmalla.info/blog/68-tutor-profile-slide-share
You can get your trial Class now by booking : https://calendly.com/ahmed-elmalla/30min
And you can contact me on
https://wa.me/0060167074241
by Python & Computer science tutor in Malaysia
This document provides an overview of machine learning algorithms and their applications in the financial industry. It begins with brief introductions of the authors and their backgrounds in applying artificial intelligence to retail. It then covers key machine learning concepts like supervised and unsupervised learning as well as algorithms like logistic regression, decision trees, boosting and time series analysis. Examples are provided for how these techniques can be used for applications like predicting loan risk and intelligent loan applications. Overall, the document aims to give a high-level view of machine learning in finance through discussing algorithms and their uses in areas like risk analysis.
Machine Learning Algorithm for Business Strategy.pdfPhD Assistance
Many algorithms are based on the idea that classes can be divided along a straight line (or its higher-dimensional analog). Support vector machines and logistic regression are two examples.
For #Enquiry:
Website: https://www.phdassistance.com/blog/a-simple-guide-to-assist-you-in-selecting-the-best-machine-learning-algorithm-for-business-strategy/
India: +91 91769 66446
Email: [email protected]
Feature extraction and selection are important techniques in machine learning. Feature extraction transforms raw data into meaningful features that better represent the data. This reduces dimensionality and complexity. Good features are unique to an object and prevalent across many data samples. Principal component analysis is an important dimensionality reduction technique that transforms correlated features into linearly uncorrelated principal components. This both reduces dimensionality and preserves information.
Survey paper on Big Data Imputation and Privacy AlgorithmsIRJET Journal
This document summarizes issues related to big data mining and algorithms to address them. It discusses data imputation algorithms like refined mean substitution and k-nearest neighbors to handle missing data. It also discusses privacy protection algorithms like association rule hiding that use data distortion or blocking methods to hide sensitive rules while preserving utility. The document reviews literature on these topics and concludes that algorithms are needed to address big data challenges involving data collection, protection, and quality.
Statistical theory is a branch of mathematics and statistics that provides the foundation for understanding and working with data, making inferences, and drawing conclusions from observed phenomena. It encompasses a wide range of concepts, principles, and techniques for analyzing and interpreting data in a systematic and rigorous manner. Statistical theory is fundamental to various fields, including science, social science, economics, engineering, and more.
Survey on Feature Selection and Dimensionality Reduction TechniquesIRJET Journal
This document discusses dimensionality reduction techniques for data mining. It begins with an introduction explaining why dimensionality reduction is important for effective machine learning and data mining. It then describes several popular dimensionality reduction algorithms, including Singular Value Decomposition (SVD), Partial Least Squares Regression (PLSR), Linear Discriminant Analysis (LDA), and Locally Linear Embedding (LLE). For each technique, it provides a brief overview of the algorithm and its applications. The document serves to analyze and compare various dimensionality reduction methods and their strengths and weaknesses.
Dimensionality reduction techniques transform high-dimensional data into a lower-dimensional representation while retaining important information. Principal component analysis (PCA) is a common linear technique that projects data along directions of maximum variance to obtain principal components as new uncorrelated variables. It works by computing the covariance matrix of standardized data to identify correlations, then computes the eigenvalues and eigenvectors of the covariance matrix to identify the principal components that capture the most information with fewer dimensions.
This report contains:-
1. what is data analytics, its usages, its types.
2. Tools used for data analytics
3. description of Classification
4. description of the association
5. description of clustering
6. decision tree, SVM modelling etc with example
IRJET - Comparative Analysis of GUI based Prediction of Parkinson Disease usi...IRJET Journal
This document describes a comparative analysis of GUI-based machine learning approaches for predicting Parkinson's disease. It analyzes various machine learning algorithms including logistic regression, decision trees, support vector machines, random forests, k-nearest neighbors, and naive Bayes. The document discusses data preprocessing techniques like variable identification, data validation, cleaning and preparing. It also covers data visualization and evaluating model performance using accuracy calculations. The goal is to compare the performance of these machine learning algorithms and identify the approach that predicts Parkinson's disease with the highest accuracy based on a given hospital dataset.
This document provides an overview of dimensionality reduction techniques including PCA, LDA, and KPCA. It discusses how PCA identifies orthogonal axes that capture maximum variance in the data to reduce dimensions. LDA finds linear combinations of features that maximize separation between classes. KPCA extends PCA by applying a nonlinear mapping to data before reducing dimensions, allowing it to model nonlinear relationships unlike PCA.
This document discusses various techniques for data reduction, including dimensionality reduction, sampling, binning/cardinality reduction, and parametric methods like regression and log-linear models. Dimensionality reduction techniques aim to reduce the number of attributes/variables, like principal component analysis (PCA) and feature selection. Sampling reduces the number of data instances. Binning and cardinality reduction transform data into a reduced representation. Parametric methods model the data and store only the parameters.
CLASSIFICATION ALGORITHM USING RANDOM CONCEPT ON A VERY LARGE DATA SET: A SURVEYEditor IJMTER
Data mining environment produces a large amount of data, that need to be
analyses, pattern have to be extracted from that to gain knowledge. In this new period with
rumble of data both ordered and unordered, by using traditional databases and architectures, it
has become difficult to process, manage and analyses patterns. To gain knowledge about the
Big Data a proper architecture should be understood. Classification is an important data mining
technique with broad applications to classify the various kinds of data used in nearly every
field of our life. Classification is used to classify the item according to the features of the item
with respect to the predefined set of classes. This paper provides an inclusive survey of
different classification algorithms and put a light on various classification algorithms including
j48, C4.5, k-nearest neighbor classifier, Naive Bayes, SVM etc., using random concept.
Data Cleaning and Preprocessing: Ensuring Data Qualitypriyanka rajput
data cleaning and preprocessing are foundational steps in the data science and machine learning pipelines. Neglecting these crucial steps can lead to inaccurate results, biased models, and erroneous conclusions. By investing time and effort in /data cleaning and preprocessing, data scientists and analysts ensure that their analyses and models are built on a solid foundation of high-quality data.
Geography Sem II Unit 1C Correlation of Geography with other school subjectsProfDrShaikhImran
The correlation of school subjects refers to the interconnectedness and mutual reinforcement between different academic disciplines. This concept highlights how knowledge and skills in one subject can support, enhance, or overlap with learning in another. Recognizing these correlations helps in creating a more holistic and meaningful educational experience.
Ad
More Related Content
Similar to 13_Data Preprocessing in Python.pptx (1).pdf (20)
Data Warehousing and Business Intelligence is one of the hottest skills today, and is the cornerstone for reporting, data science, and analytics. This course teaches the fundamentals with examples plus a project to fully illustrate the concepts.
Data preprocessing is required because real-world data is often incomplete, noisy, inconsistent, and in an aggregate form. The goals of data preprocessing include handling missing data, smoothing out noisy data, resolving inconsistencies, computing aggregate attributes, reducing data volume to improve mining performance, and improving overall data quality. Key techniques for data preprocessing include data cleaning, data integration, data transformation, and data reduction.
Machine Learning Approaches and its Challengesijcnes
Real world data sets considerably is not in a proper manner. They may lead to have incomplete or missing values. Identifying a missed attributes is a challenging task. To impute the missing data, data preprocessing has to be done. Data preprocessing is a data mining process to cleanse the data. Handling missing data is a crucial part in any data mining techniques. Major industries and many real time applications hardly worried about their data. Because loss of data leads the company growth goes down. For example, health care industry has many datas about the patient details. To diagnose the particular patient we need an exact data. If these exist missing attribute values means it is very difficult to retain the datas. Considering the drawback of missing values in the data mining process, many techniques and algorithms were implemented and many of them not so efficient. This paper tends to elaborate the various techniques and machine learning approaches in handling missing attribute values and made a comparative analysis to identify the efficient method.
Exploratory Data Analysis (EDA) is used to analyze datasets and summarize their main characteristics visually. EDA involves data sourcing, cleaning, univariate analysis with visualization to understand single variables, bivariate analysis with visualization to understand relationships between two variables, and deriving new metrics from existing data. EDA is an important first step for understanding data and gaining confidence before building machine learning models. It helps detect errors, anomalies, and map data structures to inform question asking and data manipulation for answering questions.
Data Science & AI Road Map by Python & Computer science tutor in MalaysiaAhmed Elmalla
The slides were used in a trial session for a student aiming to learn python to do Data science projects .
The session video can be watched from the link below
https://youtu.be/CwCe1pKOVI8
I have over 20 years of experience in both teaching & in completing computer science projects with certificates from Stanford, Alberta, Pennsylvania, California Irvine universities.
I teach the following subjects:
1) IGCSE A-level 9618 / AS-Level
2) AP Computer Science exam A
3) Python (basics, automating staff, Data Analysis, AI & Flask)
4) Java (using Duke University syllabus)
5) Descriptive statistics using SQL
6) PHP, SQL, MYSQL & Codeigniter framework (using University of Michigan syllabus)
7) Android Apps development using Java
8) C / C++ (using University of Colorado syllabus)
Check Trial Classes:
1) A-Level Trial Class : https://youtu.be/v3k7A0nNb9Q
2) AS level trial Class : https://youtu.be/wj14KpfbaPo
3) 0478 IGCSE class : https://youtu.be/sG7PrqagAes
4) AI & Data Science class: https://youtu.be/CwCe1pKOVI8
https://elmalla.info/blog/68-tutor-profile-slide-share
You can get your trial Class now by booking : https://calendly.com/ahmed-elmalla/30min
And you can contact me on
https://wa.me/0060167074241
by Python & Computer science tutor in Malaysia
This document provides an overview of machine learning algorithms and their applications in the financial industry. It begins with brief introductions of the authors and their backgrounds in applying artificial intelligence to retail. It then covers key machine learning concepts like supervised and unsupervised learning as well as algorithms like logistic regression, decision trees, boosting and time series analysis. Examples are provided for how these techniques can be used for applications like predicting loan risk and intelligent loan applications. Overall, the document aims to give a high-level view of machine learning in finance through discussing algorithms and their uses in areas like risk analysis.
Machine Learning Algorithm for Business Strategy.pdfPhD Assistance
Many algorithms are based on the idea that classes can be divided along a straight line (or its higher-dimensional analog). Support vector machines and logistic regression are two examples.
For #Enquiry:
Website: https://www.phdassistance.com/blog/a-simple-guide-to-assist-you-in-selecting-the-best-machine-learning-algorithm-for-business-strategy/
India: +91 91769 66446
Email: [email protected]
Feature extraction and selection are important techniques in machine learning. Feature extraction transforms raw data into meaningful features that better represent the data. This reduces dimensionality and complexity. Good features are unique to an object and prevalent across many data samples. Principal component analysis is an important dimensionality reduction technique that transforms correlated features into linearly uncorrelated principal components. This both reduces dimensionality and preserves information.
Survey paper on Big Data Imputation and Privacy AlgorithmsIRJET Journal
This document summarizes issues related to big data mining and algorithms to address them. It discusses data imputation algorithms like refined mean substitution and k-nearest neighbors to handle missing data. It also discusses privacy protection algorithms like association rule hiding that use data distortion or blocking methods to hide sensitive rules while preserving utility. The document reviews literature on these topics and concludes that algorithms are needed to address big data challenges involving data collection, protection, and quality.
Statistical theory is a branch of mathematics and statistics that provides the foundation for understanding and working with data, making inferences, and drawing conclusions from observed phenomena. It encompasses a wide range of concepts, principles, and techniques for analyzing and interpreting data in a systematic and rigorous manner. Statistical theory is fundamental to various fields, including science, social science, economics, engineering, and more.
Survey on Feature Selection and Dimensionality Reduction TechniquesIRJET Journal
This document discusses dimensionality reduction techniques for data mining. It begins with an introduction explaining why dimensionality reduction is important for effective machine learning and data mining. It then describes several popular dimensionality reduction algorithms, including Singular Value Decomposition (SVD), Partial Least Squares Regression (PLSR), Linear Discriminant Analysis (LDA), and Locally Linear Embedding (LLE). For each technique, it provides a brief overview of the algorithm and its applications. The document serves to analyze and compare various dimensionality reduction methods and their strengths and weaknesses.
Dimensionality reduction techniques transform high-dimensional data into a lower-dimensional representation while retaining important information. Principal component analysis (PCA) is a common linear technique that projects data along directions of maximum variance to obtain principal components as new uncorrelated variables. It works by computing the covariance matrix of standardized data to identify correlations, then computes the eigenvalues and eigenvectors of the covariance matrix to identify the principal components that capture the most information with fewer dimensions.
This report contains:-
1. what is data analytics, its usages, its types.
2. Tools used for data analytics
3. description of Classification
4. description of the association
5. description of clustering
6. decision tree, SVM modelling etc with example
IRJET - Comparative Analysis of GUI based Prediction of Parkinson Disease usi...IRJET Journal
This document describes a comparative analysis of GUI-based machine learning approaches for predicting Parkinson's disease. It analyzes various machine learning algorithms including logistic regression, decision trees, support vector machines, random forests, k-nearest neighbors, and naive Bayes. The document discusses data preprocessing techniques like variable identification, data validation, cleaning and preparing. It also covers data visualization and evaluating model performance using accuracy calculations. The goal is to compare the performance of these machine learning algorithms and identify the approach that predicts Parkinson's disease with the highest accuracy based on a given hospital dataset.
This document provides an overview of dimensionality reduction techniques including PCA, LDA, and KPCA. It discusses how PCA identifies orthogonal axes that capture maximum variance in the data to reduce dimensions. LDA finds linear combinations of features that maximize separation between classes. KPCA extends PCA by applying a nonlinear mapping to data before reducing dimensions, allowing it to model nonlinear relationships unlike PCA.
This document discusses various techniques for data reduction, including dimensionality reduction, sampling, binning/cardinality reduction, and parametric methods like regression and log-linear models. Dimensionality reduction techniques aim to reduce the number of attributes/variables, like principal component analysis (PCA) and feature selection. Sampling reduces the number of data instances. Binning and cardinality reduction transform data into a reduced representation. Parametric methods model the data and store only the parameters.
CLASSIFICATION ALGORITHM USING RANDOM CONCEPT ON A VERY LARGE DATA SET: A SURVEYEditor IJMTER
Data mining environment produces a large amount of data, that need to be
analyses, pattern have to be extracted from that to gain knowledge. In this new period with
rumble of data both ordered and unordered, by using traditional databases and architectures, it
has become difficult to process, manage and analyses patterns. To gain knowledge about the
Big Data a proper architecture should be understood. Classification is an important data mining
technique with broad applications to classify the various kinds of data used in nearly every
field of our life. Classification is used to classify the item according to the features of the item
with respect to the predefined set of classes. This paper provides an inclusive survey of
different classification algorithms and put a light on various classification algorithms including
j48, C4.5, k-nearest neighbor classifier, Naive Bayes, SVM etc., using random concept.
Data Cleaning and Preprocessing: Ensuring Data Qualitypriyanka rajput
data cleaning and preprocessing are foundational steps in the data science and machine learning pipelines. Neglecting these crucial steps can lead to inaccurate results, biased models, and erroneous conclusions. By investing time and effort in /data cleaning and preprocessing, data scientists and analysts ensure that their analyses and models are built on a solid foundation of high-quality data.
Geography Sem II Unit 1C Correlation of Geography with other school subjectsProfDrShaikhImran
The correlation of school subjects refers to the interconnectedness and mutual reinforcement between different academic disciplines. This concept highlights how knowledge and skills in one subject can support, enhance, or overlap with learning in another. Recognizing these correlations helps in creating a more holistic and meaningful educational experience.
How to Set warnings for invoicing specific customers in odooCeline George
Odoo 16 offers a powerful platform for managing sales documents and invoicing efficiently. One of its standout features is the ability to set warnings and block messages for specific customers during the invoicing process.
A measles outbreak originating in West Texas has been linked to confirmed cases in New Mexico, with additional cases reported in Oklahoma and Kansas. The current case count is 817 from Texas, New Mexico, Oklahoma, and Kansas. 97 individuals have required hospitalization, and 3 deaths, 2 children in Texas and one adult in New Mexico. These fatalities mark the first measles-related deaths in the United States since 2015 and the first pediatric measles death since 2003.
The YSPH Virtual Medical Operations Center Briefs (VMOC) were created as a service-learning project by faculty and graduate students at the Yale School of Public Health in response to the 2010 Haiti Earthquake. Each year, the VMOC Briefs are produced by students enrolled in Environmental Health Science Course 581 - Public Health Emergencies: Disaster Planning and Response. These briefs compile diverse information sources – including status reports, maps, news articles, and web content– into a single, easily digestible document that can be widely shared and used interactively. Key features of this report include:
- Comprehensive Overview: Provides situation updates, maps, relevant news, and web resources.
- Accessibility: Designed for easy reading, wide distribution, and interactive use.
- Collaboration: The “unlocked" format enables other responders to share, copy, and adapt seamlessly. The students learn by doing, quickly discovering how and where to find critical information and presenting it in an easily understood manner.
CURRENT CASE COUNT: 817 (As of 05/3/2025)
• Texas: 688 (+20)(62% of these cases are in Gaines County).
• New Mexico: 67 (+1 )(92.4% of the cases are from Eddy County)
• Oklahoma: 16 (+1)
• Kansas: 46 (32% of the cases are from Gray County)
HOSPITALIZATIONS: 97 (+2)
• Texas: 89 (+2) - This is 13.02% of all TX cases.
• New Mexico: 7 - This is 10.6% of all NM cases.
• Kansas: 1 - This is 2.7% of all KS cases.
DEATHS: 3
• Texas: 2 – This is 0.31% of all cases
• New Mexico: 1 – This is 1.54% of all cases
US NATIONAL CASE COUNT: 967 (Confirmed and suspected):
INTERNATIONAL SPREAD (As of 4/2/2025)
• Mexico – 865 (+58)
‒Chihuahua, Mexico: 844 (+58) cases, 3 hospitalizations, 1 fatality
• Canada: 1531 (+270) (This reflects Ontario's Outbreak, which began 11/24)
‒Ontario, Canada – 1243 (+223) cases, 84 hospitalizations.
• Europe: 6,814
The *nervous system of insects* is a complex network of nerve cells (neurons) and supporting cells that process and transmit information. Here's an overview:
Structure
1. *Brain*: The insect brain is a complex structure that processes sensory information, controls behavior, and integrates information.
2. *Ventral nerve cord*: A chain of ganglia (nerve clusters) that runs along the insect's body, controlling movement and sensory processing.
3. *Peripheral nervous system*: Nerves that connect the central nervous system to sensory organs and muscles.
Functions
1. *Sensory processing*: Insects can detect and respond to various stimuli, such as light, sound, touch, taste, and smell.
2. *Motor control*: The nervous system controls movement, including walking, flying, and feeding.
3. *Behavioral responThe *nervous system of insects* is a complex network of nerve cells (neurons) and supporting cells that process and transmit information. Here's an overview:
Structure
1. *Brain*: The insect brain is a complex structure that processes sensory information, controls behavior, and integrates information.
2. *Ventral nerve cord*: A chain of ganglia (nerve clusters) that runs along the insect's body, controlling movement and sensory processing.
3. *Peripheral nervous system*: Nerves that connect the central nervous system to sensory organs and muscles.
Functions
1. *Sensory processing*: Insects can detect and respond to various stimuli, such as light, sound, touch, taste, and smell.
2. *Motor control*: The nervous system controls movement, including walking, flying, and feeding.
3. *Behavioral responses*: Insects can exhibit complex behaviors, such as mating, foraging, and social interactions.
Characteristics
1. *Decentralized*: Insect nervous systems have some autonomy in different body parts.
2. *Specialized*: Different parts of the nervous system are specialized for specific functions.
3. *Efficient*: Insect nervous systems are highly efficient, allowing for rapid processing and response to stimuli.
The insect nervous system is a remarkable example of evolutionary adaptation, enabling insects to thrive in diverse environments.
The insect nervous system is a remarkable example of evolutionary adaptation, enabling insects to thrive
*Metamorphosis* is a biological process where an animal undergoes a dramatic transformation from a juvenile or larval stage to a adult stage, often involving significant changes in form and structure. This process is commonly seen in insects, amphibians, and some other animals.
How to manage Multiple Warehouses for multiple floors in odoo point of saleCeline George
The need for multiple warehouses and effective inventory management is crucial for companies aiming to optimize their operations, enhance customer satisfaction, and maintain a competitive edge.
A measles outbreak originating in West Texas has been linked to confirmed cases in New Mexico, with additional cases reported in Oklahoma and Kansas. The current case count is 795 from Texas, New Mexico, Oklahoma, and Kansas. 95 individuals have required hospitalization, and 3 deaths, 2 children in Texas and one adult in New Mexico. These fatalities mark the first measles-related deaths in the United States since 2015 and the first pediatric measles death since 2003.
The YSPH Virtual Medical Operations Center Briefs (VMOC) were created as a service-learning project by faculty and graduate students at the Yale School of Public Health in response to the 2010 Haiti Earthquake. Each year, the VMOC Briefs are produced by students enrolled in Environmental Health Science Course 581 - Public Health Emergencies: Disaster Planning and Response. These briefs compile diverse information sources – including status reports, maps, news articles, and web content– into a single, easily digestible document that can be widely shared and used interactively. Key features of this report include:
- Comprehensive Overview: Provides situation updates, maps, relevant news, and web resources.
- Accessibility: Designed for easy reading, wide distribution, and interactive use.
- Collaboration: The “unlocked" format enables other responders to share, copy, and adapt seamlessly. The students learn by doing, quickly discovering how and where to find critical information and presenting it in an easily understood manner.
K12 Tableau Tuesday - Algebra Equity and Access in Atlanta Public Schoolsdogden2
Algebra 1 is often described as a “gateway” class, a pivotal moment that can shape the rest of a student’s K–12 education. Early access is key: successfully completing Algebra 1 in middle school allows students to complete advanced math and science coursework in high school, which research shows lead to higher wages and lower rates of unemployment in adulthood.
Learn how The Atlanta Public Schools is using their data to create a more equitable enrollment in middle school Algebra classes.
Odoo Inventory Rules and Routes v17 - Odoo SlidesCeline George
Odoo's inventory management system is highly flexible and powerful, allowing businesses to efficiently manage their stock operations through the use of Rules and Routes.
Title: A Quick and Illustrated Guide to APA Style Referencing (7th Edition)
This visual and beginner-friendly guide simplifies the APA referencing style (7th edition) for academic writing. Designed especially for commerce students and research beginners, it includes:
✅ Real examples from original research papers
✅ Color-coded diagrams for clarity
✅ Key rules for in-text citation and reference list formatting
✅ Free citation tools like Mendeley & Zotero explained
Whether you're writing a college assignment, dissertation, or academic article, this guide will help you cite your sources correctly, confidently, and consistent.
Created by: Prof. Ishika Ghosh,
Faculty.
📩 For queries or feedback: [email protected]
How to Customize Your Financial Reports & Tax Reports With Odoo 17 AccountingCeline George
The Accounting module in Odoo 17 is a complete tool designed to manage all financial aspects of a business. Odoo offers a comprehensive set of tools for generating financial and tax reports, which are crucial for managing a company's finances and ensuring compliance with tax regulations.
2. Universitas 17 Agustus 1945 Teknik Informatika
PENGAMPU
Dr. Fajar Astuti Hermawati, S.Kom.,M.Kom.
Bagus Hardiansyah, S.Kom.,M.Si
Ir. Sugiono,
MT
Naufal Abdillah, S.Kom.,
M.Kom.
Siti Mutrofin, S.Kom., M.Kom.
3. Sub Capaian Pembelajaran
● Mampu mengidentifikasi jenis data dan teknik-teknik
mempersiapkan data agar sesuai untuk diaplikasikan dengan
pendekatan data mining tertentu [C2,A3]
4. Indikator
● 2.3 Ketepatan mengidentifikasi konsep dan melakukan data
preprocessing agar sesuai dengan teknik data mining
6. 1- Acquire the dataset
● Acquiring the dataset is the first step in data preprocessing in
machine learning. To build and develop Machine Learning models,
you must first acquire the relevant dataset. This dataset will be
comprised of data gathered from multiple and disparate sources
which are then combined in a proper format to form a dataset.
Dataset formats differ according to use cases. For instance, a
business dataset will be entirely different from a medical dataset.
While a business dataset will contain relevant industry and
business data, a medical dataset will include healthcare-related
data.
7. 2- Import all the crucial libraries
● The predefined Python libraries can perform specific data
preprocessing jobs. Importing all the crucial libraries is the second
step in data preprocessing in machine learning.
8. 3- Import the dataset
● In this step, you need to import the dataset/s that you have
gathered for the ML project at hand. Importing the dataset is one of
the important steps in data preprocessing in machine learning.
9. 4- Identifying and handling the missing values
● In data preprocessing, it is pivotal to identify and correctly handle the missing values, failing to do this, you might draw
inaccurate and faulty conclusions and inferences from the data. Needless to say, this will hamper your ML project.
some typical reasons why data is missing:
● A. User forgot to fill in a field.
● B. Data was lost while transferring manually from a legacy database.
● C. There was a programming error.
● D. Users chose not to fill out a field tied to their beliefs about how the results would be used or interpreted.
● Basically, there are two ways to handle missing data:
● Deleting a particular row – In this method, you remove a specific row that has a null value for a feature or a particular
column where more than 75% of the values are missing. However, this method is not 100% efficient, and it is
recommended that you use it only when the dataset has adequate samples. You must ensure that after deleting the
data, there remains no addition of bias. Calculating the mean – This method is useful for features having numeric
data like age, salary, year, etc. Here, you can calculate the mean, median, or mode of a particular feature or column
or row that contains a missing value and replace the result for the missing value. This method can add variance to the
dataset, and any loss of data can be efficiently negated. Hence, it yields better results compared to the first method
(omission of rows/columns). Another way of approximation is through the deviation of neighbouring values. However,
this works best for linear data.
14. 4- Identifying and handling the missing values
● Solution 3 : SciKit Learn
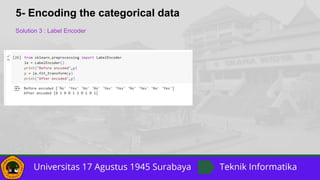
15. 5- Encoding the categorical data
Categorical data refers to the information that has specific categories within the
dataset. In the dataset cited above, there are two categorical variables – country
and purchased.
Machine Learning models are primarily based on mathematical equations. Thus,
you can intuitively understand that keeping the categorical data in the equation
will cause certain issues since you would only need numbers in the equations.
16. 5- Encoding the categorical data
Solution 1 : ColumnTransformer
17. 5- Encoding the categorical data
Solution 2 : Pd.get_dummies()
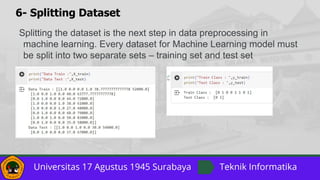
19. 6- Splitting Dataset
Splitting the dataset is the next step in data preprocessing in
machine learning. Every dataset for Machine Learning model must
be split into two separate sets – training set and test set
20. 7- Feature Scaling
● Feature scaling marks the end of the data preprocessing in Machine Learning. It is a method to standardize the independent variables
of a dataset within a specific range. In other words, feature scaling limits the range of variables so that you can compare them on
common grounds. Another reason why feature scaling is applied is that few algorithms like gradient descent converge much faster
with feature scaling than without it
21. 7- Feature Scaling
● Why Feature Scaling?
Most of the times, your dataset will contain features highly varying in magnitudes, units and range. But since, most of the machine learning algorithms
use Eucledian distance between two data points in their computations, this is a problem.If left alone, these algorithms only take in the magnitude of
features neglecting the units. The results would vary greatly between different units, 5kg and 5000gms. The features with high magnitudes will weigh in
a lot more in the distance calculations than features with low magnitudes.
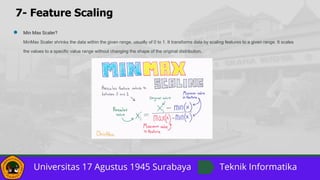
22. 7- Feature Scaling
● Min Max Scaler?
MinMax Scaler shrinks the data within the given range, usually of 0 to 1. It transforms data by scaling features to a given range. It scales
the values to a specific value range without changing the shape of the original distribution.
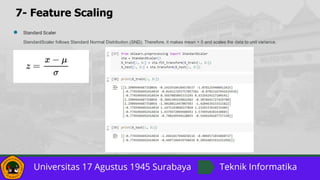
24. 7- Feature Scaling
● Standard Scaler
StandardScaler follows Standard Normal Distribution (SND). Therefore, it makes mean = 0 and scales the data to unit variance.
25. 7- Feature Scaling
When to Use Feature Scalling?
k-nearest neighbors with an Euclidean distance measure is sensitive to magnitudes and hence should be scaled for all features to weigh in equally.
Scaling is critical, while performing Principal Component Analysis(PCA). PCA tries to get the features with maximum variance and the variance is high for high magnitude features. This
skews the PCA towards high magnitude features.
We can speed up gradient descent by scaling. This is because θ will descend quickly on small ranges and slowly on large ranges, and so will oscillate inefficiently down to the optimum
when the variables are very uneven.
Tree based models are not distance based models and can handle varying ranges of features. Hence, Scaling is not required while modelling trees.
Algorithms like Linear Discriminant Analysis(LDA), Naive Bayes are by design equipped to handle this and gives weights to the features accordingly. Performing a features scaling in
these algorithms may not have much effect.
26. 7- Feature Scaling
Normalization vs. Standardization
The two most discussed scaling methods are Normalization and Standardization. Normalization typically means rescales the values into a
range of [0,1]. Standardization typically means rescales data to have a mean of 0 and a standard deviation of 1 (unit variance).