20101123 globalreport slides_chapter4_em
Download as DOCX, PDF0 likes252 views

The document contains tables and figures summarizing data on HIV/AIDS treatment coverage and outcomes in 25 countries with high HIV prevalence from 2009 reports. Table 4.1 shows the percentage of people receiving antiretroviral therapy compared to estimated need under 2006 and 2010 WHO guidelines. Subsequent tables and figures present additional data on retention in treatment, TB and HIV coinfection rates and treatment coverage, life-years gained through antiretroviral therapy, and availability of palliative and home-based care.


More Related Content
Recently uploaded (20)
Featured (20)


20101123 globalreport slides_chapter4_em
- 1. Table 4.1 (1/2) Treatment coverage for adults and children, 2009 (2006 and 2010 WHO guidelines) Coverage of antiretroviral therapy among adults and children in 25 countries with the most people living with HIV, 2009 based on 2006 and 2010 WHO guidelines. a Point estimates published for countries with generalized epidemics only. b Estimates of the number of people needing antiretroviral therapy are currently being reviewed and will be adjusted, as appropriate, based on ongoing data collection and analysis. c The coverage estimates are based on the estimated unrounded numbers of adults receiving antiretroviral therapy and the estimated unrounded need for antiretroviral therapy (based on UNAIDS/WHO methods). The ranges in coverage estimates are based on plausibility bounds in the denominator: that is, low and igh estimates of need. The estimates are standardized for comparability according to UNAIDS/WHO methods. d The coverage estimates are based on the estimated unrounded numbers of children receiving antiretroviral therapy and the estimated unrounded need for antiretroviral therapy (based on UNAIDS/WHO methods). The ranges in coverage estimates are based on plausibility bounds in the denominator: that is, low and high estimates of need. e Data for antiretroviral therapy coverage for adults in Sudan are not available for 2009. Source: Country Progress Reports 2010 and UNAIDS estimates.
- 2. Table 4.1 (2/2) Treatment coverage for adults and children, 2009 (2006 and 2010 WHO guidelines) Coverage of antiretroviral therapy among adults and children in 25 countries with the most people living with HIV, 2009 based on 2006 and 2010 WHO guidelines. a Point estimates published for countries with generalized epidemics only. b Estimates of the number of people needing antiretroviral therapy are currently being reviewed and will be adjusted, as appropriate, based on ongoing data collection and analysis. c The coverage estimates are based on the estimated unrounded numbers of adults receiving antiretroviral therapy and the estimated unrounded need for antiretroviral therapy (based on UNAIDS/WHO methods). The ranges in coverage estimates are based on plausibility bounds in the denominator: that is, low and igh estimates of need. The estimates are standardized for comparability according to UNAIDS/WHO methods. d The coverage estimates are based on the estimated unrounded numbers of children receiving antiretroviral therapy and the estimated unrounded need for antiretroviral therapy (based on UNAIDS/WHO methods). The ranges in coverage estimates are based on plausibility bounds in the denominator: that is, low and high estimates of need. e Data for antiretroviral therapy coverage for adults in Sudan are not available for 2009. Source: Country Progress Reports 2010 and UNAIDS estimates.
- 3. Figure 4.1 Adult retention in antiretroviral therapy in selected countries, 0–48 months, 2009 Source: WHO Towards Universal Access 2010.
- 4. Figure 4.2 Coverage of TB services among people living with HIV, 2009 Coverage services aimed to reduce the burden of TB among 1000 people living with HIV globally. Source: UNAIDS estimates, WHO Towards Universal Access 2010 and WHO Global TB Control Report 2010.
- 5. Figure 4.3 Coverage of HIV services among people with TB, 2009 Coverage of services aimed to reduce the burden of HIV among 1000 people with TB globally, 2009. Source: WHO Global TB Control Report 2010.
- 6. Figure 4.4 Five pillars of Treatment 2.0
- 7. Figure 4.5 Antiretroviral therapy and TB incidence in Botswana Reported incidence of TB and number of people receiving antiretroviral therapy in Botswana, 1990–2007. Source: Ministry of Health, Botswana.
- 8. Figure 4.6 Antiretroviral therapy and mortality, Northwest Province, South Africa Number of people ever receiving antiretroviral therapy and annual number of deaths by age group, Northwest Province, South Africa, 1997–2007. Source: Ministry of Health, South Africa.
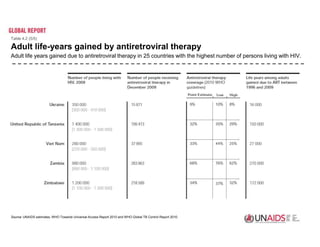
- 9. Table 4.2 (1/5) Adult life-years gained by antiretroviral therapy Adult life years gained due to antiretroviral therapy in 25 countries with the highest number of persons living with HIV. Source: UNAIDS estimates, WHO Towards Universal Access Report 2010 and WHO Global TB Control Report 2010.
- 10. Table 4.2 (2/5) Adult life-years gained by antiretroviral therapy Adult life years gained due to antiretroviral therapy in 25 countries with the highest number of persons living with HIV. Source: UNAIDS estimates, WHO Towards Universal Access Report 2010 and WHO Global TB Control Report 2010.
- 11. Table 4.2 (3/5) Adult life-years gained by antiretroviral therapy Adult life years gained due to antiretroviral therapy in 25 countries with the highest number of persons living with HIV. Source: UNAIDS estimates, WHO Towards Universal Access Report 2010 and WHO Global TB Control Report 2010.
- 12. Table 4.2 (4/5) Adult life-years gained by antiretroviral therapy Adult life years gained due to antiretroviral therapy in 25 countries with the highest number of persons living with HIV. Source: UNAIDS estimates, WHO Towards Universal Access Report 2010 and WHO Global TB Control Report 2010.
- 13. Table 4.2 (5/5) Adult life-years gained by antiretroviral therapy Adult life years gained due to antiretroviral therapy in 25 countries with the highest number of persons living with HIV. Source: UNAIDS estimates, WHO Towards Universal Access Report 2010 and WHO Global TB Control Report 2010.
- 14. Figure 4.7 Access to home-based care Assessment by governments as to whether most people in need have access to home-based care. Source: Country Progress Reports 2010.
- 15. Figure 4.8 Availability of palliative care Assessment by governments as to whether most people in need have access to palliative care. Source: Country Progress Reports 2010.
- 16. Figure 4.9 Types of care and support work performed by volunteers Types of care and support work for people living with HIV performed by 1366 volunteer caregivers interviewed in Cameroon, Kenya, Malawi, Nigeria, South Africa and Uganda. Source: Compensation for Contributions: report on interviews with volunteer caregivers in six countries. Hairu Commission and Community Agency for Social Enquiry, Sept 2009.
- 17. Figure 4.10 Trends in support for orphans and vulnerable children, 2005 to 2010 Changes in the coverage of support services for orphans and vulnerable children in three countries with high HIV prevalence, 2005 to 2010. Per cent of children whose births are registered Proportion of households with orphans and vulnerable children (OVC) that receive free basic external support in caring for the children Proportion of OVC that have three, locally defined basic needs met compared to non-OVC Proportion of OVC receiving appropriate psychosocial support Proportion of OVC receiving normal meals compared to non-OVC Healthcare access for OVC compared to non-OVC School attendance of OVC compared to non-OVC Source: World Vision.