5 Annoying Excel Pivot Table Problems
Download as PPSX, PDF9 likes309,233 views

Five common and annoying Excel pivot table problems, and how to solve them. Links to detailed instructions.
1 of 13
Downloaded 172 times


Ad
Recommended
5 Worst Excel Dashboard Mistakes
5 Worst Excel Dashboard MistakesDebra Dalgleish See how to avoid these mistakes when building your Excel dashboards:
--No clear focus
--Rainbow colors
--Too crowded
--Chart clutter
--No interactivity
How to use Pivot Table in Analyzing Sales
How to use Pivot Table in Analyzing Salesreyeshazel The document discusses pivot tables, which are a data summarization tool. It explains that pivot tables allow users to automatically count and sort data, perform analysis, calculate totals and averages, summarize and tabulate data, make quick decisions from data patterns, and create quick reports. The document then provides steps to create a pivot table in Microsoft Excel and Google Sheets using sample soda sales data and demonstrates how the pivot table can be filtered, have calculations changed, and have a chart created from the data.
50 MS Excel Tips and Tricks 
50 MS Excel Tips and Tricks BurCom Consulting Ltd. This document provides 50 tips for using various Excel functions and features. It begins with tips on creating macros, the GETPIVOTDATA function, formatting chart axes, date validation, and using the IF function. Subsequent tips cover additional functions and features such as nested IF statements, forecasting, error handling, date formatting, highlighting dates, transposing data, data validation, random number generation, hyperlinks, data consolidation, text functions, pivot tables, and more. The tips provide step-by-step examples and explanations for how to utilize Excel to analyze data, validate information, visualize results in charts and pivot tables, and automate repetitive tasks.
Linking chart from excel with power point
Linking chart from excel with power pointSAMUEL BARNABAS IFITUMI The compilation shows the steps by steps on how work like chart, lines, surfaces and tables from excel can be linked with power point.
Common MS Excel and MS Excel 2013 useful tricks. By Ashot Engibaryan
Common MS Excel and MS Excel 2013 useful tricks. By Ashot EngibaryanAshot Engibaryan This master class will cover useful tricks in MS Excel and MS Excel 2013, including array functions like Vlookup and SUMIF, importing data from the web and quick processing, working with macro tools, Pivot tables and the new Power Pivot tool in Excel 2013, and the new Power View tool in Excel 2013. The class will demonstrate how to use Vlookup to bring values from one table to another based on a condition, how to use SUMIF to sum cell values based on a repeating condition, and how to define multiple conditions with functions like {SUM+IF}. It will also show how to import and format external web data quickly and how to use macro tools to automatically format graphs based on table data. Finally, it will
Worksheet Basics & Navigation - Excel 2013 Tutorial
Worksheet Basics & Navigation - Excel 2013 TutorialSpreadsheetTrainer SEE MORE, INCLUDING A FREE TRIAL, AT: www.PivotTable-Pro.com
This video shows basic worksheet elements and navigation in Excel.
Free Excel Training Course: http://www.SpreadsheetTrainer.com
Contents:
***The Excel Worksheet ***
What is a cell?
What is a row?
What is a column?
***Selecting & Navigating***
What is the selected cell?
How to select a cell in the Excel worksheet
How to use the GoTo function
How to navigate with page up & page down,
How to navigate with Alt+page up & Alt+page down,
Navigating with Ctrl+arrow, Home, & Ctrl+Home
***Ranges***
What is a range?
How to select a range with the mouse and keyboard
How to select a range with Ctrl+Shift+Arrow
What is the active cell?
How to select nonadjacent cells.
Referring to range addresses.
Excel 2010 training presentation figure out dates by using formulas in exce...
Excel 2010 training presentation figure out dates by using formulas in exce...MFMinickiello This document describes an Excel 2010 training course on using formulas to calculate dates. The course contains an overview of date calculations, six instructional videos, and a test. The videos demonstrate how to find the number of days or workdays between two dates, calculate dates that fall after a number of workdays, months, or years. The five question test assesses understanding of topics like recognizing date formats, using the WORKDAY function, and separating formula arguments with commas.
Working smart with excel v2.0
Working smart with excel v2.0Romy Cagampan The document provides an agenda for a training on advanced Excel skills for account managers and associates. The agenda covers reviewing basic Excel functions, creating and customizing charts, copying charts into PowerPoint, using Paste Special, working with PivotTables and PivotCharts, and exploring advanced formulas and text manipulation functions like IF, VLOOKUP, SUMIF, LEFT, RIGHT, MID, and CONCATENATE. Exercises are included throughout to help participants practice and retain the skills covered in the training.
MS Excel Ch 3 PPT
MS Excel Ch 3 PPTprsmith72 This document provides instructions for creating and formatting pie charts, line charts, and using goal seek and what-if analysis in Excel. It outlines how to chart data with pie charts and line charts, format pie charts, edit workbooks and update charts, use goal seek to perform what-if analysis, design worksheets for what-if analysis, and answer what-if questions. The objectives covered include charting data with pie charts and line charts, formatting pie charts, editing workbooks and updating charts, using goal seek, designing worksheets for what-if analysis, and answering what-if questions by changing values.
Excel 2007 - Create a chart
Excel 2007 - Create a chartOklahoma Dept. Mental Health This document provides instructions for creating and customizing charts in Microsoft Excel 2007. It contains two lessons - the first on creating a basic chart and the second on customizing charts after creation. The document walks through creating a sample chart using sales data, then discusses how to change chart views, add titles, modify colors and styles, and format titles. The goals are to learn how to create charts, customize existing charts, and develop a basic understanding of chart terminology.
Assignment in era
Assignment in eraSarahPaynandos This document provides instructions for performing various tasks in Excel and OpenOffice Calc spreadsheets:
1) It explains how to print gridlines on an Excel sheet when opened in OpenOffice Calc, including selecting the page style and checking the "Grid" option.
2) It describes how to insert Wingdings symbols in Excel by formatting cells to the Wingdings font, finding the symbol in Character Map, and copying and pasting it into the cell.
3) It gives steps to synchronize data between separate Excel workbooks by linking files using cell references, and between worksheets in the same workbook by selecting multiple tabs simultaneously.
4) It defines merging cells as combining multiple adjacent cells into a single larger cell, listing benefits
MS Excel Ch 1 PPT
MS Excel Ch 1 PPTprsmith72 This PowerPoint presentation covers the objectives of Chapter 1 in the book "GO! with Microsoft Excel 2010". It includes how to create and navigate an Excel workbook, enter data and formulas, format cells, create column charts and sparklines, print worksheets, check spelling, enter data by range, construct mathematical formulas, edit values, and format worksheets. The objectives are to learn the basic functions of Excel through hands-on practice with worksheets and charts.
Microsoft excel 2013 Quickstart
Microsoft excel 2013 Quickstartcomatsg This document provides tips for getting started with Excel 2013, including how to find common commands that have moved from previous versions and how to work with others who don't have Excel 2013. It recommends exploring the ribbon to see changes, lists where to find frequently used tools, and explains how to enable advanced features and share files across versions.
Ms Excel Basic to Advance Tutorial
Ms Excel Basic to Advance TutorialBikal Shrestha This document discusses Microsoft Excel and its features. It introduces Excel as a spreadsheet program that allows users to organize, format and calculate data. It describes the basic interface of Excel including cells, columns, rows and sheets. It also provides information on common Excel functions and formulas for calculations, examples of using Excel to create simple reports and bills, and a formula for calculating age based on date of birth and the current year.
MS Excel 2013
MS Excel 2013Jahnavee Parmar Excel 2013 is a spreadsheet program that allows users to store, organize, and analyze data. It features tools like formulas, functions, charts and pivot tables. In Excel, data is organized into cells within a worksheet. Cells can contain text, numbers, formulas or other content. Worksheets can be viewed and formatted in different layout views. Formatting options and functions allow for analysis of data through calculations and visualization. Pivot tables and charts provide interactive summaries and visual representations of worksheet data. Macros allow repetitive tasks to be automated. Advanced features include comments, filtering, sorting, tables and other analysis tools.
Microsoft Excel
Microsoft ExcelSeun Ayilara This document provides an overview of key areas for mastering the use of Microsoft Excel, including formulas and functions, analysis tools, and working with data. It discusses how to use formulas and functions by making calculations with rows, columns, and dates. It also explains how to insert and edit formulas, fill formulas using keystrokes, and use common functions like Average, Sum, Min, and Max. The document demonstrates how to insert charts and pivot tables into Excel and discusses total row and column functions. It concludes by thanking the audience and providing contact information to request Excel trainings.
Introduction to Excel - Excel 2013 Tutorial
Introduction to Excel - Excel 2013 TutorialSpreadsheetTrainer SEE MORE, INCLUDING A FREE TRIAL, AT: www.PivotTable-Pro.com
This video introduces you to Microsoft Excel 2013 and its program window.
Free Excel Training Course: http://www.SpreadsheetTrainer.com
Contents:
***Introduction - What is Microsoft Excel?***
***The Excel Program Window***
Program Window - Border & Title
How to Maximise the Excel Window
How to Minimise the Excel Window
How to Close the Excel Window
***The Excel Ribbon***
How to Hide & Show the Ribbon
What is the Excel Ribbon?
What are Groups?
What are Command Buttons?
What are Smart Tags?
What are Dialog Boxes?
What is the File tab & Backstage Menu?
The Excel Ribbon Shrinks When you Resize the Window
***Other Program Window Elements***
What is the Quick Access Toolbar?
What is the Name Box?
What is the Formula Bar?
How to Resize the Formula Bar
What is the Status bar?
Where are the View shortcuts?
How to use the Scroll Bars
What is the Spreadsheet Area?
What is the Mini Toolbar?
Intro to ms excel
Intro to ms excelJacob Mazalale It is normal to be faced with so many assignments in the office set up. This demands that one is efficient with assignments. One of the skills that is very crucial, although least known is the power MS Excel This slide presents the basics of MS Excel. It attempts to give a wide overview that one needs to know about Excel. These slides presents the basic structure of Excel such as layout, functions, formulae, charts, et cetra.
VERSIONS AND FUNCTIONS OF MS EXCEL
VERSIONS AND FUNCTIONS OF MS EXCELIMRAN WASTA The document describes the evolution and functions of Microsoft Excel from its early versions to the current version 15. It details the key features and changes introduced in each version from Excel 1.0 in 1985 to the latest version 15 in Office 2013. The document also covers the different types of functions available in Excel including financial, date/time, math, statistical, lookup, database, text, logical and engineering functions.
Dashboard and Database Manual for AFG
Dashboard and Database Manual for AFGAbigail Anderson 1. The document provides step-by-step instructions for editing an Excel database and dashboard used to track performance metrics over time.
2. It describes how to save the file with the new year, clear old data, enter new dates and objectives for the upcoming year, and save the changes.
3. Subsequent sections explain how to enter new monthly data, update the dashboard, graphs, and metrics as new information becomes available each reporting cycle.
MS Excel Ch 2 PPT
MS Excel Ch 2 PPTprsmith72 This document outlines the objectives and key concepts covered in a PowerPoint presentation for a chapter in a Microsoft Excel 2010 textbook. The chapter covers using functions like SUM, AVERAGE, MEDIAN, MIN and MAX; moving and formatting data; using logical functions like COUNTIF and IF; working with dates and times; creating, sorting and filtering tables; navigating and formatting worksheets; copying and pasting data; creating summary sheets; and formatting and printing worksheets. The document provides explanations and examples of these skills and concepts to accompany the PowerPoint presentation.
Microsoft Excel Basics
Microsoft Excel BasicsCompudon This document provides an overview of Microsoft Excel basics and functions. It covers topics such as formatting cells and data, using mathematical, logical, and financial functions, creating charts, sorting and filtering data, setting print options, and more. Examples of functions include SUM, MIN, MAX, COUNT, IF, NOW, TODAY, DATE, PMT and examples of charts include column, line, pie and bar charts. The document is intended as a training guide for learning Excel.
microsoft excel
microsoft excelDisebo Mokgatle This document discusses Microsoft Excel and its features. It introduces Excel as a software tool that uses spreadsheets and formulas to organize data. It lists common uses of Excel such as data management, accounting, and financial analysis. The document then describes several key features of Excel including headers and footers, inserting new worksheets, find and replace commands, data sorting and filtering, charts and graphics, and conditional formatting. It concludes with references used in the document.
Excel 2007 (formula)
Excel 2007 (formula)osuchin This document provides an overview and instructions for an Excel training course on entering formulas. The course contains 3 lessons that teach how to perform basic math in Excel using formulas, use cell references in formulas so that results update automatically when values change, and simplify formulas using functions like SUM, AVERAGE, MAX and MIN. The training materials include example worksheets and step-by-step instructions for creating and working with formulas. Practice exercises are provided at the end of each lesson to reinforce the concepts and skills learned.
MS-EXCEL Assignment Help
MS-EXCEL Assignment HelpRahul Kataria The site present the assignment to the students in well- structured manner including all the information in the simplest form, so that students need not spend extra time and effort in completion of the assignment and along with these they can also gain all the content engraved in the brain.
How to use pivot table
How to use pivot tableDennis Saren A PIVOT TABLE is a programming tool used to reorganize data in a spreadsheet to obtain the desired report more effectively. Take a look at my 100 page tutorial on how to create, interpret, and use Pivot tables in Microsoft Excel and in Google Spreadsheet.
Creating a graph in excel
Creating a graph in excelorthms The stock price per month graph shows stock price ranging from $4.50 to $6.50 over 12 months. Stock price was highest at $6.50 in month 4 and lowest at $4.50 in month 0. The graph provides a simple visualization of how stock price changed over the period measured.
Microsoft Excel Project 1 Presentation
Microsoft Excel Project 1 Presentationjmartinvvc The document discusses key concepts in Microsoft Excel including worksheets, cells, ranges, charts, and functions. It provides an overview of the Excel window and interface elements such as the ribbon, name box, and status bar. Common Excel features are explained like entering text and numeric data, using functions and formulas, summing ranges, merging cells, and creating embedded charts linked to worksheet data.
9 handy Excel demos
9 handy Excel demosCPA Australia This document provides tips to improve Excel skills in order to work faster, look more professional, impress your boss, and grow your career. It includes nine demonstrations on better using Excel covering topics like custom formatting, moving averages, combining annual and monthly data, using trial balances, identifying and removing duplicates, data relationships, flexible budget models, toggling macros, and consistent styles. Videos and other resources from CPA Australia on Excel for finance professionals are also promoted.

Ad
More Related Content
What's hot (20)
MS Excel Ch 3 PPT
MS Excel Ch 3 PPTprsmith72 This document provides instructions for creating and formatting pie charts, line charts, and using goal seek and what-if analysis in Excel. It outlines how to chart data with pie charts and line charts, format pie charts, edit workbooks and update charts, use goal seek to perform what-if analysis, design worksheets for what-if analysis, and answer what-if questions. The objectives covered include charting data with pie charts and line charts, formatting pie charts, editing workbooks and updating charts, using goal seek, designing worksheets for what-if analysis, and answering what-if questions by changing values.
Excel 2007 - Create a chart
Excel 2007 - Create a chartOklahoma Dept. Mental Health This document provides instructions for creating and customizing charts in Microsoft Excel 2007. It contains two lessons - the first on creating a basic chart and the second on customizing charts after creation. The document walks through creating a sample chart using sales data, then discusses how to change chart views, add titles, modify colors and styles, and format titles. The goals are to learn how to create charts, customize existing charts, and develop a basic understanding of chart terminology.
Assignment in era
Assignment in eraSarahPaynandos This document provides instructions for performing various tasks in Excel and OpenOffice Calc spreadsheets:
1) It explains how to print gridlines on an Excel sheet when opened in OpenOffice Calc, including selecting the page style and checking the "Grid" option.
2) It describes how to insert Wingdings symbols in Excel by formatting cells to the Wingdings font, finding the symbol in Character Map, and copying and pasting it into the cell.
3) It gives steps to synchronize data between separate Excel workbooks by linking files using cell references, and between worksheets in the same workbook by selecting multiple tabs simultaneously.
4) It defines merging cells as combining multiple adjacent cells into a single larger cell, listing benefits
MS Excel Ch 1 PPT
MS Excel Ch 1 PPTprsmith72 This PowerPoint presentation covers the objectives of Chapter 1 in the book "GO! with Microsoft Excel 2010". It includes how to create and navigate an Excel workbook, enter data and formulas, format cells, create column charts and sparklines, print worksheets, check spelling, enter data by range, construct mathematical formulas, edit values, and format worksheets. The objectives are to learn the basic functions of Excel through hands-on practice with worksheets and charts.
Microsoft excel 2013 Quickstart
Microsoft excel 2013 Quickstartcomatsg This document provides tips for getting started with Excel 2013, including how to find common commands that have moved from previous versions and how to work with others who don't have Excel 2013. It recommends exploring the ribbon to see changes, lists where to find frequently used tools, and explains how to enable advanced features and share files across versions.
Ms Excel Basic to Advance Tutorial
Ms Excel Basic to Advance TutorialBikal Shrestha This document discusses Microsoft Excel and its features. It introduces Excel as a spreadsheet program that allows users to organize, format and calculate data. It describes the basic interface of Excel including cells, columns, rows and sheets. It also provides information on common Excel functions and formulas for calculations, examples of using Excel to create simple reports and bills, and a formula for calculating age based on date of birth and the current year.
MS Excel 2013
MS Excel 2013Jahnavee Parmar Excel 2013 is a spreadsheet program that allows users to store, organize, and analyze data. It features tools like formulas, functions, charts and pivot tables. In Excel, data is organized into cells within a worksheet. Cells can contain text, numbers, formulas or other content. Worksheets can be viewed and formatted in different layout views. Formatting options and functions allow for analysis of data through calculations and visualization. Pivot tables and charts provide interactive summaries and visual representations of worksheet data. Macros allow repetitive tasks to be automated. Advanced features include comments, filtering, sorting, tables and other analysis tools.
Microsoft Excel
Microsoft ExcelSeun Ayilara This document provides an overview of key areas for mastering the use of Microsoft Excel, including formulas and functions, analysis tools, and working with data. It discusses how to use formulas and functions by making calculations with rows, columns, and dates. It also explains how to insert and edit formulas, fill formulas using keystrokes, and use common functions like Average, Sum, Min, and Max. The document demonstrates how to insert charts and pivot tables into Excel and discusses total row and column functions. It concludes by thanking the audience and providing contact information to request Excel trainings.
Introduction to Excel - Excel 2013 Tutorial
Introduction to Excel - Excel 2013 TutorialSpreadsheetTrainer SEE MORE, INCLUDING A FREE TRIAL, AT: www.PivotTable-Pro.com
This video introduces you to Microsoft Excel 2013 and its program window.
Free Excel Training Course: http://www.SpreadsheetTrainer.com
Contents:
***Introduction - What is Microsoft Excel?***
***The Excel Program Window***
Program Window - Border & Title
How to Maximise the Excel Window
How to Minimise the Excel Window
How to Close the Excel Window
***The Excel Ribbon***
How to Hide & Show the Ribbon
What is the Excel Ribbon?
What are Groups?
What are Command Buttons?
What are Smart Tags?
What are Dialog Boxes?
What is the File tab & Backstage Menu?
The Excel Ribbon Shrinks When you Resize the Window
***Other Program Window Elements***
What is the Quick Access Toolbar?
What is the Name Box?
What is the Formula Bar?
How to Resize the Formula Bar
What is the Status bar?
Where are the View shortcuts?
How to use the Scroll Bars
What is the Spreadsheet Area?
What is the Mini Toolbar?
Intro to ms excel
Intro to ms excelJacob Mazalale It is normal to be faced with so many assignments in the office set up. This demands that one is efficient with assignments. One of the skills that is very crucial, although least known is the power MS Excel This slide presents the basics of MS Excel. It attempts to give a wide overview that one needs to know about Excel. These slides presents the basic structure of Excel such as layout, functions, formulae, charts, et cetra.
VERSIONS AND FUNCTIONS OF MS EXCEL
VERSIONS AND FUNCTIONS OF MS EXCELIMRAN WASTA The document describes the evolution and functions of Microsoft Excel from its early versions to the current version 15. It details the key features and changes introduced in each version from Excel 1.0 in 1985 to the latest version 15 in Office 2013. The document also covers the different types of functions available in Excel including financial, date/time, math, statistical, lookup, database, text, logical and engineering functions.
Dashboard and Database Manual for AFG
Dashboard and Database Manual for AFGAbigail Anderson 1. The document provides step-by-step instructions for editing an Excel database and dashboard used to track performance metrics over time.
2. It describes how to save the file with the new year, clear old data, enter new dates and objectives for the upcoming year, and save the changes.
3. Subsequent sections explain how to enter new monthly data, update the dashboard, graphs, and metrics as new information becomes available each reporting cycle.
MS Excel Ch 2 PPT
MS Excel Ch 2 PPTprsmith72 This document outlines the objectives and key concepts covered in a PowerPoint presentation for a chapter in a Microsoft Excel 2010 textbook. The chapter covers using functions like SUM, AVERAGE, MEDIAN, MIN and MAX; moving and formatting data; using logical functions like COUNTIF and IF; working with dates and times; creating, sorting and filtering tables; navigating and formatting worksheets; copying and pasting data; creating summary sheets; and formatting and printing worksheets. The document provides explanations and examples of these skills and concepts to accompany the PowerPoint presentation.
Microsoft Excel Basics
Microsoft Excel BasicsCompudon This document provides an overview of Microsoft Excel basics and functions. It covers topics such as formatting cells and data, using mathematical, logical, and financial functions, creating charts, sorting and filtering data, setting print options, and more. Examples of functions include SUM, MIN, MAX, COUNT, IF, NOW, TODAY, DATE, PMT and examples of charts include column, line, pie and bar charts. The document is intended as a training guide for learning Excel.
microsoft excel
microsoft excelDisebo Mokgatle This document discusses Microsoft Excel and its features. It introduces Excel as a software tool that uses spreadsheets and formulas to organize data. It lists common uses of Excel such as data management, accounting, and financial analysis. The document then describes several key features of Excel including headers and footers, inserting new worksheets, find and replace commands, data sorting and filtering, charts and graphics, and conditional formatting. It concludes with references used in the document.
Excel 2007 (formula)
Excel 2007 (formula)osuchin This document provides an overview and instructions for an Excel training course on entering formulas. The course contains 3 lessons that teach how to perform basic math in Excel using formulas, use cell references in formulas so that results update automatically when values change, and simplify formulas using functions like SUM, AVERAGE, MAX and MIN. The training materials include example worksheets and step-by-step instructions for creating and working with formulas. Practice exercises are provided at the end of each lesson to reinforce the concepts and skills learned.
MS-EXCEL Assignment Help
MS-EXCEL Assignment HelpRahul Kataria The site present the assignment to the students in well- structured manner including all the information in the simplest form, so that students need not spend extra time and effort in completion of the assignment and along with these they can also gain all the content engraved in the brain.
How to use pivot table
How to use pivot tableDennis Saren A PIVOT TABLE is a programming tool used to reorganize data in a spreadsheet to obtain the desired report more effectively. Take a look at my 100 page tutorial on how to create, interpret, and use Pivot tables in Microsoft Excel and in Google Spreadsheet.
Creating a graph in excel
Creating a graph in excelorthms The stock price per month graph shows stock price ranging from $4.50 to $6.50 over 12 months. Stock price was highest at $6.50 in month 4 and lowest at $4.50 in month 0. The graph provides a simple visualization of how stock price changed over the period measured.
Microsoft Excel Project 1 Presentation
Microsoft Excel Project 1 Presentationjmartinvvc The document discusses key concepts in Microsoft Excel including worksheets, cells, ranges, charts, and functions. It provides an overview of the Excel window and interface elements such as the ribbon, name box, and status bar. Common Excel features are explained like entering text and numeric data, using functions and formulas, summing ranges, merging cells, and creating embedded charts linked to worksheet data.
Viewers also liked (20)
9 handy Excel demos
9 handy Excel demosCPA Australia This document provides tips to improve Excel skills in order to work faster, look more professional, impress your boss, and grow your career. It includes nine demonstrations on better using Excel covering topics like custom formatting, moving averages, combining annual and monthly data, using trial balances, identifying and removing duplicates, data relationships, flexible budget models, toggling macros, and consistent styles. Videos and other resources from CPA Australia on Excel for finance professionals are also promoted.
Programación con visual basic para aplicaciones en excel programación pura_c...
Programación con visual basic para aplicaciones en excel programación pura_c...Giovana Pinella El documento describe cómo programar en Visual Basic para Aplicaciones (VBA) en Excel. Incluye secciones sobre macros, funciones, proyectos paso a paso, complementos y cómo controlar Excel desde otros lenguajes de programación. Explica cómo la grabación de macros puede ser útil para aprender sobre el lenguaje y cómo editar el código generado para mejorarlo y simplificarlo.
Cognos vs Hyperion vs SSAS Comparison
Cognos vs Hyperion vs SSAS ComparisonAsis Mohanty SSAS, Cognos Power Play, and Hyperion Essbase are OLAP tools that provide:
- Load balancing, clustering, and failover recovery capabilities.
- Support for MOLAP, ROLAP, and offline cubes.
- Common query languages including MDX, XMLA, and OLEDB for OLAP.
- Features such as hierarchies, KPIs, actions, and security at the cell and dimensional levels.
- Support for Windows, Linux, and UNIX operating systems.
- Performance capabilities including partitioning and usage-based optimization.
Pivot Table | Statistics
Pivot Table | StatisticsTransweb Global Inc The pivot tables are not created mechanically. In Microsoft excel the user should select the data first for which the pivot table should be created. The pivot table option is available on the insert tab. The user has the option of inserting the pivot table either in the existing sheet or creating the pivot table in the new sheet. Copy the link given below and paste it in new browser window to get more information on Pivot Table:- http://www.transtutors.com/homework-help/statistics/pivot-table.aspx
2016 Excel/VBA Notes
2016 Excel/VBA NotesYang Ye On May 20, Visual Basic is 25 years old! Congrats to VB! Yet Microsoft is not to open source Visual Basic. VBA has become a precious species. Here I am to share some notes on Excel/VBA.
Libre Office Calc Lesson 4: Understanding Functions
Libre Office Calc Lesson 4: Understanding FunctionsSmart Chicago Collaborative You can enter formulas in two ways, either directly into the cell itself, or at the input line. Either way, you need to start a formula with one of the following symbols: =, + or –. Starting with anything else causes the formula to be treated as if it were text.
Creating Formulas
Understanding Functions
Using regular expressions in functions
Using Pivot tables
The DataPilot dialog
Solving common sales & marketing problems using Marketing Automation Software...
Solving common sales & marketing problems using Marketing Automation Software...Ann Stanley • What is marketing automation and how can it help to integrate my sales and marketing?
• CRM and list management
• Manage internal tasks
• Creation of new forms and landing pages on your website
• Anonymous visitors, tracking of individuals and web analytics
• Email broadcasting and reporting
• Tracking leads and sales opportunities
• Automated or “drip” campaigns using workflows or tasks
• Choosing a MAS supplier
Vision-correcting Displays @ SIGGRAPH 2014
Vision-correcting Displays @ SIGGRAPH 2014StanfordComputationalImaging Millions of people worldwide need glasses or contact lenses to see or read properly. We introduce a computational display technology that predistorts the presented content for an observer, so that the target image is perceived without the need for eyewear. We demonstrate a low-cost prototype that can correct myopia, hyperopia, astigmatism, and even higher-order aberrations that are difficult to correct with glasses.
How to be a VLOOKUP Expert!
How to be a VLOOKUP Expert!jc cabrera This document provides an example of using the VLOOKUP function in Excel to lookup values from a reference table and return a corresponding value. It shows the VLOOKUP formula being used to find the name in column C that matches the ID in cell B3 from the Reference table in a separate sheet and return the matching name.
Creating a vlookup v1.0 050813
Creating a vlookup v1.0 050813Dave Shannon The document explains how to create a VLOOKUP formula in Microsoft Excel 2010 to search for data in a table and return matching values. It describes the four components of a VLOOKUP formula - the lookup value, table array, column index number, and optional range lookup parameter. An example is provided demonstrating how to use VLOOKUP to search an inventory database by part number and return the stock level and price.
USING VLOOKUP FUNCTION
USING VLOOKUP FUNCTIONRuffson Panganiban The document explains that VLOOKUP is an Excel function that pulls data from one worksheet to another based on a primary key. It defines source and destination spreadsheets as well as primary key. The key points are to identify the primary key column, source table, and column number to pull data from. The steps to use VLOOKUP are to select the lookup value cell, source table range, column index number, and enter FALSE for exact matches before filling the formula down.
APICS CPIM Demo
APICS CPIM DemoAPICS Education The APICS Certified in Production and Inventory Management (CPIM) program provides you with the ability to understand and evaluate production and inventory activities within a company's global operations.
Sad format
Sad formatcas123 The document outlines the system analysis and design implementation of an enrollment system. It includes an introduction, understanding of the existing system through user profiles, processes, forms and tools. The design proposal covers the problem statement, objectives, and scope. The detailed design section provides the proposed algorithm, system flowchart, data flow diagram, entity relationship analysis, data dictionary, and hardware/software requirements. User and administration manuals are also included.
Pivot table
Pivot tableVijay Perepa The document describes how to create and configure a basic pivot table in Excel. It explains that a pivot table allows you to sort and summarize data independently of the original layout. The steps include selecting a data range, choosing to create a pivot table, and using the pivot table field list to designate fields as report filters, column labels, or row labels. Configuring these fields allows the user to build a report to analyze relationships in the data.
Sad format
Sad formatcas123 The document outlines the system analysis and design implementation of an enrollment system. It includes an introduction, understanding of the existing system through user profiles, processes, forms and tools. The design proposal covers the problem statement, objectives, and scope. The detailed design section provides the proposed algorithm, system flowchart, data flow diagram, entity relationship analysis, data dictionary, and hardware/software requirements. User and administration manuals are also included.
Vlookup - an introduction
Vlookup - an introductionvvmenon22 The document is a presentation about lookup functions in Microsoft Excel. It introduces LOOKUP, VLOOKUP, and HLOOKUP functions. It provides examples of how to use each function to lookup values in tables and return results. It also shares some fun facts about Excel's history and capabilities.
COGNOS Vs OBIEE
COGNOS Vs OBIEEAsis Mohanty The document compares the architecture of Cognos 8.2, OBIEE 10g, and OBIEE 11g across several features. Some key differences include:
- OBIEE 10g and 11g are based on N-tier architectures while Cognos uses a web-based service-oriented architecture.
- OBIEE 10g and 11g require desktop tools for repository development and management while Cognos 8.2 is platform independent.
- OBIEE 11g improved support for clustering, load balancing, and in-memory capabilities compared to earlier versions.
- All three support integration with external applications, single sign-on, and LDAP integration for security. However,
Pivot table presentation
Pivot table presentationSha Tibnjn This document provides an introduction to creating and using Excel PivotTables. It discusses appropriate source data types, how to create a basic PivotTable using the wizard or drag-and-drop method, formatting and updating PivotTables, and some advanced techniques. The presentation aims to help users understand how to use PivotTables for interactive data exploration and custom reporting using Excel's powerful summarization features.
Pivot Tables
Pivot Tablesgjonesnemeth This document provides an overview and instructions for creating and formatting pivot tables and pivot charts in Excel. It discusses how to:
1. Pull data from Excel queries or directly from a Microsoft Query to build a pivot table or pivot chart.
2. Lay out and format pivot tables by placing fields in rows, columns, and values areas and using formatting options.
3. Filter, total, subtotal, sort, group, expand, collapse, and otherwise manipulate pivot table data.
4. Create calculated fields and side-by-side or stacked value fields.
5. Choose data sources and layouts for pivot charts, including changing chart types, adding titles, and using design and layout options
Ad
Similar to 5 Annoying Excel Pivot Table Problems (17)
Excel Pivot Tables April 2016.pptx
Excel Pivot Tables April 2016.pptxRaviAr5 This document provides an overview of Excel PivotTables, including:
1. PivotTables summarize and analyze large amounts of data into summary reports. They allow the user to interactively sort, count, total or average selected data with ease.
2. The basic parts of a PivotTable include the data source, filters, fields/columns, and values. The data must be clean and in a tabular format for best results.
3. PivotTables can help answer analytical questions about data by applying filters, slicers, pivot charts and other features to slice and dice the data in different ways. They provide interactive and flexible summarization of large datasets.
Excel and Pivot Tables.pptx
Excel and Pivot Tables.pptxaryanthakur424401 This document provides an overview of the steps for creating and using a PivotTable in Excel. It begins by explaining that PivotTables can summarize and analyze large amounts of data. It then covers the key parts of a PivotTable including the data input, filters, slicers, formatting, and charts. Exercises are included to help learn how to construct a basic PivotTable, add filters and slicers, and turn the data into a chart. The goal is to teach the research and analysis capabilities of PivotTables for summarizing and exploring large datasets.
Ppt on pivot table
Ppt on pivot tableHemendra Vyas Presentation is about advance excel advance feature PIVOT Table and contains steps to insert pivot table and some useful features of pivot table in case of large amount of data
Average Cost Analysis- How To
Average Cost Analysis- How ToBen Wann This document provides steps to create a Power Pivot data model for inventory valuation using average costing. It involves linking data tables for inventory, forecasts, and item lookups. Measures are then created in the data model to calculate values like quantity, total value, price per unit, and differences from prior month prices. The measures dynamically update as the user changes the date selected in a pivot table slicer connected to a calendar date table.
Chapter 7 -DescriptiveStatistics and Pivot Table
Chapter 7 -DescriptiveStatistics and Pivot TableIzwan Nizal Mohd Shaharanee This document provides instructions for using descriptive statistics, filtering, advanced filtering, pivot tables, and other data analysis tools in Excel. It explains how to compute descriptive statistics using functions or the Data Analysis ToolPak. It also demonstrates how to filter datasets, use advanced filtering to extract subsets of records, create and format pivot tables to summarize data, add and modify fields, and link pivot table cells to external formulas.
Excel Pivot Table Demo.pptx
Excel Pivot Table Demo.pptxBeckySueParton Pivot tables allow users to quickly create interactive reports to analyze and visualize large datasets. They provide flexibility to explore the data from different perspectives with automatic formatting and updating. Pivot tables are simple to set up, fast to create, and accurate. They allow filtering of data and creation of pivot charts for visualization. To create a pivot table, users prepare their data with headers and convert it to a table. Then they add fields to the pivot table, arranging them into areas like rows, columns, values and filters to generate the report.
Ch-09 (ICS I) - Spreadsheet Software.pptx
Ch-09 (ICS I) - Spreadsheet Software.pptxnaveedabbas61 Global markets impossible to run business without use of computer technology
Administrative paperwork reduced
Businesses use websites to sell products & contact customers
Marketing
Marketing applications available provide information about products to customers
Maintaining records of products
Stock Exchanges
Important places for businessmen (around the world computerized)
Stockbrokers do trading electronically
Banks
Keeping records of customers & maintaining accounts
Excel07 l1 ch1 computer literacy
Excel07 l1 ch1 computer literacyOmar Jacalne This document provides instructions on using Microsoft Excel 2007. It begins by identifying the various elements of an Excel workbook and worksheet. It then explains how to open a new workbook, enter and edit data, save, print and close a workbook. The document also demonstrates how to insert a formula using the Sum button and copy formulas using the fill handle. It concludes by summarizing key features of Excel 2007 like opening, closing, printing and getting help.
MS Excel Pivot Table Reports & Charts
MS Excel Pivot Table Reports & Chartsdnbakhan The document discusses pivot tables and pivot charts in Microsoft Excel. It provides instructions on how to create a basic pivot table by selecting data and dragging fields, and how to modify and filter the pivot table. It also explains how to create a pivot chart based on a pivot table and change the chart type. The document demonstrates multiple examples of advanced pivot table features like two-dimensional tables, calculated fields, and multi-level tables with multiple row and filter fields.
Pivots and Slicers_v5
Pivots and Slicers_v5Jen Braly, PgMP, PMP The document provides instructions for a training session on Microsoft Excel concepts including conditional formatting, data validation, pivot tables, and slicers. The training will cover how to use conditional formatting to automatically format cells based on conditions, how to set up data validation lists to restrict data entry, how pivot tables can automatically summarize and organize data, and how slicers make filtering pivot table data easier. The agenda includes demonstrations of these features and examples of how they can be applied.
Elementary Data Analysis with MS Excel_Day-2
Elementary Data Analysis with MS Excel_Day-2Redwan Ferdous This event took place on 5th September 2020. This was arranged by EMK Center (Makerlab). The title was 'Elementary Data Analysis with MS Excel', where very basic data analysis with MS excel was discussed.
In Day-2, MS Excel Options, Ribbon, Home, Insert, Pivot, Page Break, Slicer, Spider Chart, Histogram, Conditional Formating, Flash Fill, Sorting, Filtering, Inter Sheet Data Fetching etc. were discussed. The trainer was Redwan Ferdous.
Excel07 l1 ch1
Excel07 l1 ch1Elizabeth de Leon Aler This document is from a chapter in a book about Microsoft Excel 2007. It provides instructions on various basic Excel functions including how to identify elements of a workbook, create and save a workbook, enter and edit data, insert formulas, apply formatting, print a workbook, and use the help feature. The chapter covers topics like opening Excel, navigating and selecting cells, entering text and numbers, saving, printing and closing workbooks, and using automatic features such as autofill and autocorrect.
3 ways to create vertical lines in an excel line chart
3 ways to create vertical lines in an excel line chartSteveEqualsTrue Creating Simple Vertical Lines in an Excel Line Chart
Creating Simple Vertical Lines in an Excel Line Chart
http://www.exceldashboardtemplates.com/
How-to Create a Vertical Line in an Excel Chart 3 ways. One by using Shapes, one by using Additional series and one by adding an XY Scatter line series.
Lunch 'n Learn - Excel: Pivot tables
Lunch 'n Learn - Excel: Pivot tablesCollege of Europe - Brugge - ICT Service The document discusses pivot tables in Excel. It defines a pivot table as a tool for summarizing a list into a simple format. It explains that you can create pivot tables from lists by defining which fields should be columns and rows and what data to summarize. You do not need to use all the data, just what is needed to answer questions. Once created, the pivot table allows you to see the answer. The document then provides steps for creating a pivot table, including selecting the source data, target location, rows and columns, filters and aggregates. It notes various layout, slicer, and other options that can be used.
READING ASSIGNMENTEach element of your project must be submitted.docx
READING ASSIGNMENTEach element of your project must be submitted.docxsedgar5 READING ASSIGNMENT
Each element of your project must be submitted in the correct file format. The Microsoft Word portion must be uploaded as a .docx or .doc; the Microsoft Excel portion must be uploaded as a .xlsx or .xls; and, the Microsoft Powerpoint portion must be uploaded as a .pptx or .ppt file. Your project will be individually graded by your instructor and therefore may take up to five to seven days to grade.
Be sure that each of your files contains the following information:
Your name
Your student ID number
The exam number
Your email address
Note:
If you have more than 10 attachments, you’ll need to collect all of your files into a compressed folder. To do this, follow these instructions based on your operating system:
Windows: Select the files you want to compress, right-click and select
Send to. . .
and then
Compressed (zipped) folder
Mac: Select the files you want to compress, control-click and select
Compress
To submit your graded project, follow these steps:
Log in to your student portal.
Click on
Take Exam
next to the lesson you’re working on.
Find the exam number for your project at the top of the Project Upload page.
Follow the instructions provided to complete your exam.
Be sure to keep a backup copy of any files you submit to the school!
Instructions
Memo
Start Word and create a new blank document.
Create a memo for the sales meeting as shown in the figure below, using the following formats:
The company name should be in Arial 20-point, bold, purple font.
The memo headings and text should be in Times New Roman, 12-point font, with left-aligned tab stops set to 1 inch.
Replace
Your Name Here
with your name.
The body text should be in Times New Roman, 12-point font, with bold text where indicated.
Save the document as
Meeting Memo
.
Spreadsheet and Chart
Start Excel and create a new blank workbook.
Enter data as shown in the figure, using the following formats:
The company name should be in Arial, 20-point, bold, purple font.
The Summer sales title should be in 16-point font.
The company name and Summer sales titles should be merged and centered.
Column headings should be bold, and month headings right-aligned.
The sales figures should be in Currency cell style with no decimal places.
Formulas that use functions should be used for calculated totals.
Cells B8 through E8 should be formatted in the Total cell style.
Save the worksheet as
Summer Sales.
Create a column chart based on cells A4 through D7 that looks similar to the figure below.
Select the 2-D Column Stacked Column style.
After the chart is created, add data labels as shown in the figure.
Edit the chart title as shown in the figure.
Save the modified workbook. Your final spreadsheet should look similar to the figure below.
Presentation
Start PowerPoint and create a new blank presentation.
Change the theme of the presentation to Crop or another appropriate style if you don’t have .
MemoStart Word and create a new blank document.Create .docx
MemoStart Word and create a new blank document.Create .docxhoundsomeminda The document provides instructions for creating a memo in Word, spreadsheet in Excel, and presentation in PowerPoint using sample templates and data. It describes formatting cells and charts in Excel, adding slides with different layouts in PowerPoint, and inserting Excel data, charts and images into the presentation. The final submission requires saving and submitting the Word memo, Excel spreadsheet, and PowerPoint presentation files.
Project Status KPI Dashboard Showing Completed Tasks And Task In Progress
Project Status KPI Dashboard Showing Completed Tasks And Task In ProgressSlideTeam Present with our project status Kpi dashboard showing completed tasks and task in progress, if you are looking for an appealing business presentation to fetch the attention of your audience. Graphic of project performance and project status is displayed here with three performance indicators showing, completed tasks, tasks in progress and not stated tasks. You can prioritize your status for completion of your tasks through this kpi PPT deck and craft your outcome. This PowerPoint template is equipped with various tremendous characteristic features that can serve the best out of your presentation and improve the vision of your Company. It’s a contentious market today thus it becomes important to include the foremost services and schemes in your business and marketing strategies in order to stay at the summit. Just switch on the download button and get started. They will be the perfect fit for the biggest of concepts. Initiate action to improve infrastructure with our Project Status Kpi Dashboard Showing Completed Tasks And Task In Progress. Be an enabler for industry. https://bit.ly/3hF0JG5
Ad
Recently uploaded (20)
Avast Premium Security Crack FREE Latest Version 2025
Avast Premium Security Crack FREE Latest Version 2025mu394968 🌍📱👉COPY LINK & PASTE ON GOOGLE https://dr-kain-geera.info/👈🌍
Avast Premium Security is a paid subscription service that provides comprehensive online security and privacy protection for multiple devices. It includes features like antivirus, firewall, ransomware protection, and website scanning, all designed to safeguard against a wide range of online threats, according to Avast.
Key features of Avast Premium Security:
Antivirus: Protects against viruses, malware, and other malicious software, according to Avast.
Firewall: Controls network traffic and blocks unauthorized access to your devices, as noted by All About Cookies.
Ransomware protection: Helps prevent ransomware attacks, which can encrypt your files and hold them hostage.
Website scanning: Checks websites for malicious content before you visit them, according to Avast.
Email Guardian: Scans your emails for suspicious attachments and phishing attempts.
Multi-device protection: Covers up to 10 devices, including Windows, Mac, Android, and iOS, as stated by 2GO Software.
Privacy features: Helps protect your personal data and online privacy.
In essence, Avast Premium Security provides a robust suite of tools to keep your devices and online activity safe and secure, according to Avast.
How to Optimize Your AWS Environment for Improved Cloud Performance
How to Optimize Your AWS Environment for Improved Cloud PerformanceThousandEyes How to Optimize Your AWS Environment for Improved Cloud Performance
Secure Test Infrastructure: The Backbone of Trustworthy Software Development
Secure Test Infrastructure: The Backbone of Trustworthy Software DevelopmentShubham Joshi A secure test infrastructure ensures that the testing process doesn’t become a gateway for vulnerabilities. By protecting test environments, data, and access points, organizations can confidently develop and deploy software without compromising user privacy or system integrity.
Top 10 Data Cleansing Tools for 2025.pdf
Top 10 Data Cleansing Tools for 2025.pdfAffinityCore Discover the top 10 data cleansing tools for 2025, designed to help businesses clean, transform, and enhance data accuracy. Improve decision-making and data quality with these powerful solutions.
Cryptocurrency Exchange Script like Binance.pptx
Cryptocurrency Exchange Script like Binance.pptxriyageorge2024 This SlideShare dives into the process of developing a crypto exchange platform like Binance, one of the world’s largest and most successful cryptocurrency exchanges.
Proactive Vulnerability Detection in Source Code Using Graph Neural Networks:...
Proactive Vulnerability Detection in Source Code Using Graph Neural Networks:...Ranjan Baisak As software complexity grows, traditional static analysis tools struggle to detect vulnerabilities with both precision and context—often triggering high false positive rates and developer fatigue. This article explores how Graph Neural Networks (GNNs), when applied to source code representations like Abstract Syntax Trees (ASTs), Control Flow Graphs (CFGs), and Data Flow Graphs (DFGs), can revolutionize vulnerability detection. We break down how GNNs model code semantics more effectively than flat token sequences, and how techniques like attention mechanisms, hybrid graph construction, and feedback loops significantly reduce false positives. With insights from real-world datasets and recent research, this guide shows how to build more reliable, proactive, and interpretable vulnerability detection systems using GNNs.
DVDFab Crack FREE Download Latest Version 2025
DVDFab Crack FREE Download Latest Version 2025younisnoman75 ⭕️➡️ FOR DOWNLOAD LINK : http://drfiles.net/ ⬅️⭕️
DVDFab is a multimedia software suite primarily focused on DVD and Blu-ray disc processing. It offers tools for copying, ripping, creating, and editing DVDs and Blu-rays, as well as features for downloading videos from streaming sites. It also provides solutions for playing locally stored video files and converting audio and video formats.
Here's a more detailed look at DVDFab's offerings:
DVD Copy:
DVDFab offers software for copying and cloning DVDs, including removing copy protections and creating backups.
DVD Ripping:
This allows users to rip DVDs to various video and audio formats for playback on different devices, while maintaining the original quality.
Blu-ray Copy:
DVDFab provides tools for copying and cloning Blu-ray discs, including removing Cinavia protection and creating lossless backups.
4K UHD Copy:
DVDFab is known for its 4K Ultra HD Blu-ray copy software, allowing users to copy these discs to regular BD-50/25 discs or save them as 1:1 lossless ISO files.
DVD Creator:
This tool allows users to create DVDs from various video and audio formats, with features like GPU acceleration for faster burning.
Video Editing:
DVDFab includes a video editing tool for tasks like cropping, trimming, adding watermarks, external subtitles, and adjusting brightness.
Video Player:
A free video player that supports a wide range of video and audio formats.
All-In-One:
DVDFab offers a bundled software package, DVDFab All-In-One, that includes various tools for handling DVD and Blu-ray processing.
Mastering Fluent Bit: Ultimate Guide to Integrating Telemetry Pipelines with ...
Mastering Fluent Bit: Ultimate Guide to Integrating Telemetry Pipelines with ...Eric D. Schabell It's time you stopped letting your telemetry data pressure your budgets and get in the way of solving issues with agility! No more I say! Take back control of your telemetry data as we guide you through the open source project Fluent Bit. Learn how to manage your telemetry data from source to destination using the pipeline phases covering collection, parsing, aggregation, transformation, and forwarding from any source to any destination. Buckle up for a fun ride as you learn by exploring how telemetry pipelines work, how to set up your first pipeline, and exploring several common use cases that Fluent Bit helps solve. All this backed by a self-paced, hands-on workshop that attendees can pursue at home after this session (https://o11y-workshops.gitlab.io/workshop-fluentbit).
Interactive odoo dashboards for sales, CRM , Inventory, Invoice, Purchase, Pr...
Interactive odoo dashboards for sales, CRM , Inventory, Invoice, Purchase, Pr...AxisTechnolabs Interactive Odoo Dashboard for various business needs can provide users with dynamic, visually appealing dashboards tailored to their specific requirements. such a module that could support multiple dashboards for different aspects of a business
✅Visit And Buy Now : https://bit.ly/3VojWza
✅This Interactive Odoo dashboard module allow user to create their own odoo interactive dashboards for various purpose.
App download now :
Odoo 18 : https://bit.ly/3VojWza
Odoo 17 : https://bit.ly/4h9Z47G
Odoo 16 : https://bit.ly/3FJTEA4
Odoo 15 : https://bit.ly/3W7tsEB
Odoo 14 : https://bit.ly/3BqZDHg
Odoo 13 : https://bit.ly/3uNMF2t
Try Our website appointment booking odoo app : https://bit.ly/3SvNvgU
👉Want a Demo ?📧 [email protected]
➡️Contact us for Odoo ERP Set up : 091066 49361
👉Explore more apps: https://bit.ly/3oFIOCF
👉Want to know more : 🌐 https://www.axistechnolabs.com/
#odoo #odoo18 #odoo17 #odoo16 #odoo15 #odooapps #dashboards #dashboardsoftware #odooerp #odooimplementation #odoodashboardapp #bestodoodashboard #dashboardapp #odoodashboard #dashboardmodule #interactivedashboard #bestdashboard #dashboard #odootag #odooservices #odoonewfeatures #newappfeatures #odoodashboardapp #dynamicdashboard #odooapp #odooappstore #TopOdooApps #odooapp #odooexperience #odoodevelopment #businessdashboard #allinonedashboard #odooproducts
TestMigrationsInPy: A Dataset of Test Migrations from Unittest to Pytest (MSR...
TestMigrationsInPy: A Dataset of Test Migrations from Unittest to Pytest (MSR...Andre Hora Unittest and pytest are the most popular testing frameworks in Python. Overall, pytest provides some advantages, including simpler assertion, reuse of fixtures, and interoperability. Due to such benefits, multiple projects in the Python ecosystem have migrated from unittest to pytest. To facilitate the migration, pytest can also run unittest tests, thus, the migration can happen gradually over time. However, the migration can be timeconsuming and take a long time to conclude. In this context, projects would benefit from automated solutions to support the migration process. In this paper, we propose TestMigrationsInPy, a dataset of test migrations from unittest to pytest. TestMigrationsInPy contains 923 real-world migrations performed by developers. Future research proposing novel solutions to migrate frameworks in Python can rely on TestMigrationsInPy as a ground truth. Moreover, as TestMigrationsInPy includes information about the migration type (e.g., changes in assertions or fixtures), our dataset enables novel solutions to be verified effectively, for instance, from simpler assertion migrations to more complex fixture migrations. TestMigrationsInPy is publicly available at: https://github.com/altinoalvesjunior/TestMigrationsInPy.
Download YouTube By Click 2025 Free Full Activated
Download YouTube By Click 2025 Free Full Activatedsaniamalik72555 Copy & Past Link 👉👉
https://dr-up-community.info/
"YouTube by Click" likely refers to the ByClick Downloader software, a video downloading and conversion tool, specifically designed to download content from YouTube and other video platforms. It allows users to download YouTube videos for offline viewing and to convert them to different formats.
Scaling GraphRAG: Efficient Knowledge Retrieval for Enterprise AI
Scaling GraphRAG: Efficient Knowledge Retrieval for Enterprise AIdanshalev If we were building a GenAI stack today, we'd start with one question: Can your retrieval system handle multi-hop logic?
Trick question, b/c most can’t. They treat retrieval as nearest-neighbor search.
Today, we discussed scaling #GraphRAG at AWS DevOps Day, and the takeaway is clear: VectorRAG is naive, lacks domain awareness, and can’t handle full dataset retrieval.
GraphRAG builds a knowledge graph from source documents, allowing for a deeper understanding of the data + higher accuracy.
Why Orangescrum Is a Game Changer for Construction Companies in 2025
Why Orangescrum Is a Game Changer for Construction Companies in 2025Orangescrum Orangescrum revolutionizes construction project management in 2025 with real-time collaboration, resource planning, task tracking, and workflow automation, boosting efficiency, transparency, and on-time project delivery.
Expand your AI adoption with AgentExchange
Expand your AI adoption with AgentExchangeFexle Services Pvt. Ltd. AgentExchange is Salesforce’s latest innovation, expanding upon the foundation of AppExchange by offering a centralized marketplace for AI-powered digital labor. Designed for Agentblazers, developers, and Salesforce admins, this platform enables the rapid development and deployment of AI agents across industries.
Email: [email protected]
Phone: +1(630) 349 2411
Website: https://www.fexle.com/blogs/agentexchange-an-ultimate-guide-for-salesforce-consultants-businesses/?utm_source=slideshare&utm_medium=pptNg
F-Secure Freedome VPN 2025 Crack Plus Activation New Version
F-Secure Freedome VPN 2025 Crack Plus Activation New Versionsaimabibi60507 Copy & Past Link 👉👉
https://dr-up-community.info/
F-Secure Freedome VPN is a virtual private network service developed by F-Secure, a Finnish cybersecurity company. It offers features such as Wi-Fi protection, IP address masking, browsing protection, and a kill switch to enhance online privacy and security .
Odoo ERP for Education Management to Streamline Your Education Process
Odoo ERP for Education Management to Streamline Your Education ProcessiVenture Team LLP Odoo ERP for Education Management can streamline your education process such as admission, staff, lecture, payment and much more.
Full Cracked Resolume Arena Latest Version
Full Cracked Resolume Arena Latest Versionjonesmichealj2 Resolume Arena is a professional VJ software that lets you play, mix, and manipulate video content during live performances.
This Site is providing ✅ 100% Safe Crack Link:
Copy This Link and paste it in a new tab & get the Crack File
↓
➡ 🌍📱👉COPY & PASTE LINK👉👉👉 👉 https://yasir252.my/
FlakyFix: Using Large Language Models for Predicting Flaky Test Fix Categorie...
FlakyFix: Using Large Language Models for Predicting Flaky Test Fix Categorie...Lionel Briand Journal-first presentation at ICST 2025
Societal challenges of AI: biases, multilinguism and sustainability
Societal challenges of AI: biases, multilinguism and sustainabilityJordi Cabot Towards a fairer, inclusive and sustainable AI that works for everybody.
Reviewing the state of the art on these challenges and what we're doing at LIST to test current LLMs and help you select the one that works best for you

5 Annoying Excel Pivot Table Problems
- 1. Annoying Excel Pivot Table Problems and how to solve them
- 2. Old Items in Pivot List 1 Problem # No Central data, still in list
- 3. Change Pivot Setting • Pivot Options - Data tab • Change Retain Items to “None” 1 Fix #
- 4. GetPivotData Formula 2 Problem # Link to pivot cell creates GetPivotData formula
- 5. Turn Off GetPivotData • Ribbon – Options tab 2 Fix #
- 6. Show Sum Not Count 3 Problem # Some values show Count not Sum
- 7. Blanks & Text • Blank or text items cause problem • Fix data or change in pivot table 3 Fix #
- 8. New Data Missing 4 Problem # New data added, not in pivot table
- 9. Use Table for Data • Build pivot from Formatted Table • Automatically expands 4 Fix #
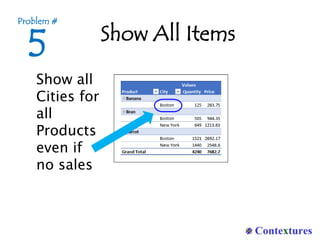
- 10. Show All Items 5 Problem # Show all Cities for all Products even if no sales
- 11. Pivot Field Setting • Layout & Print – Show Items With No Data 5 Fix #
- 12. Excel Pivot Table Links 1. Clear old data from drop downs 2. Turn off GetPivotData 3. Change Count to Sum 4. Include all new data 5. Show items with no data 5