SlideShare a Scribd company logo
A Comparative Study of Histogram
Equalization Based Image Enhancement
Techniques
Md. Shahbaz Alam
Roll: AE-029, Session: 2016-17
27th August, 2017
Institute of Statistical Research and Training
University of Dhaka
1
Outline
1. Introduction
2. Basic definitions and notations
3. Methodology
4. Results and discussion
5. Conclusion
2
Introduction
Introducton
Digital image processing is the technology of applying a number
of algorithms to process digital image. Basically it includes the
following three steps:
• Importing the image via image acquisition tools.
• Analyzing and manipulating the image.
• Output (an altered image or image analysis report).
3
Introduction
Image enhancement: A collection of techniques that seek to
improve the visual appearance of an image or convert images to a
form better suited for analysis by human or machine. In general
two major approaches, one is gray level statistics based and the
other is spatial frequency content based.
The principle objective of image enhancement is to modify
attributes of an image to make it more suitable for a given task
and a specific observer.
4
Introduction
The existing image enhancement techniques can be classified into
two catagories:
• Spatial domain enhancement.
• Frequency domain enhancement.
Spatial domain techniques are performed to the image plane itself
and are based on direct manipulation of pixels in an image.
Histogram equalization is a well known spatial domain
enhancement technique due to its strong performance and easy
algorithm in almost all types of images.
5
Aims and objectives
• To describe and implement four popular methods of histogram
equalization on images with different levels of contrast.
• To compare among these five methods using traditional as
well as sophisticated metric.
• To illustrate the application of histogram in the field of image
processing.
6
Basic definitions and notations
Digital image
A digital image is a matrix representation of a two-dimensional
image. It can be represented by the following matrix:
f (x, y) =










f (0, 0) f (0, 1) ... f (0, N − 1)
f (1, 0) f (1, 1) ... f (1, N − 1)
. . ... .
. . ... .
. . ... .
f (M − 1, 0) f (M − 1, 1) ... f (M − 1, N − 1)










(1)
It is advantageous to use a more traditional matrix notation to
denote a digital image and its elements:
7
Basic definitions
A =










a0,0 a0,1 ... a0,N−1
a1,0 a1,0 ... a1,N−1
. . ... .
. . ... .
. . ... .
aM−1,0 aM−1,0 ... aM−1,N−1










(2)
where, ai,j = f (x = i, y = j) = f (i, j) and thus equations (1) and
(2) are identical.
8
Basic definitions
Pixel
Each element in the matrix is called an image element, picture
element, pixel or pel.Thus a digital image f (x, y) with M rows and
N columns contains M × N number of pixels or image elements. In
spatial domain technique for image processing, operation is done
on this pixel.
9
Basic definitions
Neighbors of a pixel
The 4-neighbors of pixel p, N4(p) are the four pixels located
at(shaded square) (x + 1, y), (x − 1, y), (x, y + 1), (x, y − 1)
(x-1,y-1) (x-1,y) (x-1,y+1)
(x, y-1) (x, y) (x, y+1)
(x+1,y-1) (x+1,y) (x+1,y+1)
Table 1: 8-neighborhood.
The four diagonal neighbors of pixel p, ND(p) are the four pixels
located at
(x + 1, y + 1), (x + 1, y − 1), (x − 1, y + 1), (x − 1, y − 1) and
are denoted by ND(p). These points, together with the
4-neighbors, are called the 8-neighbors of p, denoted by N8(p).
10
Basic definitions
Bit-depth
It explains the number of possible colors from which a particular
value can be selected by a pixel. For example: a binary image is an
one bit image which can take any of thee two values: 0 or 1 (black
or white). An 8 − bit gray-scale image can assign one of 256( 28)
colors to a pixel. The number of b bits required to store a digital
image of size M × N with 2k gray level is,
b = M × N × k (3)
11
Figure 1: A bi-tonal image, where pixels can take any of the two values
namely 0 and1.
12
Basic definitions
Image histogram
Image histogram provides information about brightness and
contrast of an image. Discrete function h(rk) showing the number
of occurrences nk for the kth gray level rk
h(rk) = nk (4)
A common practice is to normalize a histogram by dividing each of
its values by the total number of pixels, denoted by n. So,
p(rk) =
nk
n
, for k = 0, 1, ..., L − 1; and
L−1
0
p(rk) = 1 (5)
13
Basic definitions
Image histogram
Figure 2: An 8-bit image of Albert Einstein and its histogram
14
Methodology
Methodology
Four different histogram equalization techniques has been used:
1. Global Histogram Equalization(GHE).
2. Brightness Preserving Bi-Histogram Equalization(BBHE).
3. Equal Area Dualistic Sub Image Histogram Equalization
(DSIHE).
4. Recursive Mean Separate Histogram Equalization (RMSHE).
15
Mathematical formulation of GHE
Let, X = {X(i, j)} is a given image composed in L(for 8-bi image
L = 256) discrete gray levels denoted as X0, X1, ..., XL−1
• Calculate the probability density function.
p(Xk) =
nk
n
, fork = 0, 1, ..., L − 1 (6)
• Calculate cumulative distribution function by
c(xk) =
k
j=0
p(Xj ), for k = 0, 1, ..., L − 1 (7)
• On the basis of CDF, Define transformation function f (x) as
f (Xk) = X0 + (XL−1 − X0)c(xk) (8)
• Using the transformation function, calculate new intensity
values 16
Global Histogram Equalization(GHE)
Figure 3: Histogram before and after HE or equivalently, RMSHE, r = 0.
17
An example of GHE
Figure 4: Contrast enhancement based on global histogram equalization.
18
Brightness Preserving Bi-Histogram Equalization(BBHE)
• Partitions Histogram in two sub-histograms and equalize them
independently.
• Proposed to minimize mean intensity change.
• Ultimate goal is to preserve brightness and enhance contrast.
• Image parameters such as mean gray-scale level used for
partitioning.
19
Equal Area Dualistic Sub Image Histogram Equalization (DSIHE).
This method is also known as Dualistic Sub Image Histogram
Equalization(DSIHE).
• Image parameters such as median grayscale level used for
partitioning.
• The input image is decomposed into two sub-images, being
one dark and one bright.
• Then applies Histogram Equalization on two sub-images.
20
Mathematical Formulation for BBHE and DSIHE
• Input image X(i, j) with gray levels 0 to 255.
• Image X(i, j) is segmented by a section with gray level of Xm
• Xm (mean in case of BBHE and median in case of DSIHE)
• The image is decomposed into two sub images XL and XU.
•
X = XL ∪ XU
where
XL = {X(i, j)|X(i, j) ≤ Xm, ∀X(i, j) ∈ X}
and
XU = {X(i, j)|X(i, j) > Xm, ∀X(i, j) ∈ X}
21
Mathematical Formulation for BBHE and DSIHE
• XL is composed by gray level of {l0, l1, ..., lm}, XU is
composed by gray level of {lm+1, lm+2, ..., lL−1}
• Respective probability density functions of the sub-images are:
pL(Xk) =
nk
L
nL
, for k = 0, 1, ..., m
and
pU(Xk) =
nk
U
nU
, for k = m + 1, m + 2, ..., L − 1
22
Mathematical Formulation for BBHE and DSIHE
• nk
L and nk
U are the numbers of Xk
• nL = m
k=0 nk
L , nU = L−1
k=m+1 nk
U
• The respective cumulative density function for XL and XU are
: cL(x) = k
j=0 pL(Xj ) and cU(x) = L−1
j=m+1 pU(Xj )
• Transformation function defined for exploiting the cumulative
density functions: fL(x) = X0 + (Xm − X0)cL(x) and
fU(x) = Xm+1 + (XL−1 − Xm+1)cU(x)
23
Mathematical Formulation for BBHE and DSIHE
• Based on these transform functions, the decomposed
sub-image are equalized independently.
• The composition of resulting equalized sub-images constitutes
the output of BBHE or DSIHE as Y = {Y (i, j)}
= fL(XL) ∪ fU(XU) where
fL(XL) = {fL(X(i, j)|∀X(i, j) ∈ XL)} and
fU(XU) = {fU(X(i, j)|∀X(i, j) ∈ XU)}
24
Algorithm for BBHE
• Obtain the original image.
• Get histogram of the original image.
• Calculate mean of the histogram.
• Divide the histogram on the basis of the mean in two parts.
• Equalize each part independently using PDF and CDF.
• Combine both sub-images for the processed image
25
Algorithm for BBHE
Figure 5: Histogram before and after BBHE or equivalently, RMSHE, r
= 1.
26
An example of BBHE
Figure 6: Contrast enhancement based on brightness preserving
bi-histogram equalization.
27
Algorithm for DSIHE
• Obtain the original image.
• Get histogram of the original image.
• Calculate median of the histogram.
• Divide the histogram on the basis of the median in two parts.
• Equalize each part independently using PDF and CDF.
• Combine both sub-images for the processed image
28
An example of DSIHE
Figure 7: Contrast enhancement based on dualistic sub-image histogram
equalization.
29
Recursive Mean Separate Histogram Equalization (RMSHE)
• Generalization of HE and BBHE in term of brightness
preservation
• Recursively separating the input histogram based on the mean
30
Recursive Mean Separate Histogram Equalization (RMSHE)
Figure 8: Recursive mean separated histogram equalization with
recursion level r=2
31
An example of RMSHE
Figure 9: Contrast enhancement based on recursive mean separate
histogram equalization.
32
Results and discussion
Quality assessment
The following measurement are used to make comparison among
the histogram equalization techniques
• Mean squared error (MSE) is the average of squared
intensity differences distorted and reference image pixels.
Lower value of MSE means that the image is of good quality.
• Peak signal to noise ratio(PSNR) is the ratio between the
maximum possible power of a signal and the power of
corrupting noise that affects the fidelity of its representation.
It varies between 25 to 40 dB. Higher value of PSNR is good
• Structural similarity index(SSIM) varies between 0 to 1.
The value 1 means, the image is of best quality.
33
Visual Assessment
Global histogram equalization
Figure 10: Contrast enhancement based on histogram equalization.
34
Visual Assessment
Brightness preserving bi-histogram equalization
Figure 11: Contrast enhancement based on brightness preserving
bi-histogram equalization.
35
Visual Assessment
Dualistic sub-image histogram equalization
Figure 12: Contrast enhancement based on dualistic sub-image
histogram equalization.
36
Visual Assessment
Recursive mean separate histogram equalization
Figure 13: Contrast enhancement based on recursive mean separate
histogram equalization.
37
Experimental results
Simulation results for ’Tungsten-filament’ and ’Barbara’ are
presented in table 2 and 3. and
Methods Mean SD SSIM MSE PSNR
Tungsten filament 128.11 75.31 – – –
GHE 127.71 73.5 0.79991 478.83 21.32
BBHE 150.5 69.05 0.80593 843.65 18.86
DSHE 140.43 72.94 0.79856 533.68 20.85
RMSHE 133.99 79.97 0.90909 139.46 26.68
Table 2: Comparison of various histogram equalization methods using
objective image quality measures
38
Methods Mean SD SSIM MSE PSNR
Barbara 111.5 48.15 – – –
GHE 127.48 73.88 0.875 969.18 18.26
BBHE 118.44 73.77 0.868 782.22 19.19
DSIHE 117.94 73.77 0.867 777.89 19.22
RMSHE 115.93 61.01 0.937 243.36 24.26
Table 3: Comparison of various histogram equalization methods using
objective image quality measures
39
Conclusion
Conclusion
• The experimental results shows that RMSHE processed
’Tungsten-filament’ image has lowest MSE , highest PSNR
and highest SSIM among these four techniques.
• Similar result shows for ’Barbara’ image.
So, recursive mean separate histogram equalization(RMSHE)
performs well according to this performance measure as well as
visual assessment.
40
Thank You!
40
Questions?
40
Appendix
Reference i
Rafael C Gonzalez and Richard E Woods. Digital image
processing prentice hall. Upper Saddle River, NJ , 2002a.
Gregory A Baxes. Digital image processing: principles and
applications .
Yeong-Taeg Kim. Contrast enhancement using brightness
preserving bi-histogram equalization. IEEE transactions on
Consumer Electronics , 43(1):18, 1997.
Yu Wang, Qian Chen, and Baeomin Zhang. Image
enhancement based on equal area dualistic sub-image
histogram equalization method. IEEE Transactions on
Consumer Electronics , 45(1):6875, 1999.
Reference ii
Soong-Der Chen and Abd Rahman Ramli. Contrast
enhancement using recursive mean-separate histogram
equalization for scalable brightness preservation. IEEE
Transactions on consumer Electronics , 49(4):13011309, 2003.
Zhou Wang, Alan C Bovik, Hamid R Sheikh, and Eero P
Simoncelli. Image quality assessment: from error visibility to
structural similarity. IEEE transactions on image processing ,
13(4):600612, 2004.
Ad

Recommended

Image Processing: Spatial filters
Dr. A. B. Shinde
 
Color Image Processing: Basics
Dr. A. B. Shinde
 
Spatial Filters (Digital Image Processing)
Kalyan Acharjya
 
Chapter 8 image compression
asodariyabhavesh
 
Histogram Processing
Amnaakhaan
 
Color fundamentals and color models - Digital Image Processing
Amna
 
Texture,pattern and pattern classes
rajisri2
 
Color image processing
Madhuri Sachane
 
Fundamentals steps in Digital Image processing
KarthicaMarasamy
 
Digital Image Fundamentals
Dr. A. B. Shinde
 
Image Sampling and Quantization.pptx
RUBIN (A) JEBIN
 
Image Restoration (Frequency Domain Filters):Basics
Kalyan Acharjya
 
Image enhancement
Image enhancement
Dr INBAMALAR T M
 
COM2304: Intensity Transformation and Spatial Filtering – II Spatial Filterin...
Hemantha Kulathilake
 
Chapter 6 color image processing
asodariyabhavesh
 
Spatial filtering using image processing
Anuj Arora
 
color image processing
HemanthvenkataSaiA
 
Morphological operations
National Institute of Technology Durgapur
 
mean_filter
mean_filter
Satyajit Nag Mithu
 
Lect 06
Lect 06
Moe Moe Myint
 
digital image processing
Abinaya B
 
Spatial filtering
Spatial filtering
Visvesvaraya National Institute of Technology, Nagpur, Maharashtra, India
 
Image segmentation
Image segmentation
Visvesvaraya National Institute of Technology, Nagpur, Maharashtra, India
 
Image Restoration (Digital Image Processing)
Kalyan Acharjya
 
Image Enhancement in Spatial Domain
Dr. A. B. Shinde
 
Color Image Processing
kiruthiammu
 
Image compression models
priyadharshini murugan
 
Image compression in digital image processing
DHIVYADEVAKI
 
D046022629
D046022629
IJERA Editor
 
Lec_2_Digital Image Fundamentals.pdf
nagwaAboElenein
 

More Related Content

What's hot (20)

Fundamentals steps in Digital Image processing
KarthicaMarasamy
 
Digital Image Fundamentals
Dr. A. B. Shinde
 
Image Sampling and Quantization.pptx
RUBIN (A) JEBIN
 
Image Restoration (Frequency Domain Filters):Basics
Kalyan Acharjya
 
Image enhancement
Image enhancement
Dr INBAMALAR T M
 
COM2304: Intensity Transformation and Spatial Filtering – II Spatial Filterin...
Hemantha Kulathilake
 
Chapter 6 color image processing
asodariyabhavesh
 
Spatial filtering using image processing
Anuj Arora
 
color image processing
HemanthvenkataSaiA
 
Morphological operations
National Institute of Technology Durgapur
 
mean_filter
mean_filter
Satyajit Nag Mithu
 
Lect 06
Lect 06
Moe Moe Myint
 
digital image processing
Abinaya B
 
Spatial filtering
Spatial filtering
Visvesvaraya National Institute of Technology, Nagpur, Maharashtra, India
 
Image segmentation
Image segmentation
Visvesvaraya National Institute of Technology, Nagpur, Maharashtra, India
 
Image Restoration (Digital Image Processing)
Kalyan Acharjya
 
Image Enhancement in Spatial Domain
Dr. A. B. Shinde
 
Color Image Processing
kiruthiammu
 
Image compression models
priyadharshini murugan
 
Image compression in digital image processing
DHIVYADEVAKI
 
Fundamentals steps in Digital Image processing
KarthicaMarasamy
 
Digital Image Fundamentals
Dr. A. B. Shinde
 
Image Sampling and Quantization.pptx
RUBIN (A) JEBIN
 
Image Restoration (Frequency Domain Filters):Basics
Kalyan Acharjya
 
COM2304: Intensity Transformation and Spatial Filtering – II Spatial Filterin...
Hemantha Kulathilake
 
Chapter 6 color image processing
asodariyabhavesh
 
Spatial filtering using image processing
Anuj Arora
 
digital image processing
Abinaya B
 
Image Restoration (Digital Image Processing)
Kalyan Acharjya
 
Image Enhancement in Spatial Domain
Dr. A. B. Shinde
 
Color Image Processing
kiruthiammu
 
Image compression in digital image processing
DHIVYADEVAKI
 

Similar to A Comparative Study of Histogram Equalization Based Image Enhancement Techniques (20)

D046022629
D046022629
IJERA Editor
 
Lec_2_Digital Image Fundamentals.pdf
nagwaAboElenein
 
Combining Generative And Discriminative Classifiers For Semantic Automatic Im...
CSCJournals
 
Contrast enhancement using various statistical operations and neighborhood pr...
sipij
 
Image processing second unit Notes
AAKANKSHA JAIN
 
Study on Contrast Enhancement with the help of Associate Regions Histogram Eq...
IJSRD
 
h.pdf
h.pdf
ssuser2c84bd1
 
Image enhancement ppt nal2
Surabhi Ks
 
Object Shape Representation by Kernel Density Feature Points Estimator
cscpconf
 
Image processing 1-lectures
Taymoor Nazmy
 
Performance Evaluation of Filters for Enhancement of Images in Different Appl...
IOSR Journals
 
Image Acquisition and Representation
Amnaakhaan
 
Lec_3_Image Enhancement_spatial Domain.pdf
nagwaAboElenein
 
3 intensity transformations and spatial filtering slides
BHAGYAPRASADBUGGE
 
Image Enhacement for the image improvement
AsifMehmood240435
 
Histogram equalization
treasure17
 
Histogram based Enhancement
Vivek V
 
Histogram based enhancement
liba manopriya.J
 
Iisrt zzz bhavyasri vanteddu
IISRT
 
On image intensities, eigenfaces and LDA
Raghu Palakodety
 
Lec_2_Digital Image Fundamentals.pdf
nagwaAboElenein
 
Combining Generative And Discriminative Classifiers For Semantic Automatic Im...
CSCJournals
 
Contrast enhancement using various statistical operations and neighborhood pr...
sipij
 
Image processing second unit Notes
AAKANKSHA JAIN
 
Study on Contrast Enhancement with the help of Associate Regions Histogram Eq...
IJSRD
 
Image enhancement ppt nal2
Surabhi Ks
 
Object Shape Representation by Kernel Density Feature Points Estimator
cscpconf
 
Image processing 1-lectures
Taymoor Nazmy
 
Performance Evaluation of Filters for Enhancement of Images in Different Appl...
IOSR Journals
 
Image Acquisition and Representation
Amnaakhaan
 
Lec_3_Image Enhancement_spatial Domain.pdf
nagwaAboElenein
 
3 intensity transformations and spatial filtering slides
BHAGYAPRASADBUGGE
 
Image Enhacement for the image improvement
AsifMehmood240435
 
Histogram equalization
treasure17
 
Histogram based Enhancement
Vivek V
 
Histogram based enhancement
liba manopriya.J
 
Iisrt zzz bhavyasri vanteddu
IISRT
 
On image intensities, eigenfaces and LDA
Raghu Palakodety
 
Ad

Recently uploaded (20)

Indigo_Airlines_Strategy_Presentation.pptx
mukeshpurohit991
 
Grote OSM datasets zonder kopzorgen bij Reijers
jacoba18
 
最新版美国加利福尼亚大学旧金山法学院毕业证(UCLawSF毕业证书)定制
taqyea
 
presentation4.pdf Intro to mcmc methodss
SergeyTsygankov6
 
Shifting Focus on AI: How it Can Make a Positive Difference
1508 A/S
 
UPS and Big Data intro to Business Analytics.pptx
sanjum5582
 
定制OCAD学生卡加拿大安大略艺术与设计大学成绩单范本,OCAD成绩单复刻
taqyed
 
Flextronics Employee Safety Data-Project-2.pptx
kilarihemadri
 
reporting monthly for genset & Air Compressor.pptx
dacripapanjaitan
 
Boost Business Efficiency with Professional Data Entry Services
eloiacs eloiacs
 
All the DataOps, all the paradigms .
Lars Albertsson
 
YEAP !NOT WHAT YOU THINK aakshdjdncnkenfj
payalmistryb
 
deep_learning_presentation related to llm
sayedabdussalam11
 
Camuflaje Tipos Características Militar 2025.ppt
e58650738
 
KLIP2Data voor de herinrichting van R4 West en Oost
jacoba18
 
THE LINEAR REGRESSION MODEL: AN OVERVIEW
Ameya Patekar
 
@Reset-Password.pptx presentakh;kenvtion
MarkLariosa1
 
Untitled presentation xcvxcvxcvxcvx.pptx
jonathan4241
 
Veilig en vlot fietsen in Oost-Vlaanderen: Fietssnelwegen geoptimaliseerd met...
jacoba18
 
REGRESSION DIAGNOSTIC I: MULTICOLLINEARITY
Ameya Patekar
 
Ad

A Comparative Study of Histogram Equalization Based Image Enhancement Techniques

  • 1. A Comparative Study of Histogram Equalization Based Image Enhancement Techniques Md. Shahbaz Alam Roll: AE-029, Session: 2016-17 27th August, 2017 Institute of Statistical Research and Training University of Dhaka 1
  • 2. Outline 1. Introduction 2. Basic definitions and notations 3. Methodology 4. Results and discussion 5. Conclusion 2
  • 4. Introducton Digital image processing is the technology of applying a number of algorithms to process digital image. Basically it includes the following three steps: • Importing the image via image acquisition tools. • Analyzing and manipulating the image. • Output (an altered image or image analysis report). 3
  • 5. Introduction Image enhancement: A collection of techniques that seek to improve the visual appearance of an image or convert images to a form better suited for analysis by human or machine. In general two major approaches, one is gray level statistics based and the other is spatial frequency content based. The principle objective of image enhancement is to modify attributes of an image to make it more suitable for a given task and a specific observer. 4
  • 6. Introduction The existing image enhancement techniques can be classified into two catagories: • Spatial domain enhancement. • Frequency domain enhancement. Spatial domain techniques are performed to the image plane itself and are based on direct manipulation of pixels in an image. Histogram equalization is a well known spatial domain enhancement technique due to its strong performance and easy algorithm in almost all types of images. 5
  • 7. Aims and objectives • To describe and implement four popular methods of histogram equalization on images with different levels of contrast. • To compare among these five methods using traditional as well as sophisticated metric. • To illustrate the application of histogram in the field of image processing. 6
  • 9. Digital image A digital image is a matrix representation of a two-dimensional image. It can be represented by the following matrix: f (x, y) =           f (0, 0) f (0, 1) ... f (0, N − 1) f (1, 0) f (1, 1) ... f (1, N − 1) . . ... . . . ... . . . ... . f (M − 1, 0) f (M − 1, 1) ... f (M − 1, N − 1)           (1) It is advantageous to use a more traditional matrix notation to denote a digital image and its elements: 7
  • 10. Basic definitions A =           a0,0 a0,1 ... a0,N−1 a1,0 a1,0 ... a1,N−1 . . ... . . . ... . . . ... . aM−1,0 aM−1,0 ... aM−1,N−1           (2) where, ai,j = f (x = i, y = j) = f (i, j) and thus equations (1) and (2) are identical. 8
  • 11. Basic definitions Pixel Each element in the matrix is called an image element, picture element, pixel or pel.Thus a digital image f (x, y) with M rows and N columns contains M × N number of pixels or image elements. In spatial domain technique for image processing, operation is done on this pixel. 9
  • 12. Basic definitions Neighbors of a pixel The 4-neighbors of pixel p, N4(p) are the four pixels located at(shaded square) (x + 1, y), (x − 1, y), (x, y + 1), (x, y − 1) (x-1,y-1) (x-1,y) (x-1,y+1) (x, y-1) (x, y) (x, y+1) (x+1,y-1) (x+1,y) (x+1,y+1) Table 1: 8-neighborhood. The four diagonal neighbors of pixel p, ND(p) are the four pixels located at (x + 1, y + 1), (x + 1, y − 1), (x − 1, y + 1), (x − 1, y − 1) and are denoted by ND(p). These points, together with the 4-neighbors, are called the 8-neighbors of p, denoted by N8(p). 10
  • 13. Basic definitions Bit-depth It explains the number of possible colors from which a particular value can be selected by a pixel. For example: a binary image is an one bit image which can take any of thee two values: 0 or 1 (black or white). An 8 − bit gray-scale image can assign one of 256( 28) colors to a pixel. The number of b bits required to store a digital image of size M × N with 2k gray level is, b = M × N × k (3) 11
  • 14. Figure 1: A bi-tonal image, where pixels can take any of the two values namely 0 and1. 12
  • 15. Basic definitions Image histogram Image histogram provides information about brightness and contrast of an image. Discrete function h(rk) showing the number of occurrences nk for the kth gray level rk h(rk) = nk (4) A common practice is to normalize a histogram by dividing each of its values by the total number of pixels, denoted by n. So, p(rk) = nk n , for k = 0, 1, ..., L − 1; and L−1 0 p(rk) = 1 (5) 13
  • 16. Basic definitions Image histogram Figure 2: An 8-bit image of Albert Einstein and its histogram 14
  • 18. Methodology Four different histogram equalization techniques has been used: 1. Global Histogram Equalization(GHE). 2. Brightness Preserving Bi-Histogram Equalization(BBHE). 3. Equal Area Dualistic Sub Image Histogram Equalization (DSIHE). 4. Recursive Mean Separate Histogram Equalization (RMSHE). 15
  • 19. Mathematical formulation of GHE Let, X = {X(i, j)} is a given image composed in L(for 8-bi image L = 256) discrete gray levels denoted as X0, X1, ..., XL−1 • Calculate the probability density function. p(Xk) = nk n , fork = 0, 1, ..., L − 1 (6) • Calculate cumulative distribution function by c(xk) = k j=0 p(Xj ), for k = 0, 1, ..., L − 1 (7) • On the basis of CDF, Define transformation function f (x) as f (Xk) = X0 + (XL−1 − X0)c(xk) (8) • Using the transformation function, calculate new intensity values 16
  • 20. Global Histogram Equalization(GHE) Figure 3: Histogram before and after HE or equivalently, RMSHE, r = 0. 17
  • 21. An example of GHE Figure 4: Contrast enhancement based on global histogram equalization. 18
  • 22. Brightness Preserving Bi-Histogram Equalization(BBHE) • Partitions Histogram in two sub-histograms and equalize them independently. • Proposed to minimize mean intensity change. • Ultimate goal is to preserve brightness and enhance contrast. • Image parameters such as mean gray-scale level used for partitioning. 19
  • 23. Equal Area Dualistic Sub Image Histogram Equalization (DSIHE). This method is also known as Dualistic Sub Image Histogram Equalization(DSIHE). • Image parameters such as median grayscale level used for partitioning. • The input image is decomposed into two sub-images, being one dark and one bright. • Then applies Histogram Equalization on two sub-images. 20
  • 24. Mathematical Formulation for BBHE and DSIHE • Input image X(i, j) with gray levels 0 to 255. • Image X(i, j) is segmented by a section with gray level of Xm • Xm (mean in case of BBHE and median in case of DSIHE) • The image is decomposed into two sub images XL and XU. • X = XL ∪ XU where XL = {X(i, j)|X(i, j) ≤ Xm, ∀X(i, j) ∈ X} and XU = {X(i, j)|X(i, j) > Xm, ∀X(i, j) ∈ X} 21
  • 25. Mathematical Formulation for BBHE and DSIHE • XL is composed by gray level of {l0, l1, ..., lm}, XU is composed by gray level of {lm+1, lm+2, ..., lL−1} • Respective probability density functions of the sub-images are: pL(Xk) = nk L nL , for k = 0, 1, ..., m and pU(Xk) = nk U nU , for k = m + 1, m + 2, ..., L − 1 22
  • 26. Mathematical Formulation for BBHE and DSIHE • nk L and nk U are the numbers of Xk • nL = m k=0 nk L , nU = L−1 k=m+1 nk U • The respective cumulative density function for XL and XU are : cL(x) = k j=0 pL(Xj ) and cU(x) = L−1 j=m+1 pU(Xj ) • Transformation function defined for exploiting the cumulative density functions: fL(x) = X0 + (Xm − X0)cL(x) and fU(x) = Xm+1 + (XL−1 − Xm+1)cU(x) 23
  • 27. Mathematical Formulation for BBHE and DSIHE • Based on these transform functions, the decomposed sub-image are equalized independently. • The composition of resulting equalized sub-images constitutes the output of BBHE or DSIHE as Y = {Y (i, j)} = fL(XL) ∪ fU(XU) where fL(XL) = {fL(X(i, j)|∀X(i, j) ∈ XL)} and fU(XU) = {fU(X(i, j)|∀X(i, j) ∈ XU)} 24
  • 28. Algorithm for BBHE • Obtain the original image. • Get histogram of the original image. • Calculate mean of the histogram. • Divide the histogram on the basis of the mean in two parts. • Equalize each part independently using PDF and CDF. • Combine both sub-images for the processed image 25
  • 29. Algorithm for BBHE Figure 5: Histogram before and after BBHE or equivalently, RMSHE, r = 1. 26
  • 30. An example of BBHE Figure 6: Contrast enhancement based on brightness preserving bi-histogram equalization. 27
  • 31. Algorithm for DSIHE • Obtain the original image. • Get histogram of the original image. • Calculate median of the histogram. • Divide the histogram on the basis of the median in two parts. • Equalize each part independently using PDF and CDF. • Combine both sub-images for the processed image 28
  • 32. An example of DSIHE Figure 7: Contrast enhancement based on dualistic sub-image histogram equalization. 29
  • 33. Recursive Mean Separate Histogram Equalization (RMSHE) • Generalization of HE and BBHE in term of brightness preservation • Recursively separating the input histogram based on the mean 30
  • 34. Recursive Mean Separate Histogram Equalization (RMSHE) Figure 8: Recursive mean separated histogram equalization with recursion level r=2 31
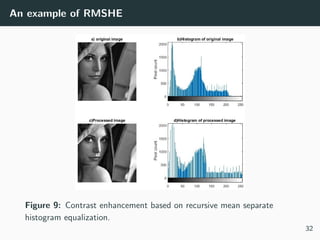
  • 35. An example of RMSHE Figure 9: Contrast enhancement based on recursive mean separate histogram equalization. 32
  • 37. Results and discussion Quality assessment The following measurement are used to make comparison among the histogram equalization techniques • Mean squared error (MSE) is the average of squared intensity differences distorted and reference image pixels. Lower value of MSE means that the image is of good quality. • Peak signal to noise ratio(PSNR) is the ratio between the maximum possible power of a signal and the power of corrupting noise that affects the fidelity of its representation. It varies between 25 to 40 dB. Higher value of PSNR is good • Structural similarity index(SSIM) varies between 0 to 1. The value 1 means, the image is of best quality. 33
  • 38. Visual Assessment Global histogram equalization Figure 10: Contrast enhancement based on histogram equalization. 34
  • 39. Visual Assessment Brightness preserving bi-histogram equalization Figure 11: Contrast enhancement based on brightness preserving bi-histogram equalization. 35
  • 40. Visual Assessment Dualistic sub-image histogram equalization Figure 12: Contrast enhancement based on dualistic sub-image histogram equalization. 36
  • 41. Visual Assessment Recursive mean separate histogram equalization Figure 13: Contrast enhancement based on recursive mean separate histogram equalization. 37
  • 42. Experimental results Simulation results for ’Tungsten-filament’ and ’Barbara’ are presented in table 2 and 3. and Methods Mean SD SSIM MSE PSNR Tungsten filament 128.11 75.31 – – – GHE 127.71 73.5 0.79991 478.83 21.32 BBHE 150.5 69.05 0.80593 843.65 18.86 DSHE 140.43 72.94 0.79856 533.68 20.85 RMSHE 133.99 79.97 0.90909 139.46 26.68 Table 2: Comparison of various histogram equalization methods using objective image quality measures 38
  • 43. Methods Mean SD SSIM MSE PSNR Barbara 111.5 48.15 – – – GHE 127.48 73.88 0.875 969.18 18.26 BBHE 118.44 73.77 0.868 782.22 19.19 DSIHE 117.94 73.77 0.867 777.89 19.22 RMSHE 115.93 61.01 0.937 243.36 24.26 Table 3: Comparison of various histogram equalization methods using objective image quality measures 39
  • 45. Conclusion • The experimental results shows that RMSHE processed ’Tungsten-filament’ image has lowest MSE , highest PSNR and highest SSIM among these four techniques. • Similar result shows for ’Barbara’ image. So, recursive mean separate histogram equalization(RMSHE) performs well according to this performance measure as well as visual assessment. 40
  • 49. Reference i Rafael C Gonzalez and Richard E Woods. Digital image processing prentice hall. Upper Saddle River, NJ , 2002a. Gregory A Baxes. Digital image processing: principles and applications . Yeong-Taeg Kim. Contrast enhancement using brightness preserving bi-histogram equalization. IEEE transactions on Consumer Electronics , 43(1):18, 1997. Yu Wang, Qian Chen, and Baeomin Zhang. Image enhancement based on equal area dualistic sub-image histogram equalization method. IEEE Transactions on Consumer Electronics , 45(1):6875, 1999.
  • 50. Reference ii Soong-Der Chen and Abd Rahman Ramli. Contrast enhancement using recursive mean-separate histogram equalization for scalable brightness preservation. IEEE Transactions on consumer Electronics , 49(4):13011309, 2003. Zhou Wang, Alan C Bovik, Hamid R Sheikh, and Eero P Simoncelli. Image quality assessment: from error visibility to structural similarity. IEEE transactions on image processing , 13(4):600612, 2004.