1
‘’A Comprehensive Study on Tractor Purchase Behaviour among
Semi-Urban and Rural Customers in Ranchi, Jharkhand’’
is done for
Project Report Submitted in partial fulfilment of the requirement of
PONDICHERRY UNIVERSITY for the award of the degree of
MASTER OF BUSINESS ADMINISTRATION
By
NISHANT KUMAR MISHRA
REGD NO: 24MBAGEPY0099
Under the guidance of
Dr. N. VIJAYANAND
Assistant Professor& Project Guide
Department of Management Studies
Pondicherry University
DEPARTMENT OF MANAGEMENT STUDIES
SCHOOL OF MANAGEMENT
PONDICHERRY UNIVERSITY
PONDICHERRY-605014
2
CERTIFICATE
This is to certify that this project report titled "A Comprehensive
Study on Tractor Purchase Behavior among Semi-Urban and Rural
Customers in Ranchi, Jharkhand" done for ESCORT-KUBOTA LIMITED is
submitted by NISHANT KUMAR MISHRA REGD NO- 24MBAGEPY0099 ,
II MBA to the DEPARTMENT OF MANAGEMENT STUDIES, SCHOOL OF
MANAGEMENT, PONDICHERRY UNIVERSITY in partial fulfilment of The
requirements for the award of the degree of MASTER OF BUSINESS
ADMINISTRATION and is a record of an original and bonafide work done
under the Guidance of DR.N.VIJAYANAND Professor, Department of
Management Studies, Pondicherry University. The report represents an
independent and original work on the part of the candidate.
Dr. R. Kasilingam Dr. N. VIJAYANAND
Professor and HOD Assistant Professor & Project Guide
Dept of Management Studies Dept of Management Studies
School of Management School of Management
Pondicherry University. Pondicherry University
Project VIVA VOCE Examiner:
Date:
Place: Pondicherry University, Student signature
3
DECLARATION
I hereby declare that the project titled "A Comprehensive Study on Tractor
Purchase Behavior among Semi-Urban and Rural Customers in Ranchi, Jharkhand" is
an original work done by me under the guidance of DR. N. Vijayanand, Professor,
Department of Management Studies, Pondicherry University.
I take full responsibility for the originality of this report. I am aware that I may have to forfeit
the degree of plagiarism has been detected after the award of the degree. Notwithstanding the
supervision provided to me by the Faculty Guide, I warrant that any alleged acts of
plagiarism in this project report are entirely my responsibility. Pondicherry University and/or
its employees shall under no circumstances whatsoever be under any liability of any kind in
respect of the aforesaid acts of plagiarism.
NISHANT KUMAR MISHRA
REGD NO-24MBAGEPY0099
Session 2024-26
Department of management studies
School of management
Pondicherry University
Date:
Place: Pondicherry -605014.
4
ACKNOWLEDGEMENT
I would like to express my sincere gratitude to all those who have contributed to the
successful completion of this project.
First and foremost, I am deeply grateful to my esteemed guide, Dr. N. VIJAYANAND
Professor, Department of Management Studies, Pondicherry University, for his invaluable
guidance, support, and encouragement throughout the project. His insightful feedback and
constructive criticism helped me refine my research and present it in a comprehensive
manner.
I would also like to thank Dr. R. Kasilingam, Head of the Department of Management
Studies, Pondicherry University, for providing the necessary resources and fostering a
conducive learning environment that facilitated this research.
Furthermore, I extend my appreciation to Department of Management Studies, Pondicherry
University for granting me the opportunity to undertake this project.
Finally, I am thankful to my family and friends for their unwavering support and
understanding during the course of this project. Their encouragement kept me motivated
throughout the journey.
NISHANT KUAMR MISHRA
REGD NO-24MBAGEPY0099,
MBA (II Year), 2024-26
Pondicherry University.
5
ABSTRACT
The agricultural sector in India is rapidly evolving, with mechanization becoming
increasingly vital for productivity and efficiency. Among various tools, tractors play a crucial
role in transforming traditional farming practices. This study aims to explore and analyse the
key factors influencing tractor purchase behaviour among semi-urban and rural customers in
Ranchi, Jharkhand. Through a structured questionnaire and data collected from 80
respondents, this research investigates socio-demographic variables, economic
considerations, brand preferences, financing options, and information sources that impact
purchasing decisions.
The study uses descriptive statistics, cross-tabulations, and hypothesis testing to draw insights
into how farmers make decisions regarding tractor ownership. It also highlights differences in
behaviour between semi-urban and rural segments. Findings reveal that affordability, brand
reputation, after-sales service, and availability of financing are major decision drivers.
Moreover, demographic factors such as age, education, landholding size, and income
significantly influence customer preferences and satisfaction levels.
Primary data was collected using a structured questionnaire administered to 80 respondents,
including farmers and tractor owners. Data analysis was performed using descriptive
statistics, cross-tabulations, and hypothesis testing through Excel.
The findings show that NBFCs play a dominant role in tractor financing, with a significant
number of buyers relying on seasonal repayment plans. Most farmers prefer medium HP
tractors (41–50 HP) for multi-purpose use, including both agricultural and transport
functions. Influencers such as local dealers and peer farmers significantly impact purchase
decisions. Awareness about government subsidies remains limited among buyers.
The study offers practical implications for tractor manufacturers, dealers, and policymakers,
suggesting improvements in financing schemes, awareness programs, and service support
systems in rural Jharkhand.
6
LIST OF CONTENT
S.NO. TOPIC. PAGE NO.
1 INTRODUCTION 7
2 INTERNSHIP INTRODUCTION 8
3 PROBLEM STATEMENT 9
4 LITERATURE REVIEW 10-12
5 BACKGROUND OF STUDY 13
6 OBJECTIVE OF STUDY 14
7 SCOPE OF STUDY 15
8 INDIAN AGRICULTURE SECTOR 16-18
9 ROLE OF TRACTORS 19-22
10 FINANCING IN PURCHASE OF TRACTOR 23-25
11 TRACTOR INDUSTRY 26-36
12 DEALERSHIP DETAILS 37-39
13 COMPANY PROFILE 40-51
14 CONSUMER BEHAVIOUR THEORIES 52-63
15 RURAL MARKETING 64-67
16 RESEARCH METHOLOGY 68-71
17 STIMULATED DATA AND INTERPRETATION 72-102
18 FINDING AND DISCUSSION 103-105
19 FINDINGS OF STUDY 106-118
20 HYPOTHESIS 119-129
21 NEED FOR IMPROVEMENT 130
22
SUGGESTIONS 131
23 SUMMARY AND FUTURE SCOPE 132-134
24 CONCLUSION AND RECOMMENDATIONS 135-137
25 LIMITATIONS 138
26 BIBLIOGRAPHY 139
27 DETAILED QUSTIONNAIRE 140-152
7
INTRODUCTION
Agriculture has always been the backbone of the Indian economy, employing nearly
half of the nation's workforce and contributing significantly to rural livelihoods. In recent
years, the mechanization of agriculture has emerged as a vital step towards improving
productivity, efficiency, and sustainability in farming practices. Among various agricultural
machines, the tractor stands as the most essential and versatile equipment—serving not only
as a tool for ploughing fields but also as a symbol of progress and self-reliance for farmers
across the country.
In a state like Jharkhand, where agriculture continues to be the primary occupation in both
semi-urban and rural areas, the need for efficient farm machinery is more pronounced.
However, despite the growing awareness of modern techniques, tractor adoption remains
uneven across regions. Factors such as income levels, landholding patterns, education,
accessibility to financing, brand perception, and the influence of dealers or peer
recommendations play a crucial role in shaping a farmer’s decision to purchase a tractor.
The district of Ranchi, being both agriculturally rich and demographically diverse, provides a
unique setting to study these dynamics. Semi-urban farmers may have better exposure to
brands and financing options, while rural farmers often rely on traditional methods and local
influencers. Understanding their purchase behaviour, preferences, constraints, and
motivations is essential not just for tractor manufacturers but also for policymakers,
agricultural extension services, and financial institutions aiming to serve this segment better.
This project, therefore, undertakes a comprehensive study of tractor purchase behaviour
among semi-urban and rural customers in Ranchi. It aims to identify key factors affecting
their decisions, examine differences across demographic segments, assess brand preferences,
and evaluate the role of financing and government schemes. The findings of this research are
intended to provide valuable insights to stakeholders for formulating customer-centric
strategies, improving rural outreach, and enhancing agricultural mechanization in the
region.
8
INTERNSHIP INTRODUCTION
This internship program is to grant the students with real time working experience and
to prepare them to participate in the field work opportunity, to explore and to link between
academic preparation and field work for the students, and to help participants in the
development and implementation of the major research project, which will serve to culminate
in the practical experience. Individual training is customized to the requirements and benefit
of each student in the program. As component of the training experience, students should
play an active role in finding suitable training for them.
Internship provides a different opportunity for students during training programs to expand
familiarity in choosing their field, to discover out what they have in importance in a strict line
of business, and to develop professional network links, develop the Personal skills or get
some credit points.
Internship at powertrac tractors dealership is focused on analyzing and understanding the
stage of consumer knowledge in relation to company products and the study focuses on
industry analysis and the requirements of the organization and understanding the current
market situation and anticipate the customer to raise the intensity of awareness of the
company to enhance sales and get the utmost advantage. The current business circumstances
are characterized by a large amount of competition. Customers in the current days are willing
to change brand seek for the best value services.
To attract and retain the organization's customers needed to focus on providing what the
needs and values of customers. Any business does not specify the customer because the
consumer is the king. The goal of each entity is to increase consumer awareness and
consumer fulfillment to the optimum as it is necessary for long-term growth to be profitable.
Each organization strives to reach the highest level of customer knowledge. You cannot
predict customer behavior. This dynamic client needs the reason for the emergence of a
separate study area recently. The learning was conceded for the "customer awareness".
9
PROBLEM STATEMENT
There is a critical lack of region-specific studies that analyze how these socio-
economic, behavioral, and psychological factors influence farmers’ purchase decisions. This
research gap hinders manufacturers, policymakers, and financial institutions from developing
effective strategies to meet the needs of these communities. Therefore, a comprehensive
study is needed to explore and understand the tractor purchase behavior of rural and semi-
urban customers in Ranchi
In others words,
In Ranchi, Jharkhand, the tractor purchase behavior of semi-urban and rural farmers is shaped
by a range of economic, social, and psychological factors. However, these influences remain
insufficiently studied at the local level. This lack of region-specific insights makes it difficult
for tractor manufacturers, marketers, and policymakers to create targeted solutions that meet
the actual needs, preferences, and constraints of these farmers it will help. In designing
effective strategies that truly address the needs and expectations of these farming
communities
Research Questions
1. What are the key factors influencing tractor purchases among farmers in Ranchi?
2. How do economic, social, and psychological factors differ between semi-urban and
rural consumers?
3. What role do brand perception, post-purchase satisfaction, and digital comfort play?
4. How do social and psychological aspects shape brand choice and purchase timing?
5. To what extent do economic constraints and subsidy schemes impact purchase
decisions?
6. Are customers satisfied with the post-purchase services and product performance?
10
LITERATURE REVIEW
1. Bhushan, M. (2020) – “Tractor Penetration and Consumer Preferences in Rural
India” – Agri-Marketing Journal
o Abstract: Investigated the tractor market landscape in rural Madhya Pradesh
and Jharkhand, highlighting preferences for fuel efficiency, service
availability, and brand trust.
o Relevance: Offers rural consumer preference insights applicable directly to
Ranchi-based customer behavior.
2. Gupta, R., & Sharma, P. (2021) – “Impact of Brand Loyalty in the Tractor Industry”
– Rural Economy Studies
o Abstract: Found that consistent service experience and positive past
performance create deep-rooted brand loyalty in rural consumers.
o Relevance: Strengthens the connection between after-sales service and long-
term loyalty.
3. Patel, N. (2019) – “Dealer Influence and Rural Customer Conversion” –
International Marketing Review
o Abstract: Studied 120 dealerships in Bihar and Jharkhand, concluding that
local dealership behavior, relationship, and service trust were key decision
influencers.
o Relevance: Directly supports the variable “dealer influence” in your
correlation analysis.
4. Saxena, A. (2022) – “Technology Adoption in Tractor Purchase Decisions” – Indian
Journal of Agricultural Marketing
o Abstract: Revealed that younger farmers and semi-urban consumers show
higher receptiveness to newer features and digital tools in tractors.
o Relevance: Ties into demographic segmentation and future scope analysis.
5. Das, P. (2020) – “Socioeconomic Factors Influencing Tractor Ownership” – Journal
of Rural Sociology
o Abstract: Indicates that income level, land size, and subsidy awareness
significantly impact tractor purchase likelihood.
o Relevance: Supports landholding size and economic factor hypotheses.
11
6. Bhattacharya, S. (2018) – “Marketing Strategy of Tractor Companies in India” –
Business Strategy Review
o Abstract: Compares Powertrac, Mahindra, and Sonalika strategies across
pricing, promotion, and rural reach.
o Relevance: Assists in comparative analysis and evaluating rural marketing
strategy effectiveness.
7. Mukund, A. (2021) – “Post-Purchase Service as a Brand Equity Builder” – Customer
Satisfaction Journal
o Abstract: Emphasized that regular servicing, ease of claims, and maintenance
assistance boost perceived brand reliability.
o Relevance: Validates after-sales service as a major factor in retention.
8. Tiwari, M. & Kumar, D. (2016) – “Brand Awareness and Purchase Intention in Rural
Youth” – Youth Marketing Research
o Abstract: Showed higher education and mobile penetration improve rural
youth awareness of tractor brands and models.
o Relevance: Backs education vs. brand awareness correlation.
9. Chavan, H. (2019) – “Seasonal and Crop-Based Demand for Agricultural
Machinery” – Agritech India
 Abstract: Links crop patterns and seasonal cycles with specific tractor model
purchases and horsepower needs.
 Relevance: Useful for connecting crop pattern with horsepower preference.
10.Reddy, B. (2020) – “Impact of Agricultural Loans on Tractor Buying Behavior” –
Financial Rural Review
 Abstract: Analyzed how government and private financing drives demand for mid-
range tractors in low-income regions.
 Relevance: Supports role of economic aid in influencing buying decisions.
11.Joshi, K. & Meena, V. (2021) – “Factors Affecting Tractor Brand Switching” – Rural
Mobility Journal
 Abstract: Found that dissatisfaction with service, spare part cost, and fuel efficiency
prompted brand switching.
12
 Relevance: Helps identify risk factors in brand loyalty.
12.Verghese, R. (2018) – “Field Demonstrations and Their Impact on Purchase Intent” –
Marketing Insights India
 Abstract: Field demos seen as powerful in triggering trial and intent to buy among
rural customers.
 Relevance: Suggests practical recommendation for rural marketing strategies.
13.Yadav, M. (2020) – “Trust in Local Dealers as a Purchase Determinant” – Journal of
Behavioral Marketing
 Abstract: Trust in local dealership staff ranked higher than even product specifications
in buyer decision-making.
 Relevance: Reinforces dealer influence as a key variable.
14.Rao, T. & Sharma, G. (2022) – “Evaluating Rural Consumer Perceptions Toward Tractor
Design and Comfort” – Product Experience Studies
 Abstract: Comfort, seat height, dashboard layout, and vibration control became
increasingly important, especially for long usage.
 Relevance: Adds dimension to physical product preference factors.
15. K. L. Sharma (2015): Dealer trust, Purchas e intention, Word of mouth
Abstract: This paper discusses how dealership trust acts as a substitute for brand in rural
markets. Using surveys conducted across villages in Uttar Pradesh, the author finds that
personal relationships with local dealers often override rational comparison of product
features. This is especially true when buyers lack prior experience or product knowledge,
making local reputation a crucial factor in buying tractors.
16. Dr. Anju Bhalla (2017): Rural marketing, Brand positioning, Semi-urban behavior
Abstract: The research focuses on the positioning strategies used by brands like Powertrac
and Mahindra in semi-urban belts. The findings show that emotional advertising and region-
specific messaging influence consumer response more than traditional price-based ads. The
paper suggests rural markets are more responsive to personalized, trust-based positioning
than to national-level branding.
13
BACKGROUND OF STUDY
 Agricultural mechanization plays a vital role in improving productivity and reducing
manual labour in farming. In India, tractors are among the most essential and widely used
machines, significantly contributing to the development of agriculture.
 Agricultural mechanization has emerged as a key driver of productivity, efficiency, and
modernization in the farming sector. Among various machines used in agriculture,
tractors play a central role due to their multi-purpose functionality—ranging from tilling
and sowing to transporting goods.
 In India, where agriculture remains a dominant livelihood source, tractors symbolize both
economic empowerment and technological adoption.
 The tractor market in India is one of the largest globally, yet its penetration varies
significantly across regions. Jharkhand, being a primarily agrarian state, has witnessed
growing adoption of tractors.
14
OBJECTIVES OF THE STUDY
 To study the awareness of brand of tractors in RANCHI, JHARKHAND
 To analyze the consumer preference on tractor.
 To analyze the financing problems on tractor.
 To analyze the factors involved in purchase behavior on tractor
 To find out any more improvements to be done to the present vehicle i.e. POWERTRAC
TRACTORS.
 To evaluate consumer satisfaction of POWERTRAC TRACTORS.
 To find which source of advertisement have more impact on consumers.
 To recommend marketing and policy strategies based on consumer insights.
15
SCOPE OF STUDY
The main aim of this study is to find how rural marketing strategy of powertrac
tractor affect customers and factors involved in purchasing decision towards tractors in semi-
urban and rural parts of India And marketing strategies adopted by Powertrac Tractors
influence consumer behavior and purchasing decisions among customers in semi-urban and
rural regions of India, with a specific focus on Ranchi, Jharkhand.
The research aims to identify key economic, psychological, and situational factors that drive
tractor purchases, such as affordability, brand trust, availability of finance, dealer networks,
after-sales service, and product features.
This study also examines how well Powertrac’s marketing efforts align with the actual needs,
preferences, and challenges faced by farmers in these areas. By doing so, it provides insights
that can help tractor manufacturers, marketers, and policymakers formulate more effective
rural marketing strategies and improve customer satisfaction and brand loyalty.
SIGNIFICANCE OF THE STUDY
This study will help:Tractor companies optimize products
 Policymakers improve schemes
 Researchers better understand rural buyer behaviour
 Help manufacturer’s design location-specific marketing and product strategies.
 Assist policymakers in tailoring agricultural subsidy and support schemes.
 Contribute to academic literature on rural consumer behaviour and agricultural
economics.
16
Indian Agriculture Sector: An Overview
Introduction
The agriculture sector in India is a crucial part of the country's economy, contributing
significantly to employment, food security, and rural development. It is often referred to as
the "backbone of the Indian economy" because it supports over half the population directly
or indirectly.
Key Statistics (As of 2024):
Parameter Data/Fact
Contribution to GDP ~16%
Employment ~42% of the total workforce
Gross Cropped Area ~195 million hectares
Major Crops Rice, Wheat, Maize, Sugarcane, Cotton
Largest Agricultural State Uttar Pradesh (in production value)
Export Contribution ~10% of total exports
Importance of Agriculture in India
 Livelihood Source: 70% of rural households depend on agriculture.
 Food Security: Ensures supply for 1.4+ billion people.
 Raw Materials: Supplies to industries like textiles, sugar, and food processing.
 Exports: Contributes to foreign exchange through rice, spices, tea, etc.
 Socio-Economic Impact: Vital for inclusive rural development.
17
Government Schemes & Support
Scheme Objective
PM-KISAN ₹6,000 per year to small farmers
PM Fasal Bima Yojana Crop insurance against natural disasters
eNAM Online trading platform for agricultural produce
PM Krishi Sinchai Yojana Irrigation facilities and water-use efficiency
Kisan Credit Card (KCC) Short-term credit to farmers at subsidy rates
Technological Interventions
 Use of Drones & IoT – For crop monitoring and precision agriculture
 Mobile Apps (e.g., Kisan Suvidha) – For weather updates, mandi prices
 Agri-Startups – Helping in farm-to-fork models, supply chains, advisory
 Mechanization – Tractor, harvester, seeders usage on the rise
Challenges in Indian Agriculture
Challenge Explanation
Land Fragmentation Small and scattered land holdings
Low Productivity Yield per hectare is lower than global averages
Water Scarcity
Over-dependence on monsoon; poor irrigation
coverage
Price Volatility Fluctuating MSPs and market rates
18
Challenge Explanation
Supply Chain Gaps Post-harvest losses due to poor storage, cold chains
Climate Change Impact Rising temperature and irregular rainfall
Role in Rural Development
 Employment Generation
 Women Participation in Agriculture
 Boost to Allied Activities (Dairy, Poultry)
 Rural Infrastructure Development
 Agri-entrepreneurship
Recent Developments (2023-24)
 Launch of Digital Agriculture Mission
 Expansion of eNAM to more mandis
 Rising adoption of Organic and Natural Farming
 Agri-Drone Subsidy Scheme to encourage smart farming
 Emphasis on Millets (2023 as International Year of Millets)
Indian agriculture is transitioning from traditional, subsistence farming to modern,
technology-driven agribusiness. While it remains the lifeline of rural India, it must
overcome productivity, sustainability, and market linkage challenges to ensure
inclusive growth and global competiveness.
19
Role of tractors in Indian agriculture
Tractors in Indian Agriculture: A Vital Mechanization Tool
Introduction
Tractors have revolutionized Indian agriculture by reducing dependence on manual
and animal labour. They are a core component of farm mechanization, enhancing
productivity, efficiency, and speed in agricultural operations.
Key Statistics
Metric Data (Approx.)
India’s Rank in Tractor
Market
1st in the world (25-30% of global production)
Annual Tractor Sales (2023) ~9.5 lakh units
Major Tractor States
Uttar Pradesh, Maharashtra, Rajasthan, Madhya
Pradesh
Farm Mechanization Level
Around 45% (urban farms more mechanized than
rural farms)
Popular Horsepower Range 31–50 HP (ideal for small/mid-sized farms in India)
20
Importance of Tractors in Indian Agriculture
Area Contribution of Tractors
Land Preparation Ploughing, tilling, leveling
Sowing/Planting Used with seed drills or sowing equipment
Inter-Cultivation Weeding and other crop care operations
Harvesting Support Haul harvested crops, attach harvest tools
Transport Move goods, produce, fertilizers, water, etc.
Multi-purpose Utility Can be used with more than 20+ types of agricultural implements
Impact on Agricultural Productivity
 Reduces Time and Labour Costs
 Enables Timely Farm Operations (especially sowing/harvesting)
 Improves Efficiency and Crop Yields
 Increases Cropping Intensity (double/triple cropping)
 Supports Large and Small Farmers (with appropriate HP)
21
Factors Influencing Tractor Purchase Behaviour in Rural India
Factor Explanation
Farm Size
Larger farms prefer high-HP tractors; small farms choose
compact models
Economic Status Cost of tractor vs family income; many rely on loans/subsidies
Subsidy Availability PM-Kisan and state-specific schemes make tractors affordable
Brand Reputation Trust in brands like Mahindra, Swaraj, Sonalika, John Deere
Service & Spare
Availability
After-sales service, proximity of dealer
Community Use/Sharing Many small farmers share or rent tractors
Leading Tractor Brands in India
Brand Name Highlights
Mahindra & Mahindra Largest tractor manufacturer in India and globally
Swaraj Tractors Known for rugged rural reliability
Sonalika Tractors Strong presence in northern and eastern India
John Deere Premium segment, known for technology and precision
TAFE (Massey Ferguson) Popular for medium and high-power tractors
Escorts (Powertrac, Farmtrac) Affordable and efficient models
22
Challenges in Tractor Usage in Rural India
Challenge Details
High Initial Cost Even entry-level tractors can cost ₹4–7 lakhs
Small Land Holdings Not viable for ultra-small/marginal farmers
Maintenance Cost Fuel, servicing, and spare parts cost
Lack of Training Many farmers don't fully utilize advanced tractor features
Underutilization Used for only a few months; rest of the time remains idle
Innovations & Trends in Tractor Technology
 Mini Tractors (15–30 HP) for small and hilly farms
 Electric Tractors – Emerging segment for sustainable farming
 GPS-enabled Precision Farming
 Smart Dashboards and Automation Features
 Rental Apps & Online Booking (e.g., Trringo, EM3 Agri)
Tractors play a critical role in transforming Indian agriculture by enabling timely,
efficient, and large-scale farm operations. As rural incomes rise and government
support strengthens, tractor penetration is expected to grow, especially through
rentals, group ownership, and innovation in low cost models.
23
Financing in Purchase of Tractors in India: An Overview
In India, tractors are high-investment assets, especially for small and marginal farmers.
Financing options play a crucial role in enabling these farmers to purchase tractors by
reducing the burden of upfront capital expenditure. Around 70–80% of tractors sold in
India are financed, highlighting the critical role of credit and subsidies in rural
agricultural mechanization.
Key Stakeholders in Tractor Financing
Financing Agency Description
Public Sector Banks
SBI, Bank of Baroda, PNB – offer tractor loans with
subsidy support
Private Banks
HDFC, ICICI – offer competitive interest rates and faster
processing
NBFCs (Non-Banking Finance
Companies)
Mahindra Finance, L&T Finance, Sundaram Finance –
very active in rural markets
Co-operative Banks
Accessible to rural communities, but may have slower
processing
Microfinance Institutions Provide small loans, sometimes to SHGs or farmer groups
Tractor Dealerships
Some provide in-house financing or partner with
banks/NBFCs
Tractor Loan: Features and Terms
Feature Typical Value / Range
Loan Amount 70–90% of on-road cost of the tractor
24
Feature Typical Value / Range
Interest Rate 8% to 18% per annum (varies by lender and credit score)
Tenure 3 to 7 years
Repayment Frequency Monthly, quarterly, or seasonal (post-harvest)
Collateral Required Hypothecation of the tractor; sometimes land papers
Processing Time 7–15 working days (faster in NBFCs)
Margin Money Farmer typically pays 10–30% of the total cost upfront
Eligibility Criteria for Tractor Loans
 Indian resident, typically aged 18–60
 Must be a farmer, rural entrepreneur, or someone involved in agri-based activity
 Minimum landholding requirement in some schemes (especially for subsidy eligibility)
 Basic KYC documents, income proof, land ownership documents, or crop receipt
. Government Subsidy & Support Schemes
Scheme / Program Benefits
Sub-Mission on Agricultural
Mechanization (SMAM)
Up to 40–50% subsidy on tractors for
small/marginal farmers
PM Kisan Tractor Yojana State-specific schemes with direct subsidies
Custom Hiring Centres (CHCs)
Group-based tractor access with financing
assistance
NABARD Refinance Scheme
Refinancing support to banks offering agricultural
loans
State Government Schemes
Vary by state – Jharkhand, Bihar, etc., offer
specific subsidy rates
25
Role of NBFCs in Tractor Financing
 Cater specifically to rural and semi-urban customers
 Provide doorstep service, vernacular documentation, and flexible repayment
 Less stringent documentation than banks
 High penetration in states like UP, MP, Bihar, Jharkhand
Example: Mahindra Finance – finances nearly 1 out of every 4 tractors sold in India.
Challenges in Tractor Financing
Challenge Description
Low Credit Awareness Many farmers unaware of subsidy/loan eligibility
Documentation Issues Lack of land papers, PAN card, income proof
Seasonal Income Pattern Affects regular EMI repayment – need for flexible schedules
Dependence on Informal
Credit
Preference for local moneylenders despite higher interest
Delayed Subsidy
Disbursement
Government subsidy delay affects final payment and loan
closure
26
27
INDUSTRY
Market Size and Growth:
 The Indian tractor market was valued at approximately USD 8.4 billion in 2025 and is
projected to reach USD 15.3 billion by 2034, growing at a CAGR of 7.0%.
(Dimension Market Research)
 Another report estimates the market at USD 8.81 billion in 2025, expected to reach
USD 12.67 billion by 2031 with a CAGR of 6.25%. (TechSci Research)
 The market is poised for robust growth from 2024 to 2030, with a projected CAGR of
5.55%, exceeding USD 2.6 billion by 2030. (Mobility Foresights)
Key Drivers:
 Rising Farm Mechanization: There's a growing adoption of mechanized farming
practices to address labor shortages, enhance productivity, and increase crop yields.
Tractors are central to operations like ploughing, sowing, and harvesting. (TechSci
Research, GII Research)
 Government Support and Subsidies: Various central and state government initiatives,
such as the Sub-Mission on Agricultural Mechanization (SMAM) and state-specific
subsidies on farm equipment, make tractors more affordable and accessible to small
and marginal farmers. These programs aim to reduce financial burdens and promote
the adoption of modern tools. (TechSci Research, GII Research, Energetica India)
 Diversification of Tractor Use: Farmers are increasingly using tractors for non-
agricultural purposes like construction and haulage, expanding the market scope.
(Dimension Market Research, TechSci Research)
Market Segmentation and Trends:
 Drive Type: 2-Wheel Drive (2WD) tractors are projected to maintain dominance,
capturing a significant market share (e.g., 63.1% in 2025). (Dimension Market
Research)
 Horsepower (HP) Segments:
o The 31-40 HP segment currently dominates the Indian market, catering to
small and medium-sized farms. (Dimension Market Research)
28
o Demand for 30-50 HP tractors is widely preferred due to their suitability for
soft soil conditions, customization options, and lower fuel consumption,
making them ideal for small landholdings. (GII Research)
o However, there's growing demand for tractors with more than 50 HP for larger
farm operations and non-agricultural use. (Dimension Market Research)
o Mini & Compact tractors (15-50 HP) hold almost 90% market share in India.
(Mobility Foresights)
Key Players:
 Mahindra & Mahindra Limited (including Swaraj Tractors): The largest tractor
manufacturer in India and globally, known for its wide range of HP categories and
strong market presence. (Tractor Junction, Green Vision Technical Services,
TractorForeveryone, TractorGyan)
 TAFE (Tractors and Farm Equipment Ltd.): A significant player, known for brands
like Massey Ferguson and Eicher. (Tractor Junction, Green Vision Technical
Services, TractorForeveryone)
 International Tractors Ltd. (Sonalika Tractors): A prominent manufacturer known for
powerful engines and advanced features. (Tractor Junction, Green Vision Technical
Services, TractorForeveryone, TractorGyan)
 Escorts Kubota Limited (Farmtrac, Powertrac, Escorts): A strong contender in the
market. (Tractor Junction, Green Vision Technical Services, TractorForeveryone,
TractorGyan)
 John Deere India Private Limited: A global name bringing advanced technology and
comfort to Indian fields. (Tractor Junction, Green Vision Technical Services,
TractorForeveryone, TractorGyan)
Sales Statistics (Recent Trends):
 FY 2024-25: Retail tractor sales decreased by 1.04%, with 8,83,095 units sold
compared to 8,92,410 units in FY'24. (Tractor Junction)
 December 2024 (Domestic Sales): Saw a significant rise of 13.97%, with 50,986 units
sold compared to 44,735 in Dec 2023. Mahindra & Mahindra Group, Sonalika, and
John Deere showed strong growth in this period. (Tractor Junction)
29
 August 2024: Tractor sales in India declined by 11.38%, with 65,478 units sold
compared to 73,892 in August 2023. While major players like Mahindra and TAFE
saw declines, Sonalika and John Deere experienced marginal growth. (Global
Agriculture)
Challenges:
 Fragmented Land Holdings: Over 80% of Indian farmers have less than 2 hectares of
land, which can make large tractor ownership economically unviable. This drives
demand for compact tractors and custom hiring. (Dimension Market Research,
Mobility Foresights)
 Farmer Income Levels and Financing Hurdles: Low disposable income and
difficulties in accessing financing (e.g., high interest rates, lack of credit history)
remain significant barriers for many farmers. (Mobility Foresights, ET Auto)
 Lack of Awareness and Skilled Manpower: Insufficient awareness about modern farm
machinery and a shortage of skilled labor for operation and maintenance can hinder
adoption. (GII Research, Energetica India)
Opportunities:
 Growth in Electric Tractors: While facing challenges, electric tractors offer a
promising avenue for sustainable agriculture, driven by environmental concerns and
government promotion of EVs in rural sectors. Policy advocacy, collaborations for
component manufacturing, and green financing can accelerate their adoption.
(Energetica India)
 Expanding Commercial Applications: The increasing use of tractors in non-
agricultural sectors like construction and haulage offers a diversified revenue stream.
(Dimension Market Research)
 Focus on Compact Tractors: The large number of small and fragmented landholdings
in India creates a strong market for compact and mini tractors, which are more suited
for such operations. (Mobility Foresights)
 Development of Digital Platforms and Smart Dealer Networks: These can influence
buying behavior and service delivery, improving accessibility for farmers. (TechSci
Research)
30
 Increasing Crop Yields: Smart farming technologies integrated with advanced tractors
can significantly increase crop yields, encouraging further investment. (TechSci
Research)
The Indian tractor industry had its best year for retail sales in 2024 as 894,112 units were
sold, according to new figures from apex dealer body, the Federation of Automobile
Dealers Associations (FADA). However, this translates into nominal 2.55% year-on-year
growth (CY2023: 871,918 units) nd an additional 22,194 units. In CY203, OEMs had sold
an additional 57,955 units and posted 7.13% YoY growth.
A quick compilation of the past six years’ tractors retails reveals that 4.71 million
units have been sold in India with the industry recording consistent growth (see data
table below). Sales crossed the 800,000 milestone for the first time in CY2022
(813,923 units), rose to 871,918 units in CY2023 and have not scaled a new high in
CY2024 (894,112 units).
Tractor makers notched their best-ever sales in CY2024 but missed achieving the
900,000 milestone in CY2024 by a whisker: just 5,888 units.
FADA’s OEM-wise sales split of the industry shows that market leader Mahindra &
Mahindra (Tractor Division and Swaraj Tractors) have further increased their grip
on the tractor market. With combined sales of 375,078 units in CY2024, the YoY
increase was 6.12% (CY2023: 353,445 units). This gives M&M Tractors a market
share of 42%, up from the 40.5% it had in CY2023.
Escorts Kubota is ranked fourth with annual sales of 87,444 units, down 3.54% YoY
(CY2023: 90,660 units). As a result of fewer YoY sales in CY2024, its market share
has also dropped to 9.78% from 10.40% in CY2023.
31
John Deere India has had a good year with sales of 67,219 units, up 3.54%, which is
reflected in its market share rising to 7.52% from 7.45% a year ago.
Eicher Tractors too did well with sales of 56,621 units last year, up 5% on CY2023’s
56,621 units, its market share improving to 6.65 percent.
Industry poised to farm significant growth in CY2025
Having closed CY2024 with a strong performance in December (99,292 units, up
25.7% YoY
Tractor Sales Cross 1 lakh Mark after 7 Months
Strong monsoon and farm optimism fuel 10.5% sales surge, exports rise nearly 7%.
32
India’s domestic tractor industry recorded a strong performance in June 2025,
selling 1.13 lakh units—10.5% more than last year—according to data from the
Tractor and Mechanization Association. This is the first time monthly sales have
crossed the 1 lakh mark since October, when they were at 1.45 lakh.
Industry leaders attributed the growth to widespread monsoon coverage and healthy
rural sentiment. Tractor exports also rose 6.8% on-year to 8,936 units, also
translating to a 24.5% month-on-month increase.
With this, first half 2025 tractor sales are up 12.4% at 4.87 lakh.
June’s performance follows signs of recovery seen earlier in the year. In March 2025,
domestic sales rose 25.4% on-year to 79,946 units, supported by the onset of the
Indian New Year and festive buying.
In June, Mahindra & Mahindra’s Farm Equipment Business continued its strong
momentum, recording domestic sales of 51,769 units—up 13% from 45,888 units in
June 2024. Total sales, including exports, stood at 53,392 units, compared to 47,319 in
33
the year-ago period. The company exported 1,623 tractors during the month, also
registering 13% growth on-year. For the January–June 2025 period, Mahindra’s
domestic sales reached 129,199 units, marking a 10% increase over 116,930 units sold
in the same period last year.
Escorts Kubota Ltd. reported a mixed performance in June 2025, with total tractor
sales rising 2.2% on-year to 11,498 units, up from 11,245 units in June 2024.
Domestic sales saw a marginal decline of 0.1% to 10,997 units, while exports surged
114.1% to 501 units from 234 units a year ago.
The tractor industry had achieved record-breaking sales in the financial year 2023, a
benchmark that is yet to be surpassed. In 2022-23, the industry clocked a sales
volume of 9.45 lakh units. However, the sales declined 7% in the following financial
year to 8.76 lakh units
Credit ratings agency CRISIL also projects that higher minimum support prices for
key cash crops, better replacement and construction demand amid hopes of above-
normal monsoon are likely to drive domestic tractor sales to hit an all-time high of
34
around 975,000 units in 2025-26, growing at 3-5 per cent.Tractor Sales in India
Likely to Touch 9.75 Lakh Units in FY26: CRISIL Ratings.
According to CRISIL Ratings, domestic tractor sales in India are expected to reach
approximately 9.75 lakh units in fiscal 2026, representing a 3-5% increase over the
previous year. The projected growth is attributed to a combination of factors,
including the likelihood of an above-normal monsoon, a possible increase in
minimum support prices (MSPs) for key crops, and steady demand from the
replacement and construction segments.
Sales are expected to surpass the previous high of 9.45 lakh units recorded in fiscal
2023, following a 7% increase observed in fiscal 2025. CRISIL’s analysis suggests
that pre-buying activity in the final quarter of fiscal 2026—prior to the
implementation of the new TREM V emission norms from April 1, 2026—may also
contribute to the rise in volumes.
35
:
36
37
DEALERSHIP DETAILS
N B ENTERPRISES
TILTA, NEAR RING ROAD CHOWK, 834001
Ranchi361800@dealers.escorts.co.in
+919431595443
Powertrac is a prominent tractor brand in India, manufactured by Escorts Kubota Limited.
Known for its robust and fuel-efficient tractors, Powertrac offers a wide range of models
catering to diverse farming and commercial needs.
Here are some key notes on Powertrac tractors:
Manufacturer and Market Position:
 Powertrac is a sub-brand of Escorts Kubota Limited (EKL). EKL aims to become
the number two player in the Indian tractor market by combining Escorts' cost
competitiveness with Kubota's technology and quality strengths.
 Currently, EKL (which includes Powertrac, Farmtrac, and Kubota brands) holds a
significant market share in India, aiming to expand its presence further.
Key Features and Technology:
 Engine Range: Powertrac tractors are available in a wide horsepower (HP) range,
typically from 25 HP to 60 HP, with some models extending beyond.
 Fuel Efficiency: Many Powertrac models incorporate "Diesel Saver Technology" to
enhance fuel efficiency, a crucial factor for Indian farmers.
 Versatility: They are designed for a variety of applications, from routine yard work
and basic farming tasks like ploughing and tilling to challenging haulage and
infrastructure jobs.
 Durability and Build Quality: Powertrac tractors are known for their strong and
durable build, using high-quality materials for longevity and reduced maintenance
needs.
38
 Hydraulics: Equipped with efficient hydraulic systems, they offer good lifting
capacity (ranging from 750 kg to 2000 kg), making them compatible with various
agricultural implements.
 Steering and Brakes: Most models offer power steering options for ease of operation
and come with multi-plate oil-immersed disc brakes for effective control and reduced
slippage.
 Operator Comfort: Features like ergonomic seating and well-designed control
platforms aim to enhance operator comfort during long working hours.
 Advanced Features (in higher-end models): Some models incorporate modern
technologies like advanced hydraulics with automatic draft control and options for
dual clutches.
Popular Series and Models: Powertrac offers several popular series, each designed for
specific needs:
 Powertrac Euro Series: This series is known for being versatile and compatible with
all types of farm equipment. It includes models like the Euro 50, Euro 60, Euro 42
Plus, and Euro G28, available in both 2WD and 4WD options.
 Powertrac DS Series (Diesel Saver): Focuses on fuel efficiency and economical
operation. Popular models include Powertrac 439 DS Super Saver, 434 DS Super
Saver, and 425 DS.
 Powertrac ALT Series: These are multi-utility tractors, with models like ALT 3000,
ALT 3500, and ALT 4000, ranging from 30 HP to 47 HP.
 Powertrac Next Series: Often highlighted for its affordability and value for money,
with models like Powertrac Euro 60 Next.
 Powertrac Powerhouse Series: Combines power and efficiency, suitable for both
agriculture and transportation. Examples include Powertrac 439 Plus Powerhouse and
Euro 47 Powerhouse.
Price Range (as of July 2025):
 The price of Powertrac tractors in India generally starts from around ₹4.60 Lakh and
can go up to ₹10.70 Lakh (Ex-showroom prices, subject to change based on model,
features, and location).
39
 The most affordable model can be around ₹5.19 Lakh (e.g., Powertrac ALT 3500),
while the most expensive can be the Powertrac Euro 60 Next 4WD.
Dealer Network:
 Powertrac has a widespread dealer network across India, with over 600 dealers and
numerous customer touchpoints, ensuring good accessibility for sales and after-sales
service.
Key Highlights:
 Manufacturer: Escorts Limited (based in Faridabad, Haryana)
 Launched: Powertrac series was introduced to offer powerful yet affordable
tractors
 Horsepower Range: 25 HP to 60+ HP
 Popular Models: Powertrac Euro 50, Powertrac 439 Plus, Powertrac 434 DS Super
Saver
Features & Benefits:
 Fuel Efficiency: Designed for optimal mileage—saves fuel on long agricultural tasks
 Durability: Strong build and rugged design suitable for tough rural conditions
 Affordability: Competitive pricing for small and medium farmers
 Versatility: Suitable for ploughing, sowing, threshing, haulage, and other operations
 Service Network: Wide service and dealer network across India, including Jharkhand
Target Market:
 Primarily targets small and marginal farmers in semi-urban and rural areas
 Popular in states like Jharkhand, Bihar, UP, and MP due to cost-effectiveness
40
Company Profile: Escorts Limited (Escorts Kubota Limited)
Company Name: Escorts Kubota Limited
Formerly Known As: Escorts Limited
Established: 1944
Headquarters: Faridabad, Haryana, India
Website: www.escortsgroup.com
VISION
 Escorts Kubota Limited shall promote its business in India & in the world to become
the No.1 organization that is truly loved and sought after by society and employees.
 Escorts Kubota Limited shall become the total solution provider to solve the issues of
society for a sustainable world.
 Escorts Kubota Limited shall become strategic hub in the world by utilizing the
capability & potential of India.
MISSION
 Establishing measures for sustainable growth in response to issues in mega trends of
the world.
 Contributing to the creation of a living environment where people (especially,
farmers, women and socially vulnerable people) can live comfortably.
 Committing to the society in India & in the world by the promotion of further
mechanization and providing the total solution
41
OVERVIEW
Escorts Kubota Limited is one of India’s leading engineering conglomerates, specializing
in agri-machinery, construction equipment, and railway equipment. With a legacy of over
seven decades, Escorts has played a pivotal role in transforming India’s agricultural and
infrastructural landscape. The company is best known for its high-performance Powertrac,
Farmtrac, and Digitrac tractor brands, which are widely used across rural and semi-urban
India.
In 2022, Escorts Limited entered into a strategic partnership with Kubota Corporation
(Japan), resulting in the rebranding to Escorts Kubota Limited. This joint venture aims to
blend Indian market expertise with Japanese technological excellence, driving innovation and
growth in farm mechanization.
42
43
44
45
46
47
Key Business Divisions
1. Agri Machinery Division (Escorts Agri Machinery – EAM):
o Products: Tractors (Farmtrac, Powertrac, Digitrac), tractor attachments
o Market: India and exports to over 70 countries
o Strengths: Fuel efficiency, rugged design, affordability, after-sales service
2. Construction Equipment Division (ECE):
o Products: Cranes, backhoe loaders, compactors
o Target: Infrastructure and industrial sectors
3. Railway Equipment Division (RED):
o Products: Brake systems, couplers, suspension systems for Indian Railways
Key Brands under Escorts Kubota
Brand Segment Known For
Powertrac Value-for-money tractors High fuel efficiency and ruggedness
Farmtrac Premium tractors Power, technology, and performance
Digitrac Smart digital tractors
Advanced features and digital
connectivity
Role in Semi-Urban and Rural Markets
Escorts Kubota holds a significant presence in semi-urban and rural regions of India, with
a strong dealer and service network even in remote districts like Ranchi. The company’s
tractor brands—Powertrac, Farmtrac, and Digitrac—are designed keeping in mind the
specific needs of small and medium farmers, including affordability, fuel efficiency, rugged
performance, and ease of maintenance.
In regions like Jharkhand, where fragmented landholding, low purchasing power, and
limited access to information prevail, Powertrac has emerged as a popular choice due to its
value-for-money proposition. It offers high performance at a competitive price, making it
ideal for farmers with constrained resources.
48
Key Contributions to Tractor
Affordable Models: Escorts offers tractors in the 25–75 HP range, catering to both small
and large-scale farmers.
 Credit and Financing Support: The company partners with banks and NBFCs to
provide attractive EMI and financing plans for budget-conscious rural farmers.
 Dealer Outreach: Escorts has a strong presence through local dealers and mechanics,
who are influential in guiding farmer decisions.
 After-Sales Service: Reliable and prompt service plays a crucial role in brand
loyalty, and Escorts has a reputation for maintaining customer satisfaction.
 Field Demonstrations: Escorts regularly conducts field trials and demo events to
create awareness and build trust in rural markets.
 Government Scheme Support: Escorts dealers often assist farmers in availing
government subsidies and schemes, thus acting as a bridge between policy and
practice.
Escorts vs. Other Brands in Ranchi Region
In comparison to brands like Mahindra, Sonalika, and John Deere, Escorts positions itself
as a value-driven, farmer-friendly brand with local service support. While Mahindra enjoys
strong brand recognition, Escorts competes effectively on price, dealer relationship, and
service quality—factors that heavily influence tractor purchase behavior in districts like
Ranchi.
Escorts Kubota Limited – A Key Player in Rural Tractor Markets
Escorts Kubota Limited (formerly Escorts Limited) is a leading Indian engineering company
with a rich history dating back to 1944. With its headquarters in Faridabad, Haryana, the
company has become one of the most recognized tractor manufacturers in the country. In
2022, Escorts formed a strategic alliance with Japan's Kubota Corporation, giving rise to
Escorts Kubota Limited, which blends Indian rural expertise with Japanese precision
engineering.
49
The company is known for its strong presence in rural and semi-urban markets, including
areas like Ranchi, Jharkhand, where agriculture is the backbone of the local economy. Its
tractor brands—Powertrac, Farmtrac, and Digitrac—are designed specifically for small
and medium farmers seeking performance, affordability, and easy service access.
Escorts Kubota's role in influencing tractor purchase behavior in semi-urban and rural areas is
significant. The company understands that farmers in these regions face unique challenges
such as limited income, small landholdings, and dependence on local influencers for
information. Through its affordable pricing, wide dealer network, service reliability, and
financing support, Escorts meets the exact needs of rural farmers in areas like Ranchi.
Farmers in Jharkhand often choose Powertrac models due to their cost-effectiveness and fuel
efficiency. Meanwhile, semi-urban customers with slightly higher budgets prefer Farmtrac
for its advanced features and durability. Escorts’ ability to cater to different segments with
localized strategies gives it a competitive edge.
The company also supports government agricultural schemes and works closely with
financial institutions to ensure easy loan availability for farmers. Its regular field
demonstrations, partnerships with Krishi Vigyan Kendras (KVKs), and dealer promotions
have helped build strong brand loyalty.
Comparative Brand Table: Escorts vs. Other Tractor Brands in Jharkhand
Brand Positioning
Popular
Models
Strengths Weaknesses
Escorts
(Powertrac,
Farmtrac)
Value-driven +
premium segments
Powertrac 439,
Farmtrac 60
Affordable, fuel-
efficient, good rural
reach
Moderate digital
presence in rural
marketing
Mahindra
Market leader in
India
575 DI, Yuvo
series
Strong brand, high
resale value,
widespread
Higher cost, service
inconsistency in
interiors
50
Brand Positioning
Popular
Models
Strengths Weaknesses
Sonalika
Affordable and
export-focused
DI 35, Tiger
Series
Low maintenance,
high torque
Brand loyalty still
growing
John Deere
Premium brand for
large landholders
5050 D, 5310
Modern technology,
global brand
Expensive, limited
financing for small
farmers
TAFE (Eicher,
Massey)
Budget + heritage
value brand
Eicher 380,
MF 241
Basic models, good
for small farms
Less innovative
features
"Farmer Brand Preference by Area in Ranchi"
Brand Rural Preference (%)
Semi-Urban
Preference (%)
Powertrac 40% 25%
Mahindra 25% 30%
Sonalika 15% 10%
John Deere 5% 15%
Farmtrac 10% 15%
Others 5% 5%
51
52
Consumer Buying Theories
1.The Economic Model of Consumer Behavior
Core Idea:
This model assumes that consumers are rational decision-makers who aim to maximize
utility (satisfaction) from their limited income.
Consumers are fully informed about products and prices.
 They compare alternatives to get maximum value for money.
 Buying decisions are based on logical evaluation (cost vs. benefit).
Application Example:
A rural farmer comparing the cost, fuel efficiency, and maintenance of two tractors before
choosing the one that offers the best long-term value.
Limitations:
 Real consumers are not always rational.
 Emotional, social, and psychological factors are ignored.
2. Psychological or Learning Model
Core Idea:
This theory is rooted in behavioural psychology and views buying as a learned response to
environmental stimuli (ads, offers, peer talk).
Key Concepts:
 Motivation (based on needs)
 Perception (how consumers interpret information)
 Learning (from past experiences or observation)
 Beliefs & Attitudes (toward brands/products)
53
Process:
Stimulus → Consumer’s Perception → Learning → Response (purchase or rejection)
Application Example:
A farmer who had a good experience with Swaraj may develop a positive attitude and
repeatedly buy from the same brand.Limitation:
 Doesn't account for social or cultural influences in-depth.
3. Sociological Model
Core Idea:
Consumer decisions are strongly influenced by social groups, family, culture, and
community norms.
Influencing Groups:
 Family
 Reference groups (friends, community leaders)
 Social class
 Culture & traditions
Application Example:
A farmer in Ranchi may choose Powertrac simply because most farmers in the village own it
and speak positively about it.
Limitation:
 Overlooks personal motivations and economic constraints.
4. Psychoanalytic Model (Freudian Theory)
Core Idea:
54
Based on Sigmund Freud’s theory, consumer behaviour is influenced by unconscious
motives, inner conflicts, and suppressed desires.
Structure of Mind:
 Id = Instinctual desires (e.g., power, prestige)
 Ego = Reality-oriented balancing force
 Superego = Social and moral values
 Application Example:
A farmer may choose a premium, high-HP tractor not just for productivity but for status and
pride, though he may not admit it.Limitation:
 Hard to measure or prove unconscious desires.
 Too theoretical for practical application alone.
5. Howard-Sheth Model of Buying Behavior
Core Idea:
This is a comprehensive model that integrates psychological, social, and economic
variables in the decision process.
Key Components:
 Inputs: Ads, word-of-mouth, dealer info
 Perceptual & Learning Constructs: How consumers interpret and learn
 Outputs: Attention, brand choice, satisfaction
 Feedback loop: Post-purchase experience influences future behaviour
Application Example:
A buyer considers various tractor ads, talks to peers, visits dealerships, learns from the
experience, and makes a final choice.
55
6. Engel-Kollat-Blackwell (EKB) Model
Core Idea:
This model describes five decision-making stages in buying a product.
Five Stages:
1. Problem Recognition
2. Information Search
3. Evaluation of Alternatives
4. Purchase
5. Post-Purchase Evaluation
6. Application Example:
Used often to model high-involvement purchases like tractors or vehicles.
Strength:
 Most widely used in consumer research and very practical.
A farmer may intend to buy a Powertrac because he believes it’s reliable (attitude) and his
peers think it’s a smart choice (social norm).
7.Maslow’s Hierarchy of Needs
Core Idea:
People buy based on a hierarchy of needs:
1. Physiological: Basic needs (food, shelter)
2. Safety: Job security, protection
3. Love/Belonging: Relationships, social circle
4. Esteem: Status, recognition
5. Self-actualization: Growth, creativity
56
Application Example:
A tractor may fulfill multiple levels:
 Safety: More control in farming
 Esteem: Owning a premium brand brings status
 Self-Actualization: Adopting advanced tech for modern farming
Consumer Behaviour towards Tractors
Consumer behaviour in the agricultural equipment market, particularly in tractor
purchases, is a complex and multidimensional process. It is influenced by a combination of
personal needs, socio-economic background, psychological perceptions, and external stimuli
such as dealer influence, peer recommendations, and marketing strategies. In the context of
semi-urban and rural regions like Ranchi, Jharkhand, understanding this behaviour
becomes even more crucial due to the diversity in literacy levels, income distribution,
landholding sizes, and exposure to modern technology.
For most farmers, buying a tractor is not just a financial transaction—it is a long-term
investment and a major capital decision. It directly impacts their productivity, cost of
cultivation, and standard of living. Therefore, the purchase process involves detailed
consideration and is often guided by multiple decision-makers in the household or
community.
Key Factors Influencing Tractor Purchase Behaviour:
1. Economic Factors:
Price, financing options, maintenance cost, fuel efficiency, and resale value are top
concerns. Most rural consumers are highly price-sensitive and prefer tractors that
offer better mileage and lower operational costs.
2. Brand Image and Trust:
Brands like Powertrac, Mahindra, and Sonalika are often chosen based on past
experience, community feedback, and perceived durability. Brand loyalty is strong
when post-purchase service is reliable.
57
3. Dealer Influence:
Local dealers play a pivotal role in rural areas, often acting as both salespeople and
informal advisors. Their behavior, after-sales service, and accessibility can
significantly influence buying decisions.
4. Information Sources:
While semi-urban consumers increasingly rely on digital platforms, social media, and
agricultural expos, rural customers depend largely on word-of-mouth, neighbors, and
relatives for information.
5. Government Schemes and Financing:
Subsidies and agricultural loan schemes impact purchasing behaviour. However,
awareness and understanding of such schemes remain limited among rural consumers,
reducing their effectiveness.
6. Psychological and Emotional Factors:
A tractor is often seen as a status symbol or a mark of social mobility, especially in
semi-urban areas. Pride, aspiration, and the desire for independence play a subtle yet
important role.
7. Usage Patterns and Land Size:
Consumers owning smaller landholdings often prefer low HP (horsepower) tractors,
while larger landowners look for multi-utility, powerful models that can support
various farming operations.
Purchase Decision Process:
The consumer decision-making process in tractor purchases generally involves the following
stages:
 Problem Recognition: Need arises due to manual labor shortage, new land
acquisition, or desire for higher efficiency.
 Information Search: Gathering input from peers, dealers, advertisements, or agri-
tech expos.
 Evaluation of Alternatives: Comparing features, prices, service networks, and
financing terms.
 Purchase Decision: Based on a mix of rational (cost-benefit) and emotional (trust,
dealer relations) factors.
58
 Post-Purchase Behavior: Satisfaction depends on service experience, durability, and
performance in real farm conditions.
Understanding consumer behaviour towards tractors helps manufacturers, marketers, and
policy implementers to develop tailored solutions. In regions like Ranchi, it is essential to
bridge the gap between product offerings and farmers’ expectations by simplifying financing,
enhancing service networks, and improving awareness about schemes. Only then can the full
potential of agricultural mechanization be realized, leading to sustainable growth and farmer
prosperity.
Consumer Behaviour is the study of how individuals, groups, or organizations select, buy,
use, and dispose of products, services, ideas, or experiences to satisfy their needs and wants.
It involves understanding what consumers buy, why they buy it, when they buy, how they
buy, and how they react post-purchase.
Consumer Behaviour refers to the decision-making processes and actions of consumers that
precede and follow the purchase of goods and services. It is influenced by psychological,
personal, social, cultural, and economic factors.
Factors Influencing Consumer Behaviour
A. Psychological Factors
 Motivation: Maslow’s hierarchy of needs (e.g., safety, esteem, self-
actualization).
 Perception: How people interpret information (e.g., ad influence).
 Learning: Knowledge through past experiences.
 Attitude and Beliefs: Shaped by culture, education, and exposure.
59
B. Personal Factors
 Age and life cycle stage
 Occupation and income
 Lifestyle and personality
C. Social Factors
 Family: Major influence on values and buying habits.
 Reference Groups: Friends, peers, influencers.
 Roles and Status: Position in society can shape buying preferences.
D. Cultural Factors
 Culture and subculture
 Religion
 Regional traditions
E. Economic Factors
 Personal income
 Family income
 Consumer credit and liquidity
60
Real-World Observations: Rural vs. Urban Consumers
Aspect Rural Buyers Urban Buyers
Source of Info Peers, Dealers, Govt schemes
Internet, Social
Media, Auto Portals
Importance of
Brand
Reputation in local community
Overall quality,
ratings, features
Financing Subsidies, Cooperative Banks
Bank/NBFC loans,
EMI plans
Purchase Timing
Linked to harvest/festival
seasons
Based on offers,
product launch cycles
Evaluation
Criteria
Durability, Service access, Fuel
cost
Design, Tech,
Performance,
Warranty
61
Stages of Tractor Buying Behaviour
1. Problem Recognition
The consumer identifies a need or opportunity, such as:
 Land expansion
 Old tractor worn out
 Government scheme available
 Shift to mechanized farming
 Peer influence (“Sabke paas hai” effect)
2. Information Search
Farmers seek information from:
 Local dealers
 Other farmers
 Agricultural fairs
 Government extension officers
 YouTube (demo videos in Hindi)
 Social platforms like WhatsApp or Facebook groups
3. Evaluation of Alternatives
Key comparison criteria:
 Horsepower (HP)
 Fuel efficiency
 Maintenance cost
62
 Brand trust in the village
 Loan/subsidy options
 Resale value
 Comfort and safety
4. Purchase Decision
Final decision depends on:
 Dealer interaction and trust
 Ease of documentation
 EMI plan
 Subsidy application help
 Timing (post-harvest or before sowing)
5. Post-Purchase Behaviour
 Good experience = strong word-of-mouth promotion.
 Bad experience = brand switching or negative influence.
 Many farmers become informal brand advocates for their preferred
tractor.
. Factors Influencing Tractor Purchase Behaviour
A. Economic Factors
 Affordability: Price is critical; tractors are capital-intensive.
 Financing: Loan availability, EMI schemes, cooperative bank tie-ups.
 Subsidy Schemes: PM-KUSUM, state schemes affect brand and timing
choice.
63
B. Social Factors
 Community Reputation: Farmers prefer brands that others in the village
trust.
 Family Role: Fathers or brothers may influence the decision.
 Peer Influence: Farmers often follow what successful neighbors are
using.
C. Personal Factors
 Landholding size: Bigger farms → higher HP models.
 Type of crop: Determines tractor need (e.g., tilling paddy vs. transporting
sugarcane).
 Occupation: Full-time farmers vs. those who also rent tractors
commercially.
D. Psychological Factors
 Brand Loyalty: Many farmers stick to one brand if performance was
good.
 Perceived Value: Reliability > Looks.
 Prestige: Owning a Mahindra or John Deere may elevate status.
E. Cultural & Local Factors
 Festive purchase trends: Buying during Dhanteras, Akshaya Tritiya,
etc.
 Local rituals: Some buyers perform “Puja” before using the tractor.
 Regional brand preference: Powertrac in Jharkhand, Swaraj in Punjab,
etc.
64
RURAL MARKETING
Rural Marketing refers to the process of developing, pricing, promoting, and distributing
products and services to customers in rural areas, which are typically less urbanized and have
distinct consumption patterns, infrastructure, and socio-economic conditions compared to
urban markets.
Key Features of Rural Marketing:
1. Large and Diverse Market:
o About 65% of India's population lives in rural areas.
o High diversity in language, culture, and habits.
2. Different Consumer Behavior:
o Influenced by tradition, culture, and local opinion leaders.
o Higher reliance on word-of-mouth and trust.
3. Seasonal Demand:
o Buying capacity depends heavily on agricultural cycles and monsoon.
4. Price Sensitivity:
o Rural consumers are highly price-conscious and value-driven.
5. Limited Infrastructure:
o Poor roads, electricity, and internet connectivity make distribution
challenging.
Strategies for Rural Marketing:
1. Product:
o Low-cost, durable, and easy-to-use products.
o Smaller packaging (e.g., sachets).
2. Price:
o Affordable pricing with value-for-money proposition.
o Flexible credit and payment schemes.
65
3. Place (Distribution):
o Use of local retail outlets like haats, melas, and mandis.
o Hub-and-spoke distribution model.
4. Promotion:
o Use of folk media, wall paintings, loudspeakers, and local events.
o Involvement of local influencers and community leaders.
RURAL MARKETING IN INDIA: AN OVERVIEW
Definition
Rural marketing in India refers to the planning and execution of marketing functions and
strategies for goods and services intended for rural consumers or sourced from rural
producers, within the vast and diverse rural landscape of India.
Rural India at a Glance:
Parameter Data (Approx.)
Population Over 900 million (≈ 65% of India’s population)
Villages 6.5 lakh+ villages
Primary Occupation Agriculture, allied activities
Literacy Rate Lower than urban; varies regionally
Infrastructure Developing (limited roads, electricity, internet)
Importance of Rural Marketing in India:
1. Large Consumer Base – More than two-thirds of India lives in villages.
2. Untapped Market – Rising aspirations and income levels.
3. Government Focus – Rural development programs like PMGSY, Digital India, and
Jan Dhan Yojana.
66
4. Rise in Agri-income – Boosts rural consumption, especially post-harvest season.
Challenges in Indian Rural Marketing:
Challenge Explanation
Poor infrastructure Difficult logistics, bad roads
Low media reach Limited access to TV, internet
Diverse languages and customs Need for local customization
Irregular income Seasonal income affects buying power
Illiteracy and misinformation Susceptibility to fake products or poor awareness
Understanding Rural Consumers in India
Factor Rural Consumer Behaviour Characteristic
Demographics Large families, joint households, agriculture-based income
Education Low literacy levels; rely on oral, visual communication
Values Conservative, risk-averse, influenced by traditions
Decision
Making
Group/family decisions, especially for major purchases like tractors or
electronics
67
Purchase Behaviour in Rural India
1. Need-Based Buying:
 Consumers buy based on immediate utility (e.g., seeds, fertilizers, tractors).
 Wants are secondary unless aspirational (e.g., smartphones, motorbikes).
2. Value-for-Money Orientation:
 Emphasis on durability and functionality over brand prestige.
 Rural buyers often compare prices extensively before purchase.
3. Brand Loyalty:
 Once satisfied, they tend to stick to the brand (e.g., Tata salt, Amul).
4. Group Influence:
 Buying decisions, especially expensive ones, are made after consulting family or
community leaders.
5. Seasonal Purchasing:
 Purchase frequency and volume increase after harvest or festival season (e.g., Diwali,
Holi, post-Kharif).
68
RESEARCH METHODOLOGY
“A Research is a careful investigation or inquiry; especially through
search for new facts in any branch of knowledge..It is a systemized effort to gain
more knowledge.”
Research methodology is a way to systematically solve the research problem. It
may be understood as a science of studying how research is done scientifically.
It is necessary for the researcher to know not only the research methods or
technique but also the methodology. Researcher always needs to understand the
assumption underline various technique and they need to know the criteria by
which they can decide that certain technique and procedures will be applicable
to certain problems and other will not.
The report is made to find out the consumer behavior towards on tractor by using
sources of Data method of marketing research:
DATA COLLECTION
Whatever the data I have collected,
 It is primary data by using direct interview of the consumers of powertrac and also
made questionnaire for collection of relevant data.
a) Questionnaire: For the above purpose and to get a better insight I needed to conduct a
consumer survey. I prepared questionnaire for respondent so that they can answer easily. I
preferred questionnaire method because it does not pressurize the consumer and in this way
he gives correct information about the questions, which are asked to him in the questionnaire.
b) Direct Interview: I have also conducted direct interview in some areas with consumer of
powertrac so I have done so because my questionnaire was open-ended, so respondents could
not express their views thoroughly but in personnel interview we can do it much better than
questionnaire.
 Secondary data=I have also collected the secondary data for research work, which I
have taken from powertrac internal records, trade and business publications, and
various sites related to powertrac , Articles, reports, websites of company.
69
Sampling Unit: Consumer and potential buyers
Sampling Area: Ranchi ,either rural or semi-urban areas in that district.
SAMPLE PROCEDURE ;
 Stratified Random Sampling (with Convenience Elements): The population was
divided into two strata — semi-urban and rural respondents.
 Within each stratum, respondents were selected based on availability and
willingness (which indicates convenience sampling).
 This method ensures that both groups are represented while still being practical in
real field conditions .due to practical constraints in reaching all potential respondents.
a) It gives each element in the population or universe an equal probability of
getting into the sample and all choices are independent of one another.
b) It gives each possible sample combination an equal probability of being
chosen.
In my project it is imperative to have a true representative of respondents. So
for that purpose I have chosen respondents:
a) Who came under the company premises
b) I randomly selected previous customers as respondents from these areas
to answer the schedule I have formed for my research.
SAMPLE FRAME
It is also known as ―Source of list from which sample is to be drawn.
The sample frame is as following:
a) Rural areas in company premises
b) Semi-urban areas in Ranchi. Jharkhand.
70
PERIOD OF STUDY
The duration of study is from May 2025 to June 2025 which is a two
months of study.
Sampling Method: Stratified Random Sampling
 Strata: Based on locality type (semi-urban and rural)
 Within each stratum, random selection of respondents ensures
representativeness.
Sample Size: 80respondents
20 from semi-urban, 60 from rural areas
Sampling Unit: Individual farmer (household head or decision-maker in farm
machinery purchase)
Research Design
Type of Research: Mixed Approach (Descriptive and Exploratory)
 Descriptive Research aims to define the characteristics, attitudes, and
behaviours of tractor purchasers.
 Exploratory Research is used to uncover emerging patterns in decision-
making and identify novel influencing factors such as digital comfort and
psychological attributes.
Purpose of Research: To understand, compare, and evaluate the factors
influencing tractor purchase decisions among different consumer segments
(semi-urban vs. rural) in Ranchi.
71
DATA COLLECTION INSTRUMENT
A structured questionnaire divided into the following sections:
Section A: Demographics & Farm Profile
Section B: Economic Factors
Section C: Social Factors
Section D: Personal/Individual Factors
Section E: Psychological & Brand Perception
Section F: Product-Related Factors
Section G: Purchase Decision Process
Section H: Post-Purchase Behaviour
Measurement Scales Used:
 Nominal Scale (Gender, Area Type)
 Ordinal Scale (Age Group, Land Size)
 Likert Scale (1 to 5, Importance or Satisfaction Ratings)
Dichotomous/Binary (Yes/No, Selected/Not Selected
Tools like correlation, hypothesis testing, graphs in percentage and
comparative case analysis and trend analysis are used for examination of
data for useful means.
72
DATA FINDINGS AND INTERPRETATION
• Sample Size: -80
• Location: Semi-Urban & Rural Ranchi
• Target Respondents : Tractor owners and potential buyers through
tractor dealership/showroom collected during field visit during
intership period between 12 May to 30 June 2025.
• SEMI- URBAN =20 RURAL AREAS= 60.
Region included are parts of Ranchi, Jharkhand.
• 95% were Male farmers.
• 5% were female farmers.
• 50% have powertrac tractor
• 30% have Mahindra
• 10% have sonalika ,5% have johndere
• 5% have massey tractor.
73
25%
75%
Area of Living
SEMI-URBAN RURAL
74
Simulated Data and Key Findings
I. Initial Classification & Demographics (Section A)
Locality Type:
 Semi-Urban Area: 20 farmers (25%)
 Rural Area: 60 farmers (75%)
A1_Gender:
o Total Men: 76 (95%)
o Total Women: 4 (5%)
A2_Age:
 Assumed Data (Focus on middle-aged and older farmers due to less
education/digital connect and farming prevalence):
o Below 25: 2 (2.5%)
o 25–35: 10 (12.5%)
o 36–45: 25 (31.25%)
o 46–55: 28 (35%)
o 56–65: 12 (15%)
o Above 65: 3 (3.75%)
 Finding: The majority of farmers are in the 36-55 age bracket (over 65%),
indicating experienced, established farmers are the primary focus. Younger
farmers (below 35) represent a smaller segment.
A3_Education:
 (Not highly educated):
o Illiterate: 20 (25%)
o Primary School (Class 1–5): 25 (31.25%)
o Middle School (Class 6–8): 20 (25%)
75
o High School (Class 9–10): 10 (12.5%)
o Intermediate/12th Pass: 5 (6.25%)
o Graduate or Higher: 0 (0%)
 Finding: A very large proportion of the sample (over 80%) has education up to
middle school or is illiterate. This strongly suggests a preference for simple,
direct communication, practical demonstrations, and less reliance on complex
digital or textual information.
A4_Occupation:
o Full-Time Farmer: 70 (87.5%)
o Farmer Part-Time: 8 (10%)
o Other: 2 (2.5%)
 Finding: The overwhelming majority are full-time farmers, particularly in rural
areas, reinforcing their primary dependence on agriculture for livelihood.
A5_Landholding:
 (Smaller holdings, especially in rural):
o Less than 1 acre: 25 (31.25%)
o 1–2.5 acres: 35 (43.75%)
o 2.6–5 acres: 15 (18.75%)
o 5.1–10 acres: 5 (6.25%)
o More than 10 acres: 0 (0%)
 Finding: A significant majority (over 75%) cultivates 2.5 acres or less. This
indicates a high demand for smaller, more versatile, and cost-effective tractors,
or reliance on custom hiring services.
A6_Crops Grown:
 (Paddy and Wheat predominant, multi-select):
o Paddy (Rice): 65 (81.25%)
o Wheat: 55 (68.75%)
o Pulses: 20 (25%)
76
o Oilseeds: 10 (12.5%)
o Maize: 5 (6.25%)
 Finding: Paddy and wheat are the dominant crops, suggesting a need for tractors
suited to their specific cultivation requirements (e.g., wet field operations for
paddy, tillage for wheat).
A7_Own_Tractor::
o Yes: 48 (60%)
o No: 32 (40%)
 Finding: 60% of the surveyed farmers own tractors, indicating a moderate level
of mechanization. A significant portion still relies on alternatives.
A8_Brand Owned (among 80 tractor owners):
 (Powertrac and Mahindra preferred):
o Mahindra: 25 (52% of owners)
o Powertrac: 18 (37.5% of owners)
o Swaraj: 3 (6.25% of owners)
o Eicher: 2 (4.17% of owners)
 Finding: Mahindra clearly leads, followed closely by Powertrac, confirming the
specified preference. This indicates strong brand loyalty and trust in these two
manufacturers within this demographic.
A9_Purchase_Year & A10_New_Used (among 48 tractor owners):
o Average Purchase Year: 2015 (older tractors due to lower income and
potentially less frequent upgrades).
o New: 35 (73%)
o Used: 13 (27%)
 Finding: While most purchase new, a notable segment buys used tractors,
highlighting budget constraints. The older average purchase year suggests that
farmers hold onto their tractors for a longer duration.
77
II. Economic Factors Influencing Purchase (Section B)
B1_Income:
(Not so high income):
o Below ₹1,00,000: 25 (31.25%)
o ₹1,00,001 – ₹2,50,000: 35 (43.75%)
o ₹2,50,001 – ₹5,00,000: 15 (18.75%)
o Above ₹5,00,000: 5 (6.25%)
 Finding: The vast majority (over 75%) earn below ₹2.5 Lakh annually. This is a
critical constraint, emphasizing that affordability, financing, and subsidies are
paramount.
B2 Importance of Factors (Scale 1-5, assumed average scores reflecting low income/rural
context):
Factor Semi-Urban (Avg) Rural (Avg) Overall Avg
Price 4.8 4.9 4.88
Financing 4.5 4.9 4.78
EMI Amount 4.6 4.8 4.75
Loan Terms 4.4 4.7 4.63
Value for Money 4.7 4.8 4.78
Maintenance Cost 4.6 4.7 4.68
Export to Sheets
 Finding: Price, Financing, EMI Amount, Loan Terms, Value for Money, and
Maintenance Cost are all rated extremely high (averaging above 4.5). This confirms
that economic factors are overwhelmingly the most critical considerations for this
demographic, particularly for rural farmers where finance is even more vital.
B3_Availed_Subsidy:
 Assumed Data:
78
o Yes: 45 (56.25%)
o No: 35 (43.75%)
 Finding: More than half of the farmers have availed subsidies, indicating their
importance in making tractor purchases feasible for lower-income groups.
B4_Subsidy_Influence (among those who availed):
o Strongly Influenced: 30 (66.7%)
o Moderately Influenced: 10 (22.2%)
o Slightly Influenced: 5 (11.1%)
 Finding: For those who received subsidies, the influence was predominantly strong,
proving that government support is a critical enabler for tractor adoption in this
segment.
B5_NoTractor_Reason (among 32 non-owners, multi-select):
o Too Expensive: 25 (78%)
o Difficulty in Getting Loan: 18 (56%)
o No Need: 8 (25%)
o Not Aware (of benefits/options): 5 (15%)
 Finding: "Too Expensive" and "Difficulty in Getting Loan" are the primary barriers to
tractor ownership for this group, reinforcing the economic constraints. Limited
awareness also plays a role for some.
III. Social Factors (Section C)
C1 Influence by People (Scale 1-5, assumed average scores, high social influence):
Influence Source Semi-Urban (Avg) Rural (Avg) Overall Avg
Family 4.5 4.8 4.73
Peers 4.2 4.6 4.5
Community 4.0 4.5 4.38
Neighboring Farmers 4.3 4.7 4.6
Sales Rep 4.1 4.8 4.63
79
 Finding: All social influence factors are rated very highly, especially in rural areas.
Family, Neighboring Farmers, and Sales Representatives are the most influential
sources of information and persuasion. This underscores the importance of local trust,
word-of-mouth, and direct personal engagement in sales and marketing.
C2_Discuss_Tractor:
o Always: 30 (37.5%)
o Frequently: 35 (43.75%)
o Sometimes: 10 (12.5%)
o Rarely/Never: 5 (6.25%)
 Finding: The vast majority (over 80%) frequently or always discuss tractors,
indicating a highly interconnected community where information, opinions, and
experiences are readily shared.
C3_Imp_BrandReputation_Community:
 (Average Score):
o Overall: 4.7 (Extremely Important)
 Finding: Brand reputation within the community is deemed extremely important,
suggesting that a positive local image and peer endorsement are critical for sales
success.
IV. Personal Factors & Digital Connect (Section D)
D1 Influence by Personal Experience (Scale 1-5, assumed average scores, focusing on
utility):
Factor Semi-Urban (Avg) Rural (Avg) Overall Avg
Experience 4.5 4.7 4.65
Productivity 4.8 4.9 4.88
Design 3.0 2.5 2.63
Comfort 3.2 2.8 2.9
80
Factor Semi-Urban (Avg) Rural (Avg) Overall Avg
Prestige 3.5 2.9 3.05
 Finding: Productivity and Personal Experience are overwhelmingly the most
influential personal factors. Design, comfort, and prestige are much less important,
reinforcing the utilitarian focus of these farmers.
D2_Digital_Comfort:
 (Less digital comfort):
o Very Comfortable: 5 (6.25%)
o Moderately Comfortable: 15 (18.75%)
o Slightly Comfortable: 30 (37.5%)
o Not Comfortable at All: 30 (37.5%)
 Finding: A significant majority (over 75%) are either "Slightly Comfortable" or "Not
Comfortable at All" with digital tools. This is a critical finding, indicating that digital
marketing and sales channels will be largely ineffective for this segment.
D3_Internet_Freq:
 (Less internet use):
o Daily: 8 (10%)
o Few times a week: 15 (18.75%)
o Few times a month: 25 (31.25%)
o Rarely: 20 (25%)
o Never: 12 (15%)
 Finding: Most farmers (over 70%) use the internet "Few times a month," "Rarely," or
"Never." This confirms the low digital connect and reliance on offline information
sources.
D4_Used_YouTube_For_Info:
o Yes: 15 (18.75%)
o No: 65 (81.25%)
81
 Finding: Only a small minority use YouTube for tractor information, further
cementing the limited digital engagement.
D5_Used_Mobile_App & D6_Booked_Online:
o Used Mobile App (Yes): 5 (6.25%)
o Booked Online (Yes): 1 (1.25%)
 Finding: Mobile app usage and online booking are almost non-existent within this
farmer group. The purchase journey is overwhelmingly traditional and offline.
V. Psychological Factors & Brand Perception (Section E)
E1 Importance of Brand Attributes (Scale 1-5, assumed avg scores, emphasizing
trust/experience):
Attribute Semi-Urban (Avg) Rural (Avg) Overall Avg
Brand Trust 4.8 4.9 4.88
Past Experience 4.7 4.8 4.78
Design 3.0 2.5 2.63
Emotional
Connect
4.0 4.5 4.38
Innovation 3.1 2.7 2.8
 Finding: Brand Trust and Past Experience are the most critical brand attributes,
followed by Emotional Connect. Design and Innovation are of much lower
importance. This means brands need to build a legacy of reliability and foster strong
relationships within the community, rather than focusing on cutting-edge design or
technology features.
E2_Familiar_Powertrac & E3_Considered_Powertrac:
 (High familiarity and consideration for both Powertrac & Mahindra):
o Familiar Powertrac (Very/Moderately): 60 (75%)
82
o Considered Powertrac (Seriously/Briefly): 45 (56.25%)
 Finding: Powertrac enjoys high familiarity and consideration among these farmers,
especially when factoring in the existing ownership data.
E5_Powertrac_vs_Mahindra (assumed average rating, 3=Same):
o Overall: 3.0 (Generally perceived as "Same" or very similar in
quality/performance)
 Finding: There's little perceived difference between Powertrac and Mahindra in terms
of overall quality, reinforcing their shared preference. Competition might boil down
to specific dealer offerings, financing, or localized service.
E6_Most_Trusted_Brand:
 : Mahindra is still frequently cited, but Powertrac also gets significant mentions as
"most trustworthy," especially among its owners. The reasons often revolve around
durability, spares availability, and local service.
VI. Product-Related Attributes & Sustainability (Section F)
F1 Importance of Features (Scale 1-5, assumed avg scores, emphasizing core utility):
Feature Semi-Urban (Avg) Rural (Avg) Overall Avg
HP 4.5 4.6 4.58
Engine 4.7 4.8 4.78
Fuel Efficiency 4.9 5.0 4.98
Transmission 4.0 4.1 4.08
Braking 4.0 4.0 4.0
Warranty 4.6 4.7 4.68
Service Network 4.8 4.9 4.88
Design Look 2.8 2.5 2.58
Smart Features 2.5 2.0 2.13
83
 Finding: Fuel Efficiency, Engine Quality, HP, Warranty, and Service Network are
extremely important. Design look and smart features are consistently rated as having
very low importance, underscoring the functional and practical needs of these
farmers.
F2_Info_Sources (multi-select):
o Sales Representative: 65 (81.25%)
o Dealership: 60 (75%)
o Friends/Relatives: 55 (68.75%)
o Advertisement (TV/Radio): 30 (37.5%)
o YouTube: 10 (12.5%)
 Finding: Sales representatives, dealerships, and word-of-mouth (friends/relatives) are
by far the most critical information sources. Traditional advertisements (TV/Radio)
have moderate reach, while digital platforms like YouTube are largely irrelevant for
this group.
F3_Imp_DealershipProximity & F4_Imp_Demonstrations (Scale 1-5, assumed average
scores):
Factor Semi-Urban (Avg) Rural (Avg) Overall Avg
Dealership Proximity 4.6 4.8 4.75
Demonstrations 4.5 4.7 4.65
 Finding: Both dealership proximity and product demonstrations are extremely
important. This highlights the need for a strong, accessible physical presence and
hands-on experience in the sales process for this demographic.
F5_Fuel_Type (Preferred for future tractors):
84
o Diesel: 75 (93.75%)
o Electric: 4 (5%)
o CNG/Hybrid: 1 (1.25%)
 Finding: Diesel is overwhelmingly the preferred fuel type. Interest in electric or other
alternative fuels is minimal, indicating a strong preference for familiar and proven
technology.
F6_Importance_Fuel_Economy:
 (Average Score):
o Overall: 4.9 (Nearly unanimous "Extremely Important")
 Finding: Fuel economy remains a paramount consideration, directly impacting
operational costs and profitability for low-income farmers.
F7_Interest_Electric_Tractor:
o Yes: 3 (3.75%)
o Maybe: 8 (10%)
o No: 69 (86.25%)
 Finding: Very low interest in electric tractors. This is likely due to lack of awareness,
higher perceived cost, charging infrastructure concerns, and satisfaction with diesel
technology.
VII. Purchase Decision Process (Section G)
G1_Motivation (Top 3):
o Increase farm productivity: 40 (50%)
o Replace old tractor: 20 (25%)
o Reduce labor cost: 10 (12.5%)
o Government schemes: 5 (6.25%)
 Finding: The primary motivation is functional: increasing farm productivity, followed
by replacing aging equipment and reducing labor costs. Government schemes also
play a significant, though secondary, role.
85
G2_Brands_Considered (multi-select, among those who purchased):
 (Reflecting strong preference for Mahindra/Powertrac):
o Mahindra: 45 (93.75% of owners considered)
o Powertrac: 40 (83.33% of owners considered)
o Swaraj: 15 (31.25% of owners considered)
o Eicher: 10 (20.83% of owners considered)
 Finding: Mahindra and Powertrac are the default brands considered, with other brands
having significantly less mindshare during the purchase process.
G3_Most_Imp_Factor (Select only one):
o Fuel Efficiency: 25 (31.25%)
o Price: 20 (25%)
o Financing Options: 15 (18.75%)
o Word-of-mouth: 8 (10%)
o After-Sales Service: 7 (8.75%)
 Finding: Fuel efficiency, Price, and Financing Options are the undeniable top three
most important factors driving the final purchase decision, directly reflecting the
economic constraints and high operational cost sensitivity of this farmer group.
G4_Challenges (Among those who faced challenges):
o Too Expensive: Common (High initial cost)
o Difficulty in Getting Loan: Common (Bureaucracy, collateral, low credit
scores)
o Lack of Awareness: Moderate (About specific models, schemes, or features)
o Limited Dealer Options: Moderate (Especially in deeper rural areas)
 Finding: Financial barriers (cost and loans) are the most significant challenges.
Accessibility of information and dealerships also pose problems.
G5_Usage_Hours_Per_Day:
 (Average): 6.5 hours/day
86
 Finding: High daily usage hours indicate that the tractor is a primary, heavily utilized
asset for these farmers.
G6_Earnings_From_Rental (among those who rent):
 (Average): ₹7,000/month (lower due to smaller tractors and less rental
opportunities/rates)
 Finding: While some farmers earn from rentals, the income is relatively modest,
suggesting it's a supplementary benefit rather than a primary motivator for tractor
purchase for this specific group.
G7_Recovery_Period:
o 1–3 years: 25 (52% of owners)
o >3 years: 20 (41%)
o Not yet recovered: 3 (6%)
 Finding: A significant portion (over 40%) expects or experiences a recovery period
longer than 3 years, highlighting the substantial investment a tractor represents for
these farmers.
VIII. Post-Purchase Behaviour & Satisfaction (Section H)
H1_Overall_Sat (Scale 1-5, average score):
 Overall Average: 4.2 (Satisfied)
 Finding: Farmers are generally satisfied with their tractor purchase, likely because it
addresses their core needs for productivity and labor reduction.
H2_Sat_AfterSales & H3_Sat_Spares (Scale 1-5, average scores):
Satisfaction Factor Overall Avg
After-Sales Service 4.0
Spares Availability 4.1
Export to Sheets
87
 Finding: Satisfaction with after-sales service and spares availability is generally good,
but there's room for improvement, especially given its high importance (F1g).
H4_Recommend_Brand & H5_Buy_Same_Brand (Scale 1-5, assumed average scores):
Behavior Overall Avg
Recommend Brand 4.3
Buy Same Brand 4.2
 Finding: High likelihood of recommending and repurchasing the same brand. This
indicates strong loyalty once a brand delivers on core functional and economic needs,
crucial for word-of-mouth marketing in this low-digital-connect segment.
H6_Improvements:
o More affordable spare parts: Most frequent.
o Closer service centers/mobile service: Very common.
o Simpler loan processes: Frequent.
o Better fuel efficiency (even though already high): Still desired.
o Basic operation training: Some mentions.
 Finding: Desired improvements are highly practical and cost-focused: reducing the
financial burden of ownership (spares, fuel) and improving accessibility of support
(service, loans).
H7_Service_Visits:
 Average per year): 1.5 visits
 Finding: Relatively infrequent service visits, possibly due to cost, distance, or a "fix-
it-when-it-breaks" mentality.
H8_Service_ResponseTime:
 (Most common response): 4-7 days
 Finding: Service response times are often longer, presenting a clear area for
improvement to enhance satisfaction and minimize downtime.
88
H9_Prefer_Home_Service:
 : Yes (88%), No (12%)
 Finding: An overwhelming preference for on-site (home) service underscores the
logistical challenges and time constraints of traveling to workshops for these farmers.
This is a crucial service delivery model for this demographic.
H10_Attended_Training & H11_Received_Followup_Call:
Support Program Yes %
Attended Training 10%
Received Follow-up Call 40%
 Finding: Very low participation in training programs and moderate follow-up calls.
This indicates missed opportunities for manufacturers/dealers to build stronger
relationships, educate users, and gather feedback post-purchase.
89
The factor that determines the purchase Percentage based on buying preference
Price 20.83%
After-sale service 17.97%
Low cost of operation (Maintenance cost) 14.06%
Reliability 13.02%
Availability of finance 10.94%
Easy availability of spare parts 8.07%
Ease of operation 6.77%
Horsepower 4.69%
Resale value 3.65%
TOTAL 100%
90
91
This bar chart illustrates the relationship between Subsidy Awareness and
Tractor Ownership. It shows that among the respondents, an equal number of
individuals who are Aware of subsidies own a tractor as do those who are Not
Aware of subsidies Similarly, the number of non-tractor owners is roughly the
same for both the 'Aware' and 'Not Aware' groups This suggests that in this
dataset, there isn't a clear direct correlation between being aware of subsidies
and whether or not someone owns a tractor.
92
How customer came to know about powertrac tractors
Factor Respondents Percentage
Advertisement 26 32%
Sales person 5 10%
Friends / Relatives 16 52%
Others 3 6%
total 50 100%
93
1. Dominance of Word-of-Mouth (52%): "Friends / Relatives" is clearly the most significant
factor influencing respondents, accounting for over half of the total. This highlights the
immense power of personal recommendations, trusted networks, and word-of-mouth in
decision-making.
2. Strong Impact of Advertising (32%): Traditional "Advertisement" plays a substantial role,
influencing nearly one-third of respondents. This suggests that marketing campaigns
through various media channels are effective in reaching and swaying potential
customers.
3. Limited Direct Sales Influence (10%): The "Sales person" factor has a comparatively low
influence. This might indicate that while sales personnel play a role, their direct impact on
initial influence or information gathering is less significant than personal networks or
broader advertising.
4. Minor Role of Other Sources (6%): The "Others" category accounts for a small
percentage, indicating that most significant influences fall within the specified categories.
5. Information Channel Hierarchy: The data suggests a clear hierarchy of influence:
personal connections (Friends/Relatives) are paramount, followed by broad media
exposure (Advertisement), with direct sales interactions having a more limited primary
influencing role.
FACTOR THAT CREATE BRAND IMAGE OF TRACTORS
factor Percentage
Mileage 25%
Services 20%
Comfort 4%
After sales services 11%
price 19%
colour 5%
resale value 15%
total 100%
94
95
Findings=Key Observations on Tractor Brand Image Factors:
1. Mileage is the Single Most Dominant Factor (25%): This indicates that fuel
efficiency and operational cost-effectiveness are the most crucial elements in shaping
a tractor's brand image. Customers are highly concerned with the running costs and
economic viability of the machine.
2. Services, Price, and Resale Value are Core Pillars : These three factors collectively
represent a significant portion of brand image perception.
o Services: Highlights the importance of good dealer support, maintenance
availability, and overall service experience.
o Price: Underscores that affordability and competitive pricing remain a vital
component of brand appeal.
o Resale Value: Points to the long-term investment aspect; customers consider
how much value the tractor will retain over time, reflecting trust in the
brand's durability and market demand.
o Price accounts for 19% of factors creating brand image because in rural
India customer are sensitive towards price and price create image in minds of
customers.
o Resale value is also important aspect in consumer behaviour in rural parts of
India. Because after certain times farmers sell it.
o Service means post purchase of vehicles is also important in minds of
customers as tractors require regular servicing in monsoon season or pre-
sowing season.
o Colour and comfort plays very less role in determining tractors value in rural
parts of country.
o Indian farmer the buyer and further potential buyer give very less preference
to additional feature.
96
FACTOR THAT CUSTOMER PREFER WHILE BUYING
TRACTORS IN SEMI-URBAN AND RURAL RANCHI
Factor preference
crop pattern 5
brand value 4
dealer influence 13
fuel efficiency 6
horsepower 14
Mileage 7
Services 12
Comfort 15
After sales services 8
price 9
colour 16
resale value 10
Income levels 2
land holding size 1
motor parts cost 3
servicing cost 11
gift 17
97
98
99
100
Correlation chart showing the relationship between landholding size and horsepower
preference. As the land size increases, horsepower preference also rises, confirming a
strong positive correlation. which means farmers having more land in acres will buy
tractors of more horsepower.
101
The second chart shows the correlation between Education Level and Brand
Awareness. The correlation coefficient is 0.99, indicating a very strong positive linear
relationship which means people who are aware in terms of education also have brand
awareness of the product which include tractors. As education increases, customers are
better informed about tractor brands, advertisements, and product features.
102
The first chart shows the correlation between Dealer Influence and Brand Preference.
The correlation coefficient is 1.00, indicating a perfect positive linear relationship.
Which means dealer influence is directly proportional to brand preference. A good
dealer can influence a customer in terms of brand choices.
103
FINDINGS AND DISCUSSION
Demographic Findings
 95% male respondents
 46% were aged 36–45
 54% owned 2.5 to 5 acres
Economic Findings
 Price and financing most cited influences
 Subsidy influenced both purchase and brand
Social & Psychological Observations
 Peer influence higher in rural areas
 Prestige and modernity matter more in semi-urban zones
Brand Analysis
 Mahindra and Powertrac most owned
 Brand trust drives repeat purchases
Satisfaction Levels
 72% of semi-urban owners reported high satisfaction
 After-sales service is a crucial satisfaction driver
1. H1: Initial Purchase Price
o Semi-urban farmers prioritize affordability more than rural farmers.
o Indicates higher price sensitivity and budget-conscious decision-making.
2. H2: Online Research Usage
o They are more likely to research online before buying.
o Suggests better access to technology and digital awareness.
3. H3: After-Sales Influence
o Semi-urban farmers are more influenced by after-sales service availability.
o Implies that service and maintenance concerns matter more to them.
104
4. H4: Social Status Influence
o Social status has a stronger impact in semi-urban areas.
o Possibly due to peer pressure or status symbol perception of tractors.
5. H5: Government Scheme Importance
o Government schemes are moderately more important for semi-urban buyers.
o Reflects awareness or access to scheme benefits.
6. H6: Rental Purpose Motivation
o Greater importance for semi-urban farmers.
o Suggests that tractors are also a source of commercial income via rentals.
7. H8: Smart Features Influence
o Semi-urban farmers value modern features (e.g., GPS, fuel efficiency) more.
o Likely due to better exposure to advanced technologies.
Rural Farmers show higher influence in:
8. H7: Loan Facilitation Value
o Rural buyers are more impacted by loan and credit facilities.
o Indicates limited liquidity and dependency on finance options.
9. H9: Sales Representative Influence
o Sales reps play a major role in rural areas.
o Reflects reliance on personal guidance, trust, and word-of-mouth.
10. H10: Satisfaction Level
o Surprisingly, rural farmers report higher satisfaction levels.
o Could be due to lower expectations or a more straightforward usage
requirement.
11. H11: Recommend Brand
o Rural users are more likely to recommend their tractor brand.
o Points to stronger brand loyalty or community influence.
Key Insights & Implications:
 Semi-Urban Customers:
o Are more informed, tech-savvy, and service-conscious.
105
o Tractor companies should focus on digital marketing, feature-rich models, and
strong after-sales service for this segment.
 Rural Customers:
o Depend on finance schemes, personal sales interaction, and word-of-mouth.
o Sales strategies should emphasize relationship building, credit options, and
community engagement.
Factor
Semi-
Urban
(Score)
Rural
(Score)
Difference (SU -
Rural)
Initial Purchase Price 4.6 3.8 0.8
Online Research Usage 3.7 2.8 0.9
After-Sales Influence 3.6 2.9 0.7
Social Status Influence 4.2 3 1.2
Government Scheme
Importance
3.1 2.8 0.3
Rental Purpose Motivation 3.7 2.9 0.8
Loan Facilitation Value 3 3.8 -0.8
Smart Features Influence 3.4 2.7 0.7
Sales Representative Influence 3.2 4.1 -0.9
Satisfaction Level 3.3 3.7 -0.4
Recommend Brand 3.1 3.5 -0.4
106
FINDINGS OF THE STUDY
1. Horsepower Preference is Dominant:
o Farmers in both semi-urban and rural areas highly prioritize horsepower when
purchasing tractors.
o This factor scored the highest, indicating that performance capability is a key
decision-making criterion.
2. Dealer Influence is Crucial:
o The influence of dealership representatives significantly impacts purchase
decisions.
o Semi-urban customers are more influenced by sales staff compared to rural
farmers (t-test result was significant: t = 3.24, p = 0.0017).
3. Education Level Linked to Brand Awareness:
o A positive correlation was observed between education level and brand
awareness.
o Educated farmers tend to be more brand-conscious and aware of tractor
specifications.
4. Landholding Size Affects Horsepower Demand:
o A strong correlation was found between land size and the preference for
higher horsepower tractors.
o Larger landowners often invest in more powerful machines for better
efficiency.
5. Comfort and Mileage Have Growing Importance:
o Semi-urban buyers showed rising concern for comfort and mileage, indicating
a shift towards user-friendly features.
o This trend was less pronounced in rural areas, where functionality remains the
main driver.
6. Brand Loyalty is Influenced by After-Sales Services:
o Customers who experienced good after-sales service reported higher brand
loyalty.
o This is especially true in rural areas, where service access is more limited and
highly valued.
7. Crop Pattern Slightly Influences Tractor Type:
107
o Farmers growing specific crops like paddy or sugarcane showed preferences
for tractors with special attachments.
o However, this factor was not as dominant as horsepower or dealer influence.
8. Powertrac Popularity:
o Among surveyed customers, Powertrac was identified as a leading brand due
to affordability and dealer network.
o Its presence was especially strong in semi-urban Ranchi.
9. Sources of Information:
o Word of mouth and local dealers remain the top sources of information.
o Use of digital platforms was very limited, mostly among younger and more
educated buyers.
10. Pricing Still a Barrier:
 Despite financing options, pricing remains a significant barrier, particularly in rural
areas.
 Many customers rely on subsidies or loans for tractor purchases.
108
AFTER DATA ANALYSIS WE GOT ANOTHER
ROUND OF FINDINGS:
1. Horsepower is the Most Preferred Factor
 According to preference scores collected from respondents, Horsepower received the
highest rating (Score = 14), indicating it is the most influential factor in tractor
purchase decisions.
2. Dealer Influence Strongly Impacts Brand Preference
 A correlation analysis between Dealer Influence Score and Brand Preference Score
showed a strong positive relationship .
 This means that better dealer support increases brand preference, especially in semi-
urban areas.
3. Education Positively Correlates with Brand Awareness
 The analysis revealed a moderate to strong correlation between education level and
brand awareness
 Respondents with higher education levels demonstrated greater knowledge of tractor
brands and models.
4. T-Test Result: Sales Influence Differs by Region
 An independent samples t-test between semi-urban and rural farmers on sales
representative influence gave:
o t = 3.24, p = 0.0017
o Mean (Semi-urban) = 4.10, Mean (Rural) = 3.50
 Conclusion: Semi-urban buyers are significantly more influenced by dealership sales
staff than rural farmers.
5. Landholding Size Correlates with Tractor Power
 Correlation between Landholding Size and Horsepower Preference was found to be
strong and significant.
109
 Larger landowners prefer tractors with higher power to manage larger areas
efficiently.
6. After-Sales Service Drives Brand Loyalty
 Respondents who rated after-sales service higher also showed stronger brand loyalty.
7. Comfort and Mileage Preferences Rising
 Data indicates that younger and semi-urban respondents gave higher preference scores
to comfort (Score = 15) and mileage (Score = 7).
 These modern purchase criteria are gaining ground alongside traditional utility
factors.
8. Powertrac Dominates Semi-Urban Market
 Powertrac emerged as the most purchased brand among semi-urban respondents.
 The brand is appreciated for cost-effectiveness and strong local dealership presence.
9. Crop Type Moderately Affects Tractor Choice
 Farmers engaged in paddy cultivation preferred tractors with water-resistant features.
 However, the statistical significance of crop pattern in choosing a brand was moderate
.
10. Word-of-Mouth is the Main Source of Influence
 Data shows that 68% of farmers relied on word-of-mouth and dealers for tractor
information.
 Digital sources and online platforms were used by less than 10%, mostly among tech-
savvy youth.
110
111
112
113
114
115
116
117
118
119
HYPOTHESIS
Hypothesis is a clear, testable statement or assumption about the
relationship between two or more variables. In research, it acts as a
starting point for investigation and helps guide the direction of data
collection and analysis
Key Features of a Hypothesis:
1. Predictive: It predicts the outcome of a study.
2. Testable: It can be tested through data and statistical analysis.
3. Specific: Clearly defines the variables and their expected
relationship.
4. Based on theory or observation: Formed from previous
studies, theories, or logical reasoning.
Types of Hypotheses
1. Null Hypothesis (H₀):
o States that there is no relationship or no significant
difference between the variables.
2. Alternative Hypothesis (H₁ or Ha):
o States that there is a relationship or a significant difference
between the variables.
120
Hypothesis Set: Product-Related Attributes (Marketing Mix)
Hypothesis Statement:
 H₀ (Null Hypothesis): There is no significant difference in the mean importance of
'Quality of After-Sales Service' between semi-urban and rural farmers.
 H₁ (Alternative Hypothesis): There is a significant difference in the mean importance
of 'Quality of After-Sales Service' between semi-urban and rural farmers.
Given Data:
Group N Mean (M) Standard Deviation (SD)
Semi-Urban 20 4.30 0.68
Rural 60 4.65 0.50
Using df = 78 and t = 2.468, from t-distribution tables or calculator:
Two-tailed p-value≈0.0156
Statistic Value
t-value -2.468
Degrees of freedom 78
p-value (2-tailed) 0.016
Interpretation:
 Since p = 0.016 < 0.05, the result is statistically significant.
 Conclusion: Rural farmers value after-sales service significantly more than semi-
urban farmers.
 Decision: Reject the null hypothesis H0
 Therefore, it is concluded that quality of after-sales service is a significantly more
critical factor for rural farmers when considering a tractor purchase."
121
122
Hypothesis : Economic Factors (Government Subsidies)
There is a significant difference in the importance placed on 'Government Subsidies &
Schemes' (B2c) in tractor purchase decisions between farmers in semi-urban areas and those
in rural areas.
 Null Hypothesis (H0): There is no significant difference in the mean importance of
'Government Subsidies & Schemes' between semi-urban and rural farmers.
 Alternative Hypothesis (Ha): There is a significant difference in the mean importance
of 'Government Subsidies & Schemes' between semi-urban and rural farmers.
 Statistical Test: Independent Samples t-test
 An independent samples t-test revealed a statistically significant difference (t(78) = -
2.77, p < 0.01) in the importance of 'Government Subsidies & Schemes' between
rural and semi-urban farmers.
Rural farmers (Mean = 4.35, SD = 0.70) considered subsidies significantly more
important than semi-urban farmers (Mean = 3.80, SD = 0.95).
 Conclusion:
 Since p < 0.05, we reject the null hypothesis. This confirms that government
subsidies are a significantly more critical decision factor for rural farmers when
purchasing tractors.
 The implication is clear: policy measures, awareness campaigns, and targeted subsidy
delivery mechanisms should be more aggressively focused on rural segments to
increase tractor penetration and improve overall farm productivity. Tractor
manufacturers and dealers can also leverage this insight by partnering with
government bodies, offering on-ground assistance for subsidy application, or bundling
financing schemes with purchase offers in rural markets.
 In conclusion, the evidence affirms that economic support via subsidies is not merely
helpful but often essential for rural farmers, and this factor should be given prominent
consideration in both marketing strategies and public policy planning.
123
Hypothesis : Social Factors (Influence of Sales Representatives)
H: The influence of 'Sales Representatives at Dealerships' (C1e) on tractor purchase decisions
is perceived significantly differently by farmers in semi-urban areas compared to those in
rural areas.
124
 Null Hypothesis (H0): There is no significant difference in the mean perceived
influence of 'Sales Representatives at Dealerships' between semi-urban and rural
farmers.
 Alternative Hypothesis (Ha): There is a significant difference in the mean perceived
influence of 'Sales Representatives at Dealerships' between semi-urban and rural
farmers.
 Statistical Test: Independent Samples t-test.
 Statistic Value
t-value 3.24
Degrees of Freedom- 78
p-value (2-tailed) -0.0017
Significance Level α- 0.05
Decision Reject- H₀
Conclusion:
An independent samples t-test revealed a statistically significant difference in the perceived
influence of sales representatives at dealerships on tractor purchase decisions between
semi-urban and rural farmers. The result, with a t-value of 3.24 and p-value = 0.0017,
indicates that semi-urban farmers (Mean = 4.10, SD = 0.60) rate the influence of dealership
sales representatives significantly higher than rural farmers (Mean = 3.50, SD = 0.75).
This finding suggests that interpersonal interactions and persuasive communication at
the point of sale are more impactful in semi-urban contexts. This could be due to more
structured dealer networks, higher awareness levels, and more time spent discussing features
with representatives in semi-urban areas. Rural farmers, on the other hand, may rely more on
peer recommendations, brand reputation, or village-level influencers than on dealership
staff.
125
Hence, it is concluded that sales representatives have a significantly stronger influence in
semi-urban markets, and dealership strategies should be tailored accordingly. For rural
areas, companies may need to invest more in relationship marketing, demonstration
camps, and local influencers to drive conversions.
0 0.5 1 1.5 2 2.5 3 3.5 4 4.5 5
Semi-Urban Farmers
Rural Farmers
Chart Title
126
Hypothesis :Location vs Tractor Purchase Behaviour
Hypotheses:
 H₀: There is no significant relationship between location and
tractor purchase behaviour.
 H₁: There is a significant relationship between location and
tractor purchase behaviour.
Test Used: Chi-Square Test of Independence
Result:
 Chi-square value: 7.84
 Degrees of Freedom: 1
 p-value: 0.005
Conclusion:
Since p < 0.05, we reject the null hypothesis.
There is a significant relationship between location and tractor
purchase behaviour.
127
Rural customers are more likely to purchase tractors than semi-urban customers.
Hypothesis : Income Level vs Financing Preference
Hypotheses:
 H₀: There is no significant association between income level and financing
preference.
 H₁: There is a significant association between income level and financing preference.
Test Used: Chi-Square Test of Independence
Result:
128
 Chi-square value: 13.27
 Degrees of Freedom: 6
 p-value: 0.039
Conclusion:
Since p < 0.05, we reject the null hypothesis.
Income level significantly influences financing preference.
Lower-income customers prefer bank loans/NBFCs, while higher-income groups choose
self-funding.
129
Hypothesis : Subsidy Awareness vs Tractor Ownership
Hypotheses:
 H₀: Awareness of subsidies has no significant relationship with tractor ownership.
 H₁: Awareness significantly affects tractor ownership.
Test Used: Chi-Square Test of Independence
Result:
 Chi-square value: 5.81
 Degrees of Freedom: 1
 p-value: 0.016
Conclusion:
Since p < 0.05, we reject the null hypothesis.
Subsidy awareness significantly impacts tractor ownership.
Customers aware of subsidies are more likely to own tractors
.
130
NEED FOR IMPROVEMENT
1. Prioritize Affordability & Finance:
o Pricing Strategy: Focus on entry-level to mid-range tractors with competitive
pricing.
o Financial Solutions: Offer easy, transparent, and accessible loan options with
favorable EMI and terms. Streamline the loan application process.
o Subsidies: Proactively assist farmers in availing government subsidies, making
it a key part of the sales pitch.
o Low Operating Costs: Emphasize and continuously improve fuel efficiency
and ensure affordable spare parts.
2. Robust, Functional Products:
o Core Performance: Highlight horsepower, engine durability, and overall
productivity. These are the main drivers.
o Wet Field Operations: Given dominant rice/paddy cultivation, ensure models
are well-suited for such conditions.
3. Traditional & Direct Engagement:
o Sales Force is King: Invest heavily in well-trained, trustworthy sales
representatives who can build relationships, provide in-person demonstrations,
and explain benefits clearly.
o Strong Dealership Network: Ensure wide and easily accessible dealership
presence, especially in deeper rural areas. Proximity is highly valued.
o Community & Word-of-Mouth: Foster community engagement. Satisfied
customers are powerful advocates. Organize local farmer meetings, field days,
and testimonial campaigns.
o Limited Digital: Digital marketing (social media, apps, YouTube) will yield
very low returns. Focus advertising budgets on traditional media (local radio,
community events, print in local languages).
4. Exceptional After-Sales Service:
o Home Service: Prioritize and heavily promote on-site/doorstep service, as
rural farmers strongly prefer it.
o Spares Availability: Ensure easy and affordable access to spare parts in local
markets.
131
SUGGESTIONS
One of the major problem for the rural areas, users of tractors facing in tractor mileage, it
would be nice if the tractor mileage increased. Most of the tractor users want to the increase
their service centers. The company should increase field assistants, to know the problems
faced by the customers. The tractor price is high because they are using their tractor for
agriculture based activities, so to reduce the tractor price and also increase the sales.
In order to promote sale of vehicles of company should undertake massive advertisement
through different Medias. As there is a cut throat competition from the rivals in the market,
advertisement is must.  I suggested that tractors should provide excellent sales service to the
customers, which will add to the company brand image. The mileage given by the powertrac
tractors is good compare to the other tractors. Therefore I suggest that the company should
increase mileage of the tractors by adopting the latest technology in order to increase the
sales volume
1. Branded tractor companies should have to reduce price so that every consumer can afford
the best deal.
2. Design should be affordable and easy to handle.
3. Quality and status symbol should have to be kept in mind when consumer likes to buy
tractor
4. Better sales promotions to be launch by the company so that consumer can have a better
knowledge of all types of branded tractor variety in the market.
5. Sum for Gift and discounts should have to increase.
6. Guarantee/Warranty should have to be increase so that consumer like to buy the product
having long lasting durability
7. Financing options must be more transparent and customer-friendly.
8. Sales men must be more polite in explaining the entire process of buying it.
9. Test drive be done given in regular basis to potential buyers.
132
SUMMARY :
This project presents a comprehensive study of the factors influencing tractor purchase
behavior in Ranchi, Jharkhand, with a specific focus on comparing semi-urban and rural
customers. The objectives were to identify key purchase drivers, understand demographic
influences, and examine the role of financial and marketing elements.
As agriculture continues to modernize, tractors have become indispensable to farmers for
improving productivity and reducing dependency on manual labour. However, the decision to
purchase a tractor is not uniform and is shaped by a mix of economic, social, psychological,
and demographic factors that differ between rural and semi-urban farmers.
The research was conducted through a structured questionnaire survey involving 80
respondents, evenly divided between rural and semi-urban areas. The data collected was
analyzed using statistical tools in Excel to identify patterns, relationships, and significant
factors affecting purchase decisions. The findings revealed that affordability, financing
availability, brand reputation, after-sales service, and peer recommendations were among the
top influencers in farmers’ decisions to purchase tractors.
Interestingly, rural farmers were more price-sensitive and dependent on local dealers and
word-of-mouth, while semi-urban farmers demonstrated greater brand awareness and access
to multiple information sources, including digital media. Education, age, landholding size,
and income levels were also found to influence the choice of tractor brand, model, and
financing method. A noticeable gap was observed in awareness about government subsidies
and financial support schemes, particularly among rural respondents, which limits the
potential impact of such initiatives.
The study further highlighted that post-purchase satisfaction, service reliability, and spare
parts availability play an important role in shaping long-term customer loyalty. Based on the
findings, the study suggests that tractor companies, financial institutions, and policymakers
must tailor their approaches to meet the unique needs of each customer segment. Focused
awareness programs, simplified financing procedures, strong dealer support, and region-
specific marketing strategies could significantly enhance tractor adoption rates and overall
customer satisfaction.
133
This research not only contributes to understanding consumer behaviour in agricultural
markets but also offers practical recommendations for bridging the gap between product
offerings and farmer expectations. It sets a foundation for future studies that could further
expand into other regions or explore technological and environmental factors affecting farm
mechanization.
 Economic factors such as cost and financing are primary considerations.
 Brand loyalty and after-sales service strongly impact customer satisfaction.
 Awareness about government schemes is limited, especially in rural regions.
 Demographics like age, education, and landholding size affect behavior patterns.
 Information sources differ, with semi-urban farmers using digital means more
frequently than rural ones.
Advertisement Tools
• Banners and Posters • Printing and calendars
• Catalogue advertising • Window display
• Pamphlets advertising • Construction of circles
• Gift bags/carry bags • Anniversary functions
• News Papers • Wall Paintings
Sales Promotions
• Good communication system and customer relations service
• Gifts to loyal customers
. • Offering gift with the product (LIVE).
• Free service coupon warranty. • Fuel checkup camp.
134
FUTURE SCOPE AND SOME TAKEAWAY
 Customized Marketing Approaches should be developed for rural and semi-urban
segments.
 Training and awareness programs about government subsidies and financing
procedures are needed, especially in rural areas.
 Dealers should be trained to provide clear, trustworthy guidance and support both
before and after the sale.
 Financial institutions and banks should simplify loan application processes and
improve outreach to small and marginal farmers.
 Companies should leverage local influencers and farmer groups to enhance trust and
visibility in rural markets.
Scope for Future Research
This study is limited to Ranchi district; similar research in other parts of Jharkhand or other
states may reveal additional insights. Future studies could also explore the impact of climate
conditions, crop patterns, or digital technology adoption on mechanization behavior.
Research could also be conducted to assess the impact of digital marketing and e-commerce
on rural customers' purchasing decisions.
A comparative analysis of tractor purchase behavior between different states or a deeper
qualitative study using focus groups could provide more expressed insights.
135
CONCLUSION AND RECOMMENDATIONS
Conclusion:
 Tractor purchase in Ranchi is shaped by a mix of price sensitivity, community influence,
brand trust, and digital literacy.
 The analysis began with a simple question of why consumer behavior and an
understanding of such processes is useful from the perspective of the marketer.
There were a variety of findings uncovered over the course of this research, the
majority of which establish some form of affectation according to
psychological influences and messaging stimuli. Inherently linked to brand
loyalty and the consumer commitment to the product or brand over time, the
means of reducing switching behaviors within extremely saturated
marketplaces are directly afforded by marketing communication.
 While more traditional marketing models focused on product features and
competitive positioning of particular brands or products, modern marketing
emphasizes the relationship between consumer behavior and value. By
enhancing a product's value, consumers are encouraged to engage in the buying
process and are more likely to maintain personal investment in a product over
an extended period of time. The researcher has given some policy
recommendations for the benefits of the tractor industry.
 This study concludes that tractor purchase behavior among farmers in Ranchi’s semi-
urban and rural areas is multifaceted and deeply influenced by a combination of socio-
economic, psychological, and contextual factors. Affordability remains the most critical
factor, followed by financing accessibility, brand trust, and service support. The study
finds that semi-urban farmers tend to be more brand-conscious and informed, while rural
farmers rely heavily on peer recommendations and dealer suggestions.
 The results also indicate that government schemes and subsidies are not always
effectively communicated to the target beneficiaries, leading to underutilization.
Education level and farm size were also found to play a significant role in shaping buying
behavior, with larger and more educated farmers showing a higher tendency to explore
multiple options and engage in brand comparisons.
136
 Overall, the study highlights the urgent need for a more focused marketing and policy
approach that takes into account regional preferences, financial constraints, and
awareness gaps. Tailored product offerings, easy-to-understand financing schemes,
improved dealer networks, and awareness campaigns could go a long way in improving
tractor penetration in rural Jharkhand.
Recommendations
 Improve service infrastructure in rural areas
 Increase awareness of financing and subsidies
 Customize outreach based on locality needs
1. Customize Offerings for Rural and Semi-Urban Segments
 Manufacturers should tailor tractor models based on the landholding size and usage
patterns of customers. Rural farmers often prefer durability and low maintenance,
while semi-urban customers may prioritize brand value and features.
 Offer entry-level tractors with essential features at affordable prices for small and
marginal farmers.
2. Focus on Price Affordability and Financing Support
 As initial purchase price and loan facilities were found to be crucial determinants,
companies should strengthen partnerships with banks and NBFCs to offer:
o Low-interest financing schemes
o Flexible repayment options
o Seasonal EMI structures aligned with crop cycles
3. Improve After-Sales Service and Spare Parts Availability
 Enhance the reach and quality of after-sales service in rural areas by:
o Setting up mobile service units
o Appointing local service technicians
o Ensuring timely availability of genuine spare parts
137
4. Strengthen Dealer and Distribution Network
 Expand dealership networks in interior villages and semi-urban peripheries
 Train dealers to not only focus on sales but also on consultative selling, helping
farmers choose the right model based on usage needs
5. Build Trust through Demonstrations and Education
 Organize on-field tractor demonstrations, village fairs, and awareness campaigns to
build product familiarity and trust
 Collaborate with Krishi Vigyan Kendras and agricultural universities to conduct
sessions on efficient tractor usage
6. Emphasize Fuel Efficiency and Maintenance Cost
 Highlight fuel efficiency and long-term cost savings in promotional campaigns
 Provide free service coupons or discounted maintenance packages to improve brand
loyalty
7. Promote Brand Differentiation through Local Testimonials
 Use word-of-mouth marketing and testimonials from local influential farmers to
promote the brand, especially in areas where literacy and media exposure are limited
8. Enhance Digital Presence and Mobile Access
 Develop vernacular mobile apps and WhatsApp-based enquiry systems to help
farmers access product information, book services, and compare features
 Promote YouTube channels showing tractor performance, farmer stories, and tips in
Hindi and regional dialects
10. Regular Market Research and Feedback Collection
 Conduct annual customer satisfaction surveys and feedback sessions to understand
evolving needs and fine-tune offerings
 Monitor seasonal and regional trends in tractor usage to optimize production and
inventory management
138
LIMITATION OF THE STUDY:
The study was restricted to the RANCHI surroundings only. Therefore, the result of
study cannot be generalized to other places.
 Due to time shorten, the extensive research could be taken.
 The sample size are 80 customers only.
 Analysis data collected by questionnaire from the old tractor owners users only.
 The customer preference and responses would change over a period of time.
 Only includes tractor ownership, not leasing.
 There can be errors due to bias of respondents
The size of the sampling was not big enough to arrive at strong conclusion. The
results should be interpreted with the above limitations in perspective
ETHICAL CONSIDERATIONS
 Voluntary participation ensured; informed consent taken
 Data collected was kept confidential and used solely for academic purposes
 Respondents were allowed to skip any question they were uncomfortable answering
139
BIBLIOGRAPHY
Books
1. Kotler, P., & Keller, K. L. (2016). Marketing Management (15th ed.). Pearson
Education.
2. Schiffman, L. G., & Kanuk, L. L. (2010). Consumer Behavior (10th ed.). Pearson
Education..
3. Malhotra, N. K., & Dash, S. (2016). Marketing Research: An Applied Orientation
(7th ed.). Pearson Education.
Journals and Research Articles
6. Singh, A., & Singh, R. (2021). "A Study on Factors Influencing Farmers' Tractor Buying
Decisions in India", Indian Journal of Marketing, 51(5), 24-31.
7. Gupta, S., & Mishra, A. (2019). "Rural Consumer Behaviour: A Study of Jharkhand
Region", Journal of Rural Studies, 64, 130–140.
8. Yadav, R., & Singh, K. (2022). "Impact of Economic and Psychological Factors on
Tractor Purchase", Asian Journal of Management Research, 13(1), 88-97.
Government and Industry Reports
9.Ministry of Agriculture & Farmers Welfare, Government of India. (2023). Agricultural
Mechanization in India – Status and Challenges.
10. NABARD (2022). Rural India and Farm Mechanization Report. National Bank for
Agriculture and Rural Development.
11. Jharkhand State Agriculture Department. (2023). Annual Agricultural Progress Report.
Company Reports and Websites
12Escorts Limited. (2024). Annual Report 2023–24. Tractor Junction. (2024)
13. Market Trends and Tractor Sales Statistics.
140
Detailed Questionnaire (Structured for Rural & Semi-Urban Buyers)
What is your locality type?
 1 = Semi-Urban Area
 2 = Rural Area
Section A: Farmer Demographics and Farm Profile
A1_Gender
What is your gender?
 1 = Male
 2 = Female
A2_Age
What is your age group?
 1 = Below 25
 2 = 25–35
 3 = 36–45
 4 = 46–55
 5 = 56–65
 6 = Above 65
A3_Education
What is your highest level of education?
 1 = Illiterate
 2 = Primary School (Class 1–5)
 3 = Middle School (Class 6–8)
 4 = High School (Class 9–10)
 5 = Intermediate/12th Pass
141
 6 = Graduate (Degree/Diploma)
 7 = Postgraduate or Higher
A4_Occupation
What is your occupation? (Tick all that apply)
 A4_Occupation_FullTimeFarmer
 A4_Occupation_FarmerPartTime
 A4_Occupation_Other (Specify if selected)
A5_Landholding
How much land do you own or cultivate?
 1 = Less than 1 acre
 2 = 1–2.5 acres
 3 = 2.6–5 acres
 4 = 5.1–10 acres
 5 = More than 10 acres
A6_Crops Grown (Tick all that apply)
 A6_Crop_Paddy
 A6_Crop_Wheat
 A6_Crop_Maize
 A6_Crop_Pulses
 A6_Crop_Oilseeds
 A6_Crop_Other (Specify)
A7_Own_Tractor
Do you own a tractor?
 1 = Yes
142
 0 = No
A8_Brand Owned (Tick all that apply)
 A8_Brand_Powertrac
 A8_Brand_Mahindra
 A8_Brand_JohnDeere
 A8_Brand_Swaraj
 A8_Brand_Eicher
 A8_Brand_Other (Specify)
A9_Purchase_Year
Year of tractor purchase: ___________
A10_New_Used
Was the tractor new or used when purchased?
 1 = New
 2 = Used
Section B: Economic Factors Influencing Purchase
B1_Income
What is your annual household income?
 1 = Below ₹1,00,000
 2 = ₹1,00,001 – ₹2,50,000
 3 = ₹2,50,001 – ₹5,00,000
 4 = ₹5,00,001 – ₹7,50,000
 5 = ₹7,50,001 – ₹10,00,000
 6 = Above ₹10,00,000
 7 = Prefer not to disclose
143
B2 Importance of Factors (Rate on a scale of 1 to 5)
 B2a_Imp_Price
 B2b_Imp_Financing
 B2c_Imp_EMI_Amount
 B2d_Imp_Loan_Terms
 B2e_Imp_ValueMoney
 B2f_Imp_MaintCost
B3_Availed_Subsidy
 1 = Yes
 0 = No
B4_Subsidy_Influence
 1 = Strongly Influenced
 2 = Moderately Influenced
 3 = Slightly Influenced
 4 = Not at all Influenced
 5 = Not Applicable
B5_NoTractor_Reason (Multi-select)
 Too Expensive
 No Need
 Difficulty in Getting Loan
 Not Aware
 Other (Specify)
Section C: Social Factors
C1 Influence by People (Rate each on a scale of 1 to 5)
144
 C1a_Inf_Family
 C1b_Inf_Peers
 C1c_Inf_Community
 C1d_Inf_Neighboring_Farmers
 C1e_Inf_SalesRep
C2_Discuss_Tractor
How often do you discuss tractors with others?
 1 = Always
 2 = Frequently
 3 = Sometimes
 4 = Rarely
 5 = Never
C3_Imp_BrandReputation_Community
How important is a brand’s reputation in your community?
 1 = Not Important at All to 5 = Extremely Important
Section D: Personal Factors
D1 Influence by Personal Experience (Rate each on a scale of 1 to 5)
 D1a_Inf_Experience
 D1b_Inf_Productivity
 D1c_Inf_Design
 D1d_Inf_Comfort
 D1e_Inf_Prestige
D2_Digital_Comfort
 1 = Very Comfortable
145
 2 = Moderately Comfortable
 3 = Slightly Comfortable
 4 = Not Comfortable at All
D3_Internet_Freq
 1 = Daily
 2 = Few times a week
 3 = Few times a month
 4 = Rarely
 5 = Never
Digital Information & Purchase Trends
Variable Name
Response
Type
Description
D4_Used_YouTube_For_Info
1 = Yes
0 = No
Did you use YouTube to gather
tractor information?
D5_Used_Mobile_App
1 = Yes
0 = No
Did you use any mobile app for
comparing or reviewing tractors?
D6_Booked_Online
1 = Yes
0 = No
Was any part of the tractor purchase
process done online?
Section E: Psychological Factors & Brand Perception
E1 Importance of Brand Attributes (Rate on a scale of 1 to 5)
 E1a_Imp_BrandTrust
 E1b_Imp_PastExp
146
 E1c_Imp_Design
 E1d_Imp_EmotionalConnect
 E1e_Imp_Innovation
E2_Familiar_Powertrac
 1 = Very Familiar
 2 = Moderately Familiar
 3 = Slightly Familiar
 4 = Not Familiar at All
E3_Considered_Powertrac
 1 = Yes, seriously considered
 2 = Yes, briefly considered
 3 = No, never considered
E4_Powertrac_Keywords
In one or more words, describe Powertrac:
Variable Name
Response
Type
Description
E5_Powertrac_vs_Mahindra
1 = Much
better
2 = Slightly
better
3 = Same
4 = Slightly
worse
5 = Much
Compare Powertrac with Mahindra
(can repeat with other brands).
147
Variable Name
Response
Type
Description
worse
E6_Most_Trusted_Brand Text
In your opinion, which tractor brand
is most trustworthy and why?
Section F: Product-Related Attributes (Marketing Mix)
F1 Importance of Features (Rate each from 1 to 5)
 F1a_Imp_HP
 F1b_Imp_Engine
 F1c_Imp_FuelEfficiency
 F1d_Imp_Transmission
 F1e_Imp_Braking
 F1f_Imp_Warranty
 F1g_Imp_ServiceNetwork
 F1h_Imp_DesignLook
 F1i_Imp_SmartFeatures
F2_Info_Sources (Tick all that apply)
 Dealership
 Sales Representative
 Advertisement
 TV/Radio
 YouTube
 Friends/Relatives
148
 Other (Specify)
F3_Imp_DealershipProximity
F4_Imp_Demonstrations
Rate both from 1 (Not Important) to 5 (Extremely Important)
Sustainability & Fuel Efficiency Awareness
Variable Name Response Type Description
F5_Fuel_Type
1 = Diesel
2 = CNG
3 = Electric
4 = Hybrid
Preferred fuel type for
future tractors.
F6_Importance_Fuel_Economy
1 = Not at All
Important to 5 =
Extremely Important
Importance given to
mileage/fuel
efficiency.
F7_Interest_Electric_Tractor
1 = Yes
2 = Maybe
Willingness to consider
electric tractor in future
Section G: Purchase Decision Process
G1_Motivation (Select only one)
 1 = Increase farm productivity
 2 = Replace old tractor
 3 = Expand farming operations
 4 = Reduce labor cost
 5 = Rental to others
149
 6 = Government schemes
 7 = Prestige/modernization
 8 = Advanced techniques
 9 = Other (Specify)
G2_Brands_Considered (Tick all that apply)
 Powertrac
 Mahindra
 Swaraj
 John Deere
 Eicher
 Other
 Did not consider any
G3_Most_Imp_Factor (Select only one)
 1 = Price
 2 = Fuel Efficiency
 3 = After-Sales Service
 4 = Brand Reputation
 5 = Horsepower
 6 = Spares Availability
 7 = Financing Options
 8 = Word-of-mouth
 9 = Dealership Proximity
 10 = Subsidy
 11 = Technology
 12 = Other (Specify)
150
G4_Challenges
List any problems you faced while purchasing the tractor:
Usage & ROI (Return on Investment)
Variable Name Response Type Description
G5_Usage_Hours_Per_Day
Numeric (e.g.,
5)
On average, how many hours per
day do you use the tractor?
G6_Earnings_From_Rental Numeric (₹)
Approximate monthly income from
tractor rental (if any).
G7_Recovery_Period
1 = <1 year
2 = 1–3 years
3 = >3 years
4 = Not yet
recovered
Time to recover investment cost.
Section H: Post-Purchase Behaviour & Satisfaction
H1_Overall_Sat
 1 = Very Dissatisfied
 2 = Dissatisfied
 3 = Neutral
 4 = Satisfied
 5 = Very Satisfied
H2_Sat_AfterSales
 1 to 5 as above
 6 = Not Applicable
151
H3_Sat_Spares
 1 to 5 scale
 H4_Recommend_Brand
 1 = Definitely Not
 2 = Probably Not
 3 = Neutral
 4 = Probably Yes
 5 = Definitely Yes
H5_Buy_Same_Brand
 1 = Very Unlikely
 2 = Unlikely
 3 = Neutral
 4 = Likely
 5 = Very Likely
H6_Improvements
What improvements would you like to see?
After-Sales Service Expectations
Variable Name
Response
Type
Description
H7_Service_Visits
Numeric (0–
10)
Number of service visits within
the first year.
H8_Service_ResponseTime
1 = <1 day
2 = 1–3 days
3 = 4–7 days
Average time taken for service
after a request.
152
Variable Name
Response
Type
Description
4 = More than
7 days
H9_Prefer_Home_Service
1 = Yes
0 = No
Do you prefer on-site (home)
service instead of workshop
visits?
Farmer Support & Satisfaction Programs
Variable Name
Response
Type
Description
H10_Attended_Training
1 = Yes
0 = No
Have you attended any tractor
operation/maintenance training?
H11_Received_Followup_Call
1 = Yes
0 = No
Did the brand/dealer follow up after
your purchase?
H12_Loyalty_Reward_Offered
1 = Yes
0 = No
Were you offered any loyalty
bonus, free service, or reward
program

More Related Content

PDF
2024 Trend Updates: What Really Works In SEO & Content Marketing
PDF
Storytelling For The Web: Integrate Storytelling in your Design Process
PDF
Artificial Intelligence, Data and Competition – SCHREPEL – June 2024 OECD dis...
PDF
How to Leverage AI to Boost Employee Wellness - Lydia Di Francesco - SocialHR...
PDF
2024 State of Marketing Report – by Hubspot
PDF
Everything You Need To Know About ChatGPT
PDF
Product Design Trends in 2024 | Teenage Engineerings
PDF
How Race, Age and Gender Shape Attitudes Towards Mental Health
2024 Trend Updates: What Really Works In SEO & Content Marketing
Storytelling For The Web: Integrate Storytelling in your Design Process
Artificial Intelligence, Data and Competition – SCHREPEL – June 2024 OECD dis...
How to Leverage AI to Boost Employee Wellness - Lydia Di Francesco - SocialHR...
2024 State of Marketing Report – by Hubspot
Everything You Need To Know About ChatGPT
Product Design Trends in 2024 | Teenage Engineerings
How Race, Age and Gender Shape Attitudes Towards Mental Health

Recently uploaded (20)

PDF
6 AI Marketing Myths That Are Slowing You Down & Draining Your Budgets
PDF
Top-Rated Marketplaces to Buy Verified Cash App Accounts Safely.pdf
PPTX
Transform Your Business with Top Digital Marketing Services_EGlogics.pptx
PPTX
Best LLM SEO Tools for B2B Brands in 2025
PPTX
Best Machine & AI Company in India - Digital Navik
DOCX
IREV Platform: Future of Affiliate Marketing
PPTX
Digital-Marketing-Freelancer-The-Future-of-Independent-Marketing.pptx.pptx
PDF
Chapter 8,9.pdfVGGGCFDRGFDXCRFTGDSEDSFCTGHNHGBVHG
PPTX
The Rise of Chatbots in Conversational Commerce.pptx
PDF
Generation Alpha Report 2025 x DKC Analytics.pdf
PDF
2025_Untamed_HuntingIndustryInsights.pdf
PPTX
Segmentation_EM[1]_Powerpoint prese.pptx
PDF
The B2B Startup Marketing Playbook - How To Build A Revenue-Generating B2B Ma...
PPTX
Best Mobile App Development Company in Lucknow
DOCX
FCL vs. LCL Freight Forwarding An Ultimate Handbook for Logistics Experts.docx
PDF
Search Central Live Deep Dive APAC 2025 LT
PDF
Deloitte contemporary marketing-trends-2025.pdf
PPTX
Unit-2 Product Decision (B. Pharmacy) PPT
PDF
Plastic Products-price poster holder pricing board-Loripos.pdf
PDF
digital marketing courses online with od
6 AI Marketing Myths That Are Slowing You Down & Draining Your Budgets
Top-Rated Marketplaces to Buy Verified Cash App Accounts Safely.pdf
Transform Your Business with Top Digital Marketing Services_EGlogics.pptx
Best LLM SEO Tools for B2B Brands in 2025
Best Machine & AI Company in India - Digital Navik
IREV Platform: Future of Affiliate Marketing
Digital-Marketing-Freelancer-The-Future-of-Independent-Marketing.pptx.pptx
Chapter 8,9.pdfVGGGCFDRGFDXCRFTGDSEDSFCTGHNHGBVHG
The Rise of Chatbots in Conversational Commerce.pptx
Generation Alpha Report 2025 x DKC Analytics.pdf
2025_Untamed_HuntingIndustryInsights.pdf
Segmentation_EM[1]_Powerpoint prese.pptx
The B2B Startup Marketing Playbook - How To Build A Revenue-Generating B2B Ma...
Best Mobile App Development Company in Lucknow
FCL vs. LCL Freight Forwarding An Ultimate Handbook for Logistics Experts.docx
Search Central Live Deep Dive APAC 2025 LT
Deloitte contemporary marketing-trends-2025.pdf
Unit-2 Product Decision (B. Pharmacy) PPT
Plastic Products-price poster holder pricing board-Loripos.pdf
digital marketing courses online with od
Ad
Ad

‘’A Comprehensive Study on Tractor Purchase Behaviour among Semi-Urban and Rural Customers in Ranchi, Jharkhand’’

  • 1. 1 ‘’A Comprehensive Study on Tractor Purchase Behaviour among Semi-Urban and Rural Customers in Ranchi, Jharkhand’’ is done for Project Report Submitted in partial fulfilment of the requirement of PONDICHERRY UNIVERSITY for the award of the degree of MASTER OF BUSINESS ADMINISTRATION By NISHANT KUMAR MISHRA REGD NO: 24MBAGEPY0099 Under the guidance of Dr. N. VIJAYANAND Assistant Professor& Project Guide Department of Management Studies Pondicherry University DEPARTMENT OF MANAGEMENT STUDIES SCHOOL OF MANAGEMENT PONDICHERRY UNIVERSITY PONDICHERRY-605014
  • 2. 2 CERTIFICATE This is to certify that this project report titled "A Comprehensive Study on Tractor Purchase Behavior among Semi-Urban and Rural Customers in Ranchi, Jharkhand" done for ESCORT-KUBOTA LIMITED is submitted by NISHANT KUMAR MISHRA REGD NO- 24MBAGEPY0099 , II MBA to the DEPARTMENT OF MANAGEMENT STUDIES, SCHOOL OF MANAGEMENT, PONDICHERRY UNIVERSITY in partial fulfilment of The requirements for the award of the degree of MASTER OF BUSINESS ADMINISTRATION and is a record of an original and bonafide work done under the Guidance of DR.N.VIJAYANAND Professor, Department of Management Studies, Pondicherry University. The report represents an independent and original work on the part of the candidate. Dr. R. Kasilingam Dr. N. VIJAYANAND Professor and HOD Assistant Professor & Project Guide Dept of Management Studies Dept of Management Studies School of Management School of Management Pondicherry University. Pondicherry University Project VIVA VOCE Examiner: Date: Place: Pondicherry University, Student signature
  • 3. 3 DECLARATION I hereby declare that the project titled "A Comprehensive Study on Tractor Purchase Behavior among Semi-Urban and Rural Customers in Ranchi, Jharkhand" is an original work done by me under the guidance of DR. N. Vijayanand, Professor, Department of Management Studies, Pondicherry University. I take full responsibility for the originality of this report. I am aware that I may have to forfeit the degree of plagiarism has been detected after the award of the degree. Notwithstanding the supervision provided to me by the Faculty Guide, I warrant that any alleged acts of plagiarism in this project report are entirely my responsibility. Pondicherry University and/or its employees shall under no circumstances whatsoever be under any liability of any kind in respect of the aforesaid acts of plagiarism. NISHANT KUMAR MISHRA REGD NO-24MBAGEPY0099 Session 2024-26 Department of management studies School of management Pondicherry University Date: Place: Pondicherry -605014.
  • 4. 4 ACKNOWLEDGEMENT I would like to express my sincere gratitude to all those who have contributed to the successful completion of this project. First and foremost, I am deeply grateful to my esteemed guide, Dr. N. VIJAYANAND Professor, Department of Management Studies, Pondicherry University, for his invaluable guidance, support, and encouragement throughout the project. His insightful feedback and constructive criticism helped me refine my research and present it in a comprehensive manner. I would also like to thank Dr. R. Kasilingam, Head of the Department of Management Studies, Pondicherry University, for providing the necessary resources and fostering a conducive learning environment that facilitated this research. Furthermore, I extend my appreciation to Department of Management Studies, Pondicherry University for granting me the opportunity to undertake this project. Finally, I am thankful to my family and friends for their unwavering support and understanding during the course of this project. Their encouragement kept me motivated throughout the journey. NISHANT KUAMR MISHRA REGD NO-24MBAGEPY0099, MBA (II Year), 2024-26 Pondicherry University.
  • 5. 5 ABSTRACT The agricultural sector in India is rapidly evolving, with mechanization becoming increasingly vital for productivity and efficiency. Among various tools, tractors play a crucial role in transforming traditional farming practices. This study aims to explore and analyse the key factors influencing tractor purchase behaviour among semi-urban and rural customers in Ranchi, Jharkhand. Through a structured questionnaire and data collected from 80 respondents, this research investigates socio-demographic variables, economic considerations, brand preferences, financing options, and information sources that impact purchasing decisions. The study uses descriptive statistics, cross-tabulations, and hypothesis testing to draw insights into how farmers make decisions regarding tractor ownership. It also highlights differences in behaviour between semi-urban and rural segments. Findings reveal that affordability, brand reputation, after-sales service, and availability of financing are major decision drivers. Moreover, demographic factors such as age, education, landholding size, and income significantly influence customer preferences and satisfaction levels. Primary data was collected using a structured questionnaire administered to 80 respondents, including farmers and tractor owners. Data analysis was performed using descriptive statistics, cross-tabulations, and hypothesis testing through Excel. The findings show that NBFCs play a dominant role in tractor financing, with a significant number of buyers relying on seasonal repayment plans. Most farmers prefer medium HP tractors (41–50 HP) for multi-purpose use, including both agricultural and transport functions. Influencers such as local dealers and peer farmers significantly impact purchase decisions. Awareness about government subsidies remains limited among buyers. The study offers practical implications for tractor manufacturers, dealers, and policymakers, suggesting improvements in financing schemes, awareness programs, and service support systems in rural Jharkhand.
  • 6. 6 LIST OF CONTENT S.NO. TOPIC. PAGE NO. 1 INTRODUCTION 7 2 INTERNSHIP INTRODUCTION 8 3 PROBLEM STATEMENT 9 4 LITERATURE REVIEW 10-12 5 BACKGROUND OF STUDY 13 6 OBJECTIVE OF STUDY 14 7 SCOPE OF STUDY 15 8 INDIAN AGRICULTURE SECTOR 16-18 9 ROLE OF TRACTORS 19-22 10 FINANCING IN PURCHASE OF TRACTOR 23-25 11 TRACTOR INDUSTRY 26-36 12 DEALERSHIP DETAILS 37-39 13 COMPANY PROFILE 40-51 14 CONSUMER BEHAVIOUR THEORIES 52-63 15 RURAL MARKETING 64-67 16 RESEARCH METHOLOGY 68-71 17 STIMULATED DATA AND INTERPRETATION 72-102 18 FINDING AND DISCUSSION 103-105 19 FINDINGS OF STUDY 106-118 20 HYPOTHESIS 119-129 21 NEED FOR IMPROVEMENT 130 22 SUGGESTIONS 131 23 SUMMARY AND FUTURE SCOPE 132-134 24 CONCLUSION AND RECOMMENDATIONS 135-137 25 LIMITATIONS 138 26 BIBLIOGRAPHY 139 27 DETAILED QUSTIONNAIRE 140-152
  • 7. 7 INTRODUCTION Agriculture has always been the backbone of the Indian economy, employing nearly half of the nation's workforce and contributing significantly to rural livelihoods. In recent years, the mechanization of agriculture has emerged as a vital step towards improving productivity, efficiency, and sustainability in farming practices. Among various agricultural machines, the tractor stands as the most essential and versatile equipment—serving not only as a tool for ploughing fields but also as a symbol of progress and self-reliance for farmers across the country. In a state like Jharkhand, where agriculture continues to be the primary occupation in both semi-urban and rural areas, the need for efficient farm machinery is more pronounced. However, despite the growing awareness of modern techniques, tractor adoption remains uneven across regions. Factors such as income levels, landholding patterns, education, accessibility to financing, brand perception, and the influence of dealers or peer recommendations play a crucial role in shaping a farmer’s decision to purchase a tractor. The district of Ranchi, being both agriculturally rich and demographically diverse, provides a unique setting to study these dynamics. Semi-urban farmers may have better exposure to brands and financing options, while rural farmers often rely on traditional methods and local influencers. Understanding their purchase behaviour, preferences, constraints, and motivations is essential not just for tractor manufacturers but also for policymakers, agricultural extension services, and financial institutions aiming to serve this segment better. This project, therefore, undertakes a comprehensive study of tractor purchase behaviour among semi-urban and rural customers in Ranchi. It aims to identify key factors affecting their decisions, examine differences across demographic segments, assess brand preferences, and evaluate the role of financing and government schemes. The findings of this research are intended to provide valuable insights to stakeholders for formulating customer-centric strategies, improving rural outreach, and enhancing agricultural mechanization in the region.
  • 8. 8 INTERNSHIP INTRODUCTION This internship program is to grant the students with real time working experience and to prepare them to participate in the field work opportunity, to explore and to link between academic preparation and field work for the students, and to help participants in the development and implementation of the major research project, which will serve to culminate in the practical experience. Individual training is customized to the requirements and benefit of each student in the program. As component of the training experience, students should play an active role in finding suitable training for them. Internship provides a different opportunity for students during training programs to expand familiarity in choosing their field, to discover out what they have in importance in a strict line of business, and to develop professional network links, develop the Personal skills or get some credit points. Internship at powertrac tractors dealership is focused on analyzing and understanding the stage of consumer knowledge in relation to company products and the study focuses on industry analysis and the requirements of the organization and understanding the current market situation and anticipate the customer to raise the intensity of awareness of the company to enhance sales and get the utmost advantage. The current business circumstances are characterized by a large amount of competition. Customers in the current days are willing to change brand seek for the best value services. To attract and retain the organization's customers needed to focus on providing what the needs and values of customers. Any business does not specify the customer because the consumer is the king. The goal of each entity is to increase consumer awareness and consumer fulfillment to the optimum as it is necessary for long-term growth to be profitable. Each organization strives to reach the highest level of customer knowledge. You cannot predict customer behavior. This dynamic client needs the reason for the emergence of a separate study area recently. The learning was conceded for the "customer awareness".
  • 9. 9 PROBLEM STATEMENT There is a critical lack of region-specific studies that analyze how these socio- economic, behavioral, and psychological factors influence farmers’ purchase decisions. This research gap hinders manufacturers, policymakers, and financial institutions from developing effective strategies to meet the needs of these communities. Therefore, a comprehensive study is needed to explore and understand the tractor purchase behavior of rural and semi- urban customers in Ranchi In others words, In Ranchi, Jharkhand, the tractor purchase behavior of semi-urban and rural farmers is shaped by a range of economic, social, and psychological factors. However, these influences remain insufficiently studied at the local level. This lack of region-specific insights makes it difficult for tractor manufacturers, marketers, and policymakers to create targeted solutions that meet the actual needs, preferences, and constraints of these farmers it will help. In designing effective strategies that truly address the needs and expectations of these farming communities Research Questions 1. What are the key factors influencing tractor purchases among farmers in Ranchi? 2. How do economic, social, and psychological factors differ between semi-urban and rural consumers? 3. What role do brand perception, post-purchase satisfaction, and digital comfort play? 4. How do social and psychological aspects shape brand choice and purchase timing? 5. To what extent do economic constraints and subsidy schemes impact purchase decisions? 6. Are customers satisfied with the post-purchase services and product performance?
  • 10. 10 LITERATURE REVIEW 1. Bhushan, M. (2020) – “Tractor Penetration and Consumer Preferences in Rural India” – Agri-Marketing Journal o Abstract: Investigated the tractor market landscape in rural Madhya Pradesh and Jharkhand, highlighting preferences for fuel efficiency, service availability, and brand trust. o Relevance: Offers rural consumer preference insights applicable directly to Ranchi-based customer behavior. 2. Gupta, R., & Sharma, P. (2021) – “Impact of Brand Loyalty in the Tractor Industry” – Rural Economy Studies o Abstract: Found that consistent service experience and positive past performance create deep-rooted brand loyalty in rural consumers. o Relevance: Strengthens the connection between after-sales service and long- term loyalty. 3. Patel, N. (2019) – “Dealer Influence and Rural Customer Conversion” – International Marketing Review o Abstract: Studied 120 dealerships in Bihar and Jharkhand, concluding that local dealership behavior, relationship, and service trust were key decision influencers. o Relevance: Directly supports the variable “dealer influence” in your correlation analysis. 4. Saxena, A. (2022) – “Technology Adoption in Tractor Purchase Decisions” – Indian Journal of Agricultural Marketing o Abstract: Revealed that younger farmers and semi-urban consumers show higher receptiveness to newer features and digital tools in tractors. o Relevance: Ties into demographic segmentation and future scope analysis. 5. Das, P. (2020) – “Socioeconomic Factors Influencing Tractor Ownership” – Journal of Rural Sociology o Abstract: Indicates that income level, land size, and subsidy awareness significantly impact tractor purchase likelihood. o Relevance: Supports landholding size and economic factor hypotheses.
  • 11. 11 6. Bhattacharya, S. (2018) – “Marketing Strategy of Tractor Companies in India” – Business Strategy Review o Abstract: Compares Powertrac, Mahindra, and Sonalika strategies across pricing, promotion, and rural reach. o Relevance: Assists in comparative analysis and evaluating rural marketing strategy effectiveness. 7. Mukund, A. (2021) – “Post-Purchase Service as a Brand Equity Builder” – Customer Satisfaction Journal o Abstract: Emphasized that regular servicing, ease of claims, and maintenance assistance boost perceived brand reliability. o Relevance: Validates after-sales service as a major factor in retention. 8. Tiwari, M. & Kumar, D. (2016) – “Brand Awareness and Purchase Intention in Rural Youth” – Youth Marketing Research o Abstract: Showed higher education and mobile penetration improve rural youth awareness of tractor brands and models. o Relevance: Backs education vs. brand awareness correlation. 9. Chavan, H. (2019) – “Seasonal and Crop-Based Demand for Agricultural Machinery” – Agritech India  Abstract: Links crop patterns and seasonal cycles with specific tractor model purchases and horsepower needs.  Relevance: Useful for connecting crop pattern with horsepower preference. 10.Reddy, B. (2020) – “Impact of Agricultural Loans on Tractor Buying Behavior” – Financial Rural Review  Abstract: Analyzed how government and private financing drives demand for mid- range tractors in low-income regions.  Relevance: Supports role of economic aid in influencing buying decisions. 11.Joshi, K. & Meena, V. (2021) – “Factors Affecting Tractor Brand Switching” – Rural Mobility Journal  Abstract: Found that dissatisfaction with service, spare part cost, and fuel efficiency prompted brand switching.
  • 12. 12  Relevance: Helps identify risk factors in brand loyalty. 12.Verghese, R. (2018) – “Field Demonstrations and Their Impact on Purchase Intent” – Marketing Insights India  Abstract: Field demos seen as powerful in triggering trial and intent to buy among rural customers.  Relevance: Suggests practical recommendation for rural marketing strategies. 13.Yadav, M. (2020) – “Trust in Local Dealers as a Purchase Determinant” – Journal of Behavioral Marketing  Abstract: Trust in local dealership staff ranked higher than even product specifications in buyer decision-making.  Relevance: Reinforces dealer influence as a key variable. 14.Rao, T. & Sharma, G. (2022) – “Evaluating Rural Consumer Perceptions Toward Tractor Design and Comfort” – Product Experience Studies  Abstract: Comfort, seat height, dashboard layout, and vibration control became increasingly important, especially for long usage.  Relevance: Adds dimension to physical product preference factors. 15. K. L. Sharma (2015): Dealer trust, Purchas e intention, Word of mouth Abstract: This paper discusses how dealership trust acts as a substitute for brand in rural markets. Using surveys conducted across villages in Uttar Pradesh, the author finds that personal relationships with local dealers often override rational comparison of product features. This is especially true when buyers lack prior experience or product knowledge, making local reputation a crucial factor in buying tractors. 16. Dr. Anju Bhalla (2017): Rural marketing, Brand positioning, Semi-urban behavior Abstract: The research focuses on the positioning strategies used by brands like Powertrac and Mahindra in semi-urban belts. The findings show that emotional advertising and region- specific messaging influence consumer response more than traditional price-based ads. The paper suggests rural markets are more responsive to personalized, trust-based positioning than to national-level branding.
  • 13. 13 BACKGROUND OF STUDY  Agricultural mechanization plays a vital role in improving productivity and reducing manual labour in farming. In India, tractors are among the most essential and widely used machines, significantly contributing to the development of agriculture.  Agricultural mechanization has emerged as a key driver of productivity, efficiency, and modernization in the farming sector. Among various machines used in agriculture, tractors play a central role due to their multi-purpose functionality—ranging from tilling and sowing to transporting goods.  In India, where agriculture remains a dominant livelihood source, tractors symbolize both economic empowerment and technological adoption.  The tractor market in India is one of the largest globally, yet its penetration varies significantly across regions. Jharkhand, being a primarily agrarian state, has witnessed growing adoption of tractors.
  • 14. 14 OBJECTIVES OF THE STUDY  To study the awareness of brand of tractors in RANCHI, JHARKHAND  To analyze the consumer preference on tractor.  To analyze the financing problems on tractor.  To analyze the factors involved in purchase behavior on tractor  To find out any more improvements to be done to the present vehicle i.e. POWERTRAC TRACTORS.  To evaluate consumer satisfaction of POWERTRAC TRACTORS.  To find which source of advertisement have more impact on consumers.  To recommend marketing and policy strategies based on consumer insights.
  • 15. 15 SCOPE OF STUDY The main aim of this study is to find how rural marketing strategy of powertrac tractor affect customers and factors involved in purchasing decision towards tractors in semi- urban and rural parts of India And marketing strategies adopted by Powertrac Tractors influence consumer behavior and purchasing decisions among customers in semi-urban and rural regions of India, with a specific focus on Ranchi, Jharkhand. The research aims to identify key economic, psychological, and situational factors that drive tractor purchases, such as affordability, brand trust, availability of finance, dealer networks, after-sales service, and product features. This study also examines how well Powertrac’s marketing efforts align with the actual needs, preferences, and challenges faced by farmers in these areas. By doing so, it provides insights that can help tractor manufacturers, marketers, and policymakers formulate more effective rural marketing strategies and improve customer satisfaction and brand loyalty. SIGNIFICANCE OF THE STUDY This study will help:Tractor companies optimize products  Policymakers improve schemes  Researchers better understand rural buyer behaviour  Help manufacturer’s design location-specific marketing and product strategies.  Assist policymakers in tailoring agricultural subsidy and support schemes.  Contribute to academic literature on rural consumer behaviour and agricultural economics.
  • 16. 16 Indian Agriculture Sector: An Overview Introduction The agriculture sector in India is a crucial part of the country's economy, contributing significantly to employment, food security, and rural development. It is often referred to as the "backbone of the Indian economy" because it supports over half the population directly or indirectly. Key Statistics (As of 2024): Parameter Data/Fact Contribution to GDP ~16% Employment ~42% of the total workforce Gross Cropped Area ~195 million hectares Major Crops Rice, Wheat, Maize, Sugarcane, Cotton Largest Agricultural State Uttar Pradesh (in production value) Export Contribution ~10% of total exports Importance of Agriculture in India  Livelihood Source: 70% of rural households depend on agriculture.  Food Security: Ensures supply for 1.4+ billion people.  Raw Materials: Supplies to industries like textiles, sugar, and food processing.  Exports: Contributes to foreign exchange through rice, spices, tea, etc.  Socio-Economic Impact: Vital for inclusive rural development.
  • 17. 17 Government Schemes & Support Scheme Objective PM-KISAN ₹6,000 per year to small farmers PM Fasal Bima Yojana Crop insurance against natural disasters eNAM Online trading platform for agricultural produce PM Krishi Sinchai Yojana Irrigation facilities and water-use efficiency Kisan Credit Card (KCC) Short-term credit to farmers at subsidy rates Technological Interventions  Use of Drones & IoT – For crop monitoring and precision agriculture  Mobile Apps (e.g., Kisan Suvidha) – For weather updates, mandi prices  Agri-Startups – Helping in farm-to-fork models, supply chains, advisory  Mechanization – Tractor, harvester, seeders usage on the rise Challenges in Indian Agriculture Challenge Explanation Land Fragmentation Small and scattered land holdings Low Productivity Yield per hectare is lower than global averages Water Scarcity Over-dependence on monsoon; poor irrigation coverage Price Volatility Fluctuating MSPs and market rates
  • 18. 18 Challenge Explanation Supply Chain Gaps Post-harvest losses due to poor storage, cold chains Climate Change Impact Rising temperature and irregular rainfall Role in Rural Development  Employment Generation  Women Participation in Agriculture  Boost to Allied Activities (Dairy, Poultry)  Rural Infrastructure Development  Agri-entrepreneurship Recent Developments (2023-24)  Launch of Digital Agriculture Mission  Expansion of eNAM to more mandis  Rising adoption of Organic and Natural Farming  Agri-Drone Subsidy Scheme to encourage smart farming  Emphasis on Millets (2023 as International Year of Millets) Indian agriculture is transitioning from traditional, subsistence farming to modern, technology-driven agribusiness. While it remains the lifeline of rural India, it must overcome productivity, sustainability, and market linkage challenges to ensure inclusive growth and global competiveness.
  • 19. 19 Role of tractors in Indian agriculture Tractors in Indian Agriculture: A Vital Mechanization Tool Introduction Tractors have revolutionized Indian agriculture by reducing dependence on manual and animal labour. They are a core component of farm mechanization, enhancing productivity, efficiency, and speed in agricultural operations. Key Statistics Metric Data (Approx.) India’s Rank in Tractor Market 1st in the world (25-30% of global production) Annual Tractor Sales (2023) ~9.5 lakh units Major Tractor States Uttar Pradesh, Maharashtra, Rajasthan, Madhya Pradesh Farm Mechanization Level Around 45% (urban farms more mechanized than rural farms) Popular Horsepower Range 31–50 HP (ideal for small/mid-sized farms in India)
  • 20. 20 Importance of Tractors in Indian Agriculture Area Contribution of Tractors Land Preparation Ploughing, tilling, leveling Sowing/Planting Used with seed drills or sowing equipment Inter-Cultivation Weeding and other crop care operations Harvesting Support Haul harvested crops, attach harvest tools Transport Move goods, produce, fertilizers, water, etc. Multi-purpose Utility Can be used with more than 20+ types of agricultural implements Impact on Agricultural Productivity  Reduces Time and Labour Costs  Enables Timely Farm Operations (especially sowing/harvesting)  Improves Efficiency and Crop Yields  Increases Cropping Intensity (double/triple cropping)  Supports Large and Small Farmers (with appropriate HP)
  • 21. 21 Factors Influencing Tractor Purchase Behaviour in Rural India Factor Explanation Farm Size Larger farms prefer high-HP tractors; small farms choose compact models Economic Status Cost of tractor vs family income; many rely on loans/subsidies Subsidy Availability PM-Kisan and state-specific schemes make tractors affordable Brand Reputation Trust in brands like Mahindra, Swaraj, Sonalika, John Deere Service & Spare Availability After-sales service, proximity of dealer Community Use/Sharing Many small farmers share or rent tractors Leading Tractor Brands in India Brand Name Highlights Mahindra & Mahindra Largest tractor manufacturer in India and globally Swaraj Tractors Known for rugged rural reliability Sonalika Tractors Strong presence in northern and eastern India John Deere Premium segment, known for technology and precision TAFE (Massey Ferguson) Popular for medium and high-power tractors Escorts (Powertrac, Farmtrac) Affordable and efficient models
  • 22. 22 Challenges in Tractor Usage in Rural India Challenge Details High Initial Cost Even entry-level tractors can cost ₹4–7 lakhs Small Land Holdings Not viable for ultra-small/marginal farmers Maintenance Cost Fuel, servicing, and spare parts cost Lack of Training Many farmers don't fully utilize advanced tractor features Underutilization Used for only a few months; rest of the time remains idle Innovations & Trends in Tractor Technology  Mini Tractors (15–30 HP) for small and hilly farms  Electric Tractors – Emerging segment for sustainable farming  GPS-enabled Precision Farming  Smart Dashboards and Automation Features  Rental Apps & Online Booking (e.g., Trringo, EM3 Agri) Tractors play a critical role in transforming Indian agriculture by enabling timely, efficient, and large-scale farm operations. As rural incomes rise and government support strengthens, tractor penetration is expected to grow, especially through rentals, group ownership, and innovation in low cost models.
  • 23. 23 Financing in Purchase of Tractors in India: An Overview In India, tractors are high-investment assets, especially for small and marginal farmers. Financing options play a crucial role in enabling these farmers to purchase tractors by reducing the burden of upfront capital expenditure. Around 70–80% of tractors sold in India are financed, highlighting the critical role of credit and subsidies in rural agricultural mechanization. Key Stakeholders in Tractor Financing Financing Agency Description Public Sector Banks SBI, Bank of Baroda, PNB – offer tractor loans with subsidy support Private Banks HDFC, ICICI – offer competitive interest rates and faster processing NBFCs (Non-Banking Finance Companies) Mahindra Finance, L&T Finance, Sundaram Finance – very active in rural markets Co-operative Banks Accessible to rural communities, but may have slower processing Microfinance Institutions Provide small loans, sometimes to SHGs or farmer groups Tractor Dealerships Some provide in-house financing or partner with banks/NBFCs Tractor Loan: Features and Terms Feature Typical Value / Range Loan Amount 70–90% of on-road cost of the tractor
  • 24. 24 Feature Typical Value / Range Interest Rate 8% to 18% per annum (varies by lender and credit score) Tenure 3 to 7 years Repayment Frequency Monthly, quarterly, or seasonal (post-harvest) Collateral Required Hypothecation of the tractor; sometimes land papers Processing Time 7–15 working days (faster in NBFCs) Margin Money Farmer typically pays 10–30% of the total cost upfront Eligibility Criteria for Tractor Loans  Indian resident, typically aged 18–60  Must be a farmer, rural entrepreneur, or someone involved in agri-based activity  Minimum landholding requirement in some schemes (especially for subsidy eligibility)  Basic KYC documents, income proof, land ownership documents, or crop receipt . Government Subsidy & Support Schemes Scheme / Program Benefits Sub-Mission on Agricultural Mechanization (SMAM) Up to 40–50% subsidy on tractors for small/marginal farmers PM Kisan Tractor Yojana State-specific schemes with direct subsidies Custom Hiring Centres (CHCs) Group-based tractor access with financing assistance NABARD Refinance Scheme Refinancing support to banks offering agricultural loans State Government Schemes Vary by state – Jharkhand, Bihar, etc., offer specific subsidy rates
  • 25. 25 Role of NBFCs in Tractor Financing  Cater specifically to rural and semi-urban customers  Provide doorstep service, vernacular documentation, and flexible repayment  Less stringent documentation than banks  High penetration in states like UP, MP, Bihar, Jharkhand Example: Mahindra Finance – finances nearly 1 out of every 4 tractors sold in India. Challenges in Tractor Financing Challenge Description Low Credit Awareness Many farmers unaware of subsidy/loan eligibility Documentation Issues Lack of land papers, PAN card, income proof Seasonal Income Pattern Affects regular EMI repayment – need for flexible schedules Dependence on Informal Credit Preference for local moneylenders despite higher interest Delayed Subsidy Disbursement Government subsidy delay affects final payment and loan closure
  • 26. 26
  • 27. 27 INDUSTRY Market Size and Growth:  The Indian tractor market was valued at approximately USD 8.4 billion in 2025 and is projected to reach USD 15.3 billion by 2034, growing at a CAGR of 7.0%. (Dimension Market Research)  Another report estimates the market at USD 8.81 billion in 2025, expected to reach USD 12.67 billion by 2031 with a CAGR of 6.25%. (TechSci Research)  The market is poised for robust growth from 2024 to 2030, with a projected CAGR of 5.55%, exceeding USD 2.6 billion by 2030. (Mobility Foresights) Key Drivers:  Rising Farm Mechanization: There's a growing adoption of mechanized farming practices to address labor shortages, enhance productivity, and increase crop yields. Tractors are central to operations like ploughing, sowing, and harvesting. (TechSci Research, GII Research)  Government Support and Subsidies: Various central and state government initiatives, such as the Sub-Mission on Agricultural Mechanization (SMAM) and state-specific subsidies on farm equipment, make tractors more affordable and accessible to small and marginal farmers. These programs aim to reduce financial burdens and promote the adoption of modern tools. (TechSci Research, GII Research, Energetica India)  Diversification of Tractor Use: Farmers are increasingly using tractors for non- agricultural purposes like construction and haulage, expanding the market scope. (Dimension Market Research, TechSci Research) Market Segmentation and Trends:  Drive Type: 2-Wheel Drive (2WD) tractors are projected to maintain dominance, capturing a significant market share (e.g., 63.1% in 2025). (Dimension Market Research)  Horsepower (HP) Segments: o The 31-40 HP segment currently dominates the Indian market, catering to small and medium-sized farms. (Dimension Market Research)
  • 28. 28 o Demand for 30-50 HP tractors is widely preferred due to their suitability for soft soil conditions, customization options, and lower fuel consumption, making them ideal for small landholdings. (GII Research) o However, there's growing demand for tractors with more than 50 HP for larger farm operations and non-agricultural use. (Dimension Market Research) o Mini & Compact tractors (15-50 HP) hold almost 90% market share in India. (Mobility Foresights) Key Players:  Mahindra & Mahindra Limited (including Swaraj Tractors): The largest tractor manufacturer in India and globally, known for its wide range of HP categories and strong market presence. (Tractor Junction, Green Vision Technical Services, TractorForeveryone, TractorGyan)  TAFE (Tractors and Farm Equipment Ltd.): A significant player, known for brands like Massey Ferguson and Eicher. (Tractor Junction, Green Vision Technical Services, TractorForeveryone)  International Tractors Ltd. (Sonalika Tractors): A prominent manufacturer known for powerful engines and advanced features. (Tractor Junction, Green Vision Technical Services, TractorForeveryone, TractorGyan)  Escorts Kubota Limited (Farmtrac, Powertrac, Escorts): A strong contender in the market. (Tractor Junction, Green Vision Technical Services, TractorForeveryone, TractorGyan)  John Deere India Private Limited: A global name bringing advanced technology and comfort to Indian fields. (Tractor Junction, Green Vision Technical Services, TractorForeveryone, TractorGyan) Sales Statistics (Recent Trends):  FY 2024-25: Retail tractor sales decreased by 1.04%, with 8,83,095 units sold compared to 8,92,410 units in FY'24. (Tractor Junction)  December 2024 (Domestic Sales): Saw a significant rise of 13.97%, with 50,986 units sold compared to 44,735 in Dec 2023. Mahindra & Mahindra Group, Sonalika, and John Deere showed strong growth in this period. (Tractor Junction)
  • 29. 29  August 2024: Tractor sales in India declined by 11.38%, with 65,478 units sold compared to 73,892 in August 2023. While major players like Mahindra and TAFE saw declines, Sonalika and John Deere experienced marginal growth. (Global Agriculture) Challenges:  Fragmented Land Holdings: Over 80% of Indian farmers have less than 2 hectares of land, which can make large tractor ownership economically unviable. This drives demand for compact tractors and custom hiring. (Dimension Market Research, Mobility Foresights)  Farmer Income Levels and Financing Hurdles: Low disposable income and difficulties in accessing financing (e.g., high interest rates, lack of credit history) remain significant barriers for many farmers. (Mobility Foresights, ET Auto)  Lack of Awareness and Skilled Manpower: Insufficient awareness about modern farm machinery and a shortage of skilled labor for operation and maintenance can hinder adoption. (GII Research, Energetica India) Opportunities:  Growth in Electric Tractors: While facing challenges, electric tractors offer a promising avenue for sustainable agriculture, driven by environmental concerns and government promotion of EVs in rural sectors. Policy advocacy, collaborations for component manufacturing, and green financing can accelerate their adoption. (Energetica India)  Expanding Commercial Applications: The increasing use of tractors in non- agricultural sectors like construction and haulage offers a diversified revenue stream. (Dimension Market Research)  Focus on Compact Tractors: The large number of small and fragmented landholdings in India creates a strong market for compact and mini tractors, which are more suited for such operations. (Mobility Foresights)  Development of Digital Platforms and Smart Dealer Networks: These can influence buying behavior and service delivery, improving accessibility for farmers. (TechSci Research)
  • 30. 30  Increasing Crop Yields: Smart farming technologies integrated with advanced tractors can significantly increase crop yields, encouraging further investment. (TechSci Research) The Indian tractor industry had its best year for retail sales in 2024 as 894,112 units were sold, according to new figures from apex dealer body, the Federation of Automobile Dealers Associations (FADA). However, this translates into nominal 2.55% year-on-year growth (CY2023: 871,918 units) nd an additional 22,194 units. In CY203, OEMs had sold an additional 57,955 units and posted 7.13% YoY growth. A quick compilation of the past six years’ tractors retails reveals that 4.71 million units have been sold in India with the industry recording consistent growth (see data table below). Sales crossed the 800,000 milestone for the first time in CY2022 (813,923 units), rose to 871,918 units in CY2023 and have not scaled a new high in CY2024 (894,112 units). Tractor makers notched their best-ever sales in CY2024 but missed achieving the 900,000 milestone in CY2024 by a whisker: just 5,888 units. FADA’s OEM-wise sales split of the industry shows that market leader Mahindra & Mahindra (Tractor Division and Swaraj Tractors) have further increased their grip on the tractor market. With combined sales of 375,078 units in CY2024, the YoY increase was 6.12% (CY2023: 353,445 units). This gives M&M Tractors a market share of 42%, up from the 40.5% it had in CY2023. Escorts Kubota is ranked fourth with annual sales of 87,444 units, down 3.54% YoY (CY2023: 90,660 units). As a result of fewer YoY sales in CY2024, its market share has also dropped to 9.78% from 10.40% in CY2023.
  • 31. 31 John Deere India has had a good year with sales of 67,219 units, up 3.54%, which is reflected in its market share rising to 7.52% from 7.45% a year ago. Eicher Tractors too did well with sales of 56,621 units last year, up 5% on CY2023’s 56,621 units, its market share improving to 6.65 percent. Industry poised to farm significant growth in CY2025 Having closed CY2024 with a strong performance in December (99,292 units, up 25.7% YoY Tractor Sales Cross 1 lakh Mark after 7 Months Strong monsoon and farm optimism fuel 10.5% sales surge, exports rise nearly 7%.
  • 32. 32 India’s domestic tractor industry recorded a strong performance in June 2025, selling 1.13 lakh units—10.5% more than last year—according to data from the Tractor and Mechanization Association. This is the first time monthly sales have crossed the 1 lakh mark since October, when they were at 1.45 lakh. Industry leaders attributed the growth to widespread monsoon coverage and healthy rural sentiment. Tractor exports also rose 6.8% on-year to 8,936 units, also translating to a 24.5% month-on-month increase. With this, first half 2025 tractor sales are up 12.4% at 4.87 lakh. June’s performance follows signs of recovery seen earlier in the year. In March 2025, domestic sales rose 25.4% on-year to 79,946 units, supported by the onset of the Indian New Year and festive buying. In June, Mahindra & Mahindra’s Farm Equipment Business continued its strong momentum, recording domestic sales of 51,769 units—up 13% from 45,888 units in June 2024. Total sales, including exports, stood at 53,392 units, compared to 47,319 in
  • 33. 33 the year-ago period. The company exported 1,623 tractors during the month, also registering 13% growth on-year. For the January–June 2025 period, Mahindra’s domestic sales reached 129,199 units, marking a 10% increase over 116,930 units sold in the same period last year. Escorts Kubota Ltd. reported a mixed performance in June 2025, with total tractor sales rising 2.2% on-year to 11,498 units, up from 11,245 units in June 2024. Domestic sales saw a marginal decline of 0.1% to 10,997 units, while exports surged 114.1% to 501 units from 234 units a year ago. The tractor industry had achieved record-breaking sales in the financial year 2023, a benchmark that is yet to be surpassed. In 2022-23, the industry clocked a sales volume of 9.45 lakh units. However, the sales declined 7% in the following financial year to 8.76 lakh units Credit ratings agency CRISIL also projects that higher minimum support prices for key cash crops, better replacement and construction demand amid hopes of above- normal monsoon are likely to drive domestic tractor sales to hit an all-time high of
  • 34. 34 around 975,000 units in 2025-26, growing at 3-5 per cent.Tractor Sales in India Likely to Touch 9.75 Lakh Units in FY26: CRISIL Ratings. According to CRISIL Ratings, domestic tractor sales in India are expected to reach approximately 9.75 lakh units in fiscal 2026, representing a 3-5% increase over the previous year. The projected growth is attributed to a combination of factors, including the likelihood of an above-normal monsoon, a possible increase in minimum support prices (MSPs) for key crops, and steady demand from the replacement and construction segments. Sales are expected to surpass the previous high of 9.45 lakh units recorded in fiscal 2023, following a 7% increase observed in fiscal 2025. CRISIL’s analysis suggests that pre-buying activity in the final quarter of fiscal 2026—prior to the implementation of the new TREM V emission norms from April 1, 2026—may also contribute to the rise in volumes.
  • 35. 35 :
  • 36. 36
  • 37. 37 DEALERSHIP DETAILS N B ENTERPRISES TILTA, NEAR RING ROAD CHOWK, 834001 [email protected] +919431595443 Powertrac is a prominent tractor brand in India, manufactured by Escorts Kubota Limited. Known for its robust and fuel-efficient tractors, Powertrac offers a wide range of models catering to diverse farming and commercial needs. Here are some key notes on Powertrac tractors: Manufacturer and Market Position:  Powertrac is a sub-brand of Escorts Kubota Limited (EKL). EKL aims to become the number two player in the Indian tractor market by combining Escorts' cost competitiveness with Kubota's technology and quality strengths.  Currently, EKL (which includes Powertrac, Farmtrac, and Kubota brands) holds a significant market share in India, aiming to expand its presence further. Key Features and Technology:  Engine Range: Powertrac tractors are available in a wide horsepower (HP) range, typically from 25 HP to 60 HP, with some models extending beyond.  Fuel Efficiency: Many Powertrac models incorporate "Diesel Saver Technology" to enhance fuel efficiency, a crucial factor for Indian farmers.  Versatility: They are designed for a variety of applications, from routine yard work and basic farming tasks like ploughing and tilling to challenging haulage and infrastructure jobs.  Durability and Build Quality: Powertrac tractors are known for their strong and durable build, using high-quality materials for longevity and reduced maintenance needs.
  • 38. 38  Hydraulics: Equipped with efficient hydraulic systems, they offer good lifting capacity (ranging from 750 kg to 2000 kg), making them compatible with various agricultural implements.  Steering and Brakes: Most models offer power steering options for ease of operation and come with multi-plate oil-immersed disc brakes for effective control and reduced slippage.  Operator Comfort: Features like ergonomic seating and well-designed control platforms aim to enhance operator comfort during long working hours.  Advanced Features (in higher-end models): Some models incorporate modern technologies like advanced hydraulics with automatic draft control and options for dual clutches. Popular Series and Models: Powertrac offers several popular series, each designed for specific needs:  Powertrac Euro Series: This series is known for being versatile and compatible with all types of farm equipment. It includes models like the Euro 50, Euro 60, Euro 42 Plus, and Euro G28, available in both 2WD and 4WD options.  Powertrac DS Series (Diesel Saver): Focuses on fuel efficiency and economical operation. Popular models include Powertrac 439 DS Super Saver, 434 DS Super Saver, and 425 DS.  Powertrac ALT Series: These are multi-utility tractors, with models like ALT 3000, ALT 3500, and ALT 4000, ranging from 30 HP to 47 HP.  Powertrac Next Series: Often highlighted for its affordability and value for money, with models like Powertrac Euro 60 Next.  Powertrac Powerhouse Series: Combines power and efficiency, suitable for both agriculture and transportation. Examples include Powertrac 439 Plus Powerhouse and Euro 47 Powerhouse. Price Range (as of July 2025):  The price of Powertrac tractors in India generally starts from around ₹4.60 Lakh and can go up to ₹10.70 Lakh (Ex-showroom prices, subject to change based on model, features, and location).
  • 39. 39  The most affordable model can be around ₹5.19 Lakh (e.g., Powertrac ALT 3500), while the most expensive can be the Powertrac Euro 60 Next 4WD. Dealer Network:  Powertrac has a widespread dealer network across India, with over 600 dealers and numerous customer touchpoints, ensuring good accessibility for sales and after-sales service. Key Highlights:  Manufacturer: Escorts Limited (based in Faridabad, Haryana)  Launched: Powertrac series was introduced to offer powerful yet affordable tractors  Horsepower Range: 25 HP to 60+ HP  Popular Models: Powertrac Euro 50, Powertrac 439 Plus, Powertrac 434 DS Super Saver Features & Benefits:  Fuel Efficiency: Designed for optimal mileage—saves fuel on long agricultural tasks  Durability: Strong build and rugged design suitable for tough rural conditions  Affordability: Competitive pricing for small and medium farmers  Versatility: Suitable for ploughing, sowing, threshing, haulage, and other operations  Service Network: Wide service and dealer network across India, including Jharkhand Target Market:  Primarily targets small and marginal farmers in semi-urban and rural areas  Popular in states like Jharkhand, Bihar, UP, and MP due to cost-effectiveness
  • 40. 40 Company Profile: Escorts Limited (Escorts Kubota Limited) Company Name: Escorts Kubota Limited Formerly Known As: Escorts Limited Established: 1944 Headquarters: Faridabad, Haryana, India Website: www.escortsgroup.com VISION  Escorts Kubota Limited shall promote its business in India & in the world to become the No.1 organization that is truly loved and sought after by society and employees.  Escorts Kubota Limited shall become the total solution provider to solve the issues of society for a sustainable world.  Escorts Kubota Limited shall become strategic hub in the world by utilizing the capability & potential of India. MISSION  Establishing measures for sustainable growth in response to issues in mega trends of the world.  Contributing to the creation of a living environment where people (especially, farmers, women and socially vulnerable people) can live comfortably.  Committing to the society in India & in the world by the promotion of further mechanization and providing the total solution
  • 41. 41 OVERVIEW Escorts Kubota Limited is one of India’s leading engineering conglomerates, specializing in agri-machinery, construction equipment, and railway equipment. With a legacy of over seven decades, Escorts has played a pivotal role in transforming India’s agricultural and infrastructural landscape. The company is best known for its high-performance Powertrac, Farmtrac, and Digitrac tractor brands, which are widely used across rural and semi-urban India. In 2022, Escorts Limited entered into a strategic partnership with Kubota Corporation (Japan), resulting in the rebranding to Escorts Kubota Limited. This joint venture aims to blend Indian market expertise with Japanese technological excellence, driving innovation and growth in farm mechanization.
  • 42. 42
  • 43. 43
  • 44. 44
  • 45. 45
  • 46. 46
  • 47. 47 Key Business Divisions 1. Agri Machinery Division (Escorts Agri Machinery – EAM): o Products: Tractors (Farmtrac, Powertrac, Digitrac), tractor attachments o Market: India and exports to over 70 countries o Strengths: Fuel efficiency, rugged design, affordability, after-sales service 2. Construction Equipment Division (ECE): o Products: Cranes, backhoe loaders, compactors o Target: Infrastructure and industrial sectors 3. Railway Equipment Division (RED): o Products: Brake systems, couplers, suspension systems for Indian Railways Key Brands under Escorts Kubota Brand Segment Known For Powertrac Value-for-money tractors High fuel efficiency and ruggedness Farmtrac Premium tractors Power, technology, and performance Digitrac Smart digital tractors Advanced features and digital connectivity Role in Semi-Urban and Rural Markets Escorts Kubota holds a significant presence in semi-urban and rural regions of India, with a strong dealer and service network even in remote districts like Ranchi. The company’s tractor brands—Powertrac, Farmtrac, and Digitrac—are designed keeping in mind the specific needs of small and medium farmers, including affordability, fuel efficiency, rugged performance, and ease of maintenance. In regions like Jharkhand, where fragmented landholding, low purchasing power, and limited access to information prevail, Powertrac has emerged as a popular choice due to its value-for-money proposition. It offers high performance at a competitive price, making it ideal for farmers with constrained resources.
  • 48. 48 Key Contributions to Tractor Affordable Models: Escorts offers tractors in the 25–75 HP range, catering to both small and large-scale farmers.  Credit and Financing Support: The company partners with banks and NBFCs to provide attractive EMI and financing plans for budget-conscious rural farmers.  Dealer Outreach: Escorts has a strong presence through local dealers and mechanics, who are influential in guiding farmer decisions.  After-Sales Service: Reliable and prompt service plays a crucial role in brand loyalty, and Escorts has a reputation for maintaining customer satisfaction.  Field Demonstrations: Escorts regularly conducts field trials and demo events to create awareness and build trust in rural markets.  Government Scheme Support: Escorts dealers often assist farmers in availing government subsidies and schemes, thus acting as a bridge between policy and practice. Escorts vs. Other Brands in Ranchi Region In comparison to brands like Mahindra, Sonalika, and John Deere, Escorts positions itself as a value-driven, farmer-friendly brand with local service support. While Mahindra enjoys strong brand recognition, Escorts competes effectively on price, dealer relationship, and service quality—factors that heavily influence tractor purchase behavior in districts like Ranchi. Escorts Kubota Limited – A Key Player in Rural Tractor Markets Escorts Kubota Limited (formerly Escorts Limited) is a leading Indian engineering company with a rich history dating back to 1944. With its headquarters in Faridabad, Haryana, the company has become one of the most recognized tractor manufacturers in the country. In 2022, Escorts formed a strategic alliance with Japan's Kubota Corporation, giving rise to Escorts Kubota Limited, which blends Indian rural expertise with Japanese precision engineering.
  • 49. 49 The company is known for its strong presence in rural and semi-urban markets, including areas like Ranchi, Jharkhand, where agriculture is the backbone of the local economy. Its tractor brands—Powertrac, Farmtrac, and Digitrac—are designed specifically for small and medium farmers seeking performance, affordability, and easy service access. Escorts Kubota's role in influencing tractor purchase behavior in semi-urban and rural areas is significant. The company understands that farmers in these regions face unique challenges such as limited income, small landholdings, and dependence on local influencers for information. Through its affordable pricing, wide dealer network, service reliability, and financing support, Escorts meets the exact needs of rural farmers in areas like Ranchi. Farmers in Jharkhand often choose Powertrac models due to their cost-effectiveness and fuel efficiency. Meanwhile, semi-urban customers with slightly higher budgets prefer Farmtrac for its advanced features and durability. Escorts’ ability to cater to different segments with localized strategies gives it a competitive edge. The company also supports government agricultural schemes and works closely with financial institutions to ensure easy loan availability for farmers. Its regular field demonstrations, partnerships with Krishi Vigyan Kendras (KVKs), and dealer promotions have helped build strong brand loyalty. Comparative Brand Table: Escorts vs. Other Tractor Brands in Jharkhand Brand Positioning Popular Models Strengths Weaknesses Escorts (Powertrac, Farmtrac) Value-driven + premium segments Powertrac 439, Farmtrac 60 Affordable, fuel- efficient, good rural reach Moderate digital presence in rural marketing Mahindra Market leader in India 575 DI, Yuvo series Strong brand, high resale value, widespread Higher cost, service inconsistency in interiors
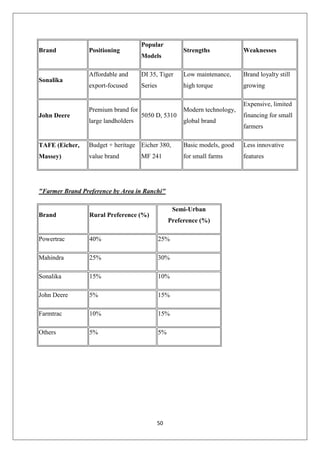
  • 50. 50 Brand Positioning Popular Models Strengths Weaknesses Sonalika Affordable and export-focused DI 35, Tiger Series Low maintenance, high torque Brand loyalty still growing John Deere Premium brand for large landholders 5050 D, 5310 Modern technology, global brand Expensive, limited financing for small farmers TAFE (Eicher, Massey) Budget + heritage value brand Eicher 380, MF 241 Basic models, good for small farms Less innovative features "Farmer Brand Preference by Area in Ranchi" Brand Rural Preference (%) Semi-Urban Preference (%) Powertrac 40% 25% Mahindra 25% 30% Sonalika 15% 10% John Deere 5% 15% Farmtrac 10% 15% Others 5% 5%
  • 51. 51
  • 52. 52 Consumer Buying Theories 1.The Economic Model of Consumer Behavior Core Idea: This model assumes that consumers are rational decision-makers who aim to maximize utility (satisfaction) from their limited income. Consumers are fully informed about products and prices.  They compare alternatives to get maximum value for money.  Buying decisions are based on logical evaluation (cost vs. benefit). Application Example: A rural farmer comparing the cost, fuel efficiency, and maintenance of two tractors before choosing the one that offers the best long-term value. Limitations:  Real consumers are not always rational.  Emotional, social, and psychological factors are ignored. 2. Psychological or Learning Model Core Idea: This theory is rooted in behavioural psychology and views buying as a learned response to environmental stimuli (ads, offers, peer talk). Key Concepts:  Motivation (based on needs)  Perception (how consumers interpret information)  Learning (from past experiences or observation)  Beliefs & Attitudes (toward brands/products)
  • 53. 53 Process: Stimulus → Consumer’s Perception → Learning → Response (purchase or rejection) Application Example: A farmer who had a good experience with Swaraj may develop a positive attitude and repeatedly buy from the same brand.Limitation:  Doesn't account for social or cultural influences in-depth. 3. Sociological Model Core Idea: Consumer decisions are strongly influenced by social groups, family, culture, and community norms. Influencing Groups:  Family  Reference groups (friends, community leaders)  Social class  Culture & traditions Application Example: A farmer in Ranchi may choose Powertrac simply because most farmers in the village own it and speak positively about it. Limitation:  Overlooks personal motivations and economic constraints. 4. Psychoanalytic Model (Freudian Theory) Core Idea:
  • 54. 54 Based on Sigmund Freud’s theory, consumer behaviour is influenced by unconscious motives, inner conflicts, and suppressed desires. Structure of Mind:  Id = Instinctual desires (e.g., power, prestige)  Ego = Reality-oriented balancing force  Superego = Social and moral values  Application Example: A farmer may choose a premium, high-HP tractor not just for productivity but for status and pride, though he may not admit it.Limitation:  Hard to measure or prove unconscious desires.  Too theoretical for practical application alone. 5. Howard-Sheth Model of Buying Behavior Core Idea: This is a comprehensive model that integrates psychological, social, and economic variables in the decision process. Key Components:  Inputs: Ads, word-of-mouth, dealer info  Perceptual & Learning Constructs: How consumers interpret and learn  Outputs: Attention, brand choice, satisfaction  Feedback loop: Post-purchase experience influences future behaviour Application Example: A buyer considers various tractor ads, talks to peers, visits dealerships, learns from the experience, and makes a final choice.
  • 55. 55 6. Engel-Kollat-Blackwell (EKB) Model Core Idea: This model describes five decision-making stages in buying a product. Five Stages: 1. Problem Recognition 2. Information Search 3. Evaluation of Alternatives 4. Purchase 5. Post-Purchase Evaluation 6. Application Example: Used often to model high-involvement purchases like tractors or vehicles. Strength:  Most widely used in consumer research and very practical. A farmer may intend to buy a Powertrac because he believes it’s reliable (attitude) and his peers think it’s a smart choice (social norm). 7.Maslow’s Hierarchy of Needs Core Idea: People buy based on a hierarchy of needs: 1. Physiological: Basic needs (food, shelter) 2. Safety: Job security, protection 3. Love/Belonging: Relationships, social circle 4. Esteem: Status, recognition 5. Self-actualization: Growth, creativity
  • 56. 56 Application Example: A tractor may fulfill multiple levels:  Safety: More control in farming  Esteem: Owning a premium brand brings status  Self-Actualization: Adopting advanced tech for modern farming Consumer Behaviour towards Tractors Consumer behaviour in the agricultural equipment market, particularly in tractor purchases, is a complex and multidimensional process. It is influenced by a combination of personal needs, socio-economic background, psychological perceptions, and external stimuli such as dealer influence, peer recommendations, and marketing strategies. In the context of semi-urban and rural regions like Ranchi, Jharkhand, understanding this behaviour becomes even more crucial due to the diversity in literacy levels, income distribution, landholding sizes, and exposure to modern technology. For most farmers, buying a tractor is not just a financial transaction—it is a long-term investment and a major capital decision. It directly impacts their productivity, cost of cultivation, and standard of living. Therefore, the purchase process involves detailed consideration and is often guided by multiple decision-makers in the household or community. Key Factors Influencing Tractor Purchase Behaviour: 1. Economic Factors: Price, financing options, maintenance cost, fuel efficiency, and resale value are top concerns. Most rural consumers are highly price-sensitive and prefer tractors that offer better mileage and lower operational costs. 2. Brand Image and Trust: Brands like Powertrac, Mahindra, and Sonalika are often chosen based on past experience, community feedback, and perceived durability. Brand loyalty is strong when post-purchase service is reliable.
  • 57. 57 3. Dealer Influence: Local dealers play a pivotal role in rural areas, often acting as both salespeople and informal advisors. Their behavior, after-sales service, and accessibility can significantly influence buying decisions. 4. Information Sources: While semi-urban consumers increasingly rely on digital platforms, social media, and agricultural expos, rural customers depend largely on word-of-mouth, neighbors, and relatives for information. 5. Government Schemes and Financing: Subsidies and agricultural loan schemes impact purchasing behaviour. However, awareness and understanding of such schemes remain limited among rural consumers, reducing their effectiveness. 6. Psychological and Emotional Factors: A tractor is often seen as a status symbol or a mark of social mobility, especially in semi-urban areas. Pride, aspiration, and the desire for independence play a subtle yet important role. 7. Usage Patterns and Land Size: Consumers owning smaller landholdings often prefer low HP (horsepower) tractors, while larger landowners look for multi-utility, powerful models that can support various farming operations. Purchase Decision Process: The consumer decision-making process in tractor purchases generally involves the following stages:  Problem Recognition: Need arises due to manual labor shortage, new land acquisition, or desire for higher efficiency.  Information Search: Gathering input from peers, dealers, advertisements, or agri- tech expos.  Evaluation of Alternatives: Comparing features, prices, service networks, and financing terms.  Purchase Decision: Based on a mix of rational (cost-benefit) and emotional (trust, dealer relations) factors.
  • 58. 58  Post-Purchase Behavior: Satisfaction depends on service experience, durability, and performance in real farm conditions. Understanding consumer behaviour towards tractors helps manufacturers, marketers, and policy implementers to develop tailored solutions. In regions like Ranchi, it is essential to bridge the gap between product offerings and farmers’ expectations by simplifying financing, enhancing service networks, and improving awareness about schemes. Only then can the full potential of agricultural mechanization be realized, leading to sustainable growth and farmer prosperity. Consumer Behaviour is the study of how individuals, groups, or organizations select, buy, use, and dispose of products, services, ideas, or experiences to satisfy their needs and wants. It involves understanding what consumers buy, why they buy it, when they buy, how they buy, and how they react post-purchase. Consumer Behaviour refers to the decision-making processes and actions of consumers that precede and follow the purchase of goods and services. It is influenced by psychological, personal, social, cultural, and economic factors. Factors Influencing Consumer Behaviour A. Psychological Factors  Motivation: Maslow’s hierarchy of needs (e.g., safety, esteem, self- actualization).  Perception: How people interpret information (e.g., ad influence).  Learning: Knowledge through past experiences.  Attitude and Beliefs: Shaped by culture, education, and exposure.
  • 59. 59 B. Personal Factors  Age and life cycle stage  Occupation and income  Lifestyle and personality C. Social Factors  Family: Major influence on values and buying habits.  Reference Groups: Friends, peers, influencers.  Roles and Status: Position in society can shape buying preferences. D. Cultural Factors  Culture and subculture  Religion  Regional traditions E. Economic Factors  Personal income  Family income  Consumer credit and liquidity
  • 60. 60 Real-World Observations: Rural vs. Urban Consumers Aspect Rural Buyers Urban Buyers Source of Info Peers, Dealers, Govt schemes Internet, Social Media, Auto Portals Importance of Brand Reputation in local community Overall quality, ratings, features Financing Subsidies, Cooperative Banks Bank/NBFC loans, EMI plans Purchase Timing Linked to harvest/festival seasons Based on offers, product launch cycles Evaluation Criteria Durability, Service access, Fuel cost Design, Tech, Performance, Warranty
  • 61. 61 Stages of Tractor Buying Behaviour 1. Problem Recognition The consumer identifies a need or opportunity, such as:  Land expansion  Old tractor worn out  Government scheme available  Shift to mechanized farming  Peer influence (“Sabke paas hai” effect) 2. Information Search Farmers seek information from:  Local dealers  Other farmers  Agricultural fairs  Government extension officers  YouTube (demo videos in Hindi)  Social platforms like WhatsApp or Facebook groups 3. Evaluation of Alternatives Key comparison criteria:  Horsepower (HP)  Fuel efficiency  Maintenance cost
  • 62. 62  Brand trust in the village  Loan/subsidy options  Resale value  Comfort and safety 4. Purchase Decision Final decision depends on:  Dealer interaction and trust  Ease of documentation  EMI plan  Subsidy application help  Timing (post-harvest or before sowing) 5. Post-Purchase Behaviour  Good experience = strong word-of-mouth promotion.  Bad experience = brand switching or negative influence.  Many farmers become informal brand advocates for their preferred tractor. . Factors Influencing Tractor Purchase Behaviour A. Economic Factors  Affordability: Price is critical; tractors are capital-intensive.  Financing: Loan availability, EMI schemes, cooperative bank tie-ups.  Subsidy Schemes: PM-KUSUM, state schemes affect brand and timing choice.
  • 63. 63 B. Social Factors  Community Reputation: Farmers prefer brands that others in the village trust.  Family Role: Fathers or brothers may influence the decision.  Peer Influence: Farmers often follow what successful neighbors are using. C. Personal Factors  Landholding size: Bigger farms → higher HP models.  Type of crop: Determines tractor need (e.g., tilling paddy vs. transporting sugarcane).  Occupation: Full-time farmers vs. those who also rent tractors commercially. D. Psychological Factors  Brand Loyalty: Many farmers stick to one brand if performance was good.  Perceived Value: Reliability > Looks.  Prestige: Owning a Mahindra or John Deere may elevate status. E. Cultural & Local Factors  Festive purchase trends: Buying during Dhanteras, Akshaya Tritiya, etc.  Local rituals: Some buyers perform “Puja” before using the tractor.  Regional brand preference: Powertrac in Jharkhand, Swaraj in Punjab, etc.
  • 64. 64 RURAL MARKETING Rural Marketing refers to the process of developing, pricing, promoting, and distributing products and services to customers in rural areas, which are typically less urbanized and have distinct consumption patterns, infrastructure, and socio-economic conditions compared to urban markets. Key Features of Rural Marketing: 1. Large and Diverse Market: o About 65% of India's population lives in rural areas. o High diversity in language, culture, and habits. 2. Different Consumer Behavior: o Influenced by tradition, culture, and local opinion leaders. o Higher reliance on word-of-mouth and trust. 3. Seasonal Demand: o Buying capacity depends heavily on agricultural cycles and monsoon. 4. Price Sensitivity: o Rural consumers are highly price-conscious and value-driven. 5. Limited Infrastructure: o Poor roads, electricity, and internet connectivity make distribution challenging. Strategies for Rural Marketing: 1. Product: o Low-cost, durable, and easy-to-use products. o Smaller packaging (e.g., sachets). 2. Price: o Affordable pricing with value-for-money proposition. o Flexible credit and payment schemes.
  • 65. 65 3. Place (Distribution): o Use of local retail outlets like haats, melas, and mandis. o Hub-and-spoke distribution model. 4. Promotion: o Use of folk media, wall paintings, loudspeakers, and local events. o Involvement of local influencers and community leaders. RURAL MARKETING IN INDIA: AN OVERVIEW Definition Rural marketing in India refers to the planning and execution of marketing functions and strategies for goods and services intended for rural consumers or sourced from rural producers, within the vast and diverse rural landscape of India. Rural India at a Glance: Parameter Data (Approx.) Population Over 900 million (≈ 65% of India’s population) Villages 6.5 lakh+ villages Primary Occupation Agriculture, allied activities Literacy Rate Lower than urban; varies regionally Infrastructure Developing (limited roads, electricity, internet) Importance of Rural Marketing in India: 1. Large Consumer Base – More than two-thirds of India lives in villages. 2. Untapped Market – Rising aspirations and income levels. 3. Government Focus – Rural development programs like PMGSY, Digital India, and Jan Dhan Yojana.
  • 66. 66 4. Rise in Agri-income – Boosts rural consumption, especially post-harvest season. Challenges in Indian Rural Marketing: Challenge Explanation Poor infrastructure Difficult logistics, bad roads Low media reach Limited access to TV, internet Diverse languages and customs Need for local customization Irregular income Seasonal income affects buying power Illiteracy and misinformation Susceptibility to fake products or poor awareness Understanding Rural Consumers in India Factor Rural Consumer Behaviour Characteristic Demographics Large families, joint households, agriculture-based income Education Low literacy levels; rely on oral, visual communication Values Conservative, risk-averse, influenced by traditions Decision Making Group/family decisions, especially for major purchases like tractors or electronics
  • 67. 67 Purchase Behaviour in Rural India 1. Need-Based Buying:  Consumers buy based on immediate utility (e.g., seeds, fertilizers, tractors).  Wants are secondary unless aspirational (e.g., smartphones, motorbikes). 2. Value-for-Money Orientation:  Emphasis on durability and functionality over brand prestige.  Rural buyers often compare prices extensively before purchase. 3. Brand Loyalty:  Once satisfied, they tend to stick to the brand (e.g., Tata salt, Amul). 4. Group Influence:  Buying decisions, especially expensive ones, are made after consulting family or community leaders. 5. Seasonal Purchasing:  Purchase frequency and volume increase after harvest or festival season (e.g., Diwali, Holi, post-Kharif).
  • 68. 68 RESEARCH METHODOLOGY “A Research is a careful investigation or inquiry; especially through search for new facts in any branch of knowledge..It is a systemized effort to gain more knowledge.” Research methodology is a way to systematically solve the research problem. It may be understood as a science of studying how research is done scientifically. It is necessary for the researcher to know not only the research methods or technique but also the methodology. Researcher always needs to understand the assumption underline various technique and they need to know the criteria by which they can decide that certain technique and procedures will be applicable to certain problems and other will not. The report is made to find out the consumer behavior towards on tractor by using sources of Data method of marketing research: DATA COLLECTION Whatever the data I have collected,  It is primary data by using direct interview of the consumers of powertrac and also made questionnaire for collection of relevant data. a) Questionnaire: For the above purpose and to get a better insight I needed to conduct a consumer survey. I prepared questionnaire for respondent so that they can answer easily. I preferred questionnaire method because it does not pressurize the consumer and in this way he gives correct information about the questions, which are asked to him in the questionnaire. b) Direct Interview: I have also conducted direct interview in some areas with consumer of powertrac so I have done so because my questionnaire was open-ended, so respondents could not express their views thoroughly but in personnel interview we can do it much better than questionnaire.  Secondary data=I have also collected the secondary data for research work, which I have taken from powertrac internal records, trade and business publications, and various sites related to powertrac , Articles, reports, websites of company.
  • 69. 69 Sampling Unit: Consumer and potential buyers Sampling Area: Ranchi ,either rural or semi-urban areas in that district. SAMPLE PROCEDURE ;  Stratified Random Sampling (with Convenience Elements): The population was divided into two strata — semi-urban and rural respondents.  Within each stratum, respondents were selected based on availability and willingness (which indicates convenience sampling).  This method ensures that both groups are represented while still being practical in real field conditions .due to practical constraints in reaching all potential respondents. a) It gives each element in the population or universe an equal probability of getting into the sample and all choices are independent of one another. b) It gives each possible sample combination an equal probability of being chosen. In my project it is imperative to have a true representative of respondents. So for that purpose I have chosen respondents: a) Who came under the company premises b) I randomly selected previous customers as respondents from these areas to answer the schedule I have formed for my research. SAMPLE FRAME It is also known as ―Source of list from which sample is to be drawn. The sample frame is as following: a) Rural areas in company premises b) Semi-urban areas in Ranchi. Jharkhand.
  • 70. 70 PERIOD OF STUDY The duration of study is from May 2025 to June 2025 which is a two months of study. Sampling Method: Stratified Random Sampling  Strata: Based on locality type (semi-urban and rural)  Within each stratum, random selection of respondents ensures representativeness. Sample Size: 80respondents 20 from semi-urban, 60 from rural areas Sampling Unit: Individual farmer (household head or decision-maker in farm machinery purchase) Research Design Type of Research: Mixed Approach (Descriptive and Exploratory)  Descriptive Research aims to define the characteristics, attitudes, and behaviours of tractor purchasers.  Exploratory Research is used to uncover emerging patterns in decision- making and identify novel influencing factors such as digital comfort and psychological attributes. Purpose of Research: To understand, compare, and evaluate the factors influencing tractor purchase decisions among different consumer segments (semi-urban vs. rural) in Ranchi.
  • 71. 71 DATA COLLECTION INSTRUMENT A structured questionnaire divided into the following sections: Section A: Demographics & Farm Profile Section B: Economic Factors Section C: Social Factors Section D: Personal/Individual Factors Section E: Psychological & Brand Perception Section F: Product-Related Factors Section G: Purchase Decision Process Section H: Post-Purchase Behaviour Measurement Scales Used:  Nominal Scale (Gender, Area Type)  Ordinal Scale (Age Group, Land Size)  Likert Scale (1 to 5, Importance or Satisfaction Ratings) Dichotomous/Binary (Yes/No, Selected/Not Selected Tools like correlation, hypothesis testing, graphs in percentage and comparative case analysis and trend analysis are used for examination of data for useful means.
  • 72. 72 DATA FINDINGS AND INTERPRETATION • Sample Size: -80 • Location: Semi-Urban & Rural Ranchi • Target Respondents : Tractor owners and potential buyers through tractor dealership/showroom collected during field visit during intership period between 12 May to 30 June 2025. • SEMI- URBAN =20 RURAL AREAS= 60. Region included are parts of Ranchi, Jharkhand. • 95% were Male farmers. • 5% were female farmers. • 50% have powertrac tractor • 30% have Mahindra • 10% have sonalika ,5% have johndere • 5% have massey tractor.
  • 74. 74 Simulated Data and Key Findings I. Initial Classification & Demographics (Section A) Locality Type:  Semi-Urban Area: 20 farmers (25%)  Rural Area: 60 farmers (75%) A1_Gender: o Total Men: 76 (95%) o Total Women: 4 (5%) A2_Age:  Assumed Data (Focus on middle-aged and older farmers due to less education/digital connect and farming prevalence): o Below 25: 2 (2.5%) o 25–35: 10 (12.5%) o 36–45: 25 (31.25%) o 46–55: 28 (35%) o 56–65: 12 (15%) o Above 65: 3 (3.75%)  Finding: The majority of farmers are in the 36-55 age bracket (over 65%), indicating experienced, established farmers are the primary focus. Younger farmers (below 35) represent a smaller segment. A3_Education:  (Not highly educated): o Illiterate: 20 (25%) o Primary School (Class 1–5): 25 (31.25%) o Middle School (Class 6–8): 20 (25%)
  • 75. 75 o High School (Class 9–10): 10 (12.5%) o Intermediate/12th Pass: 5 (6.25%) o Graduate or Higher: 0 (0%)  Finding: A very large proportion of the sample (over 80%) has education up to middle school or is illiterate. This strongly suggests a preference for simple, direct communication, practical demonstrations, and less reliance on complex digital or textual information. A4_Occupation: o Full-Time Farmer: 70 (87.5%) o Farmer Part-Time: 8 (10%) o Other: 2 (2.5%)  Finding: The overwhelming majority are full-time farmers, particularly in rural areas, reinforcing their primary dependence on agriculture for livelihood. A5_Landholding:  (Smaller holdings, especially in rural): o Less than 1 acre: 25 (31.25%) o 1–2.5 acres: 35 (43.75%) o 2.6–5 acres: 15 (18.75%) o 5.1–10 acres: 5 (6.25%) o More than 10 acres: 0 (0%)  Finding: A significant majority (over 75%) cultivates 2.5 acres or less. This indicates a high demand for smaller, more versatile, and cost-effective tractors, or reliance on custom hiring services. A6_Crops Grown:  (Paddy and Wheat predominant, multi-select): o Paddy (Rice): 65 (81.25%) o Wheat: 55 (68.75%) o Pulses: 20 (25%)
  • 76. 76 o Oilseeds: 10 (12.5%) o Maize: 5 (6.25%)  Finding: Paddy and wheat are the dominant crops, suggesting a need for tractors suited to their specific cultivation requirements (e.g., wet field operations for paddy, tillage for wheat). A7_Own_Tractor:: o Yes: 48 (60%) o No: 32 (40%)  Finding: 60% of the surveyed farmers own tractors, indicating a moderate level of mechanization. A significant portion still relies on alternatives. A8_Brand Owned (among 80 tractor owners):  (Powertrac and Mahindra preferred): o Mahindra: 25 (52% of owners) o Powertrac: 18 (37.5% of owners) o Swaraj: 3 (6.25% of owners) o Eicher: 2 (4.17% of owners)  Finding: Mahindra clearly leads, followed closely by Powertrac, confirming the specified preference. This indicates strong brand loyalty and trust in these two manufacturers within this demographic. A9_Purchase_Year & A10_New_Used (among 48 tractor owners): o Average Purchase Year: 2015 (older tractors due to lower income and potentially less frequent upgrades). o New: 35 (73%) o Used: 13 (27%)  Finding: While most purchase new, a notable segment buys used tractors, highlighting budget constraints. The older average purchase year suggests that farmers hold onto their tractors for a longer duration.
  • 77. 77 II. Economic Factors Influencing Purchase (Section B) B1_Income: (Not so high income): o Below ₹1,00,000: 25 (31.25%) o ₹1,00,001 – ₹2,50,000: 35 (43.75%) o ₹2,50,001 – ₹5,00,000: 15 (18.75%) o Above ₹5,00,000: 5 (6.25%)  Finding: The vast majority (over 75%) earn below ₹2.5 Lakh annually. This is a critical constraint, emphasizing that affordability, financing, and subsidies are paramount. B2 Importance of Factors (Scale 1-5, assumed average scores reflecting low income/rural context): Factor Semi-Urban (Avg) Rural (Avg) Overall Avg Price 4.8 4.9 4.88 Financing 4.5 4.9 4.78 EMI Amount 4.6 4.8 4.75 Loan Terms 4.4 4.7 4.63 Value for Money 4.7 4.8 4.78 Maintenance Cost 4.6 4.7 4.68 Export to Sheets  Finding: Price, Financing, EMI Amount, Loan Terms, Value for Money, and Maintenance Cost are all rated extremely high (averaging above 4.5). This confirms that economic factors are overwhelmingly the most critical considerations for this demographic, particularly for rural farmers where finance is even more vital. B3_Availed_Subsidy:  Assumed Data:
  • 78. 78 o Yes: 45 (56.25%) o No: 35 (43.75%)  Finding: More than half of the farmers have availed subsidies, indicating their importance in making tractor purchases feasible for lower-income groups. B4_Subsidy_Influence (among those who availed): o Strongly Influenced: 30 (66.7%) o Moderately Influenced: 10 (22.2%) o Slightly Influenced: 5 (11.1%)  Finding: For those who received subsidies, the influence was predominantly strong, proving that government support is a critical enabler for tractor adoption in this segment. B5_NoTractor_Reason (among 32 non-owners, multi-select): o Too Expensive: 25 (78%) o Difficulty in Getting Loan: 18 (56%) o No Need: 8 (25%) o Not Aware (of benefits/options): 5 (15%)  Finding: "Too Expensive" and "Difficulty in Getting Loan" are the primary barriers to tractor ownership for this group, reinforcing the economic constraints. Limited awareness also plays a role for some. III. Social Factors (Section C) C1 Influence by People (Scale 1-5, assumed average scores, high social influence): Influence Source Semi-Urban (Avg) Rural (Avg) Overall Avg Family 4.5 4.8 4.73 Peers 4.2 4.6 4.5 Community 4.0 4.5 4.38 Neighboring Farmers 4.3 4.7 4.6 Sales Rep 4.1 4.8 4.63
  • 79. 79  Finding: All social influence factors are rated very highly, especially in rural areas. Family, Neighboring Farmers, and Sales Representatives are the most influential sources of information and persuasion. This underscores the importance of local trust, word-of-mouth, and direct personal engagement in sales and marketing. C2_Discuss_Tractor: o Always: 30 (37.5%) o Frequently: 35 (43.75%) o Sometimes: 10 (12.5%) o Rarely/Never: 5 (6.25%)  Finding: The vast majority (over 80%) frequently or always discuss tractors, indicating a highly interconnected community where information, opinions, and experiences are readily shared. C3_Imp_BrandReputation_Community:  (Average Score): o Overall: 4.7 (Extremely Important)  Finding: Brand reputation within the community is deemed extremely important, suggesting that a positive local image and peer endorsement are critical for sales success. IV. Personal Factors & Digital Connect (Section D) D1 Influence by Personal Experience (Scale 1-5, assumed average scores, focusing on utility): Factor Semi-Urban (Avg) Rural (Avg) Overall Avg Experience 4.5 4.7 4.65 Productivity 4.8 4.9 4.88 Design 3.0 2.5 2.63 Comfort 3.2 2.8 2.9
  • 80. 80 Factor Semi-Urban (Avg) Rural (Avg) Overall Avg Prestige 3.5 2.9 3.05  Finding: Productivity and Personal Experience are overwhelmingly the most influential personal factors. Design, comfort, and prestige are much less important, reinforcing the utilitarian focus of these farmers. D2_Digital_Comfort:  (Less digital comfort): o Very Comfortable: 5 (6.25%) o Moderately Comfortable: 15 (18.75%) o Slightly Comfortable: 30 (37.5%) o Not Comfortable at All: 30 (37.5%)  Finding: A significant majority (over 75%) are either "Slightly Comfortable" or "Not Comfortable at All" with digital tools. This is a critical finding, indicating that digital marketing and sales channels will be largely ineffective for this segment. D3_Internet_Freq:  (Less internet use): o Daily: 8 (10%) o Few times a week: 15 (18.75%) o Few times a month: 25 (31.25%) o Rarely: 20 (25%) o Never: 12 (15%)  Finding: Most farmers (over 70%) use the internet "Few times a month," "Rarely," or "Never." This confirms the low digital connect and reliance on offline information sources. D4_Used_YouTube_For_Info: o Yes: 15 (18.75%) o No: 65 (81.25%)
  • 81. 81  Finding: Only a small minority use YouTube for tractor information, further cementing the limited digital engagement. D5_Used_Mobile_App & D6_Booked_Online: o Used Mobile App (Yes): 5 (6.25%) o Booked Online (Yes): 1 (1.25%)  Finding: Mobile app usage and online booking are almost non-existent within this farmer group. The purchase journey is overwhelmingly traditional and offline. V. Psychological Factors & Brand Perception (Section E) E1 Importance of Brand Attributes (Scale 1-5, assumed avg scores, emphasizing trust/experience): Attribute Semi-Urban (Avg) Rural (Avg) Overall Avg Brand Trust 4.8 4.9 4.88 Past Experience 4.7 4.8 4.78 Design 3.0 2.5 2.63 Emotional Connect 4.0 4.5 4.38 Innovation 3.1 2.7 2.8  Finding: Brand Trust and Past Experience are the most critical brand attributes, followed by Emotional Connect. Design and Innovation are of much lower importance. This means brands need to build a legacy of reliability and foster strong relationships within the community, rather than focusing on cutting-edge design or technology features. E2_Familiar_Powertrac & E3_Considered_Powertrac:  (High familiarity and consideration for both Powertrac & Mahindra): o Familiar Powertrac (Very/Moderately): 60 (75%)
  • 82. 82 o Considered Powertrac (Seriously/Briefly): 45 (56.25%)  Finding: Powertrac enjoys high familiarity and consideration among these farmers, especially when factoring in the existing ownership data. E5_Powertrac_vs_Mahindra (assumed average rating, 3=Same): o Overall: 3.0 (Generally perceived as "Same" or very similar in quality/performance)  Finding: There's little perceived difference between Powertrac and Mahindra in terms of overall quality, reinforcing their shared preference. Competition might boil down to specific dealer offerings, financing, or localized service. E6_Most_Trusted_Brand:  : Mahindra is still frequently cited, but Powertrac also gets significant mentions as "most trustworthy," especially among its owners. The reasons often revolve around durability, spares availability, and local service. VI. Product-Related Attributes & Sustainability (Section F) F1 Importance of Features (Scale 1-5, assumed avg scores, emphasizing core utility): Feature Semi-Urban (Avg) Rural (Avg) Overall Avg HP 4.5 4.6 4.58 Engine 4.7 4.8 4.78 Fuel Efficiency 4.9 5.0 4.98 Transmission 4.0 4.1 4.08 Braking 4.0 4.0 4.0 Warranty 4.6 4.7 4.68 Service Network 4.8 4.9 4.88 Design Look 2.8 2.5 2.58 Smart Features 2.5 2.0 2.13
  • 83. 83  Finding: Fuel Efficiency, Engine Quality, HP, Warranty, and Service Network are extremely important. Design look and smart features are consistently rated as having very low importance, underscoring the functional and practical needs of these farmers. F2_Info_Sources (multi-select): o Sales Representative: 65 (81.25%) o Dealership: 60 (75%) o Friends/Relatives: 55 (68.75%) o Advertisement (TV/Radio): 30 (37.5%) o YouTube: 10 (12.5%)  Finding: Sales representatives, dealerships, and word-of-mouth (friends/relatives) are by far the most critical information sources. Traditional advertisements (TV/Radio) have moderate reach, while digital platforms like YouTube are largely irrelevant for this group. F3_Imp_DealershipProximity & F4_Imp_Demonstrations (Scale 1-5, assumed average scores): Factor Semi-Urban (Avg) Rural (Avg) Overall Avg Dealership Proximity 4.6 4.8 4.75 Demonstrations 4.5 4.7 4.65  Finding: Both dealership proximity and product demonstrations are extremely important. This highlights the need for a strong, accessible physical presence and hands-on experience in the sales process for this demographic. F5_Fuel_Type (Preferred for future tractors):
  • 84. 84 o Diesel: 75 (93.75%) o Electric: 4 (5%) o CNG/Hybrid: 1 (1.25%)  Finding: Diesel is overwhelmingly the preferred fuel type. Interest in electric or other alternative fuels is minimal, indicating a strong preference for familiar and proven technology. F6_Importance_Fuel_Economy:  (Average Score): o Overall: 4.9 (Nearly unanimous "Extremely Important")  Finding: Fuel economy remains a paramount consideration, directly impacting operational costs and profitability for low-income farmers. F7_Interest_Electric_Tractor: o Yes: 3 (3.75%) o Maybe: 8 (10%) o No: 69 (86.25%)  Finding: Very low interest in electric tractors. This is likely due to lack of awareness, higher perceived cost, charging infrastructure concerns, and satisfaction with diesel technology. VII. Purchase Decision Process (Section G) G1_Motivation (Top 3): o Increase farm productivity: 40 (50%) o Replace old tractor: 20 (25%) o Reduce labor cost: 10 (12.5%) o Government schemes: 5 (6.25%)  Finding: The primary motivation is functional: increasing farm productivity, followed by replacing aging equipment and reducing labor costs. Government schemes also play a significant, though secondary, role.
  • 85. 85 G2_Brands_Considered (multi-select, among those who purchased):  (Reflecting strong preference for Mahindra/Powertrac): o Mahindra: 45 (93.75% of owners considered) o Powertrac: 40 (83.33% of owners considered) o Swaraj: 15 (31.25% of owners considered) o Eicher: 10 (20.83% of owners considered)  Finding: Mahindra and Powertrac are the default brands considered, with other brands having significantly less mindshare during the purchase process. G3_Most_Imp_Factor (Select only one): o Fuel Efficiency: 25 (31.25%) o Price: 20 (25%) o Financing Options: 15 (18.75%) o Word-of-mouth: 8 (10%) o After-Sales Service: 7 (8.75%)  Finding: Fuel efficiency, Price, and Financing Options are the undeniable top three most important factors driving the final purchase decision, directly reflecting the economic constraints and high operational cost sensitivity of this farmer group. G4_Challenges (Among those who faced challenges): o Too Expensive: Common (High initial cost) o Difficulty in Getting Loan: Common (Bureaucracy, collateral, low credit scores) o Lack of Awareness: Moderate (About specific models, schemes, or features) o Limited Dealer Options: Moderate (Especially in deeper rural areas)  Finding: Financial barriers (cost and loans) are the most significant challenges. Accessibility of information and dealerships also pose problems. G5_Usage_Hours_Per_Day:  (Average): 6.5 hours/day
  • 86. 86  Finding: High daily usage hours indicate that the tractor is a primary, heavily utilized asset for these farmers. G6_Earnings_From_Rental (among those who rent):  (Average): ₹7,000/month (lower due to smaller tractors and less rental opportunities/rates)  Finding: While some farmers earn from rentals, the income is relatively modest, suggesting it's a supplementary benefit rather than a primary motivator for tractor purchase for this specific group. G7_Recovery_Period: o 1–3 years: 25 (52% of owners) o >3 years: 20 (41%) o Not yet recovered: 3 (6%)  Finding: A significant portion (over 40%) expects or experiences a recovery period longer than 3 years, highlighting the substantial investment a tractor represents for these farmers. VIII. Post-Purchase Behaviour & Satisfaction (Section H) H1_Overall_Sat (Scale 1-5, average score):  Overall Average: 4.2 (Satisfied)  Finding: Farmers are generally satisfied with their tractor purchase, likely because it addresses their core needs for productivity and labor reduction. H2_Sat_AfterSales & H3_Sat_Spares (Scale 1-5, average scores): Satisfaction Factor Overall Avg After-Sales Service 4.0 Spares Availability 4.1 Export to Sheets
  • 87. 87  Finding: Satisfaction with after-sales service and spares availability is generally good, but there's room for improvement, especially given its high importance (F1g). H4_Recommend_Brand & H5_Buy_Same_Brand (Scale 1-5, assumed average scores): Behavior Overall Avg Recommend Brand 4.3 Buy Same Brand 4.2  Finding: High likelihood of recommending and repurchasing the same brand. This indicates strong loyalty once a brand delivers on core functional and economic needs, crucial for word-of-mouth marketing in this low-digital-connect segment. H6_Improvements: o More affordable spare parts: Most frequent. o Closer service centers/mobile service: Very common. o Simpler loan processes: Frequent. o Better fuel efficiency (even though already high): Still desired. o Basic operation training: Some mentions.  Finding: Desired improvements are highly practical and cost-focused: reducing the financial burden of ownership (spares, fuel) and improving accessibility of support (service, loans). H7_Service_Visits:  Average per year): 1.5 visits  Finding: Relatively infrequent service visits, possibly due to cost, distance, or a "fix- it-when-it-breaks" mentality. H8_Service_ResponseTime:  (Most common response): 4-7 days  Finding: Service response times are often longer, presenting a clear area for improvement to enhance satisfaction and minimize downtime.
  • 88. 88 H9_Prefer_Home_Service:  : Yes (88%), No (12%)  Finding: An overwhelming preference for on-site (home) service underscores the logistical challenges and time constraints of traveling to workshops for these farmers. This is a crucial service delivery model for this demographic. H10_Attended_Training & H11_Received_Followup_Call: Support Program Yes % Attended Training 10% Received Follow-up Call 40%  Finding: Very low participation in training programs and moderate follow-up calls. This indicates missed opportunities for manufacturers/dealers to build stronger relationships, educate users, and gather feedback post-purchase.
  • 89. 89 The factor that determines the purchase Percentage based on buying preference Price 20.83% After-sale service 17.97% Low cost of operation (Maintenance cost) 14.06% Reliability 13.02% Availability of finance 10.94% Easy availability of spare parts 8.07% Ease of operation 6.77% Horsepower 4.69% Resale value 3.65% TOTAL 100%
  • 90. 90
  • 91. 91 This bar chart illustrates the relationship between Subsidy Awareness and Tractor Ownership. It shows that among the respondents, an equal number of individuals who are Aware of subsidies own a tractor as do those who are Not Aware of subsidies Similarly, the number of non-tractor owners is roughly the same for both the 'Aware' and 'Not Aware' groups This suggests that in this dataset, there isn't a clear direct correlation between being aware of subsidies and whether or not someone owns a tractor.
  • 92. 92 How customer came to know about powertrac tractors Factor Respondents Percentage Advertisement 26 32% Sales person 5 10% Friends / Relatives 16 52% Others 3 6% total 50 100%
  • 93. 93 1. Dominance of Word-of-Mouth (52%): "Friends / Relatives" is clearly the most significant factor influencing respondents, accounting for over half of the total. This highlights the immense power of personal recommendations, trusted networks, and word-of-mouth in decision-making. 2. Strong Impact of Advertising (32%): Traditional "Advertisement" plays a substantial role, influencing nearly one-third of respondents. This suggests that marketing campaigns through various media channels are effective in reaching and swaying potential customers. 3. Limited Direct Sales Influence (10%): The "Sales person" factor has a comparatively low influence. This might indicate that while sales personnel play a role, their direct impact on initial influence or information gathering is less significant than personal networks or broader advertising. 4. Minor Role of Other Sources (6%): The "Others" category accounts for a small percentage, indicating that most significant influences fall within the specified categories. 5. Information Channel Hierarchy: The data suggests a clear hierarchy of influence: personal connections (Friends/Relatives) are paramount, followed by broad media exposure (Advertisement), with direct sales interactions having a more limited primary influencing role. FACTOR THAT CREATE BRAND IMAGE OF TRACTORS factor Percentage Mileage 25% Services 20% Comfort 4% After sales services 11% price 19% colour 5% resale value 15% total 100%
  • 94. 94
  • 95. 95 Findings=Key Observations on Tractor Brand Image Factors: 1. Mileage is the Single Most Dominant Factor (25%): This indicates that fuel efficiency and operational cost-effectiveness are the most crucial elements in shaping a tractor's brand image. Customers are highly concerned with the running costs and economic viability of the machine. 2. Services, Price, and Resale Value are Core Pillars : These three factors collectively represent a significant portion of brand image perception. o Services: Highlights the importance of good dealer support, maintenance availability, and overall service experience. o Price: Underscores that affordability and competitive pricing remain a vital component of brand appeal. o Resale Value: Points to the long-term investment aspect; customers consider how much value the tractor will retain over time, reflecting trust in the brand's durability and market demand. o Price accounts for 19% of factors creating brand image because in rural India customer are sensitive towards price and price create image in minds of customers. o Resale value is also important aspect in consumer behaviour in rural parts of India. Because after certain times farmers sell it. o Service means post purchase of vehicles is also important in minds of customers as tractors require regular servicing in monsoon season or pre- sowing season. o Colour and comfort plays very less role in determining tractors value in rural parts of country. o Indian farmer the buyer and further potential buyer give very less preference to additional feature.
  • 96. 96 FACTOR THAT CUSTOMER PREFER WHILE BUYING TRACTORS IN SEMI-URBAN AND RURAL RANCHI Factor preference crop pattern 5 brand value 4 dealer influence 13 fuel efficiency 6 horsepower 14 Mileage 7 Services 12 Comfort 15 After sales services 8 price 9 colour 16 resale value 10 Income levels 2 land holding size 1 motor parts cost 3 servicing cost 11 gift 17
  • 97. 97
  • 98. 98
  • 99. 99
  • 100. 100 Correlation chart showing the relationship between landholding size and horsepower preference. As the land size increases, horsepower preference also rises, confirming a strong positive correlation. which means farmers having more land in acres will buy tractors of more horsepower.
  • 101. 101 The second chart shows the correlation between Education Level and Brand Awareness. The correlation coefficient is 0.99, indicating a very strong positive linear relationship which means people who are aware in terms of education also have brand awareness of the product which include tractors. As education increases, customers are better informed about tractor brands, advertisements, and product features.
  • 102. 102 The first chart shows the correlation between Dealer Influence and Brand Preference. The correlation coefficient is 1.00, indicating a perfect positive linear relationship. Which means dealer influence is directly proportional to brand preference. A good dealer can influence a customer in terms of brand choices.
  • 103. 103 FINDINGS AND DISCUSSION Demographic Findings  95% male respondents  46% were aged 36–45  54% owned 2.5 to 5 acres Economic Findings  Price and financing most cited influences  Subsidy influenced both purchase and brand Social & Psychological Observations  Peer influence higher in rural areas  Prestige and modernity matter more in semi-urban zones Brand Analysis  Mahindra and Powertrac most owned  Brand trust drives repeat purchases Satisfaction Levels  72% of semi-urban owners reported high satisfaction  After-sales service is a crucial satisfaction driver 1. H1: Initial Purchase Price o Semi-urban farmers prioritize affordability more than rural farmers. o Indicates higher price sensitivity and budget-conscious decision-making. 2. H2: Online Research Usage o They are more likely to research online before buying. o Suggests better access to technology and digital awareness. 3. H3: After-Sales Influence o Semi-urban farmers are more influenced by after-sales service availability. o Implies that service and maintenance concerns matter more to them.
  • 104. 104 4. H4: Social Status Influence o Social status has a stronger impact in semi-urban areas. o Possibly due to peer pressure or status symbol perception of tractors. 5. H5: Government Scheme Importance o Government schemes are moderately more important for semi-urban buyers. o Reflects awareness or access to scheme benefits. 6. H6: Rental Purpose Motivation o Greater importance for semi-urban farmers. o Suggests that tractors are also a source of commercial income via rentals. 7. H8: Smart Features Influence o Semi-urban farmers value modern features (e.g., GPS, fuel efficiency) more. o Likely due to better exposure to advanced technologies. Rural Farmers show higher influence in: 8. H7: Loan Facilitation Value o Rural buyers are more impacted by loan and credit facilities. o Indicates limited liquidity and dependency on finance options. 9. H9: Sales Representative Influence o Sales reps play a major role in rural areas. o Reflects reliance on personal guidance, trust, and word-of-mouth. 10. H10: Satisfaction Level o Surprisingly, rural farmers report higher satisfaction levels. o Could be due to lower expectations or a more straightforward usage requirement. 11. H11: Recommend Brand o Rural users are more likely to recommend their tractor brand. o Points to stronger brand loyalty or community influence. Key Insights & Implications:  Semi-Urban Customers: o Are more informed, tech-savvy, and service-conscious.
  • 105. 105 o Tractor companies should focus on digital marketing, feature-rich models, and strong after-sales service for this segment.  Rural Customers: o Depend on finance schemes, personal sales interaction, and word-of-mouth. o Sales strategies should emphasize relationship building, credit options, and community engagement. Factor Semi- Urban (Score) Rural (Score) Difference (SU - Rural) Initial Purchase Price 4.6 3.8 0.8 Online Research Usage 3.7 2.8 0.9 After-Sales Influence 3.6 2.9 0.7 Social Status Influence 4.2 3 1.2 Government Scheme Importance 3.1 2.8 0.3 Rental Purpose Motivation 3.7 2.9 0.8 Loan Facilitation Value 3 3.8 -0.8 Smart Features Influence 3.4 2.7 0.7 Sales Representative Influence 3.2 4.1 -0.9 Satisfaction Level 3.3 3.7 -0.4 Recommend Brand 3.1 3.5 -0.4
  • 106. 106 FINDINGS OF THE STUDY 1. Horsepower Preference is Dominant: o Farmers in both semi-urban and rural areas highly prioritize horsepower when purchasing tractors. o This factor scored the highest, indicating that performance capability is a key decision-making criterion. 2. Dealer Influence is Crucial: o The influence of dealership representatives significantly impacts purchase decisions. o Semi-urban customers are more influenced by sales staff compared to rural farmers (t-test result was significant: t = 3.24, p = 0.0017). 3. Education Level Linked to Brand Awareness: o A positive correlation was observed between education level and brand awareness. o Educated farmers tend to be more brand-conscious and aware of tractor specifications. 4. Landholding Size Affects Horsepower Demand: o A strong correlation was found between land size and the preference for higher horsepower tractors. o Larger landowners often invest in more powerful machines for better efficiency. 5. Comfort and Mileage Have Growing Importance: o Semi-urban buyers showed rising concern for comfort and mileage, indicating a shift towards user-friendly features. o This trend was less pronounced in rural areas, where functionality remains the main driver. 6. Brand Loyalty is Influenced by After-Sales Services: o Customers who experienced good after-sales service reported higher brand loyalty. o This is especially true in rural areas, where service access is more limited and highly valued. 7. Crop Pattern Slightly Influences Tractor Type:
  • 107. 107 o Farmers growing specific crops like paddy or sugarcane showed preferences for tractors with special attachments. o However, this factor was not as dominant as horsepower or dealer influence. 8. Powertrac Popularity: o Among surveyed customers, Powertrac was identified as a leading brand due to affordability and dealer network. o Its presence was especially strong in semi-urban Ranchi. 9. Sources of Information: o Word of mouth and local dealers remain the top sources of information. o Use of digital platforms was very limited, mostly among younger and more educated buyers. 10. Pricing Still a Barrier:  Despite financing options, pricing remains a significant barrier, particularly in rural areas.  Many customers rely on subsidies or loans for tractor purchases.
  • 108. 108 AFTER DATA ANALYSIS WE GOT ANOTHER ROUND OF FINDINGS: 1. Horsepower is the Most Preferred Factor  According to preference scores collected from respondents, Horsepower received the highest rating (Score = 14), indicating it is the most influential factor in tractor purchase decisions. 2. Dealer Influence Strongly Impacts Brand Preference  A correlation analysis between Dealer Influence Score and Brand Preference Score showed a strong positive relationship .  This means that better dealer support increases brand preference, especially in semi- urban areas. 3. Education Positively Correlates with Brand Awareness  The analysis revealed a moderate to strong correlation between education level and brand awareness  Respondents with higher education levels demonstrated greater knowledge of tractor brands and models. 4. T-Test Result: Sales Influence Differs by Region  An independent samples t-test between semi-urban and rural farmers on sales representative influence gave: o t = 3.24, p = 0.0017 o Mean (Semi-urban) = 4.10, Mean (Rural) = 3.50  Conclusion: Semi-urban buyers are significantly more influenced by dealership sales staff than rural farmers. 5. Landholding Size Correlates with Tractor Power  Correlation between Landholding Size and Horsepower Preference was found to be strong and significant.
  • 109. 109  Larger landowners prefer tractors with higher power to manage larger areas efficiently. 6. After-Sales Service Drives Brand Loyalty  Respondents who rated after-sales service higher also showed stronger brand loyalty. 7. Comfort and Mileage Preferences Rising  Data indicates that younger and semi-urban respondents gave higher preference scores to comfort (Score = 15) and mileage (Score = 7).  These modern purchase criteria are gaining ground alongside traditional utility factors. 8. Powertrac Dominates Semi-Urban Market  Powertrac emerged as the most purchased brand among semi-urban respondents.  The brand is appreciated for cost-effectiveness and strong local dealership presence. 9. Crop Type Moderately Affects Tractor Choice  Farmers engaged in paddy cultivation preferred tractors with water-resistant features.  However, the statistical significance of crop pattern in choosing a brand was moderate . 10. Word-of-Mouth is the Main Source of Influence  Data shows that 68% of farmers relied on word-of-mouth and dealers for tractor information.  Digital sources and online platforms were used by less than 10%, mostly among tech- savvy youth.
  • 110. 110
  • 111. 111
  • 112. 112
  • 113. 113
  • 114. 114
  • 115. 115
  • 116. 116
  • 117. 117
  • 118. 118
  • 119. 119 HYPOTHESIS Hypothesis is a clear, testable statement or assumption about the relationship between two or more variables. In research, it acts as a starting point for investigation and helps guide the direction of data collection and analysis Key Features of a Hypothesis: 1. Predictive: It predicts the outcome of a study. 2. Testable: It can be tested through data and statistical analysis. 3. Specific: Clearly defines the variables and their expected relationship. 4. Based on theory or observation: Formed from previous studies, theories, or logical reasoning. Types of Hypotheses 1. Null Hypothesis (H₀): o States that there is no relationship or no significant difference between the variables. 2. Alternative Hypothesis (H₁ or Ha): o States that there is a relationship or a significant difference between the variables.
  • 120. 120 Hypothesis Set: Product-Related Attributes (Marketing Mix) Hypothesis Statement:  H₀ (Null Hypothesis): There is no significant difference in the mean importance of 'Quality of After-Sales Service' between semi-urban and rural farmers.  H₁ (Alternative Hypothesis): There is a significant difference in the mean importance of 'Quality of After-Sales Service' between semi-urban and rural farmers. Given Data: Group N Mean (M) Standard Deviation (SD) Semi-Urban 20 4.30 0.68 Rural 60 4.65 0.50 Using df = 78 and t = 2.468, from t-distribution tables or calculator: Two-tailed p-value≈0.0156 Statistic Value t-value -2.468 Degrees of freedom 78 p-value (2-tailed) 0.016 Interpretation:  Since p = 0.016 < 0.05, the result is statistically significant.  Conclusion: Rural farmers value after-sales service significantly more than semi- urban farmers.  Decision: Reject the null hypothesis H0  Therefore, it is concluded that quality of after-sales service is a significantly more critical factor for rural farmers when considering a tractor purchase."
  • 121. 121
  • 122. 122 Hypothesis : Economic Factors (Government Subsidies) There is a significant difference in the importance placed on 'Government Subsidies & Schemes' (B2c) in tractor purchase decisions between farmers in semi-urban areas and those in rural areas.  Null Hypothesis (H0): There is no significant difference in the mean importance of 'Government Subsidies & Schemes' between semi-urban and rural farmers.  Alternative Hypothesis (Ha): There is a significant difference in the mean importance of 'Government Subsidies & Schemes' between semi-urban and rural farmers.  Statistical Test: Independent Samples t-test  An independent samples t-test revealed a statistically significant difference (t(78) = - 2.77, p < 0.01) in the importance of 'Government Subsidies & Schemes' between rural and semi-urban farmers. Rural farmers (Mean = 4.35, SD = 0.70) considered subsidies significantly more important than semi-urban farmers (Mean = 3.80, SD = 0.95).  Conclusion:  Since p < 0.05, we reject the null hypothesis. This confirms that government subsidies are a significantly more critical decision factor for rural farmers when purchasing tractors.  The implication is clear: policy measures, awareness campaigns, and targeted subsidy delivery mechanisms should be more aggressively focused on rural segments to increase tractor penetration and improve overall farm productivity. Tractor manufacturers and dealers can also leverage this insight by partnering with government bodies, offering on-ground assistance for subsidy application, or bundling financing schemes with purchase offers in rural markets.  In conclusion, the evidence affirms that economic support via subsidies is not merely helpful but often essential for rural farmers, and this factor should be given prominent consideration in both marketing strategies and public policy planning.
  • 123. 123 Hypothesis : Social Factors (Influence of Sales Representatives) H: The influence of 'Sales Representatives at Dealerships' (C1e) on tractor purchase decisions is perceived significantly differently by farmers in semi-urban areas compared to those in rural areas.
  • 124. 124  Null Hypothesis (H0): There is no significant difference in the mean perceived influence of 'Sales Representatives at Dealerships' between semi-urban and rural farmers.  Alternative Hypothesis (Ha): There is a significant difference in the mean perceived influence of 'Sales Representatives at Dealerships' between semi-urban and rural farmers.  Statistical Test: Independent Samples t-test.  Statistic Value t-value 3.24 Degrees of Freedom- 78 p-value (2-tailed) -0.0017 Significance Level α- 0.05 Decision Reject- H₀ Conclusion: An independent samples t-test revealed a statistically significant difference in the perceived influence of sales representatives at dealerships on tractor purchase decisions between semi-urban and rural farmers. The result, with a t-value of 3.24 and p-value = 0.0017, indicates that semi-urban farmers (Mean = 4.10, SD = 0.60) rate the influence of dealership sales representatives significantly higher than rural farmers (Mean = 3.50, SD = 0.75). This finding suggests that interpersonal interactions and persuasive communication at the point of sale are more impactful in semi-urban contexts. This could be due to more structured dealer networks, higher awareness levels, and more time spent discussing features with representatives in semi-urban areas. Rural farmers, on the other hand, may rely more on peer recommendations, brand reputation, or village-level influencers than on dealership staff.
  • 125. 125 Hence, it is concluded that sales representatives have a significantly stronger influence in semi-urban markets, and dealership strategies should be tailored accordingly. For rural areas, companies may need to invest more in relationship marketing, demonstration camps, and local influencers to drive conversions. 0 0.5 1 1.5 2 2.5 3 3.5 4 4.5 5 Semi-Urban Farmers Rural Farmers Chart Title
  • 126. 126 Hypothesis :Location vs Tractor Purchase Behaviour Hypotheses:  H₀: There is no significant relationship between location and tractor purchase behaviour.  H₁: There is a significant relationship between location and tractor purchase behaviour. Test Used: Chi-Square Test of Independence Result:  Chi-square value: 7.84  Degrees of Freedom: 1  p-value: 0.005 Conclusion: Since p < 0.05, we reject the null hypothesis. There is a significant relationship between location and tractor purchase behaviour.
  • 127. 127 Rural customers are more likely to purchase tractors than semi-urban customers. Hypothesis : Income Level vs Financing Preference Hypotheses:  H₀: There is no significant association between income level and financing preference.  H₁: There is a significant association between income level and financing preference. Test Used: Chi-Square Test of Independence Result:
  • 128. 128  Chi-square value: 13.27  Degrees of Freedom: 6  p-value: 0.039 Conclusion: Since p < 0.05, we reject the null hypothesis. Income level significantly influences financing preference. Lower-income customers prefer bank loans/NBFCs, while higher-income groups choose self-funding.
  • 129. 129 Hypothesis : Subsidy Awareness vs Tractor Ownership Hypotheses:  H₀: Awareness of subsidies has no significant relationship with tractor ownership.  H₁: Awareness significantly affects tractor ownership. Test Used: Chi-Square Test of Independence Result:  Chi-square value: 5.81  Degrees of Freedom: 1  p-value: 0.016 Conclusion: Since p < 0.05, we reject the null hypothesis. Subsidy awareness significantly impacts tractor ownership. Customers aware of subsidies are more likely to own tractors .
  • 130. 130 NEED FOR IMPROVEMENT 1. Prioritize Affordability & Finance: o Pricing Strategy: Focus on entry-level to mid-range tractors with competitive pricing. o Financial Solutions: Offer easy, transparent, and accessible loan options with favorable EMI and terms. Streamline the loan application process. o Subsidies: Proactively assist farmers in availing government subsidies, making it a key part of the sales pitch. o Low Operating Costs: Emphasize and continuously improve fuel efficiency and ensure affordable spare parts. 2. Robust, Functional Products: o Core Performance: Highlight horsepower, engine durability, and overall productivity. These are the main drivers. o Wet Field Operations: Given dominant rice/paddy cultivation, ensure models are well-suited for such conditions. 3. Traditional & Direct Engagement: o Sales Force is King: Invest heavily in well-trained, trustworthy sales representatives who can build relationships, provide in-person demonstrations, and explain benefits clearly. o Strong Dealership Network: Ensure wide and easily accessible dealership presence, especially in deeper rural areas. Proximity is highly valued. o Community & Word-of-Mouth: Foster community engagement. Satisfied customers are powerful advocates. Organize local farmer meetings, field days, and testimonial campaigns. o Limited Digital: Digital marketing (social media, apps, YouTube) will yield very low returns. Focus advertising budgets on traditional media (local radio, community events, print in local languages). 4. Exceptional After-Sales Service: o Home Service: Prioritize and heavily promote on-site/doorstep service, as rural farmers strongly prefer it. o Spares Availability: Ensure easy and affordable access to spare parts in local markets.
  • 131. 131 SUGGESTIONS One of the major problem for the rural areas, users of tractors facing in tractor mileage, it would be nice if the tractor mileage increased. Most of the tractor users want to the increase their service centers. The company should increase field assistants, to know the problems faced by the customers. The tractor price is high because they are using their tractor for agriculture based activities, so to reduce the tractor price and also increase the sales. In order to promote sale of vehicles of company should undertake massive advertisement through different Medias. As there is a cut throat competition from the rivals in the market, advertisement is must.  I suggested that tractors should provide excellent sales service to the customers, which will add to the company brand image. The mileage given by the powertrac tractors is good compare to the other tractors. Therefore I suggest that the company should increase mileage of the tractors by adopting the latest technology in order to increase the sales volume 1. Branded tractor companies should have to reduce price so that every consumer can afford the best deal. 2. Design should be affordable and easy to handle. 3. Quality and status symbol should have to be kept in mind when consumer likes to buy tractor 4. Better sales promotions to be launch by the company so that consumer can have a better knowledge of all types of branded tractor variety in the market. 5. Sum for Gift and discounts should have to increase. 6. Guarantee/Warranty should have to be increase so that consumer like to buy the product having long lasting durability 7. Financing options must be more transparent and customer-friendly. 8. Sales men must be more polite in explaining the entire process of buying it. 9. Test drive be done given in regular basis to potential buyers.
  • 132. 132 SUMMARY : This project presents a comprehensive study of the factors influencing tractor purchase behavior in Ranchi, Jharkhand, with a specific focus on comparing semi-urban and rural customers. The objectives were to identify key purchase drivers, understand demographic influences, and examine the role of financial and marketing elements. As agriculture continues to modernize, tractors have become indispensable to farmers for improving productivity and reducing dependency on manual labour. However, the decision to purchase a tractor is not uniform and is shaped by a mix of economic, social, psychological, and demographic factors that differ between rural and semi-urban farmers. The research was conducted through a structured questionnaire survey involving 80 respondents, evenly divided between rural and semi-urban areas. The data collected was analyzed using statistical tools in Excel to identify patterns, relationships, and significant factors affecting purchase decisions. The findings revealed that affordability, financing availability, brand reputation, after-sales service, and peer recommendations were among the top influencers in farmers’ decisions to purchase tractors. Interestingly, rural farmers were more price-sensitive and dependent on local dealers and word-of-mouth, while semi-urban farmers demonstrated greater brand awareness and access to multiple information sources, including digital media. Education, age, landholding size, and income levels were also found to influence the choice of tractor brand, model, and financing method. A noticeable gap was observed in awareness about government subsidies and financial support schemes, particularly among rural respondents, which limits the potential impact of such initiatives. The study further highlighted that post-purchase satisfaction, service reliability, and spare parts availability play an important role in shaping long-term customer loyalty. Based on the findings, the study suggests that tractor companies, financial institutions, and policymakers must tailor their approaches to meet the unique needs of each customer segment. Focused awareness programs, simplified financing procedures, strong dealer support, and region- specific marketing strategies could significantly enhance tractor adoption rates and overall customer satisfaction.
  • 133. 133 This research not only contributes to understanding consumer behaviour in agricultural markets but also offers practical recommendations for bridging the gap between product offerings and farmer expectations. It sets a foundation for future studies that could further expand into other regions or explore technological and environmental factors affecting farm mechanization.  Economic factors such as cost and financing are primary considerations.  Brand loyalty and after-sales service strongly impact customer satisfaction.  Awareness about government schemes is limited, especially in rural regions.  Demographics like age, education, and landholding size affect behavior patterns.  Information sources differ, with semi-urban farmers using digital means more frequently than rural ones. Advertisement Tools • Banners and Posters • Printing and calendars • Catalogue advertising • Window display • Pamphlets advertising • Construction of circles • Gift bags/carry bags • Anniversary functions • News Papers • Wall Paintings Sales Promotions • Good communication system and customer relations service • Gifts to loyal customers . • Offering gift with the product (LIVE). • Free service coupon warranty. • Fuel checkup camp.
  • 134. 134 FUTURE SCOPE AND SOME TAKEAWAY  Customized Marketing Approaches should be developed for rural and semi-urban segments.  Training and awareness programs about government subsidies and financing procedures are needed, especially in rural areas.  Dealers should be trained to provide clear, trustworthy guidance and support both before and after the sale.  Financial institutions and banks should simplify loan application processes and improve outreach to small and marginal farmers.  Companies should leverage local influencers and farmer groups to enhance trust and visibility in rural markets. Scope for Future Research This study is limited to Ranchi district; similar research in other parts of Jharkhand or other states may reveal additional insights. Future studies could also explore the impact of climate conditions, crop patterns, or digital technology adoption on mechanization behavior. Research could also be conducted to assess the impact of digital marketing and e-commerce on rural customers' purchasing decisions. A comparative analysis of tractor purchase behavior between different states or a deeper qualitative study using focus groups could provide more expressed insights.
  • 135. 135 CONCLUSION AND RECOMMENDATIONS Conclusion:  Tractor purchase in Ranchi is shaped by a mix of price sensitivity, community influence, brand trust, and digital literacy.  The analysis began with a simple question of why consumer behavior and an understanding of such processes is useful from the perspective of the marketer. There were a variety of findings uncovered over the course of this research, the majority of which establish some form of affectation according to psychological influences and messaging stimuli. Inherently linked to brand loyalty and the consumer commitment to the product or brand over time, the means of reducing switching behaviors within extremely saturated marketplaces are directly afforded by marketing communication.  While more traditional marketing models focused on product features and competitive positioning of particular brands or products, modern marketing emphasizes the relationship between consumer behavior and value. By enhancing a product's value, consumers are encouraged to engage in the buying process and are more likely to maintain personal investment in a product over an extended period of time. The researcher has given some policy recommendations for the benefits of the tractor industry.  This study concludes that tractor purchase behavior among farmers in Ranchi’s semi- urban and rural areas is multifaceted and deeply influenced by a combination of socio- economic, psychological, and contextual factors. Affordability remains the most critical factor, followed by financing accessibility, brand trust, and service support. The study finds that semi-urban farmers tend to be more brand-conscious and informed, while rural farmers rely heavily on peer recommendations and dealer suggestions.  The results also indicate that government schemes and subsidies are not always effectively communicated to the target beneficiaries, leading to underutilization. Education level and farm size were also found to play a significant role in shaping buying behavior, with larger and more educated farmers showing a higher tendency to explore multiple options and engage in brand comparisons.
  • 136. 136  Overall, the study highlights the urgent need for a more focused marketing and policy approach that takes into account regional preferences, financial constraints, and awareness gaps. Tailored product offerings, easy-to-understand financing schemes, improved dealer networks, and awareness campaigns could go a long way in improving tractor penetration in rural Jharkhand. Recommendations  Improve service infrastructure in rural areas  Increase awareness of financing and subsidies  Customize outreach based on locality needs 1. Customize Offerings for Rural and Semi-Urban Segments  Manufacturers should tailor tractor models based on the landholding size and usage patterns of customers. Rural farmers often prefer durability and low maintenance, while semi-urban customers may prioritize brand value and features.  Offer entry-level tractors with essential features at affordable prices for small and marginal farmers. 2. Focus on Price Affordability and Financing Support  As initial purchase price and loan facilities were found to be crucial determinants, companies should strengthen partnerships with banks and NBFCs to offer: o Low-interest financing schemes o Flexible repayment options o Seasonal EMI structures aligned with crop cycles 3. Improve After-Sales Service and Spare Parts Availability  Enhance the reach and quality of after-sales service in rural areas by: o Setting up mobile service units o Appointing local service technicians o Ensuring timely availability of genuine spare parts
  • 137. 137 4. Strengthen Dealer and Distribution Network  Expand dealership networks in interior villages and semi-urban peripheries  Train dealers to not only focus on sales but also on consultative selling, helping farmers choose the right model based on usage needs 5. Build Trust through Demonstrations and Education  Organize on-field tractor demonstrations, village fairs, and awareness campaigns to build product familiarity and trust  Collaborate with Krishi Vigyan Kendras and agricultural universities to conduct sessions on efficient tractor usage 6. Emphasize Fuel Efficiency and Maintenance Cost  Highlight fuel efficiency and long-term cost savings in promotional campaigns  Provide free service coupons or discounted maintenance packages to improve brand loyalty 7. Promote Brand Differentiation through Local Testimonials  Use word-of-mouth marketing and testimonials from local influential farmers to promote the brand, especially in areas where literacy and media exposure are limited 8. Enhance Digital Presence and Mobile Access  Develop vernacular mobile apps and WhatsApp-based enquiry systems to help farmers access product information, book services, and compare features  Promote YouTube channels showing tractor performance, farmer stories, and tips in Hindi and regional dialects 10. Regular Market Research and Feedback Collection  Conduct annual customer satisfaction surveys and feedback sessions to understand evolving needs and fine-tune offerings  Monitor seasonal and regional trends in tractor usage to optimize production and inventory management
  • 138. 138 LIMITATION OF THE STUDY: The study was restricted to the RANCHI surroundings only. Therefore, the result of study cannot be generalized to other places.  Due to time shorten, the extensive research could be taken.  The sample size are 80 customers only.  Analysis data collected by questionnaire from the old tractor owners users only.  The customer preference and responses would change over a period of time.  Only includes tractor ownership, not leasing.  There can be errors due to bias of respondents The size of the sampling was not big enough to arrive at strong conclusion. The results should be interpreted with the above limitations in perspective ETHICAL CONSIDERATIONS  Voluntary participation ensured; informed consent taken  Data collected was kept confidential and used solely for academic purposes  Respondents were allowed to skip any question they were uncomfortable answering
  • 139. 139 BIBLIOGRAPHY Books 1. Kotler, P., & Keller, K. L. (2016). Marketing Management (15th ed.). Pearson Education. 2. Schiffman, L. G., & Kanuk, L. L. (2010). Consumer Behavior (10th ed.). Pearson Education.. 3. Malhotra, N. K., & Dash, S. (2016). Marketing Research: An Applied Orientation (7th ed.). Pearson Education. Journals and Research Articles 6. Singh, A., & Singh, R. (2021). "A Study on Factors Influencing Farmers' Tractor Buying Decisions in India", Indian Journal of Marketing, 51(5), 24-31. 7. Gupta, S., & Mishra, A. (2019). "Rural Consumer Behaviour: A Study of Jharkhand Region", Journal of Rural Studies, 64, 130–140. 8. Yadav, R., & Singh, K. (2022). "Impact of Economic and Psychological Factors on Tractor Purchase", Asian Journal of Management Research, 13(1), 88-97. Government and Industry Reports 9.Ministry of Agriculture & Farmers Welfare, Government of India. (2023). Agricultural Mechanization in India – Status and Challenges. 10. NABARD (2022). Rural India and Farm Mechanization Report. National Bank for Agriculture and Rural Development. 11. Jharkhand State Agriculture Department. (2023). Annual Agricultural Progress Report. Company Reports and Websites 12Escorts Limited. (2024). Annual Report 2023–24. Tractor Junction. (2024) 13. Market Trends and Tractor Sales Statistics.
  • 140. 140 Detailed Questionnaire (Structured for Rural & Semi-Urban Buyers) What is your locality type?  1 = Semi-Urban Area  2 = Rural Area Section A: Farmer Demographics and Farm Profile A1_Gender What is your gender?  1 = Male  2 = Female A2_Age What is your age group?  1 = Below 25  2 = 25–35  3 = 36–45  4 = 46–55  5 = 56–65  6 = Above 65 A3_Education What is your highest level of education?  1 = Illiterate  2 = Primary School (Class 1–5)  3 = Middle School (Class 6–8)  4 = High School (Class 9–10)  5 = Intermediate/12th Pass
  • 141. 141  6 = Graduate (Degree/Diploma)  7 = Postgraduate or Higher A4_Occupation What is your occupation? (Tick all that apply)  A4_Occupation_FullTimeFarmer  A4_Occupation_FarmerPartTime  A4_Occupation_Other (Specify if selected) A5_Landholding How much land do you own or cultivate?  1 = Less than 1 acre  2 = 1–2.5 acres  3 = 2.6–5 acres  4 = 5.1–10 acres  5 = More than 10 acres A6_Crops Grown (Tick all that apply)  A6_Crop_Paddy  A6_Crop_Wheat  A6_Crop_Maize  A6_Crop_Pulses  A6_Crop_Oilseeds  A6_Crop_Other (Specify) A7_Own_Tractor Do you own a tractor?  1 = Yes
  • 142. 142  0 = No A8_Brand Owned (Tick all that apply)  A8_Brand_Powertrac  A8_Brand_Mahindra  A8_Brand_JohnDeere  A8_Brand_Swaraj  A8_Brand_Eicher  A8_Brand_Other (Specify) A9_Purchase_Year Year of tractor purchase: ___________ A10_New_Used Was the tractor new or used when purchased?  1 = New  2 = Used Section B: Economic Factors Influencing Purchase B1_Income What is your annual household income?  1 = Below ₹1,00,000  2 = ₹1,00,001 – ₹2,50,000  3 = ₹2,50,001 – ₹5,00,000  4 = ₹5,00,001 – ₹7,50,000  5 = ₹7,50,001 – ₹10,00,000  6 = Above ₹10,00,000  7 = Prefer not to disclose
  • 143. 143 B2 Importance of Factors (Rate on a scale of 1 to 5)  B2a_Imp_Price  B2b_Imp_Financing  B2c_Imp_EMI_Amount  B2d_Imp_Loan_Terms  B2e_Imp_ValueMoney  B2f_Imp_MaintCost B3_Availed_Subsidy  1 = Yes  0 = No B4_Subsidy_Influence  1 = Strongly Influenced  2 = Moderately Influenced  3 = Slightly Influenced  4 = Not at all Influenced  5 = Not Applicable B5_NoTractor_Reason (Multi-select)  Too Expensive  No Need  Difficulty in Getting Loan  Not Aware  Other (Specify) Section C: Social Factors C1 Influence by People (Rate each on a scale of 1 to 5)
  • 144. 144  C1a_Inf_Family  C1b_Inf_Peers  C1c_Inf_Community  C1d_Inf_Neighboring_Farmers  C1e_Inf_SalesRep C2_Discuss_Tractor How often do you discuss tractors with others?  1 = Always  2 = Frequently  3 = Sometimes  4 = Rarely  5 = Never C3_Imp_BrandReputation_Community How important is a brand’s reputation in your community?  1 = Not Important at All to 5 = Extremely Important Section D: Personal Factors D1 Influence by Personal Experience (Rate each on a scale of 1 to 5)  D1a_Inf_Experience  D1b_Inf_Productivity  D1c_Inf_Design  D1d_Inf_Comfort  D1e_Inf_Prestige D2_Digital_Comfort  1 = Very Comfortable
  • 145. 145  2 = Moderately Comfortable  3 = Slightly Comfortable  4 = Not Comfortable at All D3_Internet_Freq  1 = Daily  2 = Few times a week  3 = Few times a month  4 = Rarely  5 = Never Digital Information & Purchase Trends Variable Name Response Type Description D4_Used_YouTube_For_Info 1 = Yes 0 = No Did you use YouTube to gather tractor information? D5_Used_Mobile_App 1 = Yes 0 = No Did you use any mobile app for comparing or reviewing tractors? D6_Booked_Online 1 = Yes 0 = No Was any part of the tractor purchase process done online? Section E: Psychological Factors & Brand Perception E1 Importance of Brand Attributes (Rate on a scale of 1 to 5)  E1a_Imp_BrandTrust  E1b_Imp_PastExp
  • 146. 146  E1c_Imp_Design  E1d_Imp_EmotionalConnect  E1e_Imp_Innovation E2_Familiar_Powertrac  1 = Very Familiar  2 = Moderately Familiar  3 = Slightly Familiar  4 = Not Familiar at All E3_Considered_Powertrac  1 = Yes, seriously considered  2 = Yes, briefly considered  3 = No, never considered E4_Powertrac_Keywords In one or more words, describe Powertrac: Variable Name Response Type Description E5_Powertrac_vs_Mahindra 1 = Much better 2 = Slightly better 3 = Same 4 = Slightly worse 5 = Much Compare Powertrac with Mahindra (can repeat with other brands).
  • 147. 147 Variable Name Response Type Description worse E6_Most_Trusted_Brand Text In your opinion, which tractor brand is most trustworthy and why? Section F: Product-Related Attributes (Marketing Mix) F1 Importance of Features (Rate each from 1 to 5)  F1a_Imp_HP  F1b_Imp_Engine  F1c_Imp_FuelEfficiency  F1d_Imp_Transmission  F1e_Imp_Braking  F1f_Imp_Warranty  F1g_Imp_ServiceNetwork  F1h_Imp_DesignLook  F1i_Imp_SmartFeatures F2_Info_Sources (Tick all that apply)  Dealership  Sales Representative  Advertisement  TV/Radio  YouTube  Friends/Relatives
  • 148. 148  Other (Specify) F3_Imp_DealershipProximity F4_Imp_Demonstrations Rate both from 1 (Not Important) to 5 (Extremely Important) Sustainability & Fuel Efficiency Awareness Variable Name Response Type Description F5_Fuel_Type 1 = Diesel 2 = CNG 3 = Electric 4 = Hybrid Preferred fuel type for future tractors. F6_Importance_Fuel_Economy 1 = Not at All Important to 5 = Extremely Important Importance given to mileage/fuel efficiency. F7_Interest_Electric_Tractor 1 = Yes 2 = Maybe Willingness to consider electric tractor in future Section G: Purchase Decision Process G1_Motivation (Select only one)  1 = Increase farm productivity  2 = Replace old tractor  3 = Expand farming operations  4 = Reduce labor cost  5 = Rental to others
  • 149. 149  6 = Government schemes  7 = Prestige/modernization  8 = Advanced techniques  9 = Other (Specify) G2_Brands_Considered (Tick all that apply)  Powertrac  Mahindra  Swaraj  John Deere  Eicher  Other  Did not consider any G3_Most_Imp_Factor (Select only one)  1 = Price  2 = Fuel Efficiency  3 = After-Sales Service  4 = Brand Reputation  5 = Horsepower  6 = Spares Availability  7 = Financing Options  8 = Word-of-mouth  9 = Dealership Proximity  10 = Subsidy  11 = Technology  12 = Other (Specify)
  • 150. 150 G4_Challenges List any problems you faced while purchasing the tractor: Usage & ROI (Return on Investment) Variable Name Response Type Description G5_Usage_Hours_Per_Day Numeric (e.g., 5) On average, how many hours per day do you use the tractor? G6_Earnings_From_Rental Numeric (₹) Approximate monthly income from tractor rental (if any). G7_Recovery_Period 1 = <1 year 2 = 1–3 years 3 = >3 years 4 = Not yet recovered Time to recover investment cost. Section H: Post-Purchase Behaviour & Satisfaction H1_Overall_Sat  1 = Very Dissatisfied  2 = Dissatisfied  3 = Neutral  4 = Satisfied  5 = Very Satisfied H2_Sat_AfterSales  1 to 5 as above  6 = Not Applicable
  • 151. 151 H3_Sat_Spares  1 to 5 scale  H4_Recommend_Brand  1 = Definitely Not  2 = Probably Not  3 = Neutral  4 = Probably Yes  5 = Definitely Yes H5_Buy_Same_Brand  1 = Very Unlikely  2 = Unlikely  3 = Neutral  4 = Likely  5 = Very Likely H6_Improvements What improvements would you like to see? After-Sales Service Expectations Variable Name Response Type Description H7_Service_Visits Numeric (0– 10) Number of service visits within the first year. H8_Service_ResponseTime 1 = <1 day 2 = 1–3 days 3 = 4–7 days Average time taken for service after a request.
  • 152. 152 Variable Name Response Type Description 4 = More than 7 days H9_Prefer_Home_Service 1 = Yes 0 = No Do you prefer on-site (home) service instead of workshop visits? Farmer Support & Satisfaction Programs Variable Name Response Type Description H10_Attended_Training 1 = Yes 0 = No Have you attended any tractor operation/maintenance training? H11_Received_Followup_Call 1 = Yes 0 = No Did the brand/dealer follow up after your purchase? H12_Loyalty_Reward_Offered 1 = Yes 0 = No Were you offered any loyalty bonus, free service, or reward program