SlideShare a Scribd company logo
ADF Performance Monitor
Frank Houweling - 2015
2
Why Monitoring
• Applications often contain frustrating blind spots and mysterious,
recurring problems that are often difficult to identify, diagnose, and fix.
• With business-critical applications, it’s very important to have a simple
and fast way to monitor, diagnose, and resolve application problems
before they affect revenue.
3
End User Experience:
Call and Ask all Customers ?
4
ADF Performance Monitor
• Advanced tool designed for measuring, analyzing, improving, and
checking the performance and health of Oracle ADF applications
• Tracks and collects crucial production performance information of the
application’s runtime ADF components that are not standard provided by
Oracle
• Helps development, QA, and operation teams to detect, analyze and
resolve common and less common issues in response times, health and
resource usage of ADF applications
• Can be used during development, test and production
• Is a library attached to your application
• Less than 1 day for implementation
• Needs to add a very small amount of code to application to make metrics
classes active
5
Issues are reported in a Dashboard
Reporting App and in JDeveloper
6
Month, Week, Day, Hour, 5
Minute Overview
• Shows real-time critical information about the ADF application's performance
• Are response times within or outside SLA boundaries? Is immediate action required?
• What is the error rate? What is the health of the JVM?
7
Monitor SLA
• from 15:00 to 16:00 the response times have increased significantly (more
red and yellow colored parts in the 15u bar)
• This should be a trigger to investigate
8
Monitor Details of All HTTP
Requests
– Client Response Time (including network to client and Browser load time)
9
Monitor HTTP Request Details
of Specific End-Users (1)
– Select an end-user name in list
– Performance and problems of specific end-users can now be analyzed
10
Monitor Requests of Specific
End-Users (2)
– When and where did the end-user click ?
– What were the response times of this end-user ?
11
Request and Response
Network Time
Database Application Server Network Client
Request
Response
12
Browser Load Time
Database Application Server Network Client
Request
Response
13
Example Slow Network/Browser
Load Time (1) - Day Overview
14
Example Slow Network/Browser
Load Time (2) – Hour Overview
15
Example Slow Network/Browser
Load Time (3) – 5 Min Overview
16
Example Slow Network/Browser
Load Time (4) – Request Details
17
Example Network/Browser
Load Time – Resolved
• Next day the network problem was resolved
- We can see this in the following hour overview graph were there is much less purple colour (right bottom):
18
Zoom in Into WLS Managed
Server (or Monitor All Together)
• Select / Filter on Managed Server
• Compare Performance between Managed Servers
19
JVM Memory Problem Alerts
20
Quickly Troubleshoot Customer
Complains
• All errors with all relevant detail information are recorded
• Error stack traces and call stacks are collected to allow the developer to
quickly troubleshoot these errors
• This information helps to discover, analyze and resolve errors that happen
frequently on test / production environments
21
Troubleshoot Production
Errors (1)
• Top 10 Production Errors / Faults by Occurrences
22
Trouble shoot Production
Errors (2)
Solution: increase Maximum Capacity of datasource in WLS console
23
Trouble shoot Production
Errors (3)
24
Very Easy to Find Root Cause
of Problems
• A call stack provides visibility into which ADF methods caused other
methods to be executed, organized by the sequence of their execution.
– A complete breakdown of the ADF request processing, including all ADF method
executions, along with elapsed times is printed, organized by lifecycle phase.
– Inefficiencies can be identified from this report, for example long running ViewObject
queries, slow ApplicationModule activations & passivations, e.g.
25
Troubleshoot Slow ViewObject
Queries
• Analyse runtime SQL executed against the database
26
ViewObject Query
Performance Aggregated
• AVG, Occurrences and Total execution time
27
Slow Activation of
ApplicationModule
28
Slow Passivation of
ApplicationModule
29
Worst ApplicationModule
activations & passivations
overview
• Troubleshoot ApplicationModule Pooling problems
• Set the most optimal ApplicationModule Pooling parameter settings
30
Worst ApplicationModule
activations & passivations
overview (2)
31
Occurrences overview
32
Loaded Rows in Memory (1)
33
ADF BC Memory Analyzer (2)
– Example: in this production ADF app, for a single ViewObject instance,
more than 900.000 rows were loaded in the ADF app (Blue) !
– In this production ADF app, for a single ViewObject instance,
more than 900.000 rows were loaded in the ADF app (!)
– Loading 900.000 rows takes more than 10 minutes
34
Loaded Rows in Memory (3)-
ADF CallStack
35
Warnings and Suggested
Solutions
36
ADF Performance Monitor
Warnings and Detailed Help
• Fetching thousands of rows from database
• Slow passivation and activation of transient attributes
• Redundant ViewObject query executions
• Inefficient ViewObject fetchsize
• Inefficient PageDef iterator rangesize
• Slow executions of
– ViewObject queries
– EntityObject DML operations, database locks
– ApplicationModule activations / passivations / transactions
– PageDefinition operations / ApplicationModule custom methods
– PageDefinition iterators
– Webservices
– Java methods
• More
37
The tool can be dynamically turned
on and off (at runtime) at all times
• The ADF Performance Monitor can be dynamically turned on and off (at
runtime) at all times in the Enterprise Manager
• When the monitor is turned off there is no performance overhead because
the metrics classes are not active
38
Use in JDeveloper during
development
39
Configuration
• All configuration steps are well documented in the installation guide
– An ADF library needs to be added to your ADF application
– A very small amount of code needs to be added to instrument the ADF application.
– The metrics classes make use of extension points in the ADF framework in order to
measure the time every action/step takes in a http request.
• Implementation takes less than 1 day, usually no more than a few hours
40
Overhead
• Load tests show that the overhead is less than 3 to 4 percent.
• This overhead is caused by the very detailed collection of performance
metrics.
• The metrics collection can be dynamically turned on and off (at runtime) at
all times.
• When the monitor is turned off there is no performance overhead because
the metrics classes are not active.
41
Support
• Standard Oracle stack
– ADF Business Components
– ADF Model
– ADF Controller
– ADF Faces
• JPA/EJB
– EclipseLink/TopLink
• POJO JavaBean DataControl
• JAX-WS Webservices
• It is possible to instrument (calls to) custom Java methods and 3rd party
libraries
• Application servers:
– WebLogic
– Glassfish
– Tomcat
42
End-users will be more happy
43
Henri Peters - Project Manager
Dutch Ministry of Justice
“For us it is of great value that we can continuously identify the
weakest link, even if there is no actual performance problem (yet)."
“We can even drill down to the level of an individual user.
Sometimes we go so far that we proactively approach end-users:
before they complain we already have contacted them.”
* More quotes of ADF experts and managers at:
http://tinyurl.com/nxgkgr6 or http://www.amis.nl/ADFperformancemonitor
44
Videos available
http://tinyurl.com/npu732q or http://www.amis.nl/ADFperformancemonitor
• Overview ADF Performance Monitor (13 min)
• Customer case Dutch Ministry of Justice (4 min)
45
Whitepaper
Whitepaper has detailed information about the architecture and implementation
http://tinyurl.com/qgfh22u or http://www.amis.nl/ADFperformancemonitor
Content:
Executive overview
Introduction
Oracle ADF applications and performance
ADF Performance Monitor overview
Use in JDeveloper
Use in test and production environment
Dashboard reporting application
Summary and details HTTP response times
ADF framework call stack
Warnings and suggested solutions
Worst performing executions in ADF BC and model layer
Error stacktraces
JVM performance
Product architecture
Configuration
Turn on/off at all times
Prerequisites
Monitored Events
46
More information on
http://www.amis.nl/ADFperformancemonitor
Contact us for more information and pricing.
info@amis.nl or call +31 30 6016000

More Related Content

What's hot (20)

PPTX
Extreme Makeover OnBase Edition
DataBank, A KYOCERA Group Company
 
PDF
Mastering SAP Monitoring - SAP HANA Monitoring, Management & Automation
Linh Nguyen
 
PDF
Oracle R12 EBS Performance Tuning
Scott Jenner
 
PPTX
Solution Manager - SAP NW BW on HANA Setup Part 3 of 3 (Technical Monitoring ...
Linh Nguyen
 
PDF
Ebs performance tuning session feb 13 2013---Presented by Oracle
Akash Pramanik
 
PDF
How to Turn New Recruits Into Oracle EPM Infrastructure Gurus
nking821
 
PDF
Internals of concurent managers
Maris Elsins
 
PPTX
SAP TechEd 2013 session Tec118 managing your-environment
Chris Kernaghan
 
PPTX
Mainframe VUG Presentation April 2016
Serena Software
 
PDF
Resilience Planning & How the Empire Strikes Back
C4Media
 
PPTX
An Introduction to Performance Testing
SWAAM Tech
 
PPTX
Application Manager Presentasi
Fanky Christian
 
PPT
Fitur AppManager - Application Manager ManageEngine
Fanky Christian
 
PPTX
SharePoint Backup best Practices
Ron Charity
 
PDF
Solution Manager 7.2 SAP Monitoring - Part 2 - Configuration
Linh Nguyen
 
PPTX
Product Information - Fuse Management Central 1.0.0
antonio.carvalho
 
PPTX
Monitoring your physical, virtual and cloud infrastructure with Applications ...
ManageEngine, Zoho Corporation
 
PPTX
Improving User Experience with Applications Manager
ManageEngine, Zoho Corporation
 
PPTX
Server and application monitoring webinars [Applications Manager] - Part 4
ManageEngine, Zoho Corporation
 
PDF
Automatic Performance Modelling from Application Performance Management (APM)...
Paul Brebner
 
Extreme Makeover OnBase Edition
DataBank, A KYOCERA Group Company
 
Mastering SAP Monitoring - SAP HANA Monitoring, Management & Automation
Linh Nguyen
 
Oracle R12 EBS Performance Tuning
Scott Jenner
 
Solution Manager - SAP NW BW on HANA Setup Part 3 of 3 (Technical Monitoring ...
Linh Nguyen
 
Ebs performance tuning session feb 13 2013---Presented by Oracle
Akash Pramanik
 
How to Turn New Recruits Into Oracle EPM Infrastructure Gurus
nking821
 
Internals of concurent managers
Maris Elsins
 
SAP TechEd 2013 session Tec118 managing your-environment
Chris Kernaghan
 
Mainframe VUG Presentation April 2016
Serena Software
 
Resilience Planning & How the Empire Strikes Back
C4Media
 
An Introduction to Performance Testing
SWAAM Tech
 
Application Manager Presentasi
Fanky Christian
 
Fitur AppManager - Application Manager ManageEngine
Fanky Christian
 
SharePoint Backup best Practices
Ron Charity
 
Solution Manager 7.2 SAP Monitoring - Part 2 - Configuration
Linh Nguyen
 
Product Information - Fuse Management Central 1.0.0
antonio.carvalho
 
Monitoring your physical, virtual and cloud infrastructure with Applications ...
ManageEngine, Zoho Corporation
 
Improving User Experience with Applications Manager
ManageEngine, Zoho Corporation
 
Server and application monitoring webinars [Applications Manager] - Part 4
ManageEngine, Zoho Corporation
 
Automatic Performance Modelling from Application Performance Management (APM)...
Paul Brebner
 

Viewers also liked (12)

PDF
Leveraging Microsoft BI Toolset to Monitor Performance
Dan English
 
PPT
Plant performance monitor
sayedshiban
 
PDF
1 architecture & design
Mark Swarbrick
 
PPTX
How to Monitor Performance of your Jenkins Deployment
Noa Harel
 
PDF
Presentation a performance monitor for solaris and linux
xKinAnx
 
PDF
Efficient Performance Analysis and Tuning with MySQL Enterprise Monitor
Mark Matthews
 
PDF
#PCM15: - How to monitor the use and performance of BI Server using the Plug-...
Caio Moreno
 
PPTX
How to Monitor Application Performance in a Container-Based World
Ken Owens
 
PPTX
Performance Testing using LoadRunner - Kamran Khan [chromeis.com]
Kamran Khan
 
PDF
Introduction to Software Defined Networking (SDN)
rjain51
 
PDF
Best Practices in Maintenance and Reliability
Ricky Smith CMRP, CMRT
 
PDF
Introduction to Network Function Virtualization (NFV)
rjain51
 
Leveraging Microsoft BI Toolset to Monitor Performance
Dan English
 
Plant performance monitor
sayedshiban
 
1 architecture & design
Mark Swarbrick
 
How to Monitor Performance of your Jenkins Deployment
Noa Harel
 
Presentation a performance monitor for solaris and linux
xKinAnx
 
Efficient Performance Analysis and Tuning with MySQL Enterprise Monitor
Mark Matthews
 
#PCM15: - How to monitor the use and performance of BI Server using the Plug-...
Caio Moreno
 
How to Monitor Application Performance in a Container-Based World
Ken Owens
 
Performance Testing using LoadRunner - Kamran Khan [chromeis.com]
Kamran Khan
 
Introduction to Software Defined Networking (SDN)
rjain51
 
Best Practices in Maintenance and Reliability
Ricky Smith CMRP, CMRT
 
Introduction to Network Function Virtualization (NFV)
rjain51
 
Ad

Similar to ADF Performance Monitor (20)

PDF
ADF performance monitor at AMIS25
Getting value from IoT, Integration and Data Analytics
 
PDF
collab2011-tuning-ebusiness-421966.pdf
ElboulmaniMohamed
 
PDF
Presentation application server diagnostics
xKinAnx
 
PDF
performancetestinganoverview-110206071921-phpapp02.pdf
MAshok10
 
PPTX
Application Performance Management
Noriaki Tatsumi
 
PDF
Adding Value in the Cloud with Performance Test
Rodolfo Kohn
 
PPTX
Performance Assurance for Packaged Applications
Alexander Podelko
 
PDF
Database Visibility and Troubleshooting Hands-on Lab - AppSphere16
AppDynamics
 
PDF
Operating a Highly Available Cloud Service
Depankar Neogi
 
PPTX
Performance tuning Grails applications SpringOne 2GX 2014
Lari Hotari
 
PDF
Journey to the center of DevOps - v6
Venkat Janardhanam, MS, MBA
 
PPTX
Service quality monitoring system architecture
Matsuo Sawahashi
 
PPTX
Introduction to performance testing
Richard Bishop
 
PPTX
Lecture 2 Software Development Process and SDCL models.pptx
AOmaAli
 
PDF
Visual Studio Profiler
Betclic Everest Group Tech Team
 
PPTX
Closing the door on application performance problems
ManageEngine, Zoho Corporation
 
PDF
Oracle ADF Architecture TV - Development - Performance & Tuning
Chris Muir
 
PPTX
Blackboard DevCon 2011 - Developing B2 for Performance and Scalability
Noriaki Tatsumi
 
PDF
Analysing and Troubleshooting Performance Issues in SAP BusinessObjects BI Re...
BI Brainz
 
PPTX
CON5451_Brydon-OOW2014_Brydon_CON5451 (1).pptx
SergioBruno21
 
collab2011-tuning-ebusiness-421966.pdf
ElboulmaniMohamed
 
Presentation application server diagnostics
xKinAnx
 
performancetestinganoverview-110206071921-phpapp02.pdf
MAshok10
 
Application Performance Management
Noriaki Tatsumi
 
Adding Value in the Cloud with Performance Test
Rodolfo Kohn
 
Performance Assurance for Packaged Applications
Alexander Podelko
 
Database Visibility and Troubleshooting Hands-on Lab - AppSphere16
AppDynamics
 
Operating a Highly Available Cloud Service
Depankar Neogi
 
Performance tuning Grails applications SpringOne 2GX 2014
Lari Hotari
 
Journey to the center of DevOps - v6
Venkat Janardhanam, MS, MBA
 
Service quality monitoring system architecture
Matsuo Sawahashi
 
Introduction to performance testing
Richard Bishop
 
Lecture 2 Software Development Process and SDCL models.pptx
AOmaAli
 
Visual Studio Profiler
Betclic Everest Group Tech Team
 
Closing the door on application performance problems
ManageEngine, Zoho Corporation
 
Oracle ADF Architecture TV - Development - Performance & Tuning
Chris Muir
 
Blackboard DevCon 2011 - Developing B2 for Performance and Scalability
Noriaki Tatsumi
 
Analysing and Troubleshooting Performance Issues in SAP BusinessObjects BI Re...
BI Brainz
 
CON5451_Brydon-OOW2014_Brydon_CON5451 (1).pptx
SergioBruno21
 
Ad

More from Getting value from IoT, Integration and Data Analytics (20)

PPTX
AMIS Oracle OpenWorld en Code One Review 2018 - Blockchain, Integration, Serv...
Getting value from IoT, Integration and Data Analytics
 
PPTX
AMIS Oracle OpenWorld en Code One Review 2018 - Pillar 2: Custom Application ...
Getting value from IoT, Integration and Data Analytics
 
PPTX
AMIS Oracle OpenWorld en Code One Review 2018 - Pillar 2: SaaS
Getting value from IoT, Integration and Data Analytics
 
PPTX
AMIS Oracle OpenWorld en Code One Review 2018 - Pillar 1: Data
Getting value from IoT, Integration and Data Analytics
 
PPTX
AMIS Oracle OpenWorld en Code One Review 2018 - Pillar 1: Cloud Infrastructure
Getting value from IoT, Integration and Data Analytics
 
PPTX
10 tips voor verbetering in je Linkedin profiel
Getting value from IoT, Integration and Data Analytics
 
PPTX
Iot in de zorg the next step - fit for purpose
Getting value from IoT, Integration and Data Analytics
 
PPTX
Iot overview .. Best practices and lessons learned by Conclusion Conenct
Getting value from IoT, Integration and Data Analytics
 
PPTX
IoT Fit for purpose - how to be successful in IOT Conclusion Connect
Getting value from IoT, Integration and Data Analytics
 
PPTX
Industry and IOT Overview of protocols and best practices Conclusion Connect
Getting value from IoT, Integration and Data Analytics
 
PPTX
IoT practical case using the people counter sensing traffic density build usi...
Getting value from IoT, Integration and Data Analytics
 
PPTX
Introduction overviewmachinelearning sig Door Lucas Jellema
Getting value from IoT, Integration and Data Analytics
 
PPTX
Oracle OpenWorld 2017 Review (31st October 2017 - 250 slides)
Getting value from IoT, Integration and Data Analytics
 
PPTX
Ethereum smart contracts - door Peter Reitsma
Getting value from IoT, Integration and Data Analytics
 
PPTX
Blockchain - Techniek en usecases door Robert van Molken - AMIS - Conclusion
Getting value from IoT, Integration and Data Analytics
 
PPTX
kennissessie blockchain - Wat is Blockchain en smart contracts @Conclusion
Getting value from IoT, Integration and Data Analytics
 
PPTX
Internet of Things propositie - Enterprise IOT - AMIS - Conclusion
Getting value from IoT, Integration and Data Analytics
 
PDF
Omc AMIS evenement 26012017 Dennis van Soest
Getting value from IoT, Integration and Data Analytics
 
AMIS Oracle OpenWorld en Code One Review 2018 - Blockchain, Integration, Serv...
Getting value from IoT, Integration and Data Analytics
 
AMIS Oracle OpenWorld en Code One Review 2018 - Pillar 2: Custom Application ...
Getting value from IoT, Integration and Data Analytics
 
AMIS Oracle OpenWorld en Code One Review 2018 - Pillar 2: SaaS
Getting value from IoT, Integration and Data Analytics
 
AMIS Oracle OpenWorld en Code One Review 2018 - Pillar 1: Data
Getting value from IoT, Integration and Data Analytics
 
AMIS Oracle OpenWorld en Code One Review 2018 - Pillar 1: Cloud Infrastructure
Getting value from IoT, Integration and Data Analytics
 
10 tips voor verbetering in je Linkedin profiel
Getting value from IoT, Integration and Data Analytics
 
Iot in de zorg the next step - fit for purpose
Getting value from IoT, Integration and Data Analytics
 
Iot overview .. Best practices and lessons learned by Conclusion Conenct
Getting value from IoT, Integration and Data Analytics
 
IoT Fit for purpose - how to be successful in IOT Conclusion Connect
Getting value from IoT, Integration and Data Analytics
 
Industry and IOT Overview of protocols and best practices Conclusion Connect
Getting value from IoT, Integration and Data Analytics
 
IoT practical case using the people counter sensing traffic density build usi...
Getting value from IoT, Integration and Data Analytics
 
Introduction overviewmachinelearning sig Door Lucas Jellema
Getting value from IoT, Integration and Data Analytics
 
Oracle OpenWorld 2017 Review (31st October 2017 - 250 slides)
Getting value from IoT, Integration and Data Analytics
 
Ethereum smart contracts - door Peter Reitsma
Getting value from IoT, Integration and Data Analytics
 
Blockchain - Techniek en usecases door Robert van Molken - AMIS - Conclusion
Getting value from IoT, Integration and Data Analytics
 
kennissessie blockchain - Wat is Blockchain en smart contracts @Conclusion
Getting value from IoT, Integration and Data Analytics
 
Internet of Things propositie - Enterprise IOT - AMIS - Conclusion
Getting value from IoT, Integration and Data Analytics
 
Omc AMIS evenement 26012017 Dennis van Soest
Getting value from IoT, Integration and Data Analytics
 

Recently uploaded (20)

PPTX
IT Runs Better with ThousandEyes AI-driven Assurance
ThousandEyes
 
PDF
NewMind AI Weekly Chronicles – July’25, Week III
NewMind AI
 
PPTX
Agile Chennai 18-19 July 2025 | Workshop - Enhancing Agile Collaboration with...
AgileNetwork
 
PDF
RAT Builders - How to Catch Them All [DeepSec 2024]
malmoeb
 
PPTX
AI in Daily Life: How Artificial Intelligence Helps Us Every Day
vanshrpatil7
 
PDF
Per Axbom: The spectacular lies of maps
Nexer Digital
 
PDF
How ETL Control Logic Keeps Your Pipelines Safe and Reliable.pdf
Stryv Solutions Pvt. Ltd.
 
PDF
SalesForce Managed Services Benefits (1).pdf
TechForce Services
 
PPTX
python advanced data structure dictionary with examples python advanced data ...
sprasanna11
 
PDF
OpenInfra ID 2025 - Are Containers Dying? Rethinking Isolation with MicroVMs.pdf
Muhammad Yuga Nugraha
 
PDF
CIFDAQ's Market Wrap : Bears Back in Control?
CIFDAQ
 
PDF
OFFOFFBOX™ – A New Era for African Film | Startup Presentation
ambaicciwalkerbrian
 
PDF
Brief History of Internet - Early Days of Internet
sutharharshit158
 
PPTX
What-is-the-World-Wide-Web -- Introduction
tonifi9488
 
PDF
Structs to JSON: How Go Powers REST APIs
Emily Achieng
 
PPTX
The Future of AI & Machine Learning.pptx
pritsen4700
 
PDF
Generative AI vs Predictive AI-The Ultimate Comparison Guide
Lily Clark
 
PDF
Tea4chat - another LLM Project by Kerem Atam
a0m0rajab1
 
PPTX
Using Google Data Studio (Looker Studio) to Create Effective and Easy Data Re...
Orage Technologies
 
PPTX
Agile Chennai 18-19 July 2025 Ideathon | AI Powered Microfinance Literacy Gui...
AgileNetwork
 
IT Runs Better with ThousandEyes AI-driven Assurance
ThousandEyes
 
NewMind AI Weekly Chronicles – July’25, Week III
NewMind AI
 
Agile Chennai 18-19 July 2025 | Workshop - Enhancing Agile Collaboration with...
AgileNetwork
 
RAT Builders - How to Catch Them All [DeepSec 2024]
malmoeb
 
AI in Daily Life: How Artificial Intelligence Helps Us Every Day
vanshrpatil7
 
Per Axbom: The spectacular lies of maps
Nexer Digital
 
How ETL Control Logic Keeps Your Pipelines Safe and Reliable.pdf
Stryv Solutions Pvt. Ltd.
 
SalesForce Managed Services Benefits (1).pdf
TechForce Services
 
python advanced data structure dictionary with examples python advanced data ...
sprasanna11
 
OpenInfra ID 2025 - Are Containers Dying? Rethinking Isolation with MicroVMs.pdf
Muhammad Yuga Nugraha
 
CIFDAQ's Market Wrap : Bears Back in Control?
CIFDAQ
 
OFFOFFBOX™ – A New Era for African Film | Startup Presentation
ambaicciwalkerbrian
 
Brief History of Internet - Early Days of Internet
sutharharshit158
 
What-is-the-World-Wide-Web -- Introduction
tonifi9488
 
Structs to JSON: How Go Powers REST APIs
Emily Achieng
 
The Future of AI & Machine Learning.pptx
pritsen4700
 
Generative AI vs Predictive AI-The Ultimate Comparison Guide
Lily Clark
 
Tea4chat - another LLM Project by Kerem Atam
a0m0rajab1
 
Using Google Data Studio (Looker Studio) to Create Effective and Easy Data Re...
Orage Technologies
 
Agile Chennai 18-19 July 2025 Ideathon | AI Powered Microfinance Literacy Gui...
AgileNetwork
 

ADF Performance Monitor

  • 1. ADF Performance Monitor Frank Houweling - 2015
  • 2. 2 Why Monitoring • Applications often contain frustrating blind spots and mysterious, recurring problems that are often difficult to identify, diagnose, and fix. • With business-critical applications, it’s very important to have a simple and fast way to monitor, diagnose, and resolve application problems before they affect revenue.
  • 3. 3 End User Experience: Call and Ask all Customers ?
  • 4. 4 ADF Performance Monitor • Advanced tool designed for measuring, analyzing, improving, and checking the performance and health of Oracle ADF applications • Tracks and collects crucial production performance information of the application’s runtime ADF components that are not standard provided by Oracle • Helps development, QA, and operation teams to detect, analyze and resolve common and less common issues in response times, health and resource usage of ADF applications • Can be used during development, test and production • Is a library attached to your application • Less than 1 day for implementation • Needs to add a very small amount of code to application to make metrics classes active
  • 5. 5 Issues are reported in a Dashboard Reporting App and in JDeveloper
  • 6. 6 Month, Week, Day, Hour, 5 Minute Overview • Shows real-time critical information about the ADF application's performance • Are response times within or outside SLA boundaries? Is immediate action required? • What is the error rate? What is the health of the JVM?
  • 7. 7 Monitor SLA • from 15:00 to 16:00 the response times have increased significantly (more red and yellow colored parts in the 15u bar) • This should be a trigger to investigate
  • 8. 8 Monitor Details of All HTTP Requests – Client Response Time (including network to client and Browser load time)
  • 9. 9 Monitor HTTP Request Details of Specific End-Users (1) – Select an end-user name in list – Performance and problems of specific end-users can now be analyzed
  • 10. 10 Monitor Requests of Specific End-Users (2) – When and where did the end-user click ? – What were the response times of this end-user ?
  • 11. 11 Request and Response Network Time Database Application Server Network Client Request Response
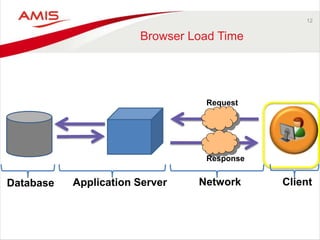
  • 12. 12 Browser Load Time Database Application Server Network Client Request Response
  • 13. 13 Example Slow Network/Browser Load Time (1) - Day Overview
  • 14. 14 Example Slow Network/Browser Load Time (2) – Hour Overview
  • 15. 15 Example Slow Network/Browser Load Time (3) – 5 Min Overview
  • 16. 16 Example Slow Network/Browser Load Time (4) – Request Details
  • 17. 17 Example Network/Browser Load Time – Resolved • Next day the network problem was resolved - We can see this in the following hour overview graph were there is much less purple colour (right bottom):
  • 18. 18 Zoom in Into WLS Managed Server (or Monitor All Together) • Select / Filter on Managed Server • Compare Performance between Managed Servers
  • 20. 20 Quickly Troubleshoot Customer Complains • All errors with all relevant detail information are recorded • Error stack traces and call stacks are collected to allow the developer to quickly troubleshoot these errors • This information helps to discover, analyze and resolve errors that happen frequently on test / production environments
  • 21. 21 Troubleshoot Production Errors (1) • Top 10 Production Errors / Faults by Occurrences
  • 22. 22 Trouble shoot Production Errors (2) Solution: increase Maximum Capacity of datasource in WLS console
  • 24. 24 Very Easy to Find Root Cause of Problems • A call stack provides visibility into which ADF methods caused other methods to be executed, organized by the sequence of their execution. – A complete breakdown of the ADF request processing, including all ADF method executions, along with elapsed times is printed, organized by lifecycle phase. – Inefficiencies can be identified from this report, for example long running ViewObject queries, slow ApplicationModule activations & passivations, e.g.
  • 25. 25 Troubleshoot Slow ViewObject Queries • Analyse runtime SQL executed against the database
  • 26. 26 ViewObject Query Performance Aggregated • AVG, Occurrences and Total execution time
  • 29. 29 Worst ApplicationModule activations & passivations overview • Troubleshoot ApplicationModule Pooling problems • Set the most optimal ApplicationModule Pooling parameter settings
  • 30. 30 Worst ApplicationModule activations & passivations overview (2)
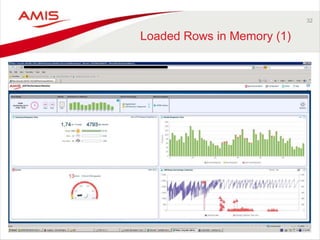
  • 32. 32 Loaded Rows in Memory (1)
  • 33. 33 ADF BC Memory Analyzer (2) – Example: in this production ADF app, for a single ViewObject instance, more than 900.000 rows were loaded in the ADF app (Blue) !
  • 34. – In this production ADF app, for a single ViewObject instance, more than 900.000 rows were loaded in the ADF app (!) – Loading 900.000 rows takes more than 10 minutes 34 Loaded Rows in Memory (3)- ADF CallStack
  • 36. 36 ADF Performance Monitor Warnings and Detailed Help • Fetching thousands of rows from database • Slow passivation and activation of transient attributes • Redundant ViewObject query executions • Inefficient ViewObject fetchsize • Inefficient PageDef iterator rangesize • Slow executions of – ViewObject queries – EntityObject DML operations, database locks – ApplicationModule activations / passivations / transactions – PageDefinition operations / ApplicationModule custom methods – PageDefinition iterators – Webservices – Java methods • More
  • 37. 37 The tool can be dynamically turned on and off (at runtime) at all times • The ADF Performance Monitor can be dynamically turned on and off (at runtime) at all times in the Enterprise Manager • When the monitor is turned off there is no performance overhead because the metrics classes are not active
  • 38. 38 Use in JDeveloper during development
  • 39. 39 Configuration • All configuration steps are well documented in the installation guide – An ADF library needs to be added to your ADF application – A very small amount of code needs to be added to instrument the ADF application. – The metrics classes make use of extension points in the ADF framework in order to measure the time every action/step takes in a http request. • Implementation takes less than 1 day, usually no more than a few hours
  • 40. 40 Overhead • Load tests show that the overhead is less than 3 to 4 percent. • This overhead is caused by the very detailed collection of performance metrics. • The metrics collection can be dynamically turned on and off (at runtime) at all times. • When the monitor is turned off there is no performance overhead because the metrics classes are not active.
  • 41. 41 Support • Standard Oracle stack – ADF Business Components – ADF Model – ADF Controller – ADF Faces • JPA/EJB – EclipseLink/TopLink • POJO JavaBean DataControl • JAX-WS Webservices • It is possible to instrument (calls to) custom Java methods and 3rd party libraries • Application servers: – WebLogic – Glassfish – Tomcat
  • 42. 42 End-users will be more happy
  • 43. 43 Henri Peters - Project Manager Dutch Ministry of Justice “For us it is of great value that we can continuously identify the weakest link, even if there is no actual performance problem (yet)." “We can even drill down to the level of an individual user. Sometimes we go so far that we proactively approach end-users: before they complain we already have contacted them.” * More quotes of ADF experts and managers at: http://tinyurl.com/nxgkgr6 or http://www.amis.nl/ADFperformancemonitor
  • 44. 44 Videos available http://tinyurl.com/npu732q or http://www.amis.nl/ADFperformancemonitor • Overview ADF Performance Monitor (13 min) • Customer case Dutch Ministry of Justice (4 min)
  • 45. 45 Whitepaper Whitepaper has detailed information about the architecture and implementation http://tinyurl.com/qgfh22u or http://www.amis.nl/ADFperformancemonitor Content: Executive overview Introduction Oracle ADF applications and performance ADF Performance Monitor overview Use in JDeveloper Use in test and production environment Dashboard reporting application Summary and details HTTP response times ADF framework call stack Warnings and suggested solutions Worst performing executions in ADF BC and model layer Error stacktraces JVM performance Product architecture Configuration Turn on/off at all times Prerequisites Monitored Events

Editor's Notes

  • #2: Objectives: -be able to instrument ADF to track performance -use performance tracking data to improve performance
  • #3: Applications often contain frustrating blind spots and mysterious, recurring problems that are often difficult to identify, diagnose, and fix. With business-critical applications, it’s very important to have a simple and fast way to monitor, diagnose, and resolve application problems before they affect revenue.
  • #10: Troubleshoot problems of specific end-user
  • #11: Troubleshoot problems of specific end-user
  • #14: Several overview graphs are added to the main dashboard. At the day overview, it shows for each hour of the day (right bottom) the layer where the time is spent. It shows the time spent in the database, webservice, application server, and network/browser load time: At the top right graph (hourly overview of day performance) we can see a lot of red in the bars. Specifically from 11:00 to 12:00 – apparantly there were many very slow requests. In the graph at the right bottom we can now explain what happened; there were network problems. After talking to the infrastructure department – this was indeed the case. They were very busy with maintanance and were not aware (!) that end-users were suffering from there work.
  • #16: In the top graph we see all individual http requests in managed server regi_adf_server1. Again, the stacked bars show the time spent in database, webservice, application server, and network/browser load time (purple). We can see that many end-users have to wait ± 5 seconds – on pure network time (!). Note that The JVM is not the problem and is working fine (bottom graph). The next day the network problem was resolved. We can see this in the following hour overview graph were there is much less purple colour (right bottom):
  • #18: The next day the network problem was resolved. We can see this in the following hour overview graph were there is much less purple colour (right bottom):
  • #19: 24/7 Overview The dashboard (Figure 3) gives a 24/7 overview of the performance of the application in a selected time range. It opens with a 24 hours overview for the current date. It shows real-time critical information about the ADF application's performance (are response times within or outside SLA boundaries? What is the error rate? What is the health of the JVM? Is immediate action required?).
  • #30: In the ADF BC overview (filtered on ApplicationModule pooling) the ApplicationModule pooling performance can be analyzed. This overview gives more insight in the effect of these parameter settings (how often passivations and activations happen, how long their AVG and total execution time is). On each ApplicationModule activation/passivation can be drilled down, to see the ADF request call stacks. Dev and QA teams can research and experiment with these parameter settings on test environments during load tests and evaluate the performance results in the monitor. They can determine the most optimal ApplicationModule pooling parameter settings for their situation. Operation teams can monitor the ApplicationModule pooling behavior in production.
  • #31: The performance impact of frequent invoked activations and passivations can be much higher than those that occur only a few times but are very slow on average. It is important to know which activations/passivations have the biggest impact on the resources of your ADF application. In this overview the x-as shows the AVG execution time (seconds) and the y-as shows the occurrences. The size of the bubble is total time (AVG execution time * occurrences).
  • #32: We can see that PjtShowPaga001AM.passivateState, PjtShowPaga001AM.activateState and Pagd001AM.passivateState are executed very frequently. If we don’t want this behavior, we can adjust the pooling parameter settings.