SlideShare a Scribd company logo
2
Most read
3
Most read
8
Most read
Advanced Debugging with gdbDavid KhosidSept 21, 2009david.kh@gmail.com
AgendaTechniques for debugging big, modern software:STL containers and algorithms, Boost Ex: how to see containersSignalsMulti-threaded (ex.: how to follow a thread?)Repetitive tasks on the almost unchanging code baseRemote debuggingExamples2
GDB was first written by Richard Stallman in 1986 as part of his GNU systemRichard Stallman, “Debugging with gdb”www.gnu.org/software/gdb/documentationHelp: 	$gdb –h 		(gdb) h 		(gdb) aproposCommand names may be truncated if the abbreviation is unambiguous. TAB completion. Command Cheat Sheetwww.yolinux.com/TUTORIALS/GDB-Commands.htmlLast GDB version is 6.8, new 7.0 soon: 2009-09-233Sources of information
Item #1: C++ and STL - ContainersHow to see container’s content?Commands file, ex. .gdbinithttp://www.yolinux.com/TUTORIALS/src/dbinit_stl_views-1.03.txtLimitations: a littlelibstdc++ compiled in debug modeLimitations: - different product , not for QA, not for client, not in performance tuning stage- performance 4
Item #1: C++ and STL - ContainersHow to see container’s content?Auxiliary functionstypedef map<string, float> MapStringFloat;void mapPrint(const MapStringFloat& m){       for(MapStringFloat::const_iterator pos = m.begin(); pos != m.end(); ++pos){                     cout << pos->first << " : " << pos->second << "\n"; }Limitations: - you can’t do that without a process to debug (investigating core files)- optimization of unused functions. Solution: ‘volatile’Pretty-printing of STL containers in future versions of GDB5
Item #2: Extending GDB – User-defined commands(gdb) show user commandnameExample: (gdb)define adder	print $arg0 + $arg1 + $arg2 end(gdb) adder 1 2 3 6
Item #3: Automating repetitive tasks What GDB Does During Startup1. Executes all commands from system init file 2. Executes all the commands from ~/.gdbinit3. Process command line options and operands 4. Executes all the commands from ./.gdbinit5. reads command files specified by the `-x' option 6. …7
Automating tasks - history, recordingcontinueWhat GDB Does During Startup… 6. Reads the command history recorded in the history file. (gdb) set history filename fname(gdb) set history save on/off(gdb) show history(gdb) show commands8
Item #4: Signals‘i handle’ or ‘i signals’Print a table of all the signals and how gdb has been told to handle each one.handle signal [keywords...]keywords: nostop|stop,  print|noprint and pass|nopassEx: handle SIG35 nostop print pass 	handle SIG36 stop (implies the ‘print’ as well)	handle SIG37 nostop print nopass	handle SIG38 nostopnoprintnopass9
Item #5: Multi-threadsUse case: debugging specific thread, while controlling behavior of others.facilities for debugging multi-thread programs:• automatic notification of new threads• ‘thread threadno’, to switch among threads• ‘info threads’, to inquire about existing threads• thread-specific breakpoints• set mode for locking scheduler during execution 	(gdb) set scheduler-locking step/on/offothers: Interrupted System CallsExample:(gdb) i threads(gbd) b foo.cpp:13 thread 28 if x > lim10
Item #5: Remote debuggingUse case: - GDB runs on one machine (host) and the program  being debugged (exe.verXYZ.stripped ) runs on another (target). - GDB communicates via Serial or TCP/IP.- Host and target: exactly match between the executables and libraries, with one exception: stripped on the target.- Complication: compiling on one machine (CC view), keeping code in different place (ex. /your/path/verXYZ)Solution: - Connect gdb to source in the given place:(gdb) set substitute-path /usr/src /mnt/cross (gdb) dir /your/path/verXYZ11
Remote debugging - exampleUsing gdbserver through TCP connection: remote (10.10.0.225)>  gdbserver :9999 program_strippedor remote> ./gdbserver :9999 –attach <pid>host> gdb programhost>(gdb) handle SIGTRAP nostopnoprint pass			 to avoid pausing when launching the threadshost> (gdb) target remote 10.10.0.225:9999TARGET (Android Dev phone)	 HOST (Fedora Linux)12
Item #6: Back to the past Convenience variables are used to store values that you may want to refer later. Any string preceded by $ is regarded as a convenience variable.Ex.:set $table = *table_ptr	(gdb) show convCheckpoint - a snapshot of a program’s state(gdb) checkpoint(gdb) i checkpoint(gdb) restartcheckpoint-idValue history- values printed by the print command.13
Small Items: #7, #8 #7. 	How to see macros?	$ g++ -gdwarf-2 -g3 a.cpp -o prog#8. 	64 bit .vs. 32bit -m32 flagOn 64-bit machine, install another 32-bit version of GDB	$ ls -l `which gdb32`	/usr/bin/gdb32 ->  ‘/your/install/path’14
Lightweight how-to'sHow to remove a symbol table from a file?A: 	stripHow to supply arguments to your program in GDB?A1: With --args option 	#sudo gdb -silent --args /bin/ping google.comA2: As arguments to run: (gdb) runarg1 arg2run without arguments uses the same arguments used by the previous run. A3: With set args  command: 		(gdb) set args arg1 arg2(gdb) show args set args without arguments – removes all arguments. How to know where you are (file, next execution line)?A:  	(gdb) f15
Lightweight how-to's - continueHow to find out the crash file executable? A1: #file core.1234A2: #gdb core.1234A3: use /proc/sys/kernel/core_pattern#echo "core_%e.%p" > /proc/sys/kernel/core_pattern 	if the program foo dumps its core, 	the core_foo.1234 will be created.How to find out why your program stopped?A: (gdb) iprogWhich command(s) can be used to exit from loops?A:(gdb)until lineNo‘print’, ‘info’, ‘show’- what is a difference?‘print’ – print value of expression‘info’ – showing things about the program being debugged‘show’ – showing things about the debugger16

More Related Content

What's hot (20)

PDF
Vim Rocks!
Kent Chen
 
PDF
New Ways to Find Latency in Linux Using Tracing
ScyllaDB
 
PDF
GNU Compiler Collection - August 2005
Saleem Ansari
 
PDF
Qemu device prototyping
Yan Vugenfirer
 
PDF
Uboot startup sequence
Houcheng Lin
 
ODP
Q4.11: Porting Android to new Platforms
Linaro
 
PPT
Basic 50 linus command
MAGNA COLLEGE OF ENGINEERING
 
PDF
Spectre/Meltdownとその派生
MITSUNARI Shigeo
 
PDF
Embedded Android : System Development - Part IV (Android System Services)
Emertxe Information Technologies Pvt Ltd
 
PDF
qemu + gdb: The efficient way to understand/debug Linux kernel code/data stru...
Adrian Huang
 
PDF
Embedded Android : System Development - Part I
Emertxe Information Technologies Pvt Ltd
 
PDF
Launch the First Process in Linux System
Jian-Hong Pan
 
PDF
Linux Kernel Overview
Anil Kumar Pugalia
 
PDF
Scheduling in Android
Opersys inc.
 
PDF
Vmlinux: anatomy of bzimage and how x86 64 processor is booted
Adrian Huang
 
PDF
semaphore & mutex.pdf
Adrian Huang
 
PPT
Linux kernel memory allocators
Hao-Ran Liu
 
ODP
Linux commands
Balakumaran Arunachalam
 
PPT
Linux Kernel Image
艾鍗科技
 
PPTX
U-Boot presentation 2013
Wave Digitech
 
Vim Rocks!
Kent Chen
 
New Ways to Find Latency in Linux Using Tracing
ScyllaDB
 
GNU Compiler Collection - August 2005
Saleem Ansari
 
Qemu device prototyping
Yan Vugenfirer
 
Uboot startup sequence
Houcheng Lin
 
Q4.11: Porting Android to new Platforms
Linaro
 
Basic 50 linus command
MAGNA COLLEGE OF ENGINEERING
 
Spectre/Meltdownとその派生
MITSUNARI Shigeo
 
Embedded Android : System Development - Part IV (Android System Services)
Emertxe Information Technologies Pvt Ltd
 
qemu + gdb: The efficient way to understand/debug Linux kernel code/data stru...
Adrian Huang
 
Embedded Android : System Development - Part I
Emertxe Information Technologies Pvt Ltd
 
Launch the First Process in Linux System
Jian-Hong Pan
 
Linux Kernel Overview
Anil Kumar Pugalia
 
Scheduling in Android
Opersys inc.
 
Vmlinux: anatomy of bzimage and how x86 64 processor is booted
Adrian Huang
 
semaphore & mutex.pdf
Adrian Huang
 
Linux kernel memory allocators
Hao-Ran Liu
 
Linux commands
Balakumaran Arunachalam
 
Linux Kernel Image
艾鍗科技
 
U-Boot presentation 2013
Wave Digitech
 

Viewers also liked (20)

PDF
GDB Rocks!
Kent Chen
 
PDF
Crash Dump Analysis 101
John Howard
 
PDF
Gdb remote debugger
shanghai jiaotong university
 
PDF
From printk to QEMU: Xen/Linux Kernel debugging
The Linux Foundation
 
PPT
Introduction to gdb
Owen Hsu
 
PDF
Advanced Tracing features using GDB and LTTng
marckhouzam
 
PDF
Debugger Principle Overview & GDB Tricks
dutor
 
PDF
Aag c45 697761
HP IN Rajesh Goel
 
PDF
Reverse, Multi-Process and Non-Stop Debugging come to the CDT
marckhouzam
 
PPT
Real time debugging: using non-intrusive tracepoints to debug live systems
marckhouzam
 
PDF
Working Remotely (via SSH) Rocks!
Kent Chen
 
PDF
LAS16-403: GDB Linux Kernel Awareness
Linaro
 
PPTX
Linux booting process!!
sourav verma
 
PPTX
Linux booting Process
Gaurav Sharma
 
PDF
DPDK Summit - 08 Sept 2014 - Futurewei - Jun Xu - Revisit the IP Stack in Lin...
Jim St. Leger
 
PPT
Linux installation and booting process
Siddharth Jain
 
PDF
kubernetes, pourquoi et comment
Jean-Baptiste Claramonte
 
PDF
Simple Belief - Mosky @ TEDxNTUST 2015
Mosky Liu
 
PDF
introduction to linux kernel tcp/ip ptocotol stack
monad bobo
 
GDB Rocks!
Kent Chen
 
Crash Dump Analysis 101
John Howard
 
Gdb remote debugger
shanghai jiaotong university
 
From printk to QEMU: Xen/Linux Kernel debugging
The Linux Foundation
 
Introduction to gdb
Owen Hsu
 
Advanced Tracing features using GDB and LTTng
marckhouzam
 
Debugger Principle Overview & GDB Tricks
dutor
 
Aag c45 697761
HP IN Rajesh Goel
 
Reverse, Multi-Process and Non-Stop Debugging come to the CDT
marckhouzam
 
Real time debugging: using non-intrusive tracepoints to debug live systems
marckhouzam
 
Working Remotely (via SSH) Rocks!
Kent Chen
 
LAS16-403: GDB Linux Kernel Awareness
Linaro
 
Linux booting process!!
sourav verma
 
Linux booting Process
Gaurav Sharma
 
DPDK Summit - 08 Sept 2014 - Futurewei - Jun Xu - Revisit the IP Stack in Lin...
Jim St. Leger
 
Linux installation and booting process
Siddharth Jain
 
kubernetes, pourquoi et comment
Jean-Baptiste Claramonte
 
Simple Belief - Mosky @ TEDxNTUST 2015
Mosky Liu
 
introduction to linux kernel tcp/ip ptocotol stack
monad bobo
 
Ad

Similar to Advanced Debugging with GDB (20)

PDF
Debugging embedded devices using GDB
Chris Simmonds
 
PPTX
Gnu debugger
Gizem Çetin
 
PPTX
GNU Debugger
Gizem Çetin
 
PDF
Gdb tutorial-handout
Suraj Kumar
 
PDF
gdb-tutorial.pdf
ligi14
 
PPTX
Debuging like a pro
Vicente Bolea
 
PDF
Usage of GDB
Jongseok Choi
 
PPTX
Debugging Modern C++ Application with Gdb
SenthilKumar Selvaraj
 
PPTX
Debug generic process
Vipin Varghese
 
PPT
Gccgdb
selva raj
 
PPTX
Reversing with gdb
Mihir Shah
 
PDF
lab1-ppt.pdf
AbdelrahmanElewah1
 
PPTX
Wavedigitech gdb
Wave Digitech
 
PPTX
Rasperry pi Part 8
Techvilla
 
PPTX
GDB: A Lot More Than You Knew
Undo
 
PDF
BKK16-304 The State of GDB on AArch64
Linaro
 
PDF
Android Platform Debugging and Development
Opersys inc.
 
PDF
Android Platform Debugging and Development
Karim Yaghmour
 
PDF
Uwaga na buga! GDB w służbie programisty. Barcamp Semihalf S09:E01
Semihalf
 
Debugging embedded devices using GDB
Chris Simmonds
 
Gnu debugger
Gizem Çetin
 
GNU Debugger
Gizem Çetin
 
Gdb tutorial-handout
Suraj Kumar
 
gdb-tutorial.pdf
ligi14
 
Debuging like a pro
Vicente Bolea
 
Usage of GDB
Jongseok Choi
 
Debugging Modern C++ Application with Gdb
SenthilKumar Selvaraj
 
Debug generic process
Vipin Varghese
 
Gccgdb
selva raj
 
Reversing with gdb
Mihir Shah
 
lab1-ppt.pdf
AbdelrahmanElewah1
 
Wavedigitech gdb
Wave Digitech
 
Rasperry pi Part 8
Techvilla
 
GDB: A Lot More Than You Knew
Undo
 
BKK16-304 The State of GDB on AArch64
Linaro
 
Android Platform Debugging and Development
Opersys inc.
 
Android Platform Debugging and Development
Karim Yaghmour
 
Uwaga na buga! GDB w służbie programisty. Barcamp Semihalf S09:E01
Semihalf
 
Ad

Recently uploaded (20)

PDF
Dev Dives: Accelerating agentic automation with Autopilot for Everyone
UiPathCommunity
 
PDF
Enhancing Environmental Monitoring with Real-Time Data Integration: Leveragin...
Safe Software
 
PDF
Plugging AI into everything: Model Context Protocol Simplified.pdf
Abati Adewale
 
PDF
Why aren't you using FME Flow's CPU Time?
Safe Software
 
PDF
Bridging CAD, IBM TRIRIGA & GIS with FME: The Portland Public Schools Case
Safe Software
 
PPTX
Reimaginando la Ciberdefensa: De Copilots a Redes de Agentes
Cristian Garcia G.
 
PPTX
Practical Applications of AI in Local Government
OnBoard
 
PDF
ArcGIS Utility Network Migration - The Hunter Water Story
Safe Software
 
PDF
The Future of Product Management in AI ERA.pdf
Alyona Owens
 
PDF
Pipeline Industry IoT - Real Time Data Monitoring
Safe Software
 
PDF
Java 25 and Beyond - A Roadmap of Innovations
Ana-Maria Mihalceanu
 
PDF
Simplify Your FME Flow Setup: Fault-Tolerant Deployment Made Easy with Packer...
Safe Software
 
PPTX
2025 HackRedCon Cyber Career Paths.pptx Scott Stanton
Scott Stanton
 
PDF
5 Things to Consider When Deploying AI in Your Enterprise
Safe Software
 
PDF
Redefining Work in the Age of AI - What to expect? How to prepare? Why it mat...
Malinda Kapuruge
 
PDF
Automating the Geo-Referencing of Historic Aerial Photography in Flanders
Safe Software
 
PPTX
The birth and death of Stars - earth and life science
rizellemarieastrolo
 
DOCX
Daily Lesson Log MATATAG ICT TEchnology 8
LOIDAALMAZAN3
 
PDF
Hyderabad MuleSoft In-Person Meetup (June 21, 2025) Slides
Ravi Tamada
 
PPTX
Smart Factory Monitoring IIoT in Machine and Production Operations.pptx
Rejig Digital
 
Dev Dives: Accelerating agentic automation with Autopilot for Everyone
UiPathCommunity
 
Enhancing Environmental Monitoring with Real-Time Data Integration: Leveragin...
Safe Software
 
Plugging AI into everything: Model Context Protocol Simplified.pdf
Abati Adewale
 
Why aren't you using FME Flow's CPU Time?
Safe Software
 
Bridging CAD, IBM TRIRIGA & GIS with FME: The Portland Public Schools Case
Safe Software
 
Reimaginando la Ciberdefensa: De Copilots a Redes de Agentes
Cristian Garcia G.
 
Practical Applications of AI in Local Government
OnBoard
 
ArcGIS Utility Network Migration - The Hunter Water Story
Safe Software
 
The Future of Product Management in AI ERA.pdf
Alyona Owens
 
Pipeline Industry IoT - Real Time Data Monitoring
Safe Software
 
Java 25 and Beyond - A Roadmap of Innovations
Ana-Maria Mihalceanu
 
Simplify Your FME Flow Setup: Fault-Tolerant Deployment Made Easy with Packer...
Safe Software
 
2025 HackRedCon Cyber Career Paths.pptx Scott Stanton
Scott Stanton
 
5 Things to Consider When Deploying AI in Your Enterprise
Safe Software
 
Redefining Work in the Age of AI - What to expect? How to prepare? Why it mat...
Malinda Kapuruge
 
Automating the Geo-Referencing of Historic Aerial Photography in Flanders
Safe Software
 
The birth and death of Stars - earth and life science
rizellemarieastrolo
 
Daily Lesson Log MATATAG ICT TEchnology 8
LOIDAALMAZAN3
 
Hyderabad MuleSoft In-Person Meetup (June 21, 2025) Slides
Ravi Tamada
 
Smart Factory Monitoring IIoT in Machine and Production Operations.pptx
Rejig Digital
 

Advanced Debugging with GDB

  • 2. AgendaTechniques for debugging big, modern software:STL containers and algorithms, Boost Ex: how to see containersSignalsMulti-threaded (ex.: how to follow a thread?)Repetitive tasks on the almost unchanging code baseRemote debuggingExamples2
  • 3. GDB was first written by Richard Stallman in 1986 as part of his GNU systemRichard Stallman, “Debugging with gdb”www.gnu.org/software/gdb/documentationHelp: $gdb –h (gdb) h (gdb) aproposCommand names may be truncated if the abbreviation is unambiguous. TAB completion. Command Cheat Sheetwww.yolinux.com/TUTORIALS/GDB-Commands.htmlLast GDB version is 6.8, new 7.0 soon: 2009-09-233Sources of information
  • 4. Item #1: C++ and STL - ContainersHow to see container’s content?Commands file, ex. .gdbinithttp://www.yolinux.com/TUTORIALS/src/dbinit_stl_views-1.03.txtLimitations: a littlelibstdc++ compiled in debug modeLimitations: - different product , not for QA, not for client, not in performance tuning stage- performance 4
  • 5. Item #1: C++ and STL - ContainersHow to see container’s content?Auxiliary functionstypedef map<string, float> MapStringFloat;void mapPrint(const MapStringFloat& m){ for(MapStringFloat::const_iterator pos = m.begin(); pos != m.end(); ++pos){ cout << pos->first << " : " << pos->second << "\n"; }Limitations: - you can’t do that without a process to debug (investigating core files)- optimization of unused functions. Solution: ‘volatile’Pretty-printing of STL containers in future versions of GDB5
  • 6. Item #2: Extending GDB – User-defined commands(gdb) show user commandnameExample: (gdb)define adder print $arg0 + $arg1 + $arg2 end(gdb) adder 1 2 3 6
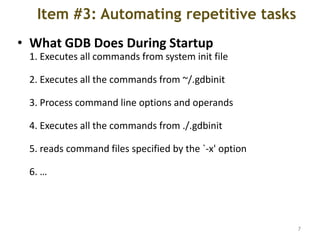
  • 7. Item #3: Automating repetitive tasks What GDB Does During Startup1. Executes all commands from system init file 2. Executes all the commands from ~/.gdbinit3. Process command line options and operands 4. Executes all the commands from ./.gdbinit5. reads command files specified by the `-x' option 6. …7
  • 8. Automating tasks - history, recordingcontinueWhat GDB Does During Startup… 6. Reads the command history recorded in the history file. (gdb) set history filename fname(gdb) set history save on/off(gdb) show history(gdb) show commands8
  • 9. Item #4: Signals‘i handle’ or ‘i signals’Print a table of all the signals and how gdb has been told to handle each one.handle signal [keywords...]keywords: nostop|stop, print|noprint and pass|nopassEx: handle SIG35 nostop print pass handle SIG36 stop (implies the ‘print’ as well) handle SIG37 nostop print nopass handle SIG38 nostopnoprintnopass9
  • 10. Item #5: Multi-threadsUse case: debugging specific thread, while controlling behavior of others.facilities for debugging multi-thread programs:• automatic notification of new threads• ‘thread threadno’, to switch among threads• ‘info threads’, to inquire about existing threads• thread-specific breakpoints• set mode for locking scheduler during execution (gdb) set scheduler-locking step/on/offothers: Interrupted System CallsExample:(gdb) i threads(gbd) b foo.cpp:13 thread 28 if x > lim10
  • 11. Item #5: Remote debuggingUse case: - GDB runs on one machine (host) and the program being debugged (exe.verXYZ.stripped ) runs on another (target). - GDB communicates via Serial or TCP/IP.- Host and target: exactly match between the executables and libraries, with one exception: stripped on the target.- Complication: compiling on one machine (CC view), keeping code in different place (ex. /your/path/verXYZ)Solution: - Connect gdb to source in the given place:(gdb) set substitute-path /usr/src /mnt/cross (gdb) dir /your/path/verXYZ11
  • 12. Remote debugging - exampleUsing gdbserver through TCP connection: remote (10.10.0.225)> gdbserver :9999 program_strippedor remote> ./gdbserver :9999 –attach <pid>host> gdb programhost>(gdb) handle SIGTRAP nostopnoprint pass to avoid pausing when launching the threadshost> (gdb) target remote 10.10.0.225:9999TARGET (Android Dev phone) HOST (Fedora Linux)12
  • 13. Item #6: Back to the past Convenience variables are used to store values that you may want to refer later. Any string preceded by $ is regarded as a convenience variable.Ex.:set $table = *table_ptr (gdb) show convCheckpoint - a snapshot of a program’s state(gdb) checkpoint(gdb) i checkpoint(gdb) restartcheckpoint-idValue history- values printed by the print command.13
  • 14. Small Items: #7, #8 #7. How to see macros? $ g++ -gdwarf-2 -g3 a.cpp -o prog#8. 64 bit .vs. 32bit -m32 flagOn 64-bit machine, install another 32-bit version of GDB $ ls -l `which gdb32` /usr/bin/gdb32 -> ‘/your/install/path’14
  • 15. Lightweight how-to'sHow to remove a symbol table from a file?A: stripHow to supply arguments to your program in GDB?A1: With --args option #sudo gdb -silent --args /bin/ping google.comA2: As arguments to run: (gdb) runarg1 arg2run without arguments uses the same arguments used by the previous run. A3: With set args command: (gdb) set args arg1 arg2(gdb) show args set args without arguments – removes all arguments. How to know where you are (file, next execution line)?A: (gdb) f15
  • 16. Lightweight how-to's - continueHow to find out the crash file executable? A1: #file core.1234A2: #gdb core.1234A3: use /proc/sys/kernel/core_pattern#echo "core_%e.%p" > /proc/sys/kernel/core_pattern if the program foo dumps its core, the core_foo.1234 will be created.How to find out why your program stopped?A: (gdb) iprogWhich command(s) can be used to exit from loops?A:(gdb)until lineNo‘print’, ‘info’, ‘show’- what is a difference?‘print’ – print value of expression‘info’ – showing things about the program being debugged‘show’ – showing things about the debugger16
  • 17. Problem Determination Tools for Linux-Wall Code reviewProgram’s traces, syslog, profilersStatic Source Code Analysis:scan.coverity.com – free for FOSSFlexelintDynamic analysis: Valgrind, strace, /proc filesystem, lsof, ldd, nm, objdump, wireshark17
  • 18. SummaryStart from thinking of Use Case, then look in the manual, use ‘apropos’ and ‘help’Productivity:Stepping through a program is less productive than thinking harder and adding output statements and self-checking code at critical places.When to use GDB? - core file, - when a problem can be reproduced, repeating errors - self-educatingWhen not?Other tools, tracesQuestions?18