SlideShare a Scribd company logo
SQL Bits - the great data heist
Manchester 2019
An R primer for SQL folks
Thomas Hütter
Thomas Hütter, Diplom-Betriebswirt
• Application developer, consultant, accidental DBA, author
• Worked at consultancies, ISVs, end user companies
• Speaker at SQL events around Europe
• SQL Server > 6.5, Dynamics Nav > 3.01, R > 3.1.2
@DerFredo https://twitter.com/DerFredo
de.linkedin.com/in/derfredo
www.xing.com/profile/Thomas_Huetter
An R primer for SQL folks
Agenda
• History: what is R, how did R come to be, 

what does the R ecosystem look like today
• Introduction: R IDE, RStudio, basic data types / objects,

packages, in-/output, data analysis, visualization
• Business case demo:
• Extracting ‘sales’ data from a Nav DB on SQL Server
• Basic analysis and visualization
• Advanced visualization using the Shiny framework
• Example: data science going wrong, round-up, resources
• This is an introductory walk-through, no deep dive - 

so no fancy predictions, regression, big data science :-(
History: R - then and now
• Programming language for statistical computing, analysis and visualization,

widely used by statisticians, data miners, analysts, data scientists
• Created by Ross Ihaka and Robert Gentleman, Uni Auckland, in 1993 

as an open source implementation of the (1970s) S language
• GNU project, maintained by the R Foundation for Statistical Computing,
compiled builds for Mac OS, Linux, Windows, supported by R Consortium
• Extensible through user-created packages, > 13700 available on CRAN
• Commercial support, e.g. since 2007 by Revolution Analytics, 

acquired by Microsoft in 2015, now provide Microsoft R Open, R Server
• IDEs: R.App, RStudio, R Tools for Visual Studio (deprecated from VS 2019)
• Support for R now in SQL Server, Power BI, Azure ML, Data science VM
Introduction: data objects
• Data types
- numeric, integer, complex
- character
- logical
- factor
- Posix types for date/time

- NA = Not available
• Data structures
- vector: 1 dim, 1 data type
- matrix: 2 dim rect, 1 data type
- list: collection of other objects
- table: > 2 dimensions
- data frame

2 dim rect, cols = vectors

DemoBasics1
Introduction: packages
•Extensions to the R base system, containing code, data, documentation.

Key factor to the success of R; flexible, user contributable. -> CRAN
•installed.packages() lists all installed packages incl. versions,
dependencies, license and other info
•search() lists currently attached packages
•install.packages() downloads and installs packages
•library() loads/attaches packages, also require()
•Hadley Wickham, chief scientist at RStudio, professor of statistics

„Tidyverse“: dplyr, tidyr, lubridate, readr, httr, ggplot2 

+ many more: hadley.nz
DemoBasics2
Introduction: basic data in-/output
• Generic functions read.table and write.table
- read.csv / read.csv2 comma/semicolon delimited
- read.delim / read.delim2 Tab delimited, decimal point/comma
- read.fwf fixed width format
• Some additional I/O packages
- reader functions flexibly load multiple formats fast
- foreign reads data from Minitab, S, SAS, SPSS, Stata, dBase…
- DBI/ODBC database access via ODBC
- xlsx and readxl read and write Excel 97/XP/200X files
- XML reads XML and tables from http web sites
Introduction: basic data analysis + visualization
• Analyzing (numeric) data:

str() structure = data types and ranges

summary() Min, max, mean, median, quartiles;

for factors: count of levels

head()/tail() shows top/bottom n rows (default = 6)
• Distribution of values:

hist() shows frequency distribution, 

boxplot() for min, max, quartiles, outliers,
mosaicplot() contingency mosaic
DemoBasics3
Continued… data analysis + visualization
• Libraries: tidy for data tidying/reshaping, ggplot2 implements 

grammar of graphics, raster for geo data
• apply() family of functions applies functions to the margins of 

an array or a matrix
• gather()/spread() convert between wide/long format
• ggplot() very powerful plot function, plots point, line or bar 

geometrics etc with versatile parameters
DemoBasics4
Business case demo
• We are the distributor for all German petrol stations,

with two subsidiaries: NorthTank and SouthFuel
• Business calls „We need some analysis of our 2015 Diesel sales“, 

preferably some visualizations, and „maybe something is wrong…“
• Of interest: distribution by post code zones
• Source: Dynamics Nav ERP database, on the customer card (table
„Customer“) there’s a field called „Sales (LCY)“ (= Local currency)
• Publicly available shape- and data files for post code zones


Extracting data & first analysis
• Using ODBC and the DBI package

(also available: JDBC, RODBC and others)
• dbConnect() to establish a connection, 

then dbGetQuery() to query the database
• Calculate aggregates (sums) using ddply()
• Bar plot: ggplot() + geom_bar()
• Line diagram: ggplot() + geom_line()
Analysis & visualization
• Calculate intervals for sales sums: cut()
• libraries raster, rgeos for visualizing geospatial data
• shapefiles: open vector data format for GIS software,
describes points, lines or polygons in these files:

.shp shapes, .shx shape index, .dbf attributes, .prj projection
• merge shape and sales data: merge()
• plot maps, colouring post code zones according to sales
DemoTankData
Use of Shiny framework
• Framework for interactive web applications in R

apps consist of server.R and ui.R or just app.R
• ui defines screen appearance & controls
• server handles any data processing, plotting etc.
• apps can be run in web browser

DemoShiny/app
Example: data science going wrong?
• Anscombe’s quartet:
• 4 data sets, each with 11 completely different x-y pairs
• yet nearly identical statistical properties
- Mean of x = 9
- Mean of y = 7.5
- Correlation between x and y = 0.816
- Linear regression y = 3 + 0.5 x
Anscombe
Round-up / conclusions
• With R, a lot is possible in terms of analysis and visualization
• There’s probably always a package for that

But please:
• Know your data
• Look at your data
▪ Think - does it make sense?
• Consider the influence of outliers
• Don’t blindly rely on R ‘doing the trick’
Resources online
• https://en.wikipedia.org/wiki/R_(programming_language)
• https://www.r-project.org/ -> Mirrors of CRAN = Comprehensive R Archive Network
• https://www.r-consortium.org/
• http://www.r-bloggers.com/
• www.kdnuggets.com
• www.rseek.org Pimped Google search for R-related subjects

• Twitter hashtag #rstats
• LinkedIn groups R Developers und Users Group, R Programming, The R Project for…

• www.swirlstats.com „Learn R, in R“
• www.coursera.org Data Science specialization (10 courses) MOOC
• www.edx.org
Resources offline
• Beginning R, The statistical programming language

Dr. Mark Gardener, Wrox/Wiley, ISBN 978-1118164303
• R Cookbook, Paul Teetor, O’Reilly, ISBN 978-0596809157
• R Graphics Cookbook, Winston Chang, O’Reilly, 

ISBN 978-1449316952
• R in a Nutshell, Joseph Adler, O’Reilly, ISBN 978-1449312084
• Practical Data Science with R, Nina Zumel + John Mount,

Manning publications, ISBN 978-1617291562
Credits
• Titanic data set: www.kaggle.com/c/titanic/data
• SQL Database structure:

mbs.microsoft.com Dynamics Nav 2016 demo database
• Customer and „sales“ data: www.tankerkoenig.de (license CC BY 4.0)
• Shape files:

- www.suche-postleitzahl.org (Open database license, 

© OpenStreetMap contributors)

- Bundesamt für Kartographie und Geodäsie, Frankfurt am Main, 2011
• Some icons made by:

http://www.flaticon.com/authors/hanan (license CC BY 3.0)
• Anscombe’s quartet: Francis J. Anscombe 1973
An R primer for SQL folks
Time for some Q & A:
That is: questions that might be of common interest,

and their answers might fit into the remaining time
For slides and scripts: follow link on final slide

or check the SQLBits homepage ;-)
An R primer for SQL folks
Thank you for your interest & keep in touch:

@DerFredo https://twitter.com/DerFredo
de.linkedin.com/in/derfredo
www.xing.com/profile/Thomas_Huetter
Slides and scripts to this presentation will be at

https://github.com/SQLThomas/Conferences/tree/master/Bits2019
Ad

More Related Content

What's hot (20)

Open statistics Belgium
Open statistics BelgiumOpen statistics Belgium
Open statistics Belgium
Open Knowledge Belgium
 
Introduction to R for data science
Introduction to R for data scienceIntroduction to R for data science
Introduction to R for data science
Long Nguyen
 
Ch1
Ch1Ch1
Ch1
Chhom Karath
 
Apache Spark — Fundamentals and MLlib
Apache Spark — Fundamentals and MLlibApache Spark — Fundamentals and MLlib
Apache Spark — Fundamentals and MLlib
Jens Fisseler, Dr.
 
R program
R programR program
R program
genegeek
 
1.3 introduction to R language, importing dataset in r, data exploration in r
1.3 introduction to R language, importing dataset in r, data exploration in r1.3 introduction to R language, importing dataset in r, data exploration in r
1.3 introduction to R language, importing dataset in r, data exploration in r
Simple Research
 
Apache Spark GraphX highlights.
Apache Spark GraphX highlights. Apache Spark GraphX highlights.
Apache Spark GraphX highlights.
Doug Needham
 
Structured Data Challenges in Finance and Statistics
Structured Data Challenges in Finance and StatisticsStructured Data Challenges in Finance and Statistics
Structured Data Challenges in Finance and Statistics
Wes McKinney
 
LD4KD 2015 - Demos and tools
LD4KD 2015 - Demos and toolsLD4KD 2015 - Demos and tools
LD4KD 2015 - Demos and tools
Vrije Universiteit Amsterdam
 
SciPy 2011 pandas lightning talk
SciPy 2011 pandas lightning talkSciPy 2011 pandas lightning talk
SciPy 2011 pandas lightning talk
Wes McKinney
 
Be A Hero: Transforming GoPro Analytics Data Pipeline
Be A Hero: Transforming GoPro Analytics Data PipelineBe A Hero: Transforming GoPro Analytics Data Pipeline
Be A Hero: Transforming GoPro Analytics Data Pipeline
Chester Chen
 
Prague Hacks 2015
Prague Hacks 2015Prague Hacks 2015
Prague Hacks 2015
Ondřej Profant
 
Rattle Graphical Interface for R Language
Rattle Graphical Interface for R LanguageRattle Graphical Interface for R Language
Rattle Graphical Interface for R Language
Majid Abdollahi
 
Spatial Data Science with R
Spatial Data Science with RSpatial Data Science with R
Spatial Data Science with R
amsantac
 
The Very ^ 2 Basics of R
The Very ^ 2 Basics of RThe Very ^ 2 Basics of R
The Very ^ 2 Basics of R
Winston Chen
 
R statistics with mongo db
R statistics with mongo dbR statistics with mongo db
R statistics with mongo db
MongoDB
 
Hadoop World 2010 - BAH - Fuzzy Table
Hadoop World 2010 - BAH - Fuzzy TableHadoop World 2010 - BAH - Fuzzy Table
Hadoop World 2010 - BAH - Fuzzy Table
Cloudera, Inc.
 
Spark meetup v2.0.5
Spark meetup v2.0.5Spark meetup v2.0.5
Spark meetup v2.0.5
Yan Zhou
 
Evolution of the Graph Schema
Evolution of the Graph SchemaEvolution of the Graph Schema
Evolution of the Graph Schema
Joshua Shinavier
 
Using C# with U-SQL (SQLBits 2016)
Using C# with U-SQL (SQLBits 2016)Using C# with U-SQL (SQLBits 2016)
Using C# with U-SQL (SQLBits 2016)
Michael Rys
 
Introduction to R for data science
Introduction to R for data scienceIntroduction to R for data science
Introduction to R for data science
Long Nguyen
 
Apache Spark — Fundamentals and MLlib
Apache Spark — Fundamentals and MLlibApache Spark — Fundamentals and MLlib
Apache Spark — Fundamentals and MLlib
Jens Fisseler, Dr.
 
1.3 introduction to R language, importing dataset in r, data exploration in r
1.3 introduction to R language, importing dataset in r, data exploration in r1.3 introduction to R language, importing dataset in r, data exploration in r
1.3 introduction to R language, importing dataset in r, data exploration in r
Simple Research
 
Apache Spark GraphX highlights.
Apache Spark GraphX highlights. Apache Spark GraphX highlights.
Apache Spark GraphX highlights.
Doug Needham
 
Structured Data Challenges in Finance and Statistics
Structured Data Challenges in Finance and StatisticsStructured Data Challenges in Finance and Statistics
Structured Data Challenges in Finance and Statistics
Wes McKinney
 
SciPy 2011 pandas lightning talk
SciPy 2011 pandas lightning talkSciPy 2011 pandas lightning talk
SciPy 2011 pandas lightning talk
Wes McKinney
 
Be A Hero: Transforming GoPro Analytics Data Pipeline
Be A Hero: Transforming GoPro Analytics Data PipelineBe A Hero: Transforming GoPro Analytics Data Pipeline
Be A Hero: Transforming GoPro Analytics Data Pipeline
Chester Chen
 
Rattle Graphical Interface for R Language
Rattle Graphical Interface for R LanguageRattle Graphical Interface for R Language
Rattle Graphical Interface for R Language
Majid Abdollahi
 
Spatial Data Science with R
Spatial Data Science with RSpatial Data Science with R
Spatial Data Science with R
amsantac
 
The Very ^ 2 Basics of R
The Very ^ 2 Basics of RThe Very ^ 2 Basics of R
The Very ^ 2 Basics of R
Winston Chen
 
R statistics with mongo db
R statistics with mongo dbR statistics with mongo db
R statistics with mongo db
MongoDB
 
Hadoop World 2010 - BAH - Fuzzy Table
Hadoop World 2010 - BAH - Fuzzy TableHadoop World 2010 - BAH - Fuzzy Table
Hadoop World 2010 - BAH - Fuzzy Table
Cloudera, Inc.
 
Spark meetup v2.0.5
Spark meetup v2.0.5Spark meetup v2.0.5
Spark meetup v2.0.5
Yan Zhou
 
Evolution of the Graph Schema
Evolution of the Graph SchemaEvolution of the Graph Schema
Evolution of the Graph Schema
Joshua Shinavier
 
Using C# with U-SQL (SQLBits 2016)
Using C# with U-SQL (SQLBits 2016)Using C# with U-SQL (SQLBits 2016)
Using C# with U-SQL (SQLBits 2016)
Michael Rys
 

Similar to An R primer for SQL folks (20)

Big data analytics with R tool.pptx
Big data analytics with R tool.pptxBig data analytics with R tool.pptx
Big data analytics with R tool.pptx
salutiontechnology
 
LSESU a Taste of R Language Workshop
LSESU a Taste of R Language WorkshopLSESU a Taste of R Language Workshop
LSESU a Taste of R Language Workshop
Korkrid Akepanidtaworn
 
In-Database Analytics Deep Dive with Teradata and Revolution
In-Database Analytics Deep Dive with Teradata and RevolutionIn-Database Analytics Deep Dive with Teradata and Revolution
In-Database Analytics Deep Dive with Teradata and Revolution
Revolution Analytics
 
DataMass Summit - Machine Learning for Big Data in SQL Server
DataMass Summit - Machine Learning for Big Data  in SQL ServerDataMass Summit - Machine Learning for Big Data  in SQL Server
DataMass Summit - Machine Learning for Big Data in SQL Server
Łukasz Grala
 
microsoft r server for distributed computing
microsoft r server for distributed computingmicrosoft r server for distributed computing
microsoft r server for distributed computing
BAINIDA
 
Introduction to basic statistics
Introduction to basic statisticsIntroduction to basic statistics
Introduction to basic statistics
IBM
 
FOSDEM 2014: Social Network Benchmark (SNB) Graph Generator
FOSDEM 2014:  Social Network Benchmark (SNB) Graph GeneratorFOSDEM 2014:  Social Network Benchmark (SNB) Graph Generator
FOSDEM 2014: Social Network Benchmark (SNB) Graph Generator
LDBC council
 
Bluegranite AA Webinar FINAL 28JUN16
Bluegranite AA Webinar FINAL 28JUN16Bluegranite AA Webinar FINAL 28JUN16
Bluegranite AA Webinar FINAL 28JUN16
Andy Lathrop
 
Advanced Data Analytics with R Programming.ppt
Advanced Data Analytics with R Programming.pptAdvanced Data Analytics with R Programming.ppt
Advanced Data Analytics with R Programming.ppt
Anshika865276
 
DA_01_Intro.pptx
DA_01_Intro.pptxDA_01_Intro.pptx
DA_01_Intro.pptx
Alok Mohapatra
 
pandas: Powerful data analysis tools for Python
pandas: Powerful data analysis tools for Pythonpandas: Powerful data analysis tools for Python
pandas: Powerful data analysis tools for Python
Wes McKinney
 
R programming
R programmingR programming
R programming
yashpalyadav49
 
20160317 - PAZUR - PowerBI & R
20160317  - PAZUR - PowerBI & R20160317  - PAZUR - PowerBI & R
20160317 - PAZUR - PowerBI & R
Łukasz Grala
 
Step By Step Guide to Learn R
Step By Step Guide to Learn RStep By Step Guide to Learn R
Step By Step Guide to Learn R
Venkata Reddy Konasani
 
Analytics Beyond RAM Capacity using R
Analytics Beyond RAM Capacity using RAnalytics Beyond RAM Capacity using R
Analytics Beyond RAM Capacity using R
Alex Palamides
 
Revolution R Enterprise - Portland R User Group, November 2013
Revolution R Enterprise - Portland R User Group, November 2013Revolution R Enterprise - Portland R User Group, November 2013
Revolution R Enterprise - Portland R User Group, November 2013
Revolution Analytics
 
Data Visualization in R (Graph, Trend, etc)
Data Visualization in R (Graph, Trend, etc)Data Visualization in R (Graph, Trend, etc)
Data Visualization in R (Graph, Trend, etc)
Rudyansyah -
 
Unit 2 - Data Manipulation with R.pptx
Unit 2 - Data Manipulation with R.pptxUnit 2 - Data Manipulation with R.pptx
Unit 2 - Data Manipulation with R.pptx
Malla Reddy University
 
Big Data Processing
Big Data ProcessingBig Data Processing
Big Data Processing
Michael Ming Lei
 
The Polyglot Data Scientist - Exploring R, Python, and SQL Server
The Polyglot Data Scientist - Exploring R, Python, and SQL ServerThe Polyglot Data Scientist - Exploring R, Python, and SQL Server
The Polyglot Data Scientist - Exploring R, Python, and SQL Server
Sarah Dutkiewicz
 
Big data analytics with R tool.pptx
Big data analytics with R tool.pptxBig data analytics with R tool.pptx
Big data analytics with R tool.pptx
salutiontechnology
 
In-Database Analytics Deep Dive with Teradata and Revolution
In-Database Analytics Deep Dive with Teradata and RevolutionIn-Database Analytics Deep Dive with Teradata and Revolution
In-Database Analytics Deep Dive with Teradata and Revolution
Revolution Analytics
 
DataMass Summit - Machine Learning for Big Data in SQL Server
DataMass Summit - Machine Learning for Big Data  in SQL ServerDataMass Summit - Machine Learning for Big Data  in SQL Server
DataMass Summit - Machine Learning for Big Data in SQL Server
Łukasz Grala
 
microsoft r server for distributed computing
microsoft r server for distributed computingmicrosoft r server for distributed computing
microsoft r server for distributed computing
BAINIDA
 
Introduction to basic statistics
Introduction to basic statisticsIntroduction to basic statistics
Introduction to basic statistics
IBM
 
FOSDEM 2014: Social Network Benchmark (SNB) Graph Generator
FOSDEM 2014:  Social Network Benchmark (SNB) Graph GeneratorFOSDEM 2014:  Social Network Benchmark (SNB) Graph Generator
FOSDEM 2014: Social Network Benchmark (SNB) Graph Generator
LDBC council
 
Bluegranite AA Webinar FINAL 28JUN16
Bluegranite AA Webinar FINAL 28JUN16Bluegranite AA Webinar FINAL 28JUN16
Bluegranite AA Webinar FINAL 28JUN16
Andy Lathrop
 
Advanced Data Analytics with R Programming.ppt
Advanced Data Analytics with R Programming.pptAdvanced Data Analytics with R Programming.ppt
Advanced Data Analytics with R Programming.ppt
Anshika865276
 
pandas: Powerful data analysis tools for Python
pandas: Powerful data analysis tools for Pythonpandas: Powerful data analysis tools for Python
pandas: Powerful data analysis tools for Python
Wes McKinney
 
20160317 - PAZUR - PowerBI & R
20160317  - PAZUR - PowerBI & R20160317  - PAZUR - PowerBI & R
20160317 - PAZUR - PowerBI & R
Łukasz Grala
 
Analytics Beyond RAM Capacity using R
Analytics Beyond RAM Capacity using RAnalytics Beyond RAM Capacity using R
Analytics Beyond RAM Capacity using R
Alex Palamides
 
Revolution R Enterprise - Portland R User Group, November 2013
Revolution R Enterprise - Portland R User Group, November 2013Revolution R Enterprise - Portland R User Group, November 2013
Revolution R Enterprise - Portland R User Group, November 2013
Revolution Analytics
 
Data Visualization in R (Graph, Trend, etc)
Data Visualization in R (Graph, Trend, etc)Data Visualization in R (Graph, Trend, etc)
Data Visualization in R (Graph, Trend, etc)
Rudyansyah -
 
Unit 2 - Data Manipulation with R.pptx
Unit 2 - Data Manipulation with R.pptxUnit 2 - Data Manipulation with R.pptx
Unit 2 - Data Manipulation with R.pptx
Malla Reddy University
 
The Polyglot Data Scientist - Exploring R, Python, and SQL Server
The Polyglot Data Scientist - Exploring R, Python, and SQL ServerThe Polyglot Data Scientist - Exploring R, Python, and SQL Server
The Polyglot Data Scientist - Exploring R, Python, and SQL Server
Sarah Dutkiewicz
 
Ad

Recently uploaded (20)

chapter 4 Variability statistical research .pptx
chapter 4 Variability statistical research .pptxchapter 4 Variability statistical research .pptx
chapter 4 Variability statistical research .pptx
justinebandajbn
 
LLM finetuning for multiple choice google bert
LLM finetuning for multiple choice google bertLLM finetuning for multiple choice google bert
LLM finetuning for multiple choice google bert
ChadapornK
 
Molecular methods diagnostic and monitoring of infection - Repaired.pptx
Molecular methods diagnostic and monitoring of infection  -  Repaired.pptxMolecular methods diagnostic and monitoring of infection  -  Repaired.pptx
Molecular methods diagnostic and monitoring of infection - Repaired.pptx
7tzn7x5kky
 
Minions Want to eat presentacion muy linda
Minions Want to eat presentacion muy lindaMinions Want to eat presentacion muy linda
Minions Want to eat presentacion muy linda
CarlaAndradesSoler1
 
AI Competitor Analysis: How to Monitor and Outperform Your Competitors
AI Competitor Analysis: How to Monitor and Outperform Your CompetitorsAI Competitor Analysis: How to Monitor and Outperform Your Competitors
AI Competitor Analysis: How to Monitor and Outperform Your Competitors
Contify
 
1. Briefing Session_SEED with Hon. Governor Assam - 27.10.pdf
1. Briefing Session_SEED with Hon. Governor Assam - 27.10.pdf1. Briefing Session_SEED with Hon. Governor Assam - 27.10.pdf
1. Briefing Session_SEED with Hon. Governor Assam - 27.10.pdf
Simran112433
 
Principles of information security Chapter 5.ppt
Principles of information security Chapter 5.pptPrinciples of information security Chapter 5.ppt
Principles of information security Chapter 5.ppt
EstherBaguma
 
Deloitte Analytics - Applying Process Mining in an audit context
Deloitte Analytics - Applying Process Mining in an audit contextDeloitte Analytics - Applying Process Mining in an audit context
Deloitte Analytics - Applying Process Mining in an audit context
Process mining Evangelist
 
Data Analytics Overview and its applications
Data Analytics Overview and its applicationsData Analytics Overview and its applications
Data Analytics Overview and its applications
JanmejayaMishra7
 
Secure_File_Storage_Hybrid_Cryptography.pptx..
Secure_File_Storage_Hybrid_Cryptography.pptx..Secure_File_Storage_Hybrid_Cryptography.pptx..
Secure_File_Storage_Hybrid_Cryptography.pptx..
yuvarajreddy2002
 
VKS-Python Basics for Beginners and advance.pptx
VKS-Python Basics for Beginners and advance.pptxVKS-Python Basics for Beginners and advance.pptx
VKS-Python Basics for Beginners and advance.pptx
Vinod Srivastava
 
Ppt. Nikhil.pptxnshwuudgcudisisshvehsjks
Ppt. Nikhil.pptxnshwuudgcudisisshvehsjksPpt. Nikhil.pptxnshwuudgcudisisshvehsjks
Ppt. Nikhil.pptxnshwuudgcudisisshvehsjks
panchariyasahil
 
Ch3MCT24.pptx measure of central tendency
Ch3MCT24.pptx measure of central tendencyCh3MCT24.pptx measure of central tendency
Ch3MCT24.pptx measure of central tendency
ayeleasefa2
 
Safety Innovation in Mt. Vernon A Westchester County Model for New Rochelle a...
Safety Innovation in Mt. Vernon A Westchester County Model for New Rochelle a...Safety Innovation in Mt. Vernon A Westchester County Model for New Rochelle a...
Safety Innovation in Mt. Vernon A Westchester County Model for New Rochelle a...
James Francis Paradigm Asset Management
 
Perencanaan Pengendalian-Proyek-Konstruksi-MS-PROJECT.pptx
Perencanaan Pengendalian-Proyek-Konstruksi-MS-PROJECT.pptxPerencanaan Pengendalian-Proyek-Konstruksi-MS-PROJECT.pptx
Perencanaan Pengendalian-Proyek-Konstruksi-MS-PROJECT.pptx
PareaRusan
 
VKS-Python-FIe Handling text CSV Binary.pptx
VKS-Python-FIe Handling text CSV Binary.pptxVKS-Python-FIe Handling text CSV Binary.pptx
VKS-Python-FIe Handling text CSV Binary.pptx
Vinod Srivastava
 
EDU533 DEMO.pptxccccvbnjjkoo jhgggggbbbb
EDU533 DEMO.pptxccccvbnjjkoo jhgggggbbbbEDU533 DEMO.pptxccccvbnjjkoo jhgggggbbbb
EDU533 DEMO.pptxccccvbnjjkoo jhgggggbbbb
JessaMaeEvangelista2
 
Data Science Courses in India iim skills
Data Science Courses in India iim skillsData Science Courses in India iim skills
Data Science Courses in India iim skills
dharnathakur29
 
Stack_and_Queue_Presentation_Final (1).pptx
Stack_and_Queue_Presentation_Final (1).pptxStack_and_Queue_Presentation_Final (1).pptx
Stack_and_Queue_Presentation_Final (1).pptx
binduraniha86
 
IAS-slides2-ia-aaaaaaaaaaain-business.pdf
IAS-slides2-ia-aaaaaaaaaaain-business.pdfIAS-slides2-ia-aaaaaaaaaaain-business.pdf
IAS-slides2-ia-aaaaaaaaaaain-business.pdf
mcgardenlevi9
 
chapter 4 Variability statistical research .pptx
chapter 4 Variability statistical research .pptxchapter 4 Variability statistical research .pptx
chapter 4 Variability statistical research .pptx
justinebandajbn
 
LLM finetuning for multiple choice google bert
LLM finetuning for multiple choice google bertLLM finetuning for multiple choice google bert
LLM finetuning for multiple choice google bert
ChadapornK
 
Molecular methods diagnostic and monitoring of infection - Repaired.pptx
Molecular methods diagnostic and monitoring of infection  -  Repaired.pptxMolecular methods diagnostic and monitoring of infection  -  Repaired.pptx
Molecular methods diagnostic and monitoring of infection - Repaired.pptx
7tzn7x5kky
 
Minions Want to eat presentacion muy linda
Minions Want to eat presentacion muy lindaMinions Want to eat presentacion muy linda
Minions Want to eat presentacion muy linda
CarlaAndradesSoler1
 
AI Competitor Analysis: How to Monitor and Outperform Your Competitors
AI Competitor Analysis: How to Monitor and Outperform Your CompetitorsAI Competitor Analysis: How to Monitor and Outperform Your Competitors
AI Competitor Analysis: How to Monitor and Outperform Your Competitors
Contify
 
1. Briefing Session_SEED with Hon. Governor Assam - 27.10.pdf
1. Briefing Session_SEED with Hon. Governor Assam - 27.10.pdf1. Briefing Session_SEED with Hon. Governor Assam - 27.10.pdf
1. Briefing Session_SEED with Hon. Governor Assam - 27.10.pdf
Simran112433
 
Principles of information security Chapter 5.ppt
Principles of information security Chapter 5.pptPrinciples of information security Chapter 5.ppt
Principles of information security Chapter 5.ppt
EstherBaguma
 
Deloitte Analytics - Applying Process Mining in an audit context
Deloitte Analytics - Applying Process Mining in an audit contextDeloitte Analytics - Applying Process Mining in an audit context
Deloitte Analytics - Applying Process Mining in an audit context
Process mining Evangelist
 
Data Analytics Overview and its applications
Data Analytics Overview and its applicationsData Analytics Overview and its applications
Data Analytics Overview and its applications
JanmejayaMishra7
 
Secure_File_Storage_Hybrid_Cryptography.pptx..
Secure_File_Storage_Hybrid_Cryptography.pptx..Secure_File_Storage_Hybrid_Cryptography.pptx..
Secure_File_Storage_Hybrid_Cryptography.pptx..
yuvarajreddy2002
 
VKS-Python Basics for Beginners and advance.pptx
VKS-Python Basics for Beginners and advance.pptxVKS-Python Basics for Beginners and advance.pptx
VKS-Python Basics for Beginners and advance.pptx
Vinod Srivastava
 
Ppt. Nikhil.pptxnshwuudgcudisisshvehsjks
Ppt. Nikhil.pptxnshwuudgcudisisshvehsjksPpt. Nikhil.pptxnshwuudgcudisisshvehsjks
Ppt. Nikhil.pptxnshwuudgcudisisshvehsjks
panchariyasahil
 
Ch3MCT24.pptx measure of central tendency
Ch3MCT24.pptx measure of central tendencyCh3MCT24.pptx measure of central tendency
Ch3MCT24.pptx measure of central tendency
ayeleasefa2
 
Safety Innovation in Mt. Vernon A Westchester County Model for New Rochelle a...
Safety Innovation in Mt. Vernon A Westchester County Model for New Rochelle a...Safety Innovation in Mt. Vernon A Westchester County Model for New Rochelle a...
Safety Innovation in Mt. Vernon A Westchester County Model for New Rochelle a...
James Francis Paradigm Asset Management
 
Perencanaan Pengendalian-Proyek-Konstruksi-MS-PROJECT.pptx
Perencanaan Pengendalian-Proyek-Konstruksi-MS-PROJECT.pptxPerencanaan Pengendalian-Proyek-Konstruksi-MS-PROJECT.pptx
Perencanaan Pengendalian-Proyek-Konstruksi-MS-PROJECT.pptx
PareaRusan
 
VKS-Python-FIe Handling text CSV Binary.pptx
VKS-Python-FIe Handling text CSV Binary.pptxVKS-Python-FIe Handling text CSV Binary.pptx
VKS-Python-FIe Handling text CSV Binary.pptx
Vinod Srivastava
 
EDU533 DEMO.pptxccccvbnjjkoo jhgggggbbbb
EDU533 DEMO.pptxccccvbnjjkoo jhgggggbbbbEDU533 DEMO.pptxccccvbnjjkoo jhgggggbbbb
EDU533 DEMO.pptxccccvbnjjkoo jhgggggbbbb
JessaMaeEvangelista2
 
Data Science Courses in India iim skills
Data Science Courses in India iim skillsData Science Courses in India iim skills
Data Science Courses in India iim skills
dharnathakur29
 
Stack_and_Queue_Presentation_Final (1).pptx
Stack_and_Queue_Presentation_Final (1).pptxStack_and_Queue_Presentation_Final (1).pptx
Stack_and_Queue_Presentation_Final (1).pptx
binduraniha86
 
IAS-slides2-ia-aaaaaaaaaaain-business.pdf
IAS-slides2-ia-aaaaaaaaaaain-business.pdfIAS-slides2-ia-aaaaaaaaaaain-business.pdf
IAS-slides2-ia-aaaaaaaaaaain-business.pdf
mcgardenlevi9
 
Ad

An R primer for SQL folks

  • 1. SQL Bits - the great data heist Manchester 2019 An R primer for SQL folks Thomas Hütter
  • 2. Thomas Hütter, Diplom-Betriebswirt • Application developer, consultant, accidental DBA, author • Worked at consultancies, ISVs, end user companies • Speaker at SQL events around Europe • SQL Server > 6.5, Dynamics Nav > 3.01, R > 3.1.2 @DerFredo https://twitter.com/DerFredo de.linkedin.com/in/derfredo www.xing.com/profile/Thomas_Huetter An R primer for SQL folks
  • 3. Agenda • History: what is R, how did R come to be, 
 what does the R ecosystem look like today • Introduction: R IDE, RStudio, basic data types / objects,
 packages, in-/output, data analysis, visualization • Business case demo: • Extracting ‘sales’ data from a Nav DB on SQL Server • Basic analysis and visualization • Advanced visualization using the Shiny framework • Example: data science going wrong, round-up, resources • This is an introductory walk-through, no deep dive - 
 so no fancy predictions, regression, big data science :-(
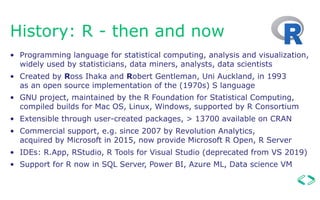
  • 4. History: R - then and now • Programming language for statistical computing, analysis and visualization,
 widely used by statisticians, data miners, analysts, data scientists • Created by Ross Ihaka and Robert Gentleman, Uni Auckland, in 1993 
 as an open source implementation of the (1970s) S language • GNU project, maintained by the R Foundation for Statistical Computing, compiled builds for Mac OS, Linux, Windows, supported by R Consortium • Extensible through user-created packages, > 13700 available on CRAN • Commercial support, e.g. since 2007 by Revolution Analytics, 
 acquired by Microsoft in 2015, now provide Microsoft R Open, R Server • IDEs: R.App, RStudio, R Tools for Visual Studio (deprecated from VS 2019) • Support for R now in SQL Server, Power BI, Azure ML, Data science VM
  • 5. Introduction: data objects • Data types - numeric, integer, complex - character - logical - factor - Posix types for date/time
 - NA = Not available • Data structures - vector: 1 dim, 1 data type - matrix: 2 dim rect, 1 data type - list: collection of other objects - table: > 2 dimensions - data frame
 2 dim rect, cols = vectors
 DemoBasics1
  • 6. Introduction: packages •Extensions to the R base system, containing code, data, documentation.
 Key factor to the success of R; flexible, user contributable. -> CRAN •installed.packages() lists all installed packages incl. versions, dependencies, license and other info •search() lists currently attached packages •install.packages() downloads and installs packages •library() loads/attaches packages, also require() •Hadley Wickham, chief scientist at RStudio, professor of statistics
 „Tidyverse“: dplyr, tidyr, lubridate, readr, httr, ggplot2 
 + many more: hadley.nz DemoBasics2
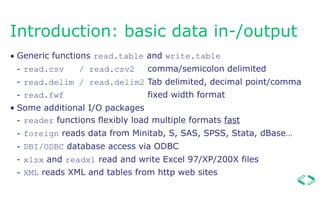
  • 7. Introduction: basic data in-/output • Generic functions read.table and write.table - read.csv / read.csv2 comma/semicolon delimited - read.delim / read.delim2 Tab delimited, decimal point/comma - read.fwf fixed width format • Some additional I/O packages - reader functions flexibly load multiple formats fast - foreign reads data from Minitab, S, SAS, SPSS, Stata, dBase… - DBI/ODBC database access via ODBC - xlsx and readxl read and write Excel 97/XP/200X files - XML reads XML and tables from http web sites
  • 8. Introduction: basic data analysis + visualization • Analyzing (numeric) data:
 str() structure = data types and ranges
 summary() Min, max, mean, median, quartiles;
 for factors: count of levels
 head()/tail() shows top/bottom n rows (default = 6) • Distribution of values:
 hist() shows frequency distribution, 
 boxplot() for min, max, quartiles, outliers, mosaicplot() contingency mosaic DemoBasics3
  • 9. Continued… data analysis + visualization • Libraries: tidy for data tidying/reshaping, ggplot2 implements 
 grammar of graphics, raster for geo data • apply() family of functions applies functions to the margins of 
 an array or a matrix • gather()/spread() convert between wide/long format • ggplot() very powerful plot function, plots point, line or bar 
 geometrics etc with versatile parameters DemoBasics4
  • 10. Business case demo • We are the distributor for all German petrol stations,
 with two subsidiaries: NorthTank and SouthFuel • Business calls „We need some analysis of our 2015 Diesel sales“, 
 preferably some visualizations, and „maybe something is wrong…“ • Of interest: distribution by post code zones • Source: Dynamics Nav ERP database, on the customer card (table „Customer“) there’s a field called „Sales (LCY)“ (= Local currency) • Publicly available shape- and data files for post code zones
 

  • 11. Extracting data & first analysis • Using ODBC and the DBI package
 (also available: JDBC, RODBC and others) • dbConnect() to establish a connection, 
 then dbGetQuery() to query the database • Calculate aggregates (sums) using ddply() • Bar plot: ggplot() + geom_bar() • Line diagram: ggplot() + geom_line()
  • 12. Analysis & visualization • Calculate intervals for sales sums: cut() • libraries raster, rgeos for visualizing geospatial data • shapefiles: open vector data format for GIS software, describes points, lines or polygons in these files:
 .shp shapes, .shx shape index, .dbf attributes, .prj projection • merge shape and sales data: merge() • plot maps, colouring post code zones according to sales DemoTankData
  • 13. Use of Shiny framework • Framework for interactive web applications in R
 apps consist of server.R and ui.R or just app.R • ui defines screen appearance & controls • server handles any data processing, plotting etc. • apps can be run in web browser
 DemoShiny/app
  • 14. Example: data science going wrong? • Anscombe’s quartet: • 4 data sets, each with 11 completely different x-y pairs • yet nearly identical statistical properties - Mean of x = 9 - Mean of y = 7.5 - Correlation between x and y = 0.816 - Linear regression y = 3 + 0.5 x Anscombe
  • 15. Round-up / conclusions • With R, a lot is possible in terms of analysis and visualization • There’s probably always a package for that
 But please: • Know your data • Look at your data ▪ Think - does it make sense? • Consider the influence of outliers • Don’t blindly rely on R ‘doing the trick’
  • 16. Resources online • https://en.wikipedia.org/wiki/R_(programming_language) • https://www.r-project.org/ -> Mirrors of CRAN = Comprehensive R Archive Network • https://www.r-consortium.org/ • http://www.r-bloggers.com/ • www.kdnuggets.com • www.rseek.org Pimped Google search for R-related subjects
 • Twitter hashtag #rstats • LinkedIn groups R Developers und Users Group, R Programming, The R Project for…
 • www.swirlstats.com „Learn R, in R“ • www.coursera.org Data Science specialization (10 courses) MOOC • www.edx.org
  • 17. Resources offline • Beginning R, The statistical programming language
 Dr. Mark Gardener, Wrox/Wiley, ISBN 978-1118164303 • R Cookbook, Paul Teetor, O’Reilly, ISBN 978-0596809157 • R Graphics Cookbook, Winston Chang, O’Reilly, 
 ISBN 978-1449316952 • R in a Nutshell, Joseph Adler, O’Reilly, ISBN 978-1449312084 • Practical Data Science with R, Nina Zumel + John Mount,
 Manning publications, ISBN 978-1617291562
  • 18. Credits • Titanic data set: www.kaggle.com/c/titanic/data • SQL Database structure:
 mbs.microsoft.com Dynamics Nav 2016 demo database • Customer and „sales“ data: www.tankerkoenig.de (license CC BY 4.0) • Shape files:
 - www.suche-postleitzahl.org (Open database license, 
 © OpenStreetMap contributors)
 - Bundesamt für Kartographie und Geodäsie, Frankfurt am Main, 2011 • Some icons made by:
 http://www.flaticon.com/authors/hanan (license CC BY 3.0) • Anscombe’s quartet: Francis J. Anscombe 1973
  • 19. An R primer for SQL folks Time for some Q & A: That is: questions that might be of common interest,
 and their answers might fit into the remaining time For slides and scripts: follow link on final slide
 or check the SQLBits homepage ;-)
  • 20. An R primer for SQL folks Thank you for your interest & keep in touch:
 @DerFredo https://twitter.com/DerFredo de.linkedin.com/in/derfredo www.xing.com/profile/Thomas_Huetter Slides and scripts to this presentation will be at
 https://github.com/SQLThomas/Conferences/tree/master/Bits2019