SlideShare a Scribd company logo
WELCOME
TO
OUR
PRESENTATION
1
MS Excel: Analyzing Data
using Different Application
Our
Topic
is
2
Pivot Table
Pivot Table is a data
summarization tool
found in data
visualization programs
such as spreadsheets
or business
intelligence software.
3
Function of Pivot Table
4
Function of Pivot Table
5
Apply Pivot Table
6
Apply Pivot Table
7
Apply Pivot Table
8
Apply Pivot Table
9
Apply Pivot Table
10
Effectiveness of Pivot Table
Compare information in seconds
Time Saver
Sort information by category easier
Interactive Data Analysis
11
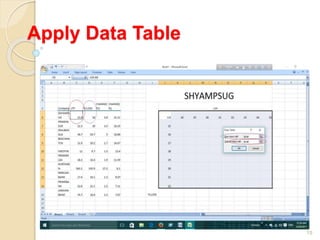
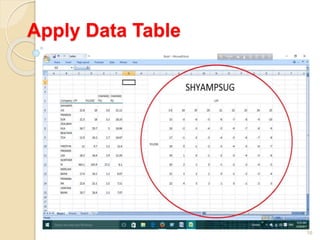
Data Table
Data tables are a handy
way to display the results
of multiple formula
calculations in an at-
a-glance lookup format.
12
Function of Data Table
1
• Type the formula in the appropriate
location.
2
• Select the group of cells that contains the
formula and input values that you want to
substitute.
3
• Click DATA>WHAT-IF Analysis>DATA
TABLE & Identify the input cell reference.
13
Apply Data Table
14
Apply Data Table
15
Apply Data Table
16
Effectiveness of Data Table
Time Saver
Analyzing with More Data
Compute with in Seconds
Compare Many Conditions at
the Same Time
17
Scenario Manager
Scenario analysis is a
common top-down
analytical approach
where numerous inputs
are modified at a time.
18
Function of Scenario Manager
1
• Data tab >What-If
Analysis>Scenario Manager
2
• Add & Modify Scenarios
3
• Engaging with the scenario
summary
19
Apply Scenario Manager
20
Apply Scenario Manager
21
Apply Scenario Manager
22
Apply Scenario Manager
23
Apply Scenario Manager
24
Effectiveness of Scenario
manager
Time Saver
Compare Among Different Scenario
Helpful for Decision Making
Effective Management Tool
25
Goal Seek
The Goal Seek
feature in Excel
uses a single
variable to find a
desired result.
26
Goal Seek Function
27
Apply Goal Seek
28
Apply Goal Seek
29
Effectiveness of Goal Seek
Time Saver
Showing What Changes Are Needed
Forecasting Function
Determine the Expected value
30
VLOOKUP
The VLOOKUP
function performs
a vertical lookup
by searching for a
value.
31
Function of VLOOKUP
1
• Value to search for in the table of data
2
• The table or the source of data where
the vertical lookup should be performed.
3
• The position number in the table where
the return data can be found.
4
• Looking for an exact match or
approximate match.
32
Apply VLOOPKUP
33
Apply VLOOKUP
34
Apply VLOOKUP
35
Apply of H-lookup
36
Apply of H-Lookup
37
Apply of H-Lookup
38
Effectiveness of VLOOKUP
Time Saver
Query within a Second
Categorized Data as Needed
Find Something Quickly from Huge Data
39
THANK
YOU
40

More Related Content

What's hot (20)

PPTX
Charts and pivot tables
UttaraChattopadhyay
 
PPTX
Pivot table
Vijay Perepa
 
PPT
Pivot table presentation
Sha Tibnjn
 
PPT
Pivot Tables
Dr. C.V. Suresh Babu
 
PDF
Dashboard and Database Manual for AFG
Abigail Anderson
 
PPTX
Excel Pivot Tables
Matt Saragusa
 
PPTX
Working with Pivot Tables
Kingston Tagoe
 
PPTX
Pivot Tables
gjonesnemeth
 
PPTX
WorldCat Local Lists for Serials Reporting
Darinlee Needham
 
PPTX
Data Analysis & Visualization using MS. Excel
Frehiwot Mulugeta
 
PDF
Excel Crash Course: Pivot Tables
Purple, Rock, Scissors
 
PPTX
Pivot table and Dashboard in microsoft excel
Frehiwot Mulugeta
 
PDF
Business objects activities web intelligence
Dmitry Anoshin
 
PDF
Print18
Hassan Samoon
 
PDF
Excel creating pivot table
samikshaa sinha
 
DOC
Module 6 component of excel chart
Dr. Shalini Pandey
 
PPTX
Advanced Excel Demo
Pecific University
 
PDF
Handouts how to use microsoft access to combine cost and usage data for ejour...
Charleston Conference
 
DOC
Module 6 (2) type of excel chart
Dr. Shalini Pandey
 
DOCX
Linking chart from excel with power point
SAMUEL BARNABAS IFITUMI
 
Charts and pivot tables
UttaraChattopadhyay
 
Pivot table
Vijay Perepa
 
Pivot table presentation
Sha Tibnjn
 
Pivot Tables
Dr. C.V. Suresh Babu
 
Dashboard and Database Manual for AFG
Abigail Anderson
 
Excel Pivot Tables
Matt Saragusa
 
Working with Pivot Tables
Kingston Tagoe
 
Pivot Tables
gjonesnemeth
 
WorldCat Local Lists for Serials Reporting
Darinlee Needham
 
Data Analysis & Visualization using MS. Excel
Frehiwot Mulugeta
 
Excel Crash Course: Pivot Tables
Purple, Rock, Scissors
 
Pivot table and Dashboard in microsoft excel
Frehiwot Mulugeta
 
Business objects activities web intelligence
Dmitry Anoshin
 
Print18
Hassan Samoon
 
Excel creating pivot table
samikshaa sinha
 
Module 6 component of excel chart
Dr. Shalini Pandey
 
Advanced Excel Demo
Pecific University
 
Handouts how to use microsoft access to combine cost and usage data for ejour...
Charleston Conference
 
Module 6 (2) type of excel chart
Dr. Shalini Pandey
 
Linking chart from excel with power point
SAMUEL BARNABAS IFITUMI
 

Similar to Analyzing data using application in MS Excel (20)

PPT
Excel 2007 Unit K
Raja Waseem Akhtar
 
PPTX
Scenarios
Netresult Ltd
 
PPTX
What-If Analysis: Exploring Scenarios and Goals with Spreadsheets
Hussain K
 
PDF
Excellence In Excel Presentation
cynosure76
 
PPTX
Advanced Filter Concepts in MS-Excel
P. SUNDARI ARUN
 
PPTX
Excel-VBA
DHRUYEN HADIYA
 
PDF
Interactivity on Excel Using Pivoting, Dashboards, “Index and Match,” and Glo...
Shalin Hai-Jew
 
PDF
Kofi nyanteng excel modelling (what if analysis)
Kofi Kyeremateng Nyanteng
 
PDF
Kofi nyanteng excel modelling (what if analysis)
Kofi Kyeremateng Nyanteng
 
PPTX
Roll No. 26, 31 to 39 (G4) Use of MS-Excel in CA Profession (wecompress.com)....
VinayakPoddar2
 
PPTX
MS EXCEL PPT PRESENTATION
Mridul Bansal
 
PDF
2016 0921 IMA MO-Stand-Out (Handout)
Invenio Advisors, LLC
 
PPTX
Advance Microsoft Office Excel Course.pptx
ssuserc9f959
 
PPTX
EXCEL PPT FOR IT.pptx for itt batch basic
prabhatsingh555ps
 
PPTX
Excel
Rajesh Mudaliyar
 
DOCX
Uses of excel
Jithin Zcs
 
Excel 2007 Unit K
Raja Waseem Akhtar
 
Scenarios
Netresult Ltd
 
What-If Analysis: Exploring Scenarios and Goals with Spreadsheets
Hussain K
 
Excellence In Excel Presentation
cynosure76
 
Advanced Filter Concepts in MS-Excel
P. SUNDARI ARUN
 
Excel-VBA
DHRUYEN HADIYA
 
Interactivity on Excel Using Pivoting, Dashboards, “Index and Match,” and Glo...
Shalin Hai-Jew
 
Kofi nyanteng excel modelling (what if analysis)
Kofi Kyeremateng Nyanteng
 
Kofi nyanteng excel modelling (what if analysis)
Kofi Kyeremateng Nyanteng
 
Roll No. 26, 31 to 39 (G4) Use of MS-Excel in CA Profession (wecompress.com)....
VinayakPoddar2
 
MS EXCEL PPT PRESENTATION
Mridul Bansal
 
2016 0921 IMA MO-Stand-Out (Handout)
Invenio Advisors, LLC
 
Advance Microsoft Office Excel Course.pptx
ssuserc9f959
 
EXCEL PPT FOR IT.pptx for itt batch basic
prabhatsingh555ps
 
Uses of excel
Jithin Zcs
 
Ad

Recently uploaded (20)

PPTX
美国史蒂文斯理工学院毕业证书{SIT学费发票SIT录取通知书}哪里购买
Taqyea
 
PDF
SQL for Accountants and Finance Managers
ysmaelreyes
 
PPTX
ER_Model_with_Diagrams_Presentation.pptx
dharaadhvaryu1992
 
PDF
Unlocking Insights: Introducing i-Metrics Asia-Pacific Corporation and Strate...
Janette Toral
 
PDF
Optimizing Large Language Models with vLLM and Related Tools.pdf
Tamanna36
 
PPTX
big data eco system fundamentals of data science
arivukarasi
 
PDF
Group 5_RMB Final Project on circular economy
pgban24anmola
 
PDF
apidays Singapore 2025 - How APIs can make - or break - trust in your AI by S...
apidays
 
PPT
Growth of Public Expendituuure_55423.ppt
NavyaDeora
 
PPTX
Powerful Uses of Data Analytics You Should Know
subhashenia
 
PPTX
03_Ariane BERCKMOES_Ethias.pptx_AIBarometer_release_event
FinTech Belgium
 
PPTX
SHREYAS25 INTERN-I,II,III PPT (1).pptx pre
swapnilherage
 
PDF
apidays Singapore 2025 - Trustworthy Generative AI: The Role of Observability...
apidays
 
PPTX
thid ppt defines the ich guridlens and gives the information about the ICH gu...
shaistabegum14
 
PPTX
04_Tamás Marton_Intuitech .pptx_AI_Barometer_2025
FinTech Belgium
 
PPTX
b6057ea5-8e8c-4415-90c0-ed8e9666ffcd.pptx
Anees487379
 
PDF
NIS2 Compliance for MSPs: Roadmap, Benefits & Cybersecurity Trends (2025 Guide)
GRC Kompas
 
PPTX
SlideEgg_501298-Agentic AI.pptx agentic ai
530BYManoj
 
PPTX
apidays Singapore 2025 - Generative AI Landscape Building a Modern Data Strat...
apidays
 
PPTX
05_Jelle Baats_Tekst.pptx_AI_Barometer_Release_Event
FinTech Belgium
 
美国史蒂文斯理工学院毕业证书{SIT学费发票SIT录取通知书}哪里购买
Taqyea
 
SQL for Accountants and Finance Managers
ysmaelreyes
 
ER_Model_with_Diagrams_Presentation.pptx
dharaadhvaryu1992
 
Unlocking Insights: Introducing i-Metrics Asia-Pacific Corporation and Strate...
Janette Toral
 
Optimizing Large Language Models with vLLM and Related Tools.pdf
Tamanna36
 
big data eco system fundamentals of data science
arivukarasi
 
Group 5_RMB Final Project on circular economy
pgban24anmola
 
apidays Singapore 2025 - How APIs can make - or break - trust in your AI by S...
apidays
 
Growth of Public Expendituuure_55423.ppt
NavyaDeora
 
Powerful Uses of Data Analytics You Should Know
subhashenia
 
03_Ariane BERCKMOES_Ethias.pptx_AIBarometer_release_event
FinTech Belgium
 
SHREYAS25 INTERN-I,II,III PPT (1).pptx pre
swapnilherage
 
apidays Singapore 2025 - Trustworthy Generative AI: The Role of Observability...
apidays
 
thid ppt defines the ich guridlens and gives the information about the ICH gu...
shaistabegum14
 
04_Tamás Marton_Intuitech .pptx_AI_Barometer_2025
FinTech Belgium
 
b6057ea5-8e8c-4415-90c0-ed8e9666ffcd.pptx
Anees487379
 
NIS2 Compliance for MSPs: Roadmap, Benefits & Cybersecurity Trends (2025 Guide)
GRC Kompas
 
SlideEgg_501298-Agentic AI.pptx agentic ai
530BYManoj
 
apidays Singapore 2025 - Generative AI Landscape Building a Modern Data Strat...
apidays
 
05_Jelle Baats_Tekst.pptx_AI_Barometer_Release_Event
FinTech Belgium
 
Ad

Analyzing data using application in MS Excel