SlideShare a Scribd company logo
Application of Deep Learning
Technique for Precise Stock Market
Prediction
Saikat Mondal, Abhishek Dutta and Piyali Chatterjee
School of Computing and Analytics
NSHM College of Management and Technology,
Kolkata, India.
National Conference on Machine Learning and Artificial
Intelligence.
1st February, 2020.
Lal Bahadur Shastri Institute of Management, Delhi, India.
Objective of the work
• The primary goal of the paper is to predict
stock market values using machine learning
techniques to build a robust forecasting
model.
• Application of deep learning method of LSTM
(long short term memory) , to show how deep
learning triumphs over machine learning.
Outline
• Related Work
• Methodology
• Machine Learning Results
– Regression
– Classification
• LSTM Results
• Conclusion
Related work
• In the field of prediction stock market values , the most
primitive approach was the use of simple regression
techniques like OLS on the data.
• Second, in terms of approach come the traditional
econometric methods of time series analysis like ARIMA (auto
regressive integrated moving average), Granger causality test,
regressive models with distributed lag and quantile
Regression for forecasting of the values.
• Thirdly we have implementation of modern machine learning
and deep learning techniques and Natural Language
Processing (NLP).
Methodology
• We have chosen three companies which have high impact on
the market , from three major sectors. These are NSE listed
companies namely HDFC Bank, CIPLA and TCS. We have
collected the data from the website of NSEIndia.
• The data consists of daily index of these three companies over
a stretch of six years from 2013-2018, starting from 1st
January 2013 to 31st December 2018.
• This data has been used to predict the stock market values
over a weekly horizon for one year. After the application of
the ML and DL models on the 2019 data (the test data), we
can figure out how well the predictions have turned out.
Methodology
• The raw data consists of variables containing information about the
daily index of these companies. The variables are namely date,
open values, closed values, high values, low values, volume and
range.
• We have converted these variables into their normalised form using
min-max normalisation, to make them suited for use in machine
learning models.
• The date has been segregated into day, month and year. The other
normalised variables are i) open_norm ii) close_norm iii) high_norm
iv) low_norm v) volume-norm and vi) range_norm. the close_norm
variable is our response variable here while the rest are predictors.
• The negative values of the normalized variables indicate that there
has been a fall in the value when compared with its previous day,
while the positive values indicate that there has been a upward
movement.
RESULTS
The regression results are:
Bagging Boosting
Random Forest
Stock Train Test
TCS Cor 0.61
MAPE 115.1
Cor 0.84
MAPE 87.37
CIPLA Cor 0.84
MAPE 68.55
Cor 0.773
MAPE 72.26
HDFC Cor 0.13
MAPE 333.3
Cor 0.88
MAPE 66.11
ANN
Stock Train Test
TCS Cor 0.97
MAPE 31.48
Cor 0.86
MAPE 64.93
CIPLA Cor 0.97
MAPE 36.39
Cor 0.72
MAPE 94.9
HDFC Cor 0.97
MAPE 35.98
Cor 0.824
MAPE 85.96
Stock Train Test
TCS Cor 0.85
MAPE 72.16
Cor 0.81
MAPE 74.11
CIPLA Cor 0.826
MAPE 79.18
Cor 0.72
MAPE 95.21
HDFC Cor 0.83
MAPE 76.58
Cor 0.808
MAPE 88.68
Stock Train Test
TCS Cor 0.91
MAPE 55.59
Cor 0.87
MAPE 61.17
CIPLA Cor 0.89
MAPE 62.11
Cor 0.89
MAPE 62.11
HDFC Cor 0.89
MAPE 62.15
Cor 0.89
MAPE 62.15
RESULTS
Support Vector Machines
RESULTS
The classification results are :
Stock Train Test
TCS Sensitivity 85.39
Specificity 83.35
PPV 84.73
NPV 84.06
CA 84.41
Sensitivity 80.08
Specificity 80.17
PPV 81.45
NPV 79.48
CA 80.49
CIPLA Sensitivity 79.66
Specificity 83.35
PPV 81.72
NPV 81.43
CA 81.57
Sensitivity 70.00
Specificity 76.15
PPV 71.29
NPV 75.00
CA 73.06
HDFC Sensitivity 82.18
Specificity 79.94
PPV 81.22
NPV 80.95
CA 81.09
Sensitivity 84.55
Specificity 83.05
PPV 83.87
NPV 83.76
CA 83.81
Logistic Regression
RESULTS
The classification results are :
Stock Train Test
TCS Sensitivity 82.50
Specificity 87.80
PPV 88.00
NPV 82.20
CA 85.09
Sensitivity 79.23
Specificity 81.88
PPV 82.50
NPV 78.50
CA 80.49
CIPLA Sensitivity 81.40
Specificity 93.40
PPV 92.10
NPV 82.83
CA 82.50
Sensitivity 61.00
Specificity 72.30
PPV 65.30
NPV 69.00
CA 67.50
HDFC Sensitivity 81.66
Specificity 83.56
PPV 83.98
NPV 81.19
CA 82.58
Sensitivity 78.00
Specificity 78.81
PPV 79.33
NPV 77.50
CA 78.42
Bagging
RESULTS
The classification results are :
Stock Train Test
TCS Sensitivity 100
Specificity 100
PPV 100
NPV 100
CA 100
Sensitivity 82.90
Specificity 83.90
PPV 85.60
NPV 83.90
CA 83.40
CIPLA Sensitivity 100
Specificity 100
PPV 100
NPV 100
CA 100
Sensitivity 70.29
Specificity 71.94
PPV 64.50
NPV 76.92
CA 71.25
HDFC Sensitivity 100
Specificity 100
PPV 100
NPV 100
CA 100
Sensitivity 81.96
Specificity 80.67
PPV 81.30
NPV 81.35
CA 81.32
Boosting
RESULTS
The classification results are :
Stock Train Test
TCS Sensitivity 84.48
Specificity 84.48
PPV 85.73
NPV 84.06
CA 84.41
Sensitivity 60.00
Specificity 89.00
PPV 67.53
NPV 86.20
CA 74.27
CIPLA Sensitivity 79.66
Specificity 83.35
PPV 81.72
NPV 80.73
CA 81.36
Sensitivity 40.00
Specificity 96.15
PPV 89.79
NPV 65.44
CA 70.12
HDFC Sensitivity 44.85
Specificity 60.72
PPV 54.66
NPV 51.05
CA 52.57
Sensitivity 24.39
Specificity 75.42
PPV 50.84
NPV 48.90
CA 49.37
ANN
RESULTS
The classification results are :
Stock Train Test
TCS Sensitivity 100.00
Specificity 100.00
PPV 100.00
NPV 100.00
CA 100.00
Sensitivity 83.20
Specificity 81.03
PPV 82.53
NPV 81.73
CA 82.15
CIPLA Sensitivity 100.00
Specificity 100.00
PPV 100.00
NPV 100.00
CA 100.00
Sensitivity 63.63
Specificity 78.46
PPV 71.42
NPV 71.83
CA 71.38
HDFC Sensitivity 100.00
Specificity 100.00
PPV 100.00
NPV 100.00
CA 100.00
Sensitivity 79.67
Specificity 77.11
PPV 78.40
NPV 78.44
CA 78.42
Random Forest
RESULTS
• Among all the techniques which have produced fairly good
results , Boosting and Random Forest produced the best
results in almost all metrics (produced best results among all
other regression techniques for training data).
• While Support Vector Machines produced best results for
classification.
• For calculating the accuracies, we had to reverse transformed
the normalized values by using the formula (RMSE/mean
absolute values)%. For calculating the accuracies, we had to
reverse transformed the normalized values by using the
formula (RMSE/mean absolute values)%.
Long Short Term Memory
• LSTM - LSTM is a very efficient deep learning method which is a sub
branch of RNN (Recurrent Neural Networks). RNN has a feature which
LSTM inherits, i.e., it allows back-propagation method simultaneously
unlike the multi-level perceptron’s (MLP’s) feed-forward process.
• The back propagation helps to resolve the weightage problem (vanishing
gradient and exploding gradients) of the nodes and leads us to more
impressive results. This is why LSTM is appropriate for time series analysis,
handwriting recognition and speech processing.
• LSTM architecture consists of many software blocks ,out of which there
are basically salient three regulator gates connected by several
information channels and a memory cell. These gates of three types i) The
input gates ii)The output gate iii) The forget gate.
Forecasting using LSTM models
 Case 1: LSTM applied on HDFC Bank’s data.
 Case 2: LSTM applied on TCS’s data
 Case 3: LSTM applied on Cipla’s data.
LSTM models built using the 6 years stock price
movement from 2013-2018.
Methodology
 The LSTM model is built using the frameworks Keras and
Tensorflow 2.0.0 , with python being the underlying
language.
 Here in this model ‘ADAM’ optimizer is used and for the
loss function ‘MAPE’ is used.
 The model has been trained on 1st January 2013 to 31st
December 2018 consisting of 1474 samples and validated
on 242 samples from 2019. .
Results
We started with 65 epochs initially. We changed the number
of epochs gradually and we finally stopped at 12. The model
has converged, for training and validation, which we have
not shown here due to time constraint.
HDFC BANK
Results
We started with 55 epochs initially. We changed the
number of epochs gradually and we finally stopped at 50.
The model has converged, for training and validation.
TCS
Results
We started with 65 epochs initially. We changed the number of
epochs gradually and we finally stopped at 28. The model has
converged, for training and validation.
CIPLA
CONCLUSION
 We have presented several machine learning and deep learning
models which can efficiently predict the stock market values of
daily index data and use them to forecast on a weekly horizon
for one year (2019).
 While using machine learning models, we observed that they
have produced quite good results for training data in several
cases, and also for test cases, especially for Boosting and SVM.
However, LSTM have outperformed them all with much higher
accuracy levels.
 LSTM will perform better if it is provided with larger datasets for
training, but with our data sets also it have produced quite good
results.
 As different techniques of machine and deep learning have
produced different performances, as a future scope of work we
plan to explore the possibility of fine tuning these models and
aim for higher prediction accuracy.
References
[1] J. Sen and T. Datta Chaudhuri, "An alternative framework for time series decomposition and forecasting and its
relevance for portfolio choice - a comparative study of the Indian consumer durable and small cap sector," Journal of
Economics Library, vol. 3, no. 2, pp. 303
- 326, 2016.
[2] J. Sen and T. Datta Chaudhuri, "Decomposition of time series data of stock markets and its implications for
prediction - an application for the Indian auto sector," In Proceedings of the 2nd National Conference on Advances in
Business Research and Management Practices(ABRMP'2016), Kolkata, India, pp. 15-28.
[3] J. Sen and T. Datta Chaudhuri, "An investigation of the structural characteristics of the Indian IT sector and the
capital goods sector – an application of the R programming language in time series decomposition and forecasting,"
Journal of Insurance and Financial Management, vol. 1, no. 4, pp. 68 - 132, 2016.
[4] J. Sen and T. Datta Chaudhuri, "A time series analysis-based forecasting framework for the Indian healthcare sector,"
Journal of Insurance and Financial Management, vol. 3, no. 1, pp. 66 - 94, 2017.
[5] J. Sen and T. Datta Chaudhuri, "A predictive analysis of the Indian FMCG sector using time series decomposition-
based approach," Journal of Economics Library, vol. 4, no. 2, pp. 206 - 226, 2017.
[6] J. Sen, "A time series analysis-based forecasting approach for the Indian realty sector," International Journal of
Applied Economic Studies, vol. 5, no. 4, pp. 8 - 27, 2017.
References
[7] J. Sen, "A robust analysis and forecasting framework for the Indian mid cap sector using time series
decomposition," Journal of Insurance and Financial Management, vol. 3, no. 4, pp. 1- 32, 2017.
[8] J. Sen and T. Datta Chaudhuri, "Understanding the sectors of Indian economy for portfolio choice,"
International Jouranl of Business Forecasting and Marketing Intelligence, vol. 4, no. 2, pp. 178-222.
[9]Q. Wu, Y. Che, and Z. Liu, "Ensemble model of intelligent paradigms for stock market forecasting," In
Proceedings of the IEEE.
[10]1st International Workshop on Knowledge Discovery and Data Mining, Washington DC, USA, pp. 205 – 208,
2008.
[11] T. A. Siddiqui and Y. Abdullah, "Developing a nonlinear model to predict stock prices in India: an artificial
neural networks approach," IUP Journal of Applied Finance, vol. 21, no. 3, pp. 36 - 39, 2015.
[12] NSEIndia website - https://www.nseindia.com/
[13] A. Geron, Hands-on Machine Learning with Scikit-Learn Keras & Tensorflow, O’Reilly Publications, USA,
2019.
Application_of_Deep_Learning_Techniques.pptx

More Related Content

PDF
Icbai 2018 ver_1
BlackhatGAURAV
 
PPTX
MPS PPT_1 For Long Short Term Memory For Stock Price Prediction
SagarTalagatti2
 
PDF
A Study on Prediction of Share Price by Using Machine Learning LSTM Model
ijtsrd
 
PDF
STOCK MARKET PREDICTION USING NEURAL NETWORKS
IRJET Journal
 
PDF
IRJET- Data Visualization and Stock Market and Prediction
IRJET Journal
 
PPTX
Mini Project With Seminar In LSTM For Stock Price Prediction
SagarTalagatti2
 
PPTX
Final PPT.pptx
samarth70133
 
PPTX
LSTM and Neuralprohet for Share Price Forecasting
sivaashokkumar412
 
Icbai 2018 ver_1
BlackhatGAURAV
 
MPS PPT_1 For Long Short Term Memory For Stock Price Prediction
SagarTalagatti2
 
A Study on Prediction of Share Price by Using Machine Learning LSTM Model
ijtsrd
 
STOCK MARKET PREDICTION USING NEURAL NETWORKS
IRJET Journal
 
IRJET- Data Visualization and Stock Market and Prediction
IRJET Journal
 
Mini Project With Seminar In LSTM For Stock Price Prediction
SagarTalagatti2
 
Final PPT.pptx
samarth70133
 
LSTM and Neuralprohet for Share Price Forecasting
sivaashokkumar412
 

Similar to Application_of_Deep_Learning_Techniques.pptx (20)

PDF
Stock Market Prediction.pptx
RastogiAman
 
PPTX
Stock Price Prediction.pptxshsjjejejejejejej
singhsandeepabc6
 
PDF
STOCK PRICE PREDICTION USING ML TECHNIQUES
IRJET Journal
 
PPTX
Stock End term by muhammad ahmad iraqui .pptx
cxhamza3
 
PPTX
Kondal Kolipaka.pptx
Kondal Kolipaka
 
PDF
Stock Market Prediction Using Deep Learning
IRJET Journal
 
PDF
Predicting Stock Price Movements with Low Power Consumption LSTM
IRJET Journal
 
PPTX
Stock Market Prediction using Machine Learning
Aravind Balaji
 
PPTX
FINAL PPT AS FOR STOCK MARKET PREDICTION
MahulSethi1
 
PDF
Visualizing and Forecasting Stocks Using Machine Learning
IRJET Journal
 
PDF
Stock Market Prediction Analysis
IRJET Journal
 
PPTX
Stock prediction1600759770283_ak.ppt.pptx
jesidil290
 
PDF
The Utilization of Machine Learning for The Prediction of CSX Index and Tax R...
AJHSSR Journal
 
PPTX
stock prise prediction.pptx
DishaAnkar
 
PDF
Stock Market Price Prediction Using Technical Analysis
ASHEESHVERMA6
 
PDF
IRJET- Stock Price Prediction using combination of LSTM Neural Networks, ARIM...
IRJET Journal
 
PPTX
flowchart ON DEEP LEARNING SPP
DishaAnkar
 
PPTX
Batch_12_TSA_using_LSTM machine learning project
srivatsav29
 
PDF
Stock Market Analysis and Prediction (1) (2).pdf
digitallynikitasharm
 
PDF
Performance Comparisons among Machine Learning Algorithms based on the Stock ...
IRJET Journal
 
Stock Market Prediction.pptx
RastogiAman
 
Stock Price Prediction.pptxshsjjejejejejejej
singhsandeepabc6
 
STOCK PRICE PREDICTION USING ML TECHNIQUES
IRJET Journal
 
Stock End term by muhammad ahmad iraqui .pptx
cxhamza3
 
Kondal Kolipaka.pptx
Kondal Kolipaka
 
Stock Market Prediction Using Deep Learning
IRJET Journal
 
Predicting Stock Price Movements with Low Power Consumption LSTM
IRJET Journal
 
Stock Market Prediction using Machine Learning
Aravind Balaji
 
FINAL PPT AS FOR STOCK MARKET PREDICTION
MahulSethi1
 
Visualizing and Forecasting Stocks Using Machine Learning
IRJET Journal
 
Stock Market Prediction Analysis
IRJET Journal
 
Stock prediction1600759770283_ak.ppt.pptx
jesidil290
 
The Utilization of Machine Learning for The Prediction of CSX Index and Tax R...
AJHSSR Journal
 
stock prise prediction.pptx
DishaAnkar
 
Stock Market Price Prediction Using Technical Analysis
ASHEESHVERMA6
 
IRJET- Stock Price Prediction using combination of LSTM Neural Networks, ARIM...
IRJET Journal
 
flowchart ON DEEP LEARNING SPP
DishaAnkar
 
Batch_12_TSA_using_LSTM machine learning project
srivatsav29
 
Stock Market Analysis and Prediction (1) (2).pdf
digitallynikitasharm
 
Performance Comparisons among Machine Learning Algorithms based on the Stock ...
IRJET Journal
 
Ad

Recently uploaded (20)

PDF
Keppel Ltd. 1H 2025 Results Presentation Slides
KeppelCorporation
 
PDF
William Trowell - A Construction Project Manager
William Trowell
 
PPTX
Foreign-Direct-Investment-Shaping-the-Global-Trade-Landscape 5.pptx
Blackworld7
 
PPTX
Pakistan’s Leading Manpower Export Agencies for Qatar
Glassrooms Dubai
 
PDF
Withum Webinar - OBBBA: Tax Insights for Food and Consumer Brands
Withum
 
PPTX
Mining Services and Iron Ore Transportation in India.pptx
Naaraayani Minerals Pvt.Ltd
 
PDF
What are the steps to buy GitHub accounts safely?
d14405913
 
PDF
Tariff Surcharge and Price Increase Decision
Joshua Gao
 
PDF
NewBase 29 July 2025 Energy News issue - 1807 by Khaled Al Awadi_compressed.pdf
Khaled Al Awadi
 
PPTX
E-commerce and its impact on business.
pandeyranjan5483
 
PPTX
Presentation - Business Intelligence Solutions 007.pptx
FBSPL
 
PDF
bain-temasek-sea-green-economy-2022-report-investing-behind-the-new-realities...
YudiSaputra43
 
PDF
The Digital Culture Challenge; Bridging the Employee-Leadership Disconnect
Brian Solis
 
DOCX
unit 1 BC.docx - INTRODUCTION TO BUSINESS COMMUICATION
MANJU N
 
PDF
2025 07 29 The Future, Backwards Agile 2025.pdf
Daniel Walsh
 
PDF
HOT DAY CAFE , Café Royale isn’t just another coffee shop
PINKY PARLOUR
 
PPTX
NTE 2025/20: Updated End User Undertaking (EUU) Form and Guidance
RT Consulting Limited
 
PPTX
Communications Recruiter Melbourne.pptx
ReithGordon
 
PPT
How to Protect Your New York Business from the Unexpected
Sam Vohra
 
PPTX
Creating the Ultimate SOP Manual: Streamline, Standardize, and Scale
RUPAL AGARWAL
 
Keppel Ltd. 1H 2025 Results Presentation Slides
KeppelCorporation
 
William Trowell - A Construction Project Manager
William Trowell
 
Foreign-Direct-Investment-Shaping-the-Global-Trade-Landscape 5.pptx
Blackworld7
 
Pakistan’s Leading Manpower Export Agencies for Qatar
Glassrooms Dubai
 
Withum Webinar - OBBBA: Tax Insights for Food and Consumer Brands
Withum
 
Mining Services and Iron Ore Transportation in India.pptx
Naaraayani Minerals Pvt.Ltd
 
What are the steps to buy GitHub accounts safely?
d14405913
 
Tariff Surcharge and Price Increase Decision
Joshua Gao
 
NewBase 29 July 2025 Energy News issue - 1807 by Khaled Al Awadi_compressed.pdf
Khaled Al Awadi
 
E-commerce and its impact on business.
pandeyranjan5483
 
Presentation - Business Intelligence Solutions 007.pptx
FBSPL
 
bain-temasek-sea-green-economy-2022-report-investing-behind-the-new-realities...
YudiSaputra43
 
The Digital Culture Challenge; Bridging the Employee-Leadership Disconnect
Brian Solis
 
unit 1 BC.docx - INTRODUCTION TO BUSINESS COMMUICATION
MANJU N
 
2025 07 29 The Future, Backwards Agile 2025.pdf
Daniel Walsh
 
HOT DAY CAFE , Café Royale isn’t just another coffee shop
PINKY PARLOUR
 
NTE 2025/20: Updated End User Undertaking (EUU) Form and Guidance
RT Consulting Limited
 
Communications Recruiter Melbourne.pptx
ReithGordon
 
How to Protect Your New York Business from the Unexpected
Sam Vohra
 
Creating the Ultimate SOP Manual: Streamline, Standardize, and Scale
RUPAL AGARWAL
 
Ad

Application_of_Deep_Learning_Techniques.pptx

  • 1. Application of Deep Learning Technique for Precise Stock Market Prediction Saikat Mondal, Abhishek Dutta and Piyali Chatterjee School of Computing and Analytics NSHM College of Management and Technology, Kolkata, India. National Conference on Machine Learning and Artificial Intelligence. 1st February, 2020. Lal Bahadur Shastri Institute of Management, Delhi, India.
  • 2. Objective of the work • The primary goal of the paper is to predict stock market values using machine learning techniques to build a robust forecasting model. • Application of deep learning method of LSTM (long short term memory) , to show how deep learning triumphs over machine learning.
  • 3. Outline • Related Work • Methodology • Machine Learning Results – Regression – Classification • LSTM Results • Conclusion
  • 4. Related work • In the field of prediction stock market values , the most primitive approach was the use of simple regression techniques like OLS on the data. • Second, in terms of approach come the traditional econometric methods of time series analysis like ARIMA (auto regressive integrated moving average), Granger causality test, regressive models with distributed lag and quantile Regression for forecasting of the values. • Thirdly we have implementation of modern machine learning and deep learning techniques and Natural Language Processing (NLP).
  • 5. Methodology • We have chosen three companies which have high impact on the market , from three major sectors. These are NSE listed companies namely HDFC Bank, CIPLA and TCS. We have collected the data from the website of NSEIndia. • The data consists of daily index of these three companies over a stretch of six years from 2013-2018, starting from 1st January 2013 to 31st December 2018. • This data has been used to predict the stock market values over a weekly horizon for one year. After the application of the ML and DL models on the 2019 data (the test data), we can figure out how well the predictions have turned out.
  • 6. Methodology • The raw data consists of variables containing information about the daily index of these companies. The variables are namely date, open values, closed values, high values, low values, volume and range. • We have converted these variables into their normalised form using min-max normalisation, to make them suited for use in machine learning models. • The date has been segregated into day, month and year. The other normalised variables are i) open_norm ii) close_norm iii) high_norm iv) low_norm v) volume-norm and vi) range_norm. the close_norm variable is our response variable here while the rest are predictors. • The negative values of the normalized variables indicate that there has been a fall in the value when compared with its previous day, while the positive values indicate that there has been a upward movement.
  • 7. RESULTS The regression results are: Bagging Boosting Random Forest Stock Train Test TCS Cor 0.61 MAPE 115.1 Cor 0.84 MAPE 87.37 CIPLA Cor 0.84 MAPE 68.55 Cor 0.773 MAPE 72.26 HDFC Cor 0.13 MAPE 333.3 Cor 0.88 MAPE 66.11 ANN Stock Train Test TCS Cor 0.97 MAPE 31.48 Cor 0.86 MAPE 64.93 CIPLA Cor 0.97 MAPE 36.39 Cor 0.72 MAPE 94.9 HDFC Cor 0.97 MAPE 35.98 Cor 0.824 MAPE 85.96 Stock Train Test TCS Cor 0.85 MAPE 72.16 Cor 0.81 MAPE 74.11 CIPLA Cor 0.826 MAPE 79.18 Cor 0.72 MAPE 95.21 HDFC Cor 0.83 MAPE 76.58 Cor 0.808 MAPE 88.68 Stock Train Test TCS Cor 0.91 MAPE 55.59 Cor 0.87 MAPE 61.17 CIPLA Cor 0.89 MAPE 62.11 Cor 0.89 MAPE 62.11 HDFC Cor 0.89 MAPE 62.15 Cor 0.89 MAPE 62.15
  • 9. RESULTS The classification results are : Stock Train Test TCS Sensitivity 85.39 Specificity 83.35 PPV 84.73 NPV 84.06 CA 84.41 Sensitivity 80.08 Specificity 80.17 PPV 81.45 NPV 79.48 CA 80.49 CIPLA Sensitivity 79.66 Specificity 83.35 PPV 81.72 NPV 81.43 CA 81.57 Sensitivity 70.00 Specificity 76.15 PPV 71.29 NPV 75.00 CA 73.06 HDFC Sensitivity 82.18 Specificity 79.94 PPV 81.22 NPV 80.95 CA 81.09 Sensitivity 84.55 Specificity 83.05 PPV 83.87 NPV 83.76 CA 83.81 Logistic Regression
  • 10. RESULTS The classification results are : Stock Train Test TCS Sensitivity 82.50 Specificity 87.80 PPV 88.00 NPV 82.20 CA 85.09 Sensitivity 79.23 Specificity 81.88 PPV 82.50 NPV 78.50 CA 80.49 CIPLA Sensitivity 81.40 Specificity 93.40 PPV 92.10 NPV 82.83 CA 82.50 Sensitivity 61.00 Specificity 72.30 PPV 65.30 NPV 69.00 CA 67.50 HDFC Sensitivity 81.66 Specificity 83.56 PPV 83.98 NPV 81.19 CA 82.58 Sensitivity 78.00 Specificity 78.81 PPV 79.33 NPV 77.50 CA 78.42 Bagging
  • 11. RESULTS The classification results are : Stock Train Test TCS Sensitivity 100 Specificity 100 PPV 100 NPV 100 CA 100 Sensitivity 82.90 Specificity 83.90 PPV 85.60 NPV 83.90 CA 83.40 CIPLA Sensitivity 100 Specificity 100 PPV 100 NPV 100 CA 100 Sensitivity 70.29 Specificity 71.94 PPV 64.50 NPV 76.92 CA 71.25 HDFC Sensitivity 100 Specificity 100 PPV 100 NPV 100 CA 100 Sensitivity 81.96 Specificity 80.67 PPV 81.30 NPV 81.35 CA 81.32 Boosting
  • 12. RESULTS The classification results are : Stock Train Test TCS Sensitivity 84.48 Specificity 84.48 PPV 85.73 NPV 84.06 CA 84.41 Sensitivity 60.00 Specificity 89.00 PPV 67.53 NPV 86.20 CA 74.27 CIPLA Sensitivity 79.66 Specificity 83.35 PPV 81.72 NPV 80.73 CA 81.36 Sensitivity 40.00 Specificity 96.15 PPV 89.79 NPV 65.44 CA 70.12 HDFC Sensitivity 44.85 Specificity 60.72 PPV 54.66 NPV 51.05 CA 52.57 Sensitivity 24.39 Specificity 75.42 PPV 50.84 NPV 48.90 CA 49.37 ANN
  • 13. RESULTS The classification results are : Stock Train Test TCS Sensitivity 100.00 Specificity 100.00 PPV 100.00 NPV 100.00 CA 100.00 Sensitivity 83.20 Specificity 81.03 PPV 82.53 NPV 81.73 CA 82.15 CIPLA Sensitivity 100.00 Specificity 100.00 PPV 100.00 NPV 100.00 CA 100.00 Sensitivity 63.63 Specificity 78.46 PPV 71.42 NPV 71.83 CA 71.38 HDFC Sensitivity 100.00 Specificity 100.00 PPV 100.00 NPV 100.00 CA 100.00 Sensitivity 79.67 Specificity 77.11 PPV 78.40 NPV 78.44 CA 78.42 Random Forest
  • 14. RESULTS • Among all the techniques which have produced fairly good results , Boosting and Random Forest produced the best results in almost all metrics (produced best results among all other regression techniques for training data). • While Support Vector Machines produced best results for classification. • For calculating the accuracies, we had to reverse transformed the normalized values by using the formula (RMSE/mean absolute values)%. For calculating the accuracies, we had to reverse transformed the normalized values by using the formula (RMSE/mean absolute values)%.
  • 15. Long Short Term Memory • LSTM - LSTM is a very efficient deep learning method which is a sub branch of RNN (Recurrent Neural Networks). RNN has a feature which LSTM inherits, i.e., it allows back-propagation method simultaneously unlike the multi-level perceptron’s (MLP’s) feed-forward process. • The back propagation helps to resolve the weightage problem (vanishing gradient and exploding gradients) of the nodes and leads us to more impressive results. This is why LSTM is appropriate for time series analysis, handwriting recognition and speech processing. • LSTM architecture consists of many software blocks ,out of which there are basically salient three regulator gates connected by several information channels and a memory cell. These gates of three types i) The input gates ii)The output gate iii) The forget gate.
  • 16. Forecasting using LSTM models  Case 1: LSTM applied on HDFC Bank’s data.  Case 2: LSTM applied on TCS’s data  Case 3: LSTM applied on Cipla’s data. LSTM models built using the 6 years stock price movement from 2013-2018.
  • 17. Methodology  The LSTM model is built using the frameworks Keras and Tensorflow 2.0.0 , with python being the underlying language.  Here in this model ‘ADAM’ optimizer is used and for the loss function ‘MAPE’ is used.  The model has been trained on 1st January 2013 to 31st December 2018 consisting of 1474 samples and validated on 242 samples from 2019. .
  • 18. Results We started with 65 epochs initially. We changed the number of epochs gradually and we finally stopped at 12. The model has converged, for training and validation, which we have not shown here due to time constraint. HDFC BANK
  • 19. Results We started with 55 epochs initially. We changed the number of epochs gradually and we finally stopped at 50. The model has converged, for training and validation. TCS
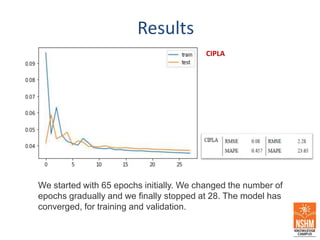
  • 20. Results We started with 65 epochs initially. We changed the number of epochs gradually and we finally stopped at 28. The model has converged, for training and validation. CIPLA
  • 21. CONCLUSION  We have presented several machine learning and deep learning models which can efficiently predict the stock market values of daily index data and use them to forecast on a weekly horizon for one year (2019).  While using machine learning models, we observed that they have produced quite good results for training data in several cases, and also for test cases, especially for Boosting and SVM. However, LSTM have outperformed them all with much higher accuracy levels.  LSTM will perform better if it is provided with larger datasets for training, but with our data sets also it have produced quite good results.  As different techniques of machine and deep learning have produced different performances, as a future scope of work we plan to explore the possibility of fine tuning these models and aim for higher prediction accuracy.
  • 22. References [1] J. Sen and T. Datta Chaudhuri, "An alternative framework for time series decomposition and forecasting and its relevance for portfolio choice - a comparative study of the Indian consumer durable and small cap sector," Journal of Economics Library, vol. 3, no. 2, pp. 303 - 326, 2016. [2] J. Sen and T. Datta Chaudhuri, "Decomposition of time series data of stock markets and its implications for prediction - an application for the Indian auto sector," In Proceedings of the 2nd National Conference on Advances in Business Research and Management Practices(ABRMP'2016), Kolkata, India, pp. 15-28. [3] J. Sen and T. Datta Chaudhuri, "An investigation of the structural characteristics of the Indian IT sector and the capital goods sector – an application of the R programming language in time series decomposition and forecasting," Journal of Insurance and Financial Management, vol. 1, no. 4, pp. 68 - 132, 2016. [4] J. Sen and T. Datta Chaudhuri, "A time series analysis-based forecasting framework for the Indian healthcare sector," Journal of Insurance and Financial Management, vol. 3, no. 1, pp. 66 - 94, 2017. [5] J. Sen and T. Datta Chaudhuri, "A predictive analysis of the Indian FMCG sector using time series decomposition- based approach," Journal of Economics Library, vol. 4, no. 2, pp. 206 - 226, 2017. [6] J. Sen, "A time series analysis-based forecasting approach for the Indian realty sector," International Journal of Applied Economic Studies, vol. 5, no. 4, pp. 8 - 27, 2017.
  • 23. References [7] J. Sen, "A robust analysis and forecasting framework for the Indian mid cap sector using time series decomposition," Journal of Insurance and Financial Management, vol. 3, no. 4, pp. 1- 32, 2017. [8] J. Sen and T. Datta Chaudhuri, "Understanding the sectors of Indian economy for portfolio choice," International Jouranl of Business Forecasting and Marketing Intelligence, vol. 4, no. 2, pp. 178-222. [9]Q. Wu, Y. Che, and Z. Liu, "Ensemble model of intelligent paradigms for stock market forecasting," In Proceedings of the IEEE. [10]1st International Workshop on Knowledge Discovery and Data Mining, Washington DC, USA, pp. 205 – 208, 2008. [11] T. A. Siddiqui and Y. Abdullah, "Developing a nonlinear model to predict stock prices in India: an artificial neural networks approach," IUP Journal of Applied Finance, vol. 21, no. 3, pp. 36 - 39, 2015. [12] NSEIndia website - https://www.nseindia.com/ [13] A. Geron, Hands-on Machine Learning with Scikit-Learn Keras & Tensorflow, O’Reilly Publications, USA, 2019.