Big data Analytics is a process to extract meaningful insight from big such as hidden patterns, unknown correlations, market trends and customer preferences
This document provides an overview of big data. It defines big data as large volumes of diverse data that are growing rapidly and require new techniques to capture, store, distribute, manage, and analyze. The key characteristics of big data are volume, velocity, and variety. Common sources of big data include sensors, mobile devices, social media, and business transactions. Tools like Hadoop and MapReduce are used to store and process big data across distributed systems. Applications of big data include smarter healthcare, traffic control, and personalized marketing. The future of big data is promising with the market expected to grow substantially in the coming years.
The document discusses big data analytics. It begins by defining big data as large datasets that are difficult to capture, store, manage and analyze using traditional database management tools. It notes that big data is characterized by the three V's - volume, variety and velocity. The document then covers topics such as unstructured data, trends in data storage, and examples of big data in industries like digital marketing, finance and healthcare.
Applications of Big Data Analytics in BusinessesT.S. Lim
The document discusses big data and big data analytics. It begins with definitions of big data from various sources that emphasize the large volumes of structured and unstructured data. It then discusses key aspects of big data including the three Vs of volume, variety, and velocity. The document also provides examples of big data applications in various industries. It explains common analytical methods used in big data including linear regression, decision trees, and neural networks. Finally, it discusses popular tools and frameworks for big data analytics.
Big Data Analytics Powerpoint Presentation SlideSlideTeam
If it’s that time to make analysis for the predicament of the management system or simply to present deafening data in front of your qualified team then you have reached the right match. SlideTeam presents you classy and eternally approaching PowerPoint slides for big data analytics. Data analysis agendas and big data plans are shown through captivating icons and subheadings for a precise and interesting approach. This unique PPT slide is useful for studying business and marketing related topics, approaching the correct conclusions and keeping a track on business growth. Make an outstanding presentation for your viewers with this unique PPT slide and deliver your message in an effective manner using Big data analytics Powerpoint Presentation slide and make your pathways more defining. Most of the elements of the slide are highly customizable. The text boxes help you in adding more information about the point mentioned and its associated icon. Every detail in our Big Data Analytics Powerpoint Presentation Slide is doubly cross checked. You can be certain of it's authenticity. https://bit.ly/3fvnRVK
As artificial intelligence (AI) continues to advance at an unprecedented pace, its impact on the job market is becoming increasingly significant. This thought-provoking presentation explores the various ways AI is reshaping industries and transforming traditional job roles. From automation and machine learning to the rise of new professions, this document delves into the opportunities and challenges brought about by AI in the workforce. Gain insights into how individuals and organizations can navigate this evolving landscape and prepare for the future of work.
This document provides an overview of key concepts related to data and big data. It defines data, digital data, and the different types of digital data including unstructured, semi-structured, and structured data. Big data is introduced as the collection of large and complex data sets that are difficult to process using traditional tools. The importance of big data is discussed along with common sources of data and characteristics. Popular tools and technologies for storing, analyzing, and visualizing big data are also outlined.
This document provides a syllabus for a course on big data. The course introduces students to big data concepts like characteristics of data, structured and unstructured data sources, and big data platforms and tools. Students will learn data analysis using R software, big data technologies like Hadoop and MapReduce, mining techniques for frequent patterns and clustering, and analytical frameworks and visualization tools. The goal is for students to be able to identify domains suitable for big data analytics, perform data analysis in R, use Hadoop and MapReduce, apply big data to problems, and suggest ways to use big data to increase business outcomes.
Data analytics involves analyzing data to extract useful information. It is used to identify risks, improve business processes, verify effectiveness, and influence decisions. There are five categories: data analytics of transactions and operations; web analytics of website traffic; social analytics of social media; mobile analytics of device data; and big data analytics. Companies obtain user data from GPS, sensors, and social media to perform analyses that benefit organizations.
This document provides an overview of getting started with data science using Python. It discusses what data science is, why it is in high demand, and the typical skills and backgrounds of data scientists. It then covers popular Python libraries for data science like NumPy, Pandas, Scikit-Learn, TensorFlow, and Keras. Common data science steps are outlined including data gathering, preparation, exploration, model building, validation, and deployment. Example applications and case studies are discussed along with resources for learning including podcasts, websites, communities, books, and TV shows.
This presentation introduces big data and explains how to generate actionable insights using analytics techniques. The deck explains general steps involved in a typical analytics project and provides a brief overview of the most commonly used predictive analytics methods and their business applications.
Vijay Adamapure is a Data Science Enthusiast with extensive experience in the field of data mining, predictive modeling and machine learning. He has worked on numerous analytics projects ranging from healthcare, business analytics, renewable energy to IoT.
Vijay presented these slides during the Internet of Everything Meetup event 'Predictive Analytics - An Overview' that took place on Jan. 9, 2015 in Mumbai. To join the Meetup group, register here: http://bit.ly/1A7T0A1
This presentation briefly explains the following topics:
Why is Data Analytics important?
What is Data Analytics?
Top Data Analytics Tools
How to Become a Data Analyst?
Introduction to various data science. From the very beginning of data science idea, to latest designs, changing trends, technologies what make then to the application that are already in real world use as we of now.
1) The document introduces data science and its core disciplines, including statistics, machine learning, predictive modeling, and database management.
2) It explains that data science uses scientific methods and algorithms to extract knowledge and insights from both structured and unstructured data.
3) The roles of data scientists are discussed, noting that they have skills in programming, statistics, analytics, business analysis, and machine learning.
Big data is large amounts of unstructured data that require new techniques and tools to analyze. Key drivers of big data growth are increased storage capacity, processing power, and data availability. Big data analytics can uncover hidden patterns to provide competitive advantages and better business decisions. Applications include healthcare, homeland security, finance, manufacturing, and retail. The global big data market is expected to grow significantly, with India's market projected to reach $1 billion by 2015. This growth will increase demand for data scientists and analysts to support big data solutions and technologies like Hadoop and NoSQL databases.
The document discusses data science, defining it as a field that employs techniques from many areas like statistics, computer science, and mathematics to understand and analyze real-world phenomena. It explains that data science involves collecting, processing, and analyzing large amounts of data to discover patterns and make predictions. The document also notes that data science is an in-demand field that is expected to continue growing significantly in the coming years.
The document discusses data science and data analytics. It provides definitions of data science, noting it emerged as a discipline to provide insights from large data volumes. It also defines data analytics as the process of analyzing datasets to find insights using algorithms and statistics. Additionally, it discusses components of data science including preprocessing, data modeling, and visualization. It provides examples of data science applications in various domains like personalization, pricing, fraud detection, and smart grids.
This document provides an overview of data science including what is big data and data science, applications of data science, and system infrastructure. It then discusses recommendation systems in more detail, describing them as systems that predict user preferences for items. A case study on recommendation systems follows, outlining collaborative filtering and content-based recommendation algorithms, and diving deeper into collaborative filtering approaches of user-based and item-based filtering. Challenges with collaborative filtering are also noted.
1) Data analytics is the process of examining large data sets to uncover patterns and insights. It involves descriptive, predictive, and prescriptive analysis.
2) Descriptive analysis summarizes past events, predictive analysis forecasts future events, and prescriptive analysis recommends actions.
3) Major companies like Facebook, Amazon, Uber, banks and Spotify extensively use big data and data analytics to improve customer experience, detect fraud, personalize recommendations and gain business insights.
This presentation briefly discusses about the following topics:
Data Analytics Lifecycle
Importance of Data Analytics Lifecycle
Phase 1: Discovery
Phase 2: Data Preparation
Phase 3: Model Planning
Phase 4: Model Building
Phase 5: Communication Results
Phase 6: Operationalize
Data Analytics Lifecycle Example
Big Data may well be the Next Big Thing in the IT world. The first organizations to embrace it were online and startup firms. Firms like Google, eBay, LinkedIn, and Facebook were built around big data from the beginning.
Being able to make data driven decisions is a crucial skill for any company. The requirements are growing tougher - the volume of collected data keeps increasing in orders of magnitude and the insights must be smarter and faster. Come learn more about why data science is important and what challenges the data teams need to face.
Prediction of heart disease using machine learning.pptxkumari36
1. The document discusses using machine learning techniques to predict heart disease by evaluating large datasets to identify patterns that can help predict, prevent, and manage conditions like heart attacks.
2. It proposes using data analytics based on support vector machines and genetic algorithms to diagnose heart disease, claiming genetic algorithms provide the best optimized prediction models.
3. The key modules described are uploading training data, pre-processing the heart disease data, using machine learning to predict heart disease, and generating graphical representations of the analyses.
A Seminar Presentation on Big Data for Students.
Big data refers to a process that is used when traditional data mining and handling techniques cannot uncover the insights and meaning of the underlying data. Data that is unstructured or time sensitive or simply very large cannot be processed by relational database engines. This type of data requires a different processing approach called big data, which uses massive parallelism on readily-available hardware.
Data science uses data to find solutions and predict outcomes. It involves blending mathematics, business knowledge, tools, algorithms, and machine learning techniques to uncover hidden patterns in raw data. This helps with making major business decisions. Data science is used across many industries like manufacturing, e-commerce, banking, transportation, and healthcare for tasks like predicting problems, recommending products, detecting fraud, and discovering drugs. Real-world examples of data science applications include identifying online consumers, monitoring cars, and assisting in entertainment and retail brands.
(1) The document discusses several computer science topics including data science, artificial intelligence, and cloud computing. (2) It notes that data science has grown in popularity from 2012-2017 due to an ability to better process large volumes of data using statistics, specialized hardware, and contributions from companies. (3) Artificial intelligence aims to develop machines that can think and learn like humans, and this field has accelerated in recent years with improved data processing and hardware.
What Is Data Science? | Introduction to Data Science | Data Science For Begin...Simplilearn
This Data Science Presentation will help you in understanding what is Data Science, why we need Data Science, prerequisites for learning Data Science, what does a Data Scientist do, Data Science lifecycle with an example and career opportunities in Data Science domain. You will also learn the differences between Data Science and Business intelligence. The role of a data scientist is one of the sexiest jobs of the century. The demand for data scientists is high, and the number of opportunities for certified data scientists is increasing. Every day, companies are looking out for more and more skilled data scientists and studies show that there is expected to be a continued shortfall in qualified candidates to fill the roles. So, let us dive deep into Data Science and understand what is Data Science all about.
This Data Science Presentation will cover the following topics:
1. Need for Data Science?
2. What is Data Science?
3. Data Science vs Business intelligence
4. Prerequisites for learning Data Science
5. What does a Data scientist do?
6. Data Science life cycle with use case
7. Demand for Data scientists
This Data Science with Python course will establish your mastery of data science and analytics techniques using Python. With this Python for Data Science Course, you’ll learn the essential concepts of Python programming and become an expert in data analytics, machine learning, data visualization, web scraping and natural language processing. Python is a required skill for many data science positions, so jumpstart your career with this interactive, hands-on course.
Why learn Data Science?
Data Scientists are being deployed in all kinds of industries, creating a huge demand for skilled professionals. Data scientist is the pinnacle rank in an analytics organization. Glassdoor has ranked data scientist first in the 25 Best Jobs for 2016, and good data scientists are scarce and in great demand. As a data you will be required to understand the business problem, design the analysis, collect and format the required data, apply algorithms or techniques using the correct tools, and finally make recommendations backed by data.
The Data Science with python is recommended for:
1. Analytics professionals who want to work with Python
2. Software professionals looking to get into the field of analytics
3. IT professionals interested in pursuing a career in analytics
4. Graduates looking to build a career in analytics and data science
5. Experienced professionals who would like to harness data science in their fields
This document provides an overview of big data analytics. It discusses challenges of big data like increased storage needs and handling varied data formats. The document introduces Hadoop and Spark as approaches for processing large, unstructured data at scale. Descriptive and predictive analytics are defined, and a sample use case of sentiment analysis on Twitter data is presented, demonstrating data collection, modeling, and scoring workflows. Finally, the author's skills in areas like Java, Python, SQL, Hadoop, and predictive analytics tools are outlined.
The document discusses cloud computing, big data, and big data analytics. It defines cloud computing as an internet-based technology that provides on-demand access to computing resources and data storage. Big data is described as large and complex datasets that are difficult to process using traditional databases due to their size, variety, and speed of growth. Hadoop is presented as an open-source framework for distributed storage and processing of big data using MapReduce. The document outlines the importance of analyzing big data using descriptive, diagnostic, predictive, and prescriptive analytics to gain insights.
Just finished a basic course on data science (highly recommend it if you wish to explore what data science is all about). Here are my takeaways from the course.
This video will give you an idea about Data science for beginners.
Also explain Data Science Process , Data Science Job Roles , Stages in Data Science Project
This document discusses cloud computing, big data, Hadoop, and data analytics. It begins with an introduction to cloud computing, explaining its benefits like scalability, reliability, and low costs. It then covers big data concepts like the 3 Vs (volume, variety, velocity), Hadoop for processing large datasets, and MapReduce as a programming model. The document also discusses data analytics, describing different types like descriptive, diagnostic, predictive, and prescriptive analytics. It emphasizes that insights from analyzing big data are more valuable than raw data. Finally, it concludes that cloud computing can enhance business efficiency by enabling flexible access to computing resources for tasks like big data analytics.
Data science Nagarajan and madhav.pptxNagarajanG35
This document summarizes a presentation on data science. It includes details about the presenters, date, time and login details for a seminar on data science. It then provides definitions and explanations of key concepts in data science including machine learning, deep learning, statistics and visualization. It describes common data science jobs and roles and lists popular tools used in data science. Finally, it discusses applications of data science and some challenges in the field.
Developed by Google’s Artificial Intelligence division, the Sycamore quantum processor boasts 53 qubits1.
In 2019, it achieved a feat that would take a state-of-the-art supercomputer 10,000 years to accomplish: completing a specific task in just 200 seconds1
This document discusses big data workflows. It begins by defining big data and workflows, noting that workflows are task-oriented processes for decision making. Big data workflows require many servers to run one application, unlike traditional IT workflows which run on one server. The document then covers the 5Vs and 1C characteristics of big data: volume, velocity, variety, variability, veracity, and complexity. It lists software tools for big data platforms, business analytics, databases, data mining, and programming. Challenges of big data are also discussed: dealing with size and variety of data, scalability, analysis, and management issues. Major application areas are listed in private sector domains like retail, banking, manufacturing, and government.
Purpose of this presentation is to highlight how end to end machine learning looks like in real world enterprise. This is to provide insight to aspiring data scientist who have been through courses or education in ML that mostly focus on ML algorithms and not end to end pipeline.
Architecture and components mentioned in Slide 11 will be discussed in detailed in series of post on LinkedIn over the course of next few month
To get updates on this follow me on LinkedIn or search/follow hashtag #end2endDS. Post will be active in August 2019 and will be posted till September 2019
A New Paradigm on Analytic-Driven Information and Automation V2.pdfArmyTrilidiaDevegaSK
The document proposes an end-to-end methodology for developing analytic-driven information and automation systems based on big data, data science, and artificial intelligence. The methodology involves 6 steps: 1) collecting data from multiple sources, 2) preprocessing the data, 3) extracting features from the data, 4) clustering and interpreting the data, 5) designing applications, and 6) implementing and evaluating the systems. It then provides an example of applying this methodology to develop an early warning system for monitoring higher education institutions in Indonesia. The system would collect data from various sources, analyze it using machine learning techniques, predict and prescribe interventions for student groups.
1. Introduction and how to get into Data
2. Data Engineering and skills needed
3. Comparison of Data Analytics for statistic and real time streaming data
4. Bayesian Reasoning for Data
Big Data Analytics: From SQL to Machine Learning and Graph AnalysisYuanyuan Tian
This document discusses big data analytics and different types of analytics that can be performed on big data, including SQL, machine learning, and graph analytics. It provides an overview of various big data analytics systems and techniques for different data types and complexity levels. Integrated analytics that combine multiple types of analytics are also discussed. The key challenges of big data analytics and how different systems address them are covered.
Introduction to Data Analysis Course Notes.pdfGraceOkeke3
"Embark on a journey into data analysis with our Introduction to Data Analysis slides. Uncover the fundamentals and prerequisites for effective analysis, explore types of data, and discover essential tools and methodologies. Equip yourself with the skills to unlock valuable insights.
A presentation covers how data science is connected to build effective machine learning solutions. How to build end to end solutions in Azure ML. How to build, model, and evaluate algorithms in Azure ML.
This document provides an overview of the key concepts in the syllabus for a course on data science and big data. It covers 5 units: 1) an introduction to data science and big data, 2) descriptive analytics using statistics, 3) predictive modeling and machine learning, 4) data analytical frameworks, and 5) data science using Python. Key topics include data types, analytics classifications, statistical analysis techniques, predictive models, Hadoop, NoSQL databases, and Python packages for data science. The goal is to equip students with the skills to work with large and diverse datasets using various data science tools and techniques.
Advanced Analytics and Machine Learning with Data VirtualizationDenodo
Watch: https://bit.ly/2DYsUhD
Advanced data science techniques, like machine learning, have proven an extremely useful tool to derive valuable insights from existing data. Platforms like Spark, and complex libraries for R, Python and Scala put advanced techniques at the fingertips of the data scientists. However, these data scientists spent most of their time looking for the right data and massaging it into a usable format. Data virtualization offers a new alternative to address these issues in a more efficient and agile way.
Attend this webinar and learn:
- How data virtualization can accelerate data acquisition and massaging, providing the data scientist with a powerful tool to complement their practice
- How popular tools from the data science ecosystem: Spark, Python, Zeppelin, Jupyter, etc. integrate with Denodo
- How you can use the Denodo Platform with large data volumes in an efficient way
- How Prologis accelerated their use of Machine Learning with data virtualization
Telangana State, India’s newest state that was carved from the erstwhile state of Andhra
Pradesh in 2014 has launched the Water Grid Scheme named as ‘Mission Bhagiratha (MB)’
to seek a permanent and sustainable solution to the drinking water problem in the state. MB is
designed to provide potable drinking water to every household in their premises through
piped water supply (PWS) by 2018. The vision of the project is to ensure safe and sustainable
piped drinking water supply from surface water sources
By James Francis, CEO of Paradigm Asset Management
In the landscape of urban safety innovation, Mt. Vernon is emerging as a compelling case study for neighboring Westchester County cities. The municipality’s recently launched Public Safety Camera Program not only represents a significant advancement in community protection but also offers valuable insights for New Rochelle and White Plains as they consider their own safety infrastructure enhancements.
Mieke Jans is a Manager at Deloitte Analytics Belgium. She learned about process mining from her PhD supervisor while she was collaborating with a large SAP-using company for her dissertation.
Mieke extended her research topic to investigate the data availability of process mining data in SAP and the new analysis possibilities that emerge from it. It took her 8-9 months to find the right data and prepare it for her process mining analysis. She needed insights from both process owners and IT experts. For example, one person knew exactly how the procurement process took place at the front end of SAP, and another person helped her with the structure of the SAP-tables. She then combined the knowledge of these different persons.
This comprehensive Data Science course is designed to equip learners with the essential skills and knowledge required to analyze, interpret, and visualize complex data. Covering both theoretical concepts and practical applications, the course introduces tools and techniques used in the data science field, such as Python programming, data wrangling, statistical analysis, machine learning, and data visualization.
computer organization and assembly language : its about types of programming language along with variable and array description..https://www.nfciet.edu.pk/
2. ABOUT ME
Currently work in Telkomsel as senior data analyst
8 years professional experience with 4 years in big data
and predictive analytics field in telecommunication
industry
Bachelor from Computer Science, Gadjah Mada
University & get master degree from Magister of
Information Technology, Universitas Indonesia
Lecturer in Muhammadiyah Jakarta University
https://id.linkedin.com/pub/ghulam-imaduddin/32/a21/507
[email protected]
3. WHAT’S IN THIS SLIDE
[BIG] DATA ANALYTICS
Intro & Data Trends
Challenges
Tech Approach
Big Data Tools
Type of Analytics
Tools
Analytics Lifecycle
Use Cases (Sentiment Analysis)
What’s Trending
Where to Start
Methodology
4. THE WORLD OF DATA
Source: http://www.cision.com/us/2012/10/big-data-and-big-analytics/
5. DATA VS BIG DATA
Big data is just data with:
More volume
Faster data generation (velocity)
Multiple data format (variety)
World's data volume to grow 40% per year
& 50 times by 2020 [1]
Data coming from various human & machine
activity
[1] http://e27.co/worlds-data-volume-to-grow-40-per-year-50-times-by-2020-aureus-20150115-2/
6. CHALLENGES
More data = more storage space
More storage = more money to spend (RDBMS server needs very costly
storage)
Data coming faster
Speed up data processing or we’ll have backlog
Needs to handle various data structure
How do we put JSON data format in standard RDBMS?
Hey, we also have XML format from other sources
Other system give us compressed data in gzip format
Agile business requirement.
On initial discussion, they only need 10 information, now they ask for 25? Can
we do that? We only put that 10 in our database
Our standard ETL process can’t handle this
7. STORAGE COST
In Terms of storage cost, Hadoop has lower comparing to standard
RDBMS.
Hadoop provides highly scalable storage and process with fraction of
the EDW Cost
8. STORAGE & COMPUTE
TOGETHER
The Hadoop WayThe Old Way
• Hard to scale
• Network is a bottleneck
• Only handles relational data
• Difficult to add new fields & data types
Expensive, Special purpose, “Reliable” Servers
Expensive Licensed Software
Network
Data Storage
(SAN, NAS)
Compute
(RDBMS, EDW)
• Scales out forever
• No bottlenecks
• Easy to ingest any data
• Agile data access
Commodity “Unreliable” Servers
Hybrid Open Source Software
Compute
(CPU)
Memory Storage
(Disk)
z
z
Source: Cloudera Presentation Deck by Amr Awadallah
9. MAP REDUCE APPROACH
Process data in parallel way using distributed algorithm on a cluster
Map procedure performs filtering and sorting data locally
Reduce procedure performs a summary operation (count, sum,
average, etc.)
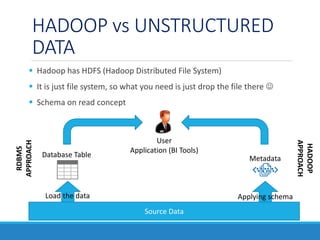
10. HADOOP vs UNSTRUCTURED
DATA
Hadoop has HDFS (Hadoop Distributed File System)
It is just file system, so what you need is just drop the file there
Schema on read concept
Source Data
Database Table
Load the data
Metadata
Applying schema
User
Application (BI Tools)
RDBMS
APPROACH
HADOOP
APPROACH
11. HIVE
The Apache Hive ™ data warehouse software facilitates querying and
managing large datasets residing in distributed storage.
With Hive you can write the schema for the data in HDFS
Hive provide many library that enable you to read various data type
like XML, JSON, or even compressed format
You can create your own data parser with Java language
Hive support SQL language to read from your data
Hive will convert your SQL into Java MapReduce code, and run it in
cluster
12. Apache spark is fast and general engine for large-scale data processing
Run programs up to 100x faster than Hadoop MapReduce in memory,
or 10x faster on disk
You can write spark application in Java, Scala, Python, or R
Spark support library to run SQL, streaming, and complex analysis like
graph computation and machine learning
https://spark.apache.org/
14. ANALYTICS IS IN YOUR BLOOD
Do you realize that you do analytics everyday?
I need to go to campus faster!
Hmm.. Looking at the sky today, I think it’ll be rain
Based on my mid term and assignment score, I need to get at least 80
in my final exam to pass this course
I stalked her social media. I think she is single because most of her
post only about food :p
15. DESCRIPTIVE & PREDICTIVE
Descriptive statistics is the term given to the analysis of data that helps
describe, show or summarize data in a meaningful way such that, for
example, patterns might emerge from the data.
In Information System Design course, most of the student get C grade (11
people). There is 4 people get A, 7 get B, 7 get D, and 7 get E
Fulan only post his activity on Facebook at weekend
Predictive analytics is the branch of data mining concerned with the
prediction of future probabilities and trends.
The central element of predictive analytics is the predictor, a variable
that can be measured for an individual or other entity to predict future
behavior.
Fulan should be has a job. Because he always left home at 7 in the morning
and get back at 6 afternoon
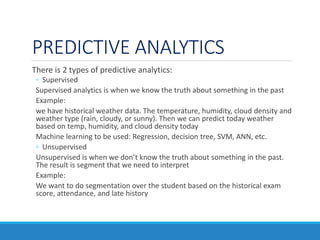
16. PREDICTIVE ANALYTICS
There is 2 types of predictive analytics:
◦ Supervised
Supervised analytics is when we know the truth about something in the past
Example:
we have historical weather data. The temperature, humidity, cloud density and
weather type (rain, cloudy, or sunny). Then we can predict today weather
based on temp, humidity, and cloud density today
Machine learning to be used: Regression, decision tree, SVM, ANN, etc.
◦ Unsupervised
Unsupervised is when we don’t know the truth about something in the past.
The result is segment that we need to interpret
Example:
We want to do segmentation over the student based on the historical exam
score, attendance, and late history
17. APPLYING THE CONTEXTSource
Raw&unstructured
Location
Socmed data,
Complaint,
Survey
URL access CDRDevice info
IMEI
&
TAC
Point Of Interest, sentiment library, socmed buzzer, website category
ContextDerived
Information
Commute pattern
Hangout location
Idols
Political view
Pain point
Community leader
Family member
Communication spending
18. ANALYTICS LIFECYCLE
- Defining target variable
- Splitting data for training and
validating the model
- Defining analysis time frame
for training and validation
- Correlation analysis and
variable selection
- Selecting right data mining
algorithm
- Do validation by measuring
accuracy, sensitivity, and
model lift
- Data mining and modeling is
an iterative process
Data
Mining
& Modeling
- Define variables to
support hypothesis
- Cleaning &
transforming the data
- Create longitudinal
data/trend data
- Ingesting additional
data if needed
- Build analytical data
mart
- Gathering problem
information
- Defining the goal to
solve the problem
- Defining expected
output
- Defining hypothesis
- Defining analysis
methodology
- Measuring the
business value
Data
Understanding
Business
Understanding
19. ANALYTICS LIFECYCLE
- Create monitoring
process for model
evaluation
- Evaluate the model
based on real-world
result
- Monitor and evaluate
the business impact
Model
Monitoring
- Define the model scoring
period
- Integrate model result
with execution system
(campaign system, CRM,
etc)
- Create operational
process that timely,
consistent, and efficient
Model
Operationalization
- Describe the importance
of each variable
- Visualize overall model
by creating decision tree
for example
- Define business action
based on the model
result
Model
Interpretation
Analytics and modeling is an iterative process. Data model will become
obsolete and need to evolve to accommodate changes in behavior
20. BUILDING THE
METHODOLOGY
Analysis Domain
• What is the analysis domain? Is it for male only? Is it for housewife or worker? Your
“customer” segment has different behavior
Type of Analysis
• Do we need only descriptive analysis? Or we need to go with predictive analysis?
Supervised or Unsupervised?
• Do we need to build unsupervised clustering/segmentation for this analysis?
Define Analysis Time Window
• What time window of data we need for behavior observation?
• What is the prediction time window?
• Is there any seasonal event on that time window?
21. ANALYTICS TOOLS
Microsoft Excel. Very powerful tools to do statistical data manipulation, pivoting, even doing
simple prediction
SQL is just the language. Your data lying in database? SQL will help to filter, aggregate and
extract your data
RapidMiner provide built-in RDBMS connector, parser for common data format (csv, xml),
data manipulation, and many machine learning algorithm. We can also create our own library.
Latest version of RapidMiner can connect to Hadoop and do more complex analysis like text
mining. Free version is available (community edition)
KNIME. Known as a powerful tools to do predictive analytics. Overall function is similar to
RapidMiner. Latest version of KNIME can connect to Hadoop and do more complex analysis
such as text mining. Free version is available
Tableau is one of the famous tools to build visualization on top of the data. Tableau also
powerful to create interactive dashboard. Free version is available with some limitation
QlikView. Similar to Tableau, QlikView designed to enable data analyst to develop a
dashboard or just simple visualization on top of the data. Free version is available
23. BACKGROUND
Objective
Measuring customer sentiment over big tree telecommunication provider in
Indonesia (Telkomsel, XL, Indosat)
Metric
Measuring NPS (Net Promotor Score) for each operator using twitter data.
NPS calculated as percentage of positive tweets minus percentage of
negative tweets.
Putra, B. P. (2015). Analisis Sentimen Layanan Telekomunikasi pada Pengguna Media Sosial Twitter. Jakarta: Universitas Indonesia
24. WORKFLOW
- Generate word vector
using machine
learning algorithm
based on training
dataset
- Using SVM and C4.5
- The result is 2
different model
- Select the best model
by comparing the
accuracy
Data
Modeling
- Deduplication
- Convert to lower case
- Tokenization
- Filter stop word
Data
Preparation
- Label some sample
for training dataset
- This part done with
crowdsourcing
Data
Labeling
- Create twitter crawler
with python and
twitter API
- Run the crawler with
selected keyword,
parse, and store to
RDBMS
- Collection for tweet
generated in April
2015
Data
Collection
25. WORKFLOW
- Aggregate scoring
result by telco
provider to get count
of positive tweets
and negative tweets
- Calculate the NPS for
each telco provider
- Visualize the result as
a bar chart
NPS
Calculation
- Using best model,
score the rest dataset
- Scoring result is a
label
(positive/negative/
neutral) for each
tweet
Data
Scoring
26. DATA COLLECTION
We run the crawler 3 times, one time for each operator. We only
search tweets containing some keywords
Parse the json result using json parser library embedded in python 2.7,
form it as CSV (comma separated value)
Load the csv into database (we use MySQL in this experiment)
• Telepon
• SMS
• Internet
• Jaringan
• Telkomsel
• Indosat
• XL
27. DATA LABELING
The objective is to build the ground truth
Using crowdsourcing approach. We build online questionnaire and ask
people to define each tweets if it is negative, positive, or neutral
We label 100 tweets by ourselves as a validated tweets for
questionnaire validation
We put 20 tweets for each questionnaire. 5 tweets for Indosat, 5 for
XL, 5 for Telkomsel, and the rest 5 is random validated tweets
If 4 out of 5 validated tweets answered correctly, then we flag a
questionnaire as a valid questionnaire
This approach used to eliminate the answer submitted by people who
do it randomly
28. DATA PREPARATION
Deduplication process is to remove duplicated tweets
Tokenization is a process to split a sentence into words. This should be
done because the model will generate the word vector instead of
sentence.
29. DATA PREPARATION
Filtering stop words. We eliminate non useful word (word that doesn’t
reflect to positive or negative means)
30. TOOLS USED
Data preparation modeling done with RapidMiner software
RapidMiner has text analysis function and procedure. We can found
procedure to do tokenize, convert case, deduplication, and filter stop
word
RapidMiner also has SVM and C4.5 algorithm to do modeling
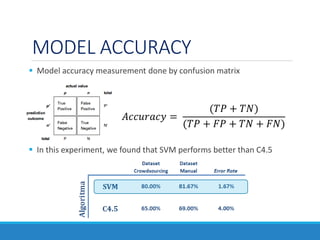
31. MODEL ACCURACY
Model accuracy measurement done by confusion matrix
In this experiment, we found that SVM performs better than C4.5
𝐴𝑐𝑐𝑢𝑟𝑎𝑐𝑦 =
(𝑇𝑃 + 𝑇𝑁)
(𝑇𝑃 + 𝐹𝑃 + 𝑇𝑁 + 𝐹𝑁)
32. NPS Result
After we do aggregation for scored dataset, we found that Indosat has
higher NPS than the others.
Telco % Promoters % Detractors NPS
Indosat 37% 14% 23%
Telkomsel 30% 27% 3%
XL 19% 37% -18%
34. BACKGROUND
This is the demonstration how to use Apache Spark to extract some
information from twitter data
Twitter data collected with some crawler made with python language,
and store as it is (JSON formatted data)
35. DATA EXPLORATION
Load JSON data to memory
val tweets = sqlContext.jsonFile("/user/flume/tweets/2015/09/01/*/*")
Looking the data schema, and select useful field only
tweets.printSchema
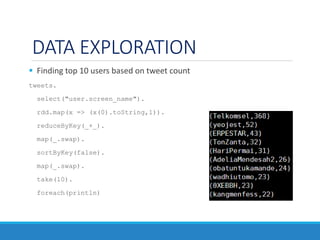
36. DATA EXPLORATION
Finding top 10 users based on tweet count
tweets.
select("user.screen_name").
rdd.map(x => (x(0).toString,1)).
reduceByKey(_+_).
map(_.swap).
sortByKey(false).
map(_.swap).
take(10).
foreach(println)
37. DATA EXPLORATION
Finding top words
tweets.select("text").rdd.
flatMap(x => x(0).toString.toLowerCase.
split(“[^A-Za-z0-9]+")).
map(x => (x,1)).
filter(x => x._1.length >= 3).
reduceByKey(_+_).
map(_.swap).
sortByKey(false).
map(_.swap).
take(20).foreach(println)
38. DATA EXPLORATION
Finding top words with stop word exclusion
val stop_words = sc.textFile("/user/ghulam/stopwords.txt")
val bc_stop = sc.broadcast(stop_words.collect)
tweets.select("text").rdd.
flatMap(x => x(0).toString.toLowerCase.split("[^A-Za-z0-9]+")).
map(x => (x,1)).
filter(x => x._1.length > 3 & !bc_stop.value.contains(x._1)).
reduceByKey(_+_).
map(_.swap).sortByKey(false).map(_.swap).
take(20).foreach(println)
39. DATA EXPLORATION
Words Chain (Market Basket Analysis)
import org.apache.spark.mllib.fpm.FPGrowth
val stop_words = sc.broadcast(sc.textFile("/user/hadoop-
user/ghulam/stopwords.txt").collect)
val tweets = sqlContext.jsonFile("/user/flume/tweets/2015/09/01/*/*")
val trx = tweets.select("text").rdd.
filter(!_(0).toString.toLowerCase.contains("ini 20 finalis aplikasi")).
filter(!_(0).toString.toLowerCase.contains("telkomsel jaring 20 devel")).
filter(!_(0).toString.toLowerCase.contains("[jual")).
filter(!_(0).toString.toLowerCase.contains("lelang acc")).
filter(!_(0).toString.toLowerCase.matches(".*theme.*line.*")).
filter(!_(0).toString.toLowerCase.matches(".*fol.*back.*")).
filter(!_(0).toString.toLowerCase.matches(".*favorite.*digital.*")).
filter(!_(0).toString.toLowerCase.startsWith("rt @")).
map(x => x(0).toString.toLowerCase.split("[^A-Za-z0-9]+").filter(x =>
x.length > 3 & !stop_words.value.contains(x)).distinct)
val fpg = new FPGrowth().setMinSupport(0.01).setNumPartitions(10)
val model = fpg.run(trx)
model.freqItemsets.filter(x => x.items.length >= 3).take(20).foreach {
itemset =>
println(itemset.items.mkString("[", ",", "]") + ", " + itemset.freq)
}
47. SKILLS NEEDED
Business Acumen
In terms of data science, being able to discern which problems are
important to solve for the business is critical, in addition to identifying
new ways the business should be leveraging its data.
Python, Scala, and SQL
SQL skills is a must! Python and Scala also become a common language to
do data processing, along with Java, Perl, or C/C++
Hadoop Platform
It is heavily preferred in many cases. Having experience with Hive or Pig is
also a strong selling point. Familiarity with cloud tools such as Amazon S3
can also be beneficial.
SAS or R or other predictive analytics tools
In-depth knowledge of at least one of these analytical tools, for data
science R is generally preferred. Along with this, statistical knowledge also
important
48. SKILLS NEEDED
Intellectual curiosity
Curiosity to dig deeper into data and solving a problem by finding a
root cause of it
Communication & Presentation
Companies searching for a strong data scientist are looking for
someone who can clearly and fluently translate their technical findings
to a non-technical team. A data scientist must enable the business to
make decisions by arming them with quantified insights
Summarized from http://www.kdnuggets.com/2014/11/9-must-have-skills-data-scientist.html
49. [BIG] DATA SOURCES
Social media platform. Most of social media provided some API to
fetch the data from there. Twitter and Facebook is the most common
example
KDNuggets (http://www.kdnuggets.com/datasets/index.html)
Kaggle (https://www.kaggle.com/)
Portal Data Indonesia (http://data.go.id/)
Your WhatsApp group conversation