


Ad
More Related Content
Similar to Big data Analytics Unit - CCS334 Syllabus (20)
Recently uploaded (20)


Ad
Big data Analytics Unit - CCS334 Syllabus
- 2. Unit I-UNDERSTANDING BIG DATA • Introduction to big data – convergence of key trends – unstructured data – industry examples of big data – web analytics – big data applications– big data technologies – introduction to Hadoop –open source technologies – cloud and big data – mobile business intelligence – Crowd sourcing analytics – inter and trans firewall analytics
- 3. What is Big Data Analytics • Big data analytics refers to the systematic processing and analysis of large amounts of data and complex data sets, known as big data, to extract valuable insights. • Big data analytics allows for the uncovering of trends, patterns and correlations in large amounts of raw data to help analysts make data-informed decisions. • This process allows organizations to leverage the exponentially growing data generated from diverse sources, including internet-of-things (IoT) sensors, social media, financial transactions and smart devices to derive actionable intelligence through advanced analytic techniques.
- 4. Differences between big data and traditional data • The main difference between big data analytics and traditional data analytics is the type of data handled and the tools used to analyze it. Traditional analytics deals with structured data, typically stored in relational databases. • This type of database helps ensure that data is well- organized and easy for a computer to understand. • Traditional data analytics relies on statistical methods and tools like structured query language (SQL) for querying database
- 5. Differences between big data and traditional data • Big data analytics involves massive amounts of data in various formats, including structured, semi-structured and unstructured data. • The complexity of this data requires more sophisticated analysis techniques. • Big data analytics employs advanced techniques like machine learning and data mining to extract information from complex data sets. • It often requires distributed processing systems like Hadoop to manage the sheer volume of data.
- 6. Data analysis methods • Predictive modeling by incorporating artificial intelligence (AI) and statistical algorithms • Statistical analysis for in-depth data exploration and to uncover hidden patterns • What-if analysis to simulate different scenarios and explore potential outcomes • Processing diverse data sets, including structured, semi- structured and unstructured data from various sources.
- 7. Data analysis methods • Descriptive analytics • The "what happened" stage of data analysis. Here, the focus is on summarizing and describing past data to understand its basic characteristics. • Diagnostic analytics • The “why it happened” stage. By delving deep into the data, diagnostic analysis identifies the root patterns and trends observed in descriptive analytics. • Predictive analytics • The “what will happen” stage. It uses historical data, statistical modeling and machine learning to forecast trends. • Prescriptive analytics • Describes the “what to do” stage, which goes beyond prediction to provide recommendations for optimizing future actions based on insights derived from all previous.
- 8. The 3 V's of big data analytics
- 9. The five V's of big data analytics • Volume • The sheer volume of data generated today, from social media feeds, IoT devices, transaction records and more, presents a significant challenge. • Traditional data storage and processing solutions are often inadequate to handle this scale efficiently. • Big data technologies and cloud-based storage solutions enable organizations to store and manage these vast data sets cost-effectively, protecting valuable data from being discarded due to storage limitations.
- 10. The five V's of big data analytics Velocity • Data is being produced at unprecedented speeds, from real- time social media updates to high-frequency stock trading records. • The velocity at which data flows into organizations requires robust processing capabilities to capture, process and deliver accurate analysis in near real-time. • Stream processing frameworks and in-memory data processing are designed to handle these rapid data streams and balance supply with demand.
- 11. The five V's of big data analytics • Variety Today's data comes in many formats, from structured to numeric data in traditional databases to unstructured text, video and images from diverse sources like social media and video surveillance. This variety demands flexible data management systems to handle and integrate disparate data types for comprehensive analysis. NoSQL databases, data lakes and schema-on-read technologies provide the necessary flexibility to accommodate the diverse nature of big data. • .
- 12. The five V's of big data analytics Varacity • Data reliability and accuracy are critical, as decisions based on inaccurate or incomplete data can lead to negative outcomes. • Veracity refers to the data's trustworthiness, encompassing data quality, noise and anomaly detection issues. Techniques and tools for data cleaning, validation and verification are integral to ensuring the integrity of big data, enabling organizations to make better decisions based on reliable information
- 13. The five V's of big data analytics • Value Big data analytics aims to extract actionable insights that offer tangible value. This involves turning vast data sets into meaningful information that can inform strategic decisions, uncover new opportunities and drive innovation. Advanced analytics, machine learning and AI are key to unlocking the value contained within big data, transforming raw data into strategic assets.
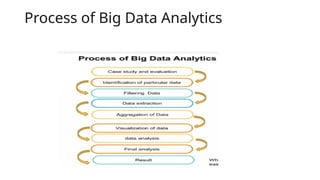
- 14. Process of Big Data Analytics
- 15. Process of Big Data Analytics • Process data: After being collected, data must be systematically organized, extracted, transformed and then loaded into a storage system to ensure accurate analytical outcomes. • Processing involves converting raw data into a format that is usable for analysis, which might involve aggregating data from different sources, converting data types or organizing data into structure formats. Given the exponential growth of available data, this stage can be challenging. • Processing strategies may vary between batch processing, which handles large data volumes over extended periods and stream processing, which deals with smaller real-time data batches.
- 16. Process of Big Data Analytics • Clean data: Regardless of size, data must be cleaned to ensure quality and relevance. • Cleaning data involves formatting it correctly, removing duplicates and eliminating irrelevant entries. Clean data prevents the corruption of output and safeguard’s reliability and accuracy.
- 17. Process of Big Data Analytics • Analyze data: Advanced analytics, such as data mining, predictive analytics, machine learning and deep learning, are employed to sift through the processed and cleaned data. • These methods allow users to discover patterns, relationships and trends within the data, providing a solid foundation for informed decision-making.
- 18. Types of big data Structured data • Structured data refers to highly organized information that is easily searchable and typically stored in relational databases or spreadsheets. It adheres to a rigid schema, meaning each data element is clearly defined and accessible in a fixed field within a record or file. Examples of structured data include: • Customer names and addresses in a customer relationship management (CRM) system • Transactional data in financial records, such as sales figures and account balances • Employee data in human resources databases, including job titles and salaries • Structured data's main advantage is its simplicity for entry, search and analysis, often using straightforward database queries like SQL. However, the rapidly expanding universe of big data means that structured data represents a relatively small portion of the total data available to organizations.
- 19. Structured data
- 20. Unstructured Data • Unstructured data lacks a pre-defined data model, making it more difficult to collect, process and analyze. It comprises the majority of data generated today, and includes formats such as: • Textual content from documents, emails and social media posts • Multimedia content, including images, audio files and videos • Data from IoT devices, which can include a mix of sensor data, log files and time-series data • The primary challenge with unstructured data is its complexity and lack of uniformity, requiring more sophisticated methods for indexing, searching and analyzing. NLP, machine learning and advanced analytics platforms are often employed to extract meaningful insights from unstructured data
- 22. Semi-structured data • Semi-structured data occupies the middle ground between structured and unstructured data. While it does not reside in a relational database, it contains tags or other markers to separate semantic elements and enforce hierarchies of records and fields within the data. Examples include: • JSON (JavaScript Object Notation) and XML (eXtensible Markup Language) files, which are commonly used for web data interchange • Email, where the data has a standardized format (e.g., headers, subject, body) but the content within each section is unstructured • NoSQL databases, can store and manage semi-structured data more efficiently than traditional relational databases • Semi-structured data is more flexible than structured data but easier to analyze than unstructured data, providing a balance that is particularly useful in web applications and data integration tasks.
- 24. The benefits of using Big data analytics • Real-time intelligence • Better-informed decisions • Cost savings • Better customer engagement • Optimized risk management strategies
- 25. Tools used in Big data Analytics
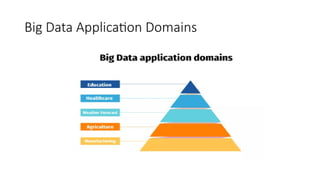
- 26. Big Data Application Domains