BOXPLOT EXAMPLES in R And An Example for BEESWARM:
Download as DOCX, PDF1 like673 views

This document provides examples of using R code to create boxplots and beeswarm plots from sample datasets. It includes: 1) Code to create a basic boxplot of ozone levels from the airquality dataset and customize aspects like colors, labels, and orientation. 2) Examples demonstrating how to create multiple boxplots for comparison and boxplots using other datasets with different numbers of variables. 3) Code for a beeswarm plot showing three groups of random data with different underlying distributions, customized with colors and labels.


![5-install.packages("GGally")
ds = read.csv("http://www.math.smith.edu/r/data/help.csv")
> ds$sex = as.factor(ifelse(ds$female==1, "female", "male"))
> ds$housing = as.factor(ifelse(ds$homeless==1, "homeless", "housed"))
> smallds = subset(ds, select=c("housing", "sex", "i1", "cesd"))
library(GGally)
> ggpairs(smallds, diag=list(continuous="density", discrete="bar"), axisLab
els="show") #1.graph
>ggpairs(ds, columns=c("housing", "sex", "i1", "cesd"),
+ diag=list(continuous="density", discrete="bar"), axisLabels="sh
ow") [#2.graph]
1.graph](https://image.slidesharecdn.com/rgraf-160621140802/85/BOXPLOT-EXAMPLES-in-R-And-An-Example-for-BEESWARM-9-320.jpg)


![Some R Examples[R table and Graphics] -Advanced Data Visualization in R (Some...](https://cdn.slidesharecdn.com/ss_thumbnails/exampless-160922204223-thumbnail.jpg?width=560&fit=bounds)


Ad
More Related Content
What's hot (18)
Similar to BOXPLOT EXAMPLES in R And An Example for BEESWARM: (20)


Ad
More from Dr. Volkan OBAN (20)


Ad
Recently uploaded (20)


BOXPLOT EXAMPLES in R And An Example for BEESWARM:
- 1. Preparedby Volkan OBAN BOXPLOT EXAMPLES in R AND BEESWARM:
- 2. CODES: 1-str(airquality) 'data.frame': 153 obs. of 6 variables: $ Ozone : int 41 36 12 18 NA 28 23 19 8 NA ... $ Solar.R: int 190 118 149 313 NA NA 299 99 19 194 ... $ Wind : num 7.4 8 12.6 11.5 14.3 14.9 8.6 13.8 20.1 8.6 ... $ Temp : int 67 72 74 62 56 66 65 59 61 69 ... $ Month : int 5 5 5 5 5 5 5 5 5 5 ... $ Day : int 1 2 3 4 5 6 7 8 9 10 ... > boxplot(airquality$Ozone) > boxplot(airquality$Ozone, + main="Mean ozone in parts per billion at Roosevelt Island", + xlab="Parts Per Billion", + ylab="Ozone", + col="orange", + border="brown", + horizontal=TRUE, + notch=TRUE + ) > ozone <- airquality$Ozone > temp <- airquality$Temp > ozone_norm <- rnorm(200,mean=mean(ozone, na.rm=TRUE), sd=sd(ozone, na.rm= TRUE)) > temp_norm <- rnorm(200,mean=mean(temp, na.rm=TRUE), sd=sd(temp, na.rm=TRU E)) > boxplot(ozone, ozone_norm, temp, temp_norm, + main="Multiple boxplots for comparision", + at=c(1,2,4,5), + names=c("ozone", "normal", "temp", "normal"), + las=2, + col=c("orange","red"), + border="brown", + horizontal=TRUE, + notch=TRUE)
- 6. Example: 2-qplot(class, hwy, fill=factor(year), data=mpg, geom="boxplot", position ="dodge")+theme_bw()
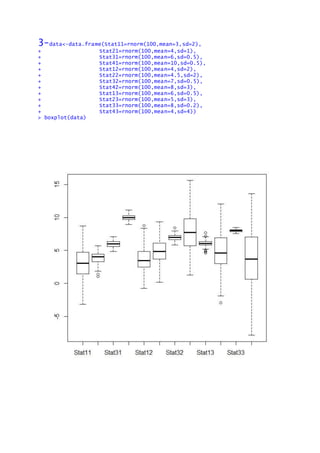
- 7. 3-data<-data.frame(Stat11=rnorm(100,mean=3,sd=2), + Stat21=rnorm(100,mean=4,sd=1), + Stat31=rnorm(100,mean=6,sd=0.5), + Stat41=rnorm(100,mean=10,sd=0.5), + Stat12=rnorm(100,mean=4,sd=2), + Stat22=rnorm(100,mean=4.5,sd=2), + Stat32=rnorm(100,mean=7,sd=0.5), + Stat42=rnorm(100,mean=8,sd=3), + Stat13=rnorm(100,mean=6,sd=0.5), + Stat23=rnorm(100,mean=5,sd=3), + Stat33=rnorm(100,mean=8,sd=0.2), + Stat43=rnorm(100,mean=4,sd=4)) > boxplot(data)
- 8. 4-> library(ggplot2) > a <- runif(10) > b <- runif(12) > c <- runif(7) > d <- runif(15) > group <- factor(rep(1:4, c(10, 12, 7, 15))) > mydata <- data.frame(c(a,b,c,d), group) > names(mydata) <- c("value", "group") > min.mean.sd.max <- function(x) { + r <- c(min(x), mean(x) - sd(x), mean(x), mean(x) + sd(x), max(x)) + names(r) <- c("ymin", "lower", "middle", "upper", "ymax") + r + } > p1 <- ggplot(aes(y = value, x = factor(group)), data = mydata) > p1 <- p1 + stat_summary(fun.data = min.mean.sd.max, geom = "boxplot") + g eom_jitter(position=position_jitter(width=.2), size=3) + ggtitle("Boxplot c on media, 95%CI, valore min. e max.") + xlab("Gruppi") + ylab("Valori") > p1
- 9. 5-install.packages("GGally") ds = read.csv("http://www.math.smith.edu/r/data/help.csv") > ds$sex = as.factor(ifelse(ds$female==1, "female", "male")) > ds$housing = as.factor(ifelse(ds$homeless==1, "homeless", "housed")) > smallds = subset(ds, select=c("housing", "sex", "i1", "cesd")) library(GGally) > ggpairs(smallds, diag=list(continuous="density", discrete="bar"), axisLab els="show") #1.graph >ggpairs(ds, columns=c("housing", "sex", "i1", "cesd"), + diag=list(continuous="density", discrete="bar"), axisLabels="sh ow") [#2.graph] 1.graph
- 10. Secondgraph
- 11. 6- uData <- rnorm(20) > vData <- rnorm(20,mean=5) > wData <- uData + 2*vData + rnorm(20,sd=0.5) > xData <- -2*uData+rnorm(20,sd=0.1) > yData <- 3*vData+rnorm(20,sd=2.5) > d <- data.frame(u=uData,v=vData,w=wData,x=xData,y=yData) > pairs(d)
- 12. 7- library(ggplot2) > > # Plot Skeleton > p <- ggplot(diamonds, aes(x=factor(color), y=carat)) > > # Boxplot of diamond carat as a function of diamond color > p + geom_boxplot()
- 13. LAST EXAMPLE: install.packages("beeswarm") #data set.seed(1234) bimodal <- c(rnorm(250, -2, 0.6), rnorm(250, 2, 0.6)) uniform <- runif(500, -4, 4) normal <- rnorm(500, 0, 1.5) dataf <- data.frame (group = rep(c("bimodal","uniform", "normal"), each = 500), xv = c(bimodal, uniform, normal), cg = rep( c("A","B"), 750)) require(beeswarm) beeswarm(xv ~ group, data = dataf,method = 'swarm', pch = 16, pwcol = as.numeric(cg), xlab = '', ylab = 'xv', labels = c('bimodal', 'uniform', 'normal'))