SlideShare a Scribd company logo
Applications Manager
Building the right Website Monitoring Strategy
2. Optimizing individual URLs for better user
experience
4. Detect unauthorized content changes in
your website
AGENDA
1. Track key metrics of Apache, IIS, NginX,
Nginx Plus.
3. Simulate web transactions with synthetic
monitoring
• Web applications served from an
application server
• Database servers or data stores
WEBSITE MODEL OVERVIEW
1. WEB SERVERS AND THE REVERSE PROXY: APACHE, IIS, NGINX,
ETC.
Web Server Monitoring All You Should
Know
WHY WEB SERVER MONITORING IMPORTANT?
Poor Web server performance
Performance bottlenecks in Apache web server cause
websites to load web pages (HTML, CSS, rich-snippets)
slower
Web server running out of capacity
Inability to see the number of web server requests and
traffic spikes to the website makes server capacity
management difficult
Supported component failure
Poor performance of the associated IT infrastructure
(Operating system, DBs VMs)
Helps track the popularity and growth of websites
Traffic and connection metrics offer direct insights into
site activity thus helps admin to develop plans for
website scaling
SUPPORTED WEB SERVERS
Web servers are responsible for loading and delivering web pages to the end user. In order to make sure
your websites and web servers are always available, webserver monitoring is crucial.
APACHE WEBSERVER MONITORING: GETTING STARTED
Apache Web Server is an open-source web server creation, deployment and management
software to host websites.
DISCOVERING YOUR APACHE SERVER
Application
availability
Error count
Request
Rate
Application &
Server CPU
• Response time
• Request details
• Busy Servers
• Bytes transferred
• Availability
KEY PERFORMANCE INDICATORS OF APACHE
Apache server monitoring empowers users to ensure low latency and continuous availability by tracking the
amount of load the Apache workers weigh in on the CPU round the clock.
Apache Request Details
This metric is specifically used to measure the server performance. Used in combination with other metrics,
it can be used to determine how the server performs under different loads.
BUSY SERVERS
Measures the amount of information being transferred in and out of the server. This metric can be used as
an indicator of server performance, relative to constraints such as network infrastructure.
IIS SERVER MONITORING
DISCOVERING YOUR IIS SERVER
Application
availability
Error count
Request
Rate
Application &
Server CPU
• Response time
• Application pools
• Website statistics
• Worker Process
• Availability
KEY PERFORMANCE INDICATORS OF IIS
Applications Manager helps in proactively monitoring the IIS web server. It connects to the IIS server and
checks for the availability, response time, website stats and status of the various web applications in the
pool at regular intervals of time.
IIS WEBSITE STATISTICS
Applications Manager helps you in being proactive to deliver a superior user experience by keeping tabs on the
key website stats like availability, response time, bytes and files transferred per second, connection statistics,
etc.
DRILL DOWN APPROACH TO WEBSITE STATISTICS
Monitors the bytes and files transferred per second in your website. Tracking if it is beyond the capacity is
necessary as this gives a picture of how fast your website is responding.
ESTIMATE THE USERS ON YOUR WEBSITE
IIS APPLICATION POOLS & WORKER PROCESS
Application pool allows one to isolate the web applications deployed in IIS for better security, availability,
performance and to keep it running without impacting others.
NGINX MONITORING
Nginx is a popular open source high-performance web server for larger web setups. It is known for its rich feature
set, simple configuration, and low resource consumption.
DISCOVERING YOUR NGINX SERVER
Application
availability
Error count
Request
Rate
Application &
Server CPU
• Response time
• Active connections
• Requests per second
• Requests in various states
• Availability
KEY PERFORMANCE INDICATORS OF NGINX
MONITOR NGINX ACTIVE CLIENT REQUESTS IN VARIOUS
STATE
Monitor how many client requests your servers are receiving and how those requests are being processed.
• NGINX Plus is a software load balancer, web server, and content cache built on top of open source NGINX.
• API model should be enabled in Nginx Plus for monitoring
https://docs.nginx.com/nginx/admin-guide/monitoring/live-
activity-monitoring/#configuring-the-api
NGINX Plus
NginxPlus Functioning
• Nginx Server
• Server Zones (Virtual Servers to route the
request, return specific error code, rewrite
URI)
• Upstream Zones (Clusters) -> Upstream
Servers (Load balancing pool of servers)
Different load balancing method used to pick a
server and allocate request. By default Round
Robin
METRICS MONITORED IN APM
Overview
• Overall Connection stats
• SSL Connection
• HTTP Connection
HTTP & TCP SERVER/UPSTREAM
ZONES
• Incoming Traffic
• Discarded requests
• Response Code Splitup
• Outgoing traffic
METRICS MONITORED IN APM
HTTP & TCP Upstream Server
• Response Time
• Throughput
• Health (Checks Failed &
Status)
Caches
• Hit Ratio
• Cache Size
• Responses Read (Valid &
Expired) Responses Written
2. OPTIMIZING INDIVIDUAL URLS FOR BETTER USER EXPERIENCE
Website Monitoring
HTTP URL Monitor
 Average and
current response
time
 Response time
split up:
 DNS time
 Connection time
 First byte time
 Last byte time
WHY URL SEQUENCE MONITORING REQUIRED?
 Site is not reachable due to too many
people accessing it simultaneously
 Clicking on the page leads to HTTP 500
internal server error
Slow Loading Page?
WEB TRANSACTION RECORDER FOR URL SEQUENCE AND
RBM
HTTP URL SEQUENCE Monitor
• Capture errors, network
requests, page load details and
other metrics in your web
applications
• Set up end user monitoring
agents in branch facilities to
check the availability and
performance of your distributed
applications
3. SYNTHETIC TRANSACTIONS MONITORING FOR DYNAMIC
WEBPAGES
UNDERSTANDING THE END USER JOURNEY
INSTALLING EUM AGENTS IN YOUR BRANCH OFFICES OR
CUSTOMER LOCATIONS
REAL BROWSER MONITORING
Mimic User Interaction
Monitor the Real Website
performance around the world
Reduce blame game between
application and network team
• Launch the web
transaction recorder
• Enter the host and SSL
port of Applications
Manager
• Enter the Applications
Manager credentials and
proceed with the
recording
RECORDING A WEB SCRIPT
MONITOR CRITICAL WORKFLOWS
DEEPER VISIBILITY INTO MULTISTEP USER INTERACTIONS
• Use our EUM agent to understand global application performance through easy to use graphs and
charts. Determine if performance is excellent, good, moderate, poor or bad when accessed from
different countries.
Measure web application performance across
globe
OPTIMIZE FRONT END WEB COMPONENTS
• It depicts the series of actions that occur between a user and a server until a Web page is displayed
in a end user’s browser.
FIND NETWORK LATENCY USING THE WATERFALL MODEL
APPROACH
• Playback scripts including
screen, keyboard, and
mouse interactions
performed by users
• Meet SLAs by ensuring
accurate performance of
your web applications from
all geographical locations
THE NEED FOR SYNTHETIC TRANSACTION MONITORING
4. WEBSITE CONTENT MONITORING TO DETECT UNAUTHORIZED
CHANGES
Prevent unauthorized Modifications
Protect your website from hackers
Rapid discovery of quality issues, outages
WEBSITE DEFACEMENT
 Website
defacement refers
to unauthorized
hacks on your web
page or entire
website
 Negate any impact
on search engine
page rank and
traffic due to web
page defacement.
ADDING A WEBSITE CONTENT MONITORING
LIST OF WEBSITES MONITORED
MONITORS WEBSITE HACKS USING STANDARD CHECKS
 Scan your entire
web page for
hacked links and
other quality
issues
 Identify changes
in HTML
elements - 'href'
or 'src'attributes
Contact : eval-apm@manageengine.com
Online Demo : demo.appmanager.com
1. Webserver monitoring in a nutshell
2. Optimize website performance to deliver better user experience
3. Synthetic transaction monitoring for modern webpages
4. Preventing unauthorized website hacks
QUICK RECAP:
Contact : eval-apm@manageengine.com
Online Demo : demo.appmanager.com

More Related Content

What's hot (20)

PPTX
Mule Anypoint API Gateway
rkulandaivel
 
PPTX
Real Time Communication APIs workshop, Elyran Kogan, Liveperson
Alan Quayle
 
PPTX
Netmera - Multi-channel Customer Engagement Platform
Ahmet Başaran
 
PPTX
Real time web applications with signal r
Elad Avneri
 
PDF
2600Hz - Telecom Rating and Limits
2600Hz
 
PDF
Web Services allied with RPA
Aditya Sharma
 
PDF
Provider Hosted Apps - cross domain library - SharePoint
David J Rosenthal
 
PDF
Provider hosted apps - acs
David J Rosenthal
 
PDF
What we have learned about API scaling throughout Messente's international SM...
MobileMonday Estonia
 
PPT
Policy Based Approach To Runtime Governace
Michiel.Kemperman
 
PPTX
Webinar: Embracing REST APIs through APPSeCONNECT
APPSeCONNECT
 
PPTX
SAP License Audit Report
AuditBot SAP Security Audit
 
PPTX
Server Monitoring 101
Shovon Paulinus Rozario
 
PDF
BNA Income Tax Planner Web Product Features from Bloomberg BNA
Bloomberg Tax & Accounting
 
PPTX
Cloud applications monitoring in digital transformation era
ManageEngine, Zoho Corporation
 
PDF
Adventures in Serverless Backends
MobileMonday Estonia
 
PDF
Need For Speed: How to Deliver Faster, Safer Websites
Rachel Wandishin
 
PPTX
Building Realtime Web Applications With ASP.NET SignalR
Shravan Kumar Kasagoni
 
PPTX
Test first
Ryan Riley
 
PPTX
Introduction to REST - API
Chetan Gadodia
 
Mule Anypoint API Gateway
rkulandaivel
 
Real Time Communication APIs workshop, Elyran Kogan, Liveperson
Alan Quayle
 
Netmera - Multi-channel Customer Engagement Platform
Ahmet Başaran
 
Real time web applications with signal r
Elad Avneri
 
2600Hz - Telecom Rating and Limits
2600Hz
 
Web Services allied with RPA
Aditya Sharma
 
Provider Hosted Apps - cross domain library - SharePoint
David J Rosenthal
 
Provider hosted apps - acs
David J Rosenthal
 
What we have learned about API scaling throughout Messente's international SM...
MobileMonday Estonia
 
Policy Based Approach To Runtime Governace
Michiel.Kemperman
 
Webinar: Embracing REST APIs through APPSeCONNECT
APPSeCONNECT
 
SAP License Audit Report
AuditBot SAP Security Audit
 
Server Monitoring 101
Shovon Paulinus Rozario
 
BNA Income Tax Planner Web Product Features from Bloomberg BNA
Bloomberg Tax & Accounting
 
Cloud applications monitoring in digital transformation era
ManageEngine, Zoho Corporation
 
Adventures in Serverless Backends
MobileMonday Estonia
 
Need For Speed: How to Deliver Faster, Safer Websites
Rachel Wandishin
 
Building Realtime Web Applications With ASP.NET SignalR
Shravan Kumar Kasagoni
 
Test first
Ryan Riley
 
Introduction to REST - API
Chetan Gadodia
 

Similar to Building the right website monitoring strategy (20)

PPTX
implementing the right website monitoring strategy
ManageEngine, Zoho Corporation
 
PPTX
Improving end user experience using ManageEngine Applications Manager
ManageEngine, Zoho Corporation
 
PPTX
How Applications Manager helps with application performance monitoring
ManageEngine, Zoho Corporation
 
PPTX
Optimize application performance - Mumbai Seminar
ManageEngine, Zoho Corporation
 
PPTX
StatsCraft 2015: Introduction to monitoring - Yoav Abrahami and Mark Sonis
StatsCraft
 
PPTX
Applications Manager Technical Overview
ManageEngine, Zoho Corporation
 
PPTX
Add Apache Web Server to your Unified Monitoring Toolkit
AppDynamics
 
PPTX
Improving User Experience with Applications Manager
ManageEngine, Zoho Corporation
 
PDF
Osmius: Monitoring Made Easy
osmius
 
PPTX
Are Your Mission Critical Applications Really Performing?
ManageEngine
 
PPTX
Overview of ManageEngine Applications Manager
ManageEngine Applications Manager
 
PDF
Multi Layer Monitoring V1
Lahav Savir
 
PPT
Simple, effective 'Synthetic End-User Experience Monitoring' with ManageEngin...
ManageEngine
 
PPTX
How to optimize your website for mobile devices and multiple browsers
Fred Dilkes
 
PPTX
The Business Justification for APM
Jonah Kowall
 
PPTX
My Application is Slow | Best Practices for Troubleshooting and Prevention
eG Innovations
 
PPTX
Server Monitoring from the Cloud
Site24x7
 
PPT
AlertSite Slideshow for the Booth at Web 2.0 Expo 2009
AlertSite
 
PPT
AlertSite Slideshow at Web 2.0 Expo 2009
AlertSite
 
PPTX
Monitoring and Managing Java Applications
Alois Reitbauer
 
implementing the right website monitoring strategy
ManageEngine, Zoho Corporation
 
Improving end user experience using ManageEngine Applications Manager
ManageEngine, Zoho Corporation
 
How Applications Manager helps with application performance monitoring
ManageEngine, Zoho Corporation
 
Optimize application performance - Mumbai Seminar
ManageEngine, Zoho Corporation
 
StatsCraft 2015: Introduction to monitoring - Yoav Abrahami and Mark Sonis
StatsCraft
 
Applications Manager Technical Overview
ManageEngine, Zoho Corporation
 
Add Apache Web Server to your Unified Monitoring Toolkit
AppDynamics
 
Improving User Experience with Applications Manager
ManageEngine, Zoho Corporation
 
Osmius: Monitoring Made Easy
osmius
 
Are Your Mission Critical Applications Really Performing?
ManageEngine
 
Overview of ManageEngine Applications Manager
ManageEngine Applications Manager
 
Multi Layer Monitoring V1
Lahav Savir
 
Simple, effective 'Synthetic End-User Experience Monitoring' with ManageEngin...
ManageEngine
 
How to optimize your website for mobile devices and multiple browsers
Fred Dilkes
 
The Business Justification for APM
Jonah Kowall
 
My Application is Slow | Best Practices for Troubleshooting and Prevention
eG Innovations
 
Server Monitoring from the Cloud
Site24x7
 
AlertSite Slideshow for the Booth at Web 2.0 Expo 2009
AlertSite
 
AlertSite Slideshow at Web 2.0 Expo 2009
AlertSite
 
Monitoring and Managing Java Applications
Alois Reitbauer
 
Ad

More from ManageEngine, Zoho Corporation (20)

PDF
From web interface to database: Monitor what matters
ManageEngine, Zoho Corporation
 
PDF
NetFlow Analyzer Free Training Series Part I - May 2020
ManageEngine, Zoho Corporation
 
PDF
Overcome real-time server and VM monitoring challenges
ManageEngine, Zoho Corporation
 
PDF
Free NetFlow Analyzer training Season 1 Part 2 - Feb 2020
ManageEngine, Zoho Corporation
 
PPTX
From web interface to the database:Monitor all that matters
ManageEngine, Zoho Corporation
 
PDF
NetFlow Analyzer Training Season 1 Part 1 - Feb 2020 - EST
ManageEngine, Zoho Corporation
 
PDF
NetFlow Analyzer Training Season 1 Part 1 - Feb 2020 - GMT
ManageEngine, Zoho Corporation
 
PDF
NetFlow Analyzer Product Overview
ManageEngine, Zoho Corporation
 
PPTX
Monitoring cloud applications and hyperconverged infrastructure
ManageEngine, Zoho Corporation
 
PPTX
Unlock the value of your big data infrastructure
ManageEngine, Zoho Corporation
 
PPTX
Key to optimal end user experience
ManageEngine, Zoho Corporation
 
PPTX
Monitoring cloud applications and containers
ManageEngine, Zoho Corporation
 
PPTX
Big data and non relational database
ManageEngine, Zoho Corporation
 
PPTX
Free OpManager training Part 4 - Monitoring Network Performance and Network Maps
ManageEngine, Zoho Corporation
 
PPTX
Free OpManager training Part 3 - Monitoring Network Performance and Network Maps
ManageEngine, Zoho Corporation
 
PPTX
Free OpManager training Part 2 Monitoring Server Performance- season#3
ManageEngine, Zoho Corporation
 
PPTX
Free OpManager training Part1- Discovery and classification season#3
ManageEngine, Zoho Corporation
 
PPTX
OpUtils Free training
ManageEngine, Zoho Corporation
 
PPTX
Closing the door on application performance problems
ManageEngine, Zoho Corporation
 
PPTX
Database performance monitoring:Key to seamless application performance
ManageEngine, Zoho Corporation
 
From web interface to database: Monitor what matters
ManageEngine, Zoho Corporation
 
NetFlow Analyzer Free Training Series Part I - May 2020
ManageEngine, Zoho Corporation
 
Overcome real-time server and VM monitoring challenges
ManageEngine, Zoho Corporation
 
Free NetFlow Analyzer training Season 1 Part 2 - Feb 2020
ManageEngine, Zoho Corporation
 
From web interface to the database:Monitor all that matters
ManageEngine, Zoho Corporation
 
NetFlow Analyzer Training Season 1 Part 1 - Feb 2020 - EST
ManageEngine, Zoho Corporation
 
NetFlow Analyzer Training Season 1 Part 1 - Feb 2020 - GMT
ManageEngine, Zoho Corporation
 
NetFlow Analyzer Product Overview
ManageEngine, Zoho Corporation
 
Monitoring cloud applications and hyperconverged infrastructure
ManageEngine, Zoho Corporation
 
Unlock the value of your big data infrastructure
ManageEngine, Zoho Corporation
 
Key to optimal end user experience
ManageEngine, Zoho Corporation
 
Monitoring cloud applications and containers
ManageEngine, Zoho Corporation
 
Big data and non relational database
ManageEngine, Zoho Corporation
 
Free OpManager training Part 4 - Monitoring Network Performance and Network Maps
ManageEngine, Zoho Corporation
 
Free OpManager training Part 3 - Monitoring Network Performance and Network Maps
ManageEngine, Zoho Corporation
 
Free OpManager training Part 2 Monitoring Server Performance- season#3
ManageEngine, Zoho Corporation
 
Free OpManager training Part1- Discovery and classification season#3
ManageEngine, Zoho Corporation
 
OpUtils Free training
ManageEngine, Zoho Corporation
 
Closing the door on application performance problems
ManageEngine, Zoho Corporation
 
Database performance monitoring:Key to seamless application performance
ManageEngine, Zoho Corporation
 
Ad

Recently uploaded (20)

PPTX
MARTSIA: A Tool for Confidential Data Exchange via Public Blockchain - Poster...
Michele Kryston
 
PDF
TrustArc Webinar - Navigating APAC Data Privacy Laws: Compliance & Challenges
TrustArc
 
PDF
🚀 Let’s Build Our First Slack Workflow! 🔧.pdf
SanjeetMishra29
 
PDF
Hello I'm "AI" Your New _________________
Dr. Tathagat Varma
 
PPTX
Wondershare Filmora Crack Free Download 2025
josanj305
 
PDF
Bridging CAD, IBM TRIRIGA & GIS with FME: The Portland Public Schools Case
Safe Software
 
PPTX
Reimaginando la Ciberdefensa: De Copilots a Redes de Agentes
Cristian Garcia G.
 
PDF
Optimizing the trajectory of a wheel loader working in short loading cycles
Reno Filla
 
PDF
Simplify Your FME Flow Setup: Fault-Tolerant Deployment Made Easy with Packer...
Safe Software
 
PDF
ICONIQ State of AI Report 2025 - The Builder's Playbook
Razin Mustafiz
 
PDF
How to Visualize the ​Spatio-Temporal Data Using CesiumJS​
SANGHEE SHIN
 
PDF
Kubernetes - Architecture & Components.pdf
geethak285
 
PPTX
2025 HackRedCon Cyber Career Paths.pptx Scott Stanton
Scott Stanton
 
PDF
Darley - FIRST Copenhagen Lightning Talk (2025-06-26) Epochalypse 2038 - Time...
treyka
 
PDF
Quantum Threats Are Closer Than You Think – Act Now to Stay Secure
WSO2
 
PDF
Understanding AI Optimization AIO, LLMO, and GEO
CoDigital
 
PPTX
Enabling the Digital Artisan – keynote at ICOCI 2025
Alan Dix
 
PDF
GDG Cloud Southlake #44: Eyal Bukchin: Tightening the Kubernetes Feedback Loo...
James Anderson
 
PDF
Why aren't you using FME Flow's CPU Time?
Safe Software
 
PDF
DoS Attack vs DDoS Attack_ The Silent Wars of the Internet.pdf
CyberPro Magazine
 
MARTSIA: A Tool for Confidential Data Exchange via Public Blockchain - Poster...
Michele Kryston
 
TrustArc Webinar - Navigating APAC Data Privacy Laws: Compliance & Challenges
TrustArc
 
🚀 Let’s Build Our First Slack Workflow! 🔧.pdf
SanjeetMishra29
 
Hello I'm "AI" Your New _________________
Dr. Tathagat Varma
 
Wondershare Filmora Crack Free Download 2025
josanj305
 
Bridging CAD, IBM TRIRIGA & GIS with FME: The Portland Public Schools Case
Safe Software
 
Reimaginando la Ciberdefensa: De Copilots a Redes de Agentes
Cristian Garcia G.
 
Optimizing the trajectory of a wheel loader working in short loading cycles
Reno Filla
 
Simplify Your FME Flow Setup: Fault-Tolerant Deployment Made Easy with Packer...
Safe Software
 
ICONIQ State of AI Report 2025 - The Builder's Playbook
Razin Mustafiz
 
How to Visualize the ​Spatio-Temporal Data Using CesiumJS​
SANGHEE SHIN
 
Kubernetes - Architecture & Components.pdf
geethak285
 
2025 HackRedCon Cyber Career Paths.pptx Scott Stanton
Scott Stanton
 
Darley - FIRST Copenhagen Lightning Talk (2025-06-26) Epochalypse 2038 - Time...
treyka
 
Quantum Threats Are Closer Than You Think – Act Now to Stay Secure
WSO2
 
Understanding AI Optimization AIO, LLMO, and GEO
CoDigital
 
Enabling the Digital Artisan – keynote at ICOCI 2025
Alan Dix
 
GDG Cloud Southlake #44: Eyal Bukchin: Tightening the Kubernetes Feedback Loo...
James Anderson
 
Why aren't you using FME Flow's CPU Time?
Safe Software
 
DoS Attack vs DDoS Attack_ The Silent Wars of the Internet.pdf
CyberPro Magazine
 

Building the right website monitoring strategy

  • 1. Applications Manager Building the right Website Monitoring Strategy
  • 2. 2. Optimizing individual URLs for better user experience 4. Detect unauthorized content changes in your website AGENDA 1. Track key metrics of Apache, IIS, NginX, Nginx Plus. 3. Simulate web transactions with synthetic monitoring
  • 3. • Web applications served from an application server • Database servers or data stores WEBSITE MODEL OVERVIEW
  • 4. 1. WEB SERVERS AND THE REVERSE PROXY: APACHE, IIS, NGINX, ETC. Web Server Monitoring All You Should Know
  • 5. WHY WEB SERVER MONITORING IMPORTANT? Poor Web server performance Performance bottlenecks in Apache web server cause websites to load web pages (HTML, CSS, rich-snippets) slower Web server running out of capacity Inability to see the number of web server requests and traffic spikes to the website makes server capacity management difficult Supported component failure Poor performance of the associated IT infrastructure (Operating system, DBs VMs) Helps track the popularity and growth of websites Traffic and connection metrics offer direct insights into site activity thus helps admin to develop plans for website scaling
  • 6. SUPPORTED WEB SERVERS Web servers are responsible for loading and delivering web pages to the end user. In order to make sure your websites and web servers are always available, webserver monitoring is crucial.
  • 7. APACHE WEBSERVER MONITORING: GETTING STARTED Apache Web Server is an open-source web server creation, deployment and management software to host websites.
  • 8. DISCOVERING YOUR APACHE SERVER Application availability Error count Request Rate Application & Server CPU
  • 9. • Response time • Request details • Busy Servers • Bytes transferred • Availability KEY PERFORMANCE INDICATORS OF APACHE Apache server monitoring empowers users to ensure low latency and continuous availability by tracking the amount of load the Apache workers weigh in on the CPU round the clock.
  • 10. Apache Request Details This metric is specifically used to measure the server performance. Used in combination with other metrics, it can be used to determine how the server performs under different loads.
  • 11. BUSY SERVERS Measures the amount of information being transferred in and out of the server. This metric can be used as an indicator of server performance, relative to constraints such as network infrastructure.
  • 13. DISCOVERING YOUR IIS SERVER Application availability Error count Request Rate Application & Server CPU
  • 14. • Response time • Application pools • Website statistics • Worker Process • Availability KEY PERFORMANCE INDICATORS OF IIS Applications Manager helps in proactively monitoring the IIS web server. It connects to the IIS server and checks for the availability, response time, website stats and status of the various web applications in the pool at regular intervals of time.
  • 15. IIS WEBSITE STATISTICS Applications Manager helps you in being proactive to deliver a superior user experience by keeping tabs on the key website stats like availability, response time, bytes and files transferred per second, connection statistics, etc.
  • 16. DRILL DOWN APPROACH TO WEBSITE STATISTICS Monitors the bytes and files transferred per second in your website. Tracking if it is beyond the capacity is necessary as this gives a picture of how fast your website is responding.
  • 17. ESTIMATE THE USERS ON YOUR WEBSITE
  • 18. IIS APPLICATION POOLS & WORKER PROCESS Application pool allows one to isolate the web applications deployed in IIS for better security, availability, performance and to keep it running without impacting others.
  • 19. NGINX MONITORING Nginx is a popular open source high-performance web server for larger web setups. It is known for its rich feature set, simple configuration, and low resource consumption.
  • 20. DISCOVERING YOUR NGINX SERVER Application availability Error count Request Rate Application & Server CPU
  • 21. • Response time • Active connections • Requests per second • Requests in various states • Availability KEY PERFORMANCE INDICATORS OF NGINX
  • 22. MONITOR NGINX ACTIVE CLIENT REQUESTS IN VARIOUS STATE Monitor how many client requests your servers are receiving and how those requests are being processed.
  • 23. • NGINX Plus is a software load balancer, web server, and content cache built on top of open source NGINX. • API model should be enabled in Nginx Plus for monitoring https://docs.nginx.com/nginx/admin-guide/monitoring/live- activity-monitoring/#configuring-the-api NGINX Plus
  • 24. NginxPlus Functioning • Nginx Server • Server Zones (Virtual Servers to route the request, return specific error code, rewrite URI) • Upstream Zones (Clusters) -> Upstream Servers (Load balancing pool of servers) Different load balancing method used to pick a server and allocate request. By default Round Robin
  • 25. METRICS MONITORED IN APM Overview • Overall Connection stats • SSL Connection • HTTP Connection HTTP & TCP SERVER/UPSTREAM ZONES • Incoming Traffic • Discarded requests • Response Code Splitup • Outgoing traffic
  • 26. METRICS MONITORED IN APM HTTP & TCP Upstream Server • Response Time • Throughput • Health (Checks Failed & Status) Caches • Hit Ratio • Cache Size • Responses Read (Valid & Expired) Responses Written
  • 27. 2. OPTIMIZING INDIVIDUAL URLS FOR BETTER USER EXPERIENCE Website Monitoring
  • 28. HTTP URL Monitor  Average and current response time  Response time split up:  DNS time  Connection time  First byte time  Last byte time
  • 29. WHY URL SEQUENCE MONITORING REQUIRED?  Site is not reachable due to too many people accessing it simultaneously  Clicking on the page leads to HTTP 500 internal server error Slow Loading Page?
  • 30. WEB TRANSACTION RECORDER FOR URL SEQUENCE AND RBM
  • 31. HTTP URL SEQUENCE Monitor
  • 32. • Capture errors, network requests, page load details and other metrics in your web applications • Set up end user monitoring agents in branch facilities to check the availability and performance of your distributed applications 3. SYNTHETIC TRANSACTIONS MONITORING FOR DYNAMIC WEBPAGES
  • 33. UNDERSTANDING THE END USER JOURNEY
  • 34. INSTALLING EUM AGENTS IN YOUR BRANCH OFFICES OR CUSTOMER LOCATIONS
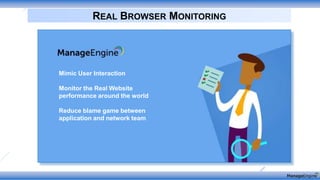
  • 35. REAL BROWSER MONITORING Mimic User Interaction Monitor the Real Website performance around the world Reduce blame game between application and network team
  • 36. • Launch the web transaction recorder • Enter the host and SSL port of Applications Manager • Enter the Applications Manager credentials and proceed with the recording RECORDING A WEB SCRIPT
  • 38. DEEPER VISIBILITY INTO MULTISTEP USER INTERACTIONS
  • 39. • Use our EUM agent to understand global application performance through easy to use graphs and charts. Determine if performance is excellent, good, moderate, poor or bad when accessed from different countries. Measure web application performance across globe
  • 40. OPTIMIZE FRONT END WEB COMPONENTS
  • 41. • It depicts the series of actions that occur between a user and a server until a Web page is displayed in a end user’s browser. FIND NETWORK LATENCY USING THE WATERFALL MODEL APPROACH
  • 42. • Playback scripts including screen, keyboard, and mouse interactions performed by users • Meet SLAs by ensuring accurate performance of your web applications from all geographical locations THE NEED FOR SYNTHETIC TRANSACTION MONITORING
  • 43. 4. WEBSITE CONTENT MONITORING TO DETECT UNAUTHORIZED CHANGES Prevent unauthorized Modifications Protect your website from hackers Rapid discovery of quality issues, outages
  • 44. WEBSITE DEFACEMENT  Website defacement refers to unauthorized hacks on your web page or entire website  Negate any impact on search engine page rank and traffic due to web page defacement.
  • 45. ADDING A WEBSITE CONTENT MONITORING
  • 46. LIST OF WEBSITES MONITORED
  • 47. MONITORS WEBSITE HACKS USING STANDARD CHECKS  Scan your entire web page for hacked links and other quality issues  Identify changes in HTML elements - 'href' or 'src'attributes
  • 48. Contact : [email protected] Online Demo : demo.appmanager.com 1. Webserver monitoring in a nutshell 2. Optimize website performance to deliver better user experience 3. Synthetic transaction monitoring for modern webpages 4. Preventing unauthorized website hacks QUICK RECAP:
  • 49. Contact : [email protected] Online Demo : demo.appmanager.com