SlideShare a Scribd company logo
On a Budget Using the Cloud
CASE STUDY: VISUALIZING COMPLEX DATA
IN TABLEAU
• Introduction
• Harnessing Complex Data in Tableau
• Using Cloud Power on a Budget
• Real World Solution: Stop Meeting Like This
• Demo
• Solution and Recommendations
Agenda
Copyright 2016 Senturus, Inc. All Rights Reserved.
Presenters
Mike Weinhauer
Tableau Practice Director
Senturus, Inc.
Jim Pelichowski
Tableau Solutions Architect
Senturus, Inc.
Alia Santini
Principal Consultant
Stop Meeting Like This
Copyright 2016 Senturus, Inc. All Rights Reserved.
Free Resources: www.senturus.com
RESOURCE LIBRARY
An extensive, free library of past webinars,
demonstrations, whitepapers, presentations, helpful
hints, and more.
Copyright 2016 Senturus, Inc. All Rights Reserved.
To hear the recording from this webinar: Case Study:
Visualizing Complex Data in Tableau, visit our website
at:
www.senturus.com/resources/how-to-visualize-
complex-data-in-tableau/
While you are there, you can also view and download
this deck.
Hear the Recording
Copyright 2016 Senturus, Inc. All Rights Reserved.
WHO WE ARE
• Dashboards, Reporting &
Visualizations
• Data Preparation & Data Warehouses
• Self-Service Business Intelligence (BI)
• Big Data & Advanced Analytics
• Enterprise Planning Systems
Focused on Business Analytics
Copyright 2016 Senturus, Inc. All Rights Reserved.
Business
Requirements
Analysis
Ready
Data
DASHBOARDS
VISUALIZATIONS
AND REPORTING
DECISIONS
&ACTIONS
We Bridge the Gap Between
Data and Decision Making
Copyright 2016 Senturus, Inc. All Rights Reserved.
900+ Clients, 2000+ Projects, 16+ Years
Copyright 2016 Senturus, Inc. All Rights Reserved.
CASE STUDY: VISUALIZING COMPLEX DATA
IN TABLEAU
ON A BUDGET USING THE CLOUD
• When the sales and marketing falls short
• Examples of challenging data with irregular structure
– Social media
– Email
– Survey
Getting Tableau to Work with Complex Data
Copyright 2016 Senturus, Inc. All Rights Reserved.
• We know Tableau can leverage Hadoop, Redshift…
• What if I don’t have that infrastructure/knowledge?
• A viable option: outsource IT expertise on the Cloud
– No need to add internal IT staff
– Get industrial strength performance similar to having your
own data center
– Secure
Big Data on a Budget
Copyright 2016 Senturus, Inc. All Rights Reserved.
AN INTRODUCTION TO:
STOP MEETING LIKE THIS
To hear the recording from this webinar, visit our
website. While you are there, you can also view and
download this deck at:
www.senturus.com/resources/how-to-visualize-
complex-data-in-tableau/
The Senturus comprehensive library of recorded
webinars, demos, white papers, presentations, and case
studies is available on our website at:
www.senturus.com/resources/
Hear the Recording
Copyright 2016 Senturus, Inc. All Rights Reserved.
Why Stop Meeting Like This Exists
Copyright 2016 Senturus, Inc. All Rights Reserved.
The Scope of the Problem
We believe the way that large organizations
get work done is no longer working
Meetings CollaborationEmail
Stop Meeting Like This is as much a movement as it is a set of
tools, practices, and capabilities to help leaders reset
the norm for how organizations use their time.
Copyright 2016 Senturus, Inc. All Rights Reserved.
Different Points of View on How to Address
the Problem
THE BIG NEW THING IN MEETINGS? “WALK AND TALK”
MEETINGS: TO HAVE OR NOT TO HAVE...THAT IS THE QUESTION
NEWS FLASH: MEETINGS SHOULD NEVER BE LONGER THAN 15 MINUTES
CHAIR-FREE MEETINGS: A HOT NEW TREND
THE MODERN MEETING IS DEAD
Copyright 2016 Senturus, Inc. All Rights Reserved.
The Opportunity For How to Fix It
White
Space
Asynchronous
Collaboration
Awesome
Meetings
Copyright 2016 Senturus, Inc. All Rights Reserved.
Outsource survey results database
architecture to Senturus
Develop the end product with our
Senturus architect so that the
work is shared
Store data in the Cloud and use
survey tools that already exist
Use Tableau for data visualization
Build something repeatable that can
scale with us as we grow
A Challenge We Faced Internally
We are a startup with limited resources…
… and to top it all off, do so on a budget!
….and basic technical expertise...
… who wanted to display survey results in
interesting ways that weren't time consuming…
… and develop a database as we go…
Copyright 2016 Senturus, Inc. All Rights Reserved.
Tableau Visualization – Likert Survey Questions
Copyright 2016 Senturus, Inc. All Rights Reserved.
Getting There: A Closer Look at Survey Data
What does this data look like from the source?
Copyright 2016 Senturus, Inc. All Rights Reserved.
• Column headings confusing or missing
• Columns that should be rows (needs pivoting)
• Multiple header rows
• Open text responses
– Unstructured with no common width
• Null or empty values
Challenges Using Complex Data
Copyright 2016 Senturus, Inc. All Rights Reserved.
Tableau Works Much Better With Data Like This
Copyright 2016 Senturus, Inc. All Rights Reserved.
What About Complex Data?
Copyright 2016 Senturus, Inc. All Rights Reserved.
Solution – Data Architecture
Source: Raw Data
Transform
Data Landing Question/Response Master
Report View
Data Model
• History
• Compare like questions
• Question modeling
Data Landing Question/Response Master
Report View
Copyright 2016 Senturus, Inc. All Rights Reserved.
Solution – Physical Architecture
Tableau Desktop
Cost
• VM cost about $5 per survey run
• Tableau Desktop
portal.azure.com
Copyright 2016 Senturus, Inc. All Rights Reserved.
Sure, You Can Have Your Own Data Center
Running a DC
• Electricity
• Engineering
• Installation
• Server Equipment
• Facility Space
• Maintenance
• HVAC
• Management
• Rack Hardware
• High Availability
• Disaster Recovery
• Security
Copyright 2016 Senturus, Inc. All Rights Reserved.
• Not all data is easily analyzed – complex data presents
several challenges
• You don’t need months, millions of $$$$, and an army
of IT staff to do sophisticated analytics
• SMLT can help you change your meeting and email
culture and greatly improve productivity
• Senturus can help you focus on your strengths by
letting you leverage our strengths – delivering effective
analytics solutions
Summary
Copyright 2016 Senturus, Inc. All Rights Reserved.
To hear the recording from this webinar, visit our
website. While you are there, you can also view and
download this deck at:
www.senturus.com/resources/how-to-visualize-
complex-data-in-tableau/
The Senturus comprehensive library of recorded
webinars, demos, white papers, presentations, and case
studies is available on our website at:
www.senturus.com/resources/
Hear the Recording
Copyright 2016 Senturus, Inc. All Rights Reserved.
ADDITIONAL RESOURCES
Contact Stop Meeting Like This
If your organization suffers from meeting madness
• Visit: www.stopmeetinglikethis.com
• Email Alia directly at: alia@stopmeetinglikethis.com
Copyright 2016 Senturus, Inc. All Rights Reserved.
Introduction to Tableau Workshop – Half Day
• Topics include:
– Understanding the Tableau product line
– Learning Tableau terminology
– Acquiring data
– Creating and enhancing worksheets
– Building a three pane interactive dashboard
• July 13, 2016
• $150
• Register at: www.senturus.com/?p=5627
Copyright 2016 Senturus, Inc. All Rights Reserved.
• 2 days – onsite personalized training
• 3 days – discovery and development
– Business requirements
– Data sources
– Support models
– Architectural approaches
– Install and configure Tableau Server
– Jointly develop workbooks and dashboards
– Future proofing and version control
– Ongoing support
Contact Senturus at info@senturus.com or 888 601 6010
Tableau Jumpstart Program
Copyright 2016 Senturus, Inc. All Rights Reserved.
www.senturus.com/events
Upcoming Free Events
Copyright 2016 Senturus, Inc. All Rights Reserved.
More Free Resources on www.senturus.com
Copyright 2016 Senturus, Inc. All Rights Reserved.
To hear the recording from this webinar, visit our
website. While you are there, you can also view and
download this deck at:
www.senturus.com/resources/how-to-visualize-
complex-data-in-tableau/
The Senturus comprehensive library of recorded
webinars, demos, white papers, presentations, and case
studies is available on our website at:
www.senturus.com/resources/
Hear the Recording
Copyright 2016 Senturus, Inc. All Rights Reserved.
Thank You!
www.senturus.com
info@senturus.com
888 601 6010
Copyright 2016 by Senturus, Inc.
This entire presentation is copyrighted and may not be
reused or distributed without the written consent of
Senturus, Inc.
Copyright 2016 Senturus, Inc. All Rights Reserved.
Ad

More Related Content

Viewers also liked (13)

Seatug Presentation (Excel to Data Viz culture) Seattle Tableau User Group
Seatug Presentation (Excel to Data Viz culture) Seattle Tableau User GroupSeatug Presentation (Excel to Data Viz culture) Seattle Tableau User Group
Seatug Presentation (Excel to Data Viz culture) Seattle Tableau User Group
Russell Spangler
 
Qlik for the Enterprise
Qlik for the EnterpriseQlik for the Enterprise
Qlik for the Enterprise
eCraft Referre
 
Making Tableau Dashboards Shareable
Making Tableau Dashboards ShareableMaking Tableau Dashboards Shareable
Making Tableau Dashboards Shareable
Senturus
 
Tableau Conference 2016 know before you go
Tableau Conference 2016  know before you goTableau Conference 2016  know before you go
Tableau Conference 2016 know before you go
Yosuke Katsuki
 
Executive Dashboard Design on Tableau
Executive Dashboard Design on TableauExecutive Dashboard Design on Tableau
Executive Dashboard Design on Tableau
Method360
 
Kpi Executive Dashboard
Kpi Executive DashboardKpi Executive Dashboard
Kpi Executive Dashboard
inflow
 
Commercial complex andheri_e_mumbai
Commercial complex andheri_e_mumbaiCommercial complex andheri_e_mumbai
Commercial complex andheri_e_mumbai
RAAJESH SHETH
 
Capturing Business Requirements For Scorecards, Dashboards And Reports
Capturing Business Requirements For Scorecards, Dashboards And ReportsCapturing Business Requirements For Scorecards, Dashboards And Reports
Capturing Business Requirements For Scorecards, Dashboards And Reports
Julian Rains
 
Unlock Your Data's Potential By Integrating Qualtrics & Tableau
Unlock Your Data's Potential By Integrating Qualtrics & TableauUnlock Your Data's Potential By Integrating Qualtrics & Tableau
Unlock Your Data's Potential By Integrating Qualtrics & Tableau
Qualtrics
 
Gathering And Documenting Your Bi Business Requirements
Gathering And Documenting Your Bi Business RequirementsGathering And Documenting Your Bi Business Requirements
Gathering And Documenting Your Bi Business Requirements
Wynyard Group
 
Commercial complex at parel south mumbai
Commercial complex   at parel south mumbaiCommercial complex   at parel south mumbai
Commercial complex at parel south mumbai
RAAJESH SHETH
 
Data Driven Possibilities with Qlik
Data Driven Possibilities with QlikData Driven Possibilities with Qlik
Data Driven Possibilities with Qlik
Mischa van Werkhoven
 
Presentation about commercial building
Presentation about commercial buildingPresentation about commercial building
Presentation about commercial building
Yuwita Killua
 
Seatug Presentation (Excel to Data Viz culture) Seattle Tableau User Group
Seatug Presentation (Excel to Data Viz culture) Seattle Tableau User GroupSeatug Presentation (Excel to Data Viz culture) Seattle Tableau User Group
Seatug Presentation (Excel to Data Viz culture) Seattle Tableau User Group
Russell Spangler
 
Qlik for the Enterprise
Qlik for the EnterpriseQlik for the Enterprise
Qlik for the Enterprise
eCraft Referre
 
Making Tableau Dashboards Shareable
Making Tableau Dashboards ShareableMaking Tableau Dashboards Shareable
Making Tableau Dashboards Shareable
Senturus
 
Tableau Conference 2016 know before you go
Tableau Conference 2016  know before you goTableau Conference 2016  know before you go
Tableau Conference 2016 know before you go
Yosuke Katsuki
 
Executive Dashboard Design on Tableau
Executive Dashboard Design on TableauExecutive Dashboard Design on Tableau
Executive Dashboard Design on Tableau
Method360
 
Kpi Executive Dashboard
Kpi Executive DashboardKpi Executive Dashboard
Kpi Executive Dashboard
inflow
 
Commercial complex andheri_e_mumbai
Commercial complex andheri_e_mumbaiCommercial complex andheri_e_mumbai
Commercial complex andheri_e_mumbai
RAAJESH SHETH
 
Capturing Business Requirements For Scorecards, Dashboards And Reports
Capturing Business Requirements For Scorecards, Dashboards And ReportsCapturing Business Requirements For Scorecards, Dashboards And Reports
Capturing Business Requirements For Scorecards, Dashboards And Reports
Julian Rains
 
Unlock Your Data's Potential By Integrating Qualtrics & Tableau
Unlock Your Data's Potential By Integrating Qualtrics & TableauUnlock Your Data's Potential By Integrating Qualtrics & Tableau
Unlock Your Data's Potential By Integrating Qualtrics & Tableau
Qualtrics
 
Gathering And Documenting Your Bi Business Requirements
Gathering And Documenting Your Bi Business RequirementsGathering And Documenting Your Bi Business Requirements
Gathering And Documenting Your Bi Business Requirements
Wynyard Group
 
Commercial complex at parel south mumbai
Commercial complex   at parel south mumbaiCommercial complex   at parel south mumbai
Commercial complex at parel south mumbai
RAAJESH SHETH
 
Data Driven Possibilities with Qlik
Data Driven Possibilities with QlikData Driven Possibilities with Qlik
Data Driven Possibilities with Qlik
Mischa van Werkhoven
 
Presentation about commercial building
Presentation about commercial buildingPresentation about commercial building
Presentation about commercial building
Yuwita Killua
 

Similar to Case Study: Visualizing Complex Data in Tableau (20)

Choosing the Right Microsoft BI Tool for the Job
Choosing the Right Microsoft BI Tool for the JobChoosing the Right Microsoft BI Tool for the Job
Choosing the Right Microsoft BI Tool for the Job
Senturus
 
Rolling Out Tableau to the Enterprise
Rolling Out Tableau to the EnterpriseRolling Out Tableau to the Enterprise
Rolling Out Tableau to the Enterprise
Senturus
 
Get A+ Reporting from Existing Higher Education Analytics Solutions, Such as ...
Get A+ Reporting from Existing Higher Education Analytics Solutions, Such as ...Get A+ Reporting from Existing Higher Education Analytics Solutions, Such as ...
Get A+ Reporting from Existing Higher Education Analytics Solutions, Such as ...
Senturus
 
Demo: Report Authoring in IBM Cognos Analytics
Demo: Report Authoring in IBM Cognos AnalyticsDemo: Report Authoring in IBM Cognos Analytics
Demo: Report Authoring in IBM Cognos Analytics
Senturus
 
Tips for Tableau Beginners: Dashboard Design with Tableau Desktop
Tips for Tableau Beginners: Dashboard Design with Tableau DesktopTips for Tableau Beginners: Dashboard Design with Tableau Desktop
Tips for Tableau Beginners: Dashboard Design with Tableau Desktop
Senturus
 
Hadoop Self-Service Data Prep Fuels Analytics
Hadoop Self-Service Data Prep Fuels AnalyticsHadoop Self-Service Data Prep Fuels Analytics
Hadoop Self-Service Data Prep Fuels Analytics
Senturus
 
Death of the Data Warehouse?
Death of the Data Warehouse?Death of the Data Warehouse?
Death of the Data Warehouse?
Senturus
 
branches_spring_2014
branches_spring_2014branches_spring_2014
branches_spring_2014
Lynn Vilker
 
Case Studies: Enterprise BI vs Self-Service Analytics Tools: Real Life Consid...
Case Studies: Enterprise BI vs Self-Service Analytics Tools: Real Life Consid...Case Studies: Enterprise BI vs Self-Service Analytics Tools: Real Life Consid...
Case Studies: Enterprise BI vs Self-Service Analytics Tools: Real Life Consid...
Senturus
 
Leveraging the Cloud for BI Infrastructure: With Focus on and Demos of Micros...
Leveraging the Cloud for BI Infrastructure: With Focus on and Demos of Micros...Leveraging the Cloud for BI Infrastructure: With Focus on and Demos of Micros...
Leveraging the Cloud for BI Infrastructure: With Focus on and Demos of Micros...
Senturus
 
Using Tableau to Gain Actionable Insights: Overview & Demonstration of Visual...
Using Tableau to Gain Actionable Insights: Overview & Demonstration of Visual...Using Tableau to Gain Actionable Insights: Overview & Demonstration of Visual...
Using Tableau to Gain Actionable Insights: Overview & Demonstration of Visual...
Senturus
 
Faster Self-Service Data Analytics
Faster Self-Service Data AnalyticsFaster Self-Service Data Analytics
Faster Self-Service Data Analytics
Senturus
 
Using Cognos as a Data Source for Tableau: Demo & Live Case Study with Ixia
Using Cognos as a Data Source for Tableau: Demo & Live Case Study with IxiaUsing Cognos as a Data Source for Tableau: Demo & Live Case Study with Ixia
Using Cognos as a Data Source for Tableau: Demo & Live Case Study with Ixia
Senturus
 
Scaling Tableau to the Enterprise: The Perks and Pitfalls of Tableau Server W...
Scaling Tableau to the Enterprise: The Perks and Pitfalls of Tableau Server W...Scaling Tableau to the Enterprise: The Perks and Pitfalls of Tableau Server W...
Scaling Tableau to the Enterprise: The Perks and Pitfalls of Tableau Server W...
Senturus
 
Tableau: 6 Ways to Publish & Share Dashboards
Tableau: 6 Ways to Publish & Share DashboardsTableau: 6 Ways to Publish & Share Dashboards
Tableau: 6 Ways to Publish & Share Dashboards
Senturus
 
Oracle analytics cloud overview feb 2017
Oracle analytics cloud overview   feb 2017Oracle analytics cloud overview   feb 2017
Oracle analytics cloud overview feb 2017
aioughydchapter
 
Advanced Use Cases for Analytics Breakout Session
Advanced Use Cases for Analytics Breakout SessionAdvanced Use Cases for Analytics Breakout Session
Advanced Use Cases for Analytics Breakout Session
Splunk
 
Knowledge and Prompt Engineering Part 2 Focus on Prompt Design Approaches
Knowledge and Prompt Engineering Part 2 Focus on Prompt Design ApproachesKnowledge and Prompt Engineering Part 2 Focus on Prompt Design Approaches
Knowledge and Prompt Engineering Part 2 Focus on Prompt Design Approaches
Earley Information Science
 
Introduction to Self-Service Dashboarding and Report Authoring: Leveraging IB...
Introduction to Self-Service Dashboarding and Report Authoring: Leveraging IB...Introduction to Self-Service Dashboarding and Report Authoring: Leveraging IB...
Introduction to Self-Service Dashboarding and Report Authoring: Leveraging IB...
Senturus
 
Enhancing BI with Predictive Analytics with Case Study
Enhancing BI with Predictive Analytics with Case StudyEnhancing BI with Predictive Analytics with Case Study
Enhancing BI with Predictive Analytics with Case Study
Senturus
 
Choosing the Right Microsoft BI Tool for the Job
Choosing the Right Microsoft BI Tool for the JobChoosing the Right Microsoft BI Tool for the Job
Choosing the Right Microsoft BI Tool for the Job
Senturus
 
Rolling Out Tableau to the Enterprise
Rolling Out Tableau to the EnterpriseRolling Out Tableau to the Enterprise
Rolling Out Tableau to the Enterprise
Senturus
 
Get A+ Reporting from Existing Higher Education Analytics Solutions, Such as ...
Get A+ Reporting from Existing Higher Education Analytics Solutions, Such as ...Get A+ Reporting from Existing Higher Education Analytics Solutions, Such as ...
Get A+ Reporting from Existing Higher Education Analytics Solutions, Such as ...
Senturus
 
Demo: Report Authoring in IBM Cognos Analytics
Demo: Report Authoring in IBM Cognos AnalyticsDemo: Report Authoring in IBM Cognos Analytics
Demo: Report Authoring in IBM Cognos Analytics
Senturus
 
Tips for Tableau Beginners: Dashboard Design with Tableau Desktop
Tips for Tableau Beginners: Dashboard Design with Tableau DesktopTips for Tableau Beginners: Dashboard Design with Tableau Desktop
Tips for Tableau Beginners: Dashboard Design with Tableau Desktop
Senturus
 
Hadoop Self-Service Data Prep Fuels Analytics
Hadoop Self-Service Data Prep Fuels AnalyticsHadoop Self-Service Data Prep Fuels Analytics
Hadoop Self-Service Data Prep Fuels Analytics
Senturus
 
Death of the Data Warehouse?
Death of the Data Warehouse?Death of the Data Warehouse?
Death of the Data Warehouse?
Senturus
 
branches_spring_2014
branches_spring_2014branches_spring_2014
branches_spring_2014
Lynn Vilker
 
Case Studies: Enterprise BI vs Self-Service Analytics Tools: Real Life Consid...
Case Studies: Enterprise BI vs Self-Service Analytics Tools: Real Life Consid...Case Studies: Enterprise BI vs Self-Service Analytics Tools: Real Life Consid...
Case Studies: Enterprise BI vs Self-Service Analytics Tools: Real Life Consid...
Senturus
 
Leveraging the Cloud for BI Infrastructure: With Focus on and Demos of Micros...
Leveraging the Cloud for BI Infrastructure: With Focus on and Demos of Micros...Leveraging the Cloud for BI Infrastructure: With Focus on and Demos of Micros...
Leveraging the Cloud for BI Infrastructure: With Focus on and Demos of Micros...
Senturus
 
Using Tableau to Gain Actionable Insights: Overview & Demonstration of Visual...
Using Tableau to Gain Actionable Insights: Overview & Demonstration of Visual...Using Tableau to Gain Actionable Insights: Overview & Demonstration of Visual...
Using Tableau to Gain Actionable Insights: Overview & Demonstration of Visual...
Senturus
 
Faster Self-Service Data Analytics
Faster Self-Service Data AnalyticsFaster Self-Service Data Analytics
Faster Self-Service Data Analytics
Senturus
 
Using Cognos as a Data Source for Tableau: Demo & Live Case Study with Ixia
Using Cognos as a Data Source for Tableau: Demo & Live Case Study with IxiaUsing Cognos as a Data Source for Tableau: Demo & Live Case Study with Ixia
Using Cognos as a Data Source for Tableau: Demo & Live Case Study with Ixia
Senturus
 
Scaling Tableau to the Enterprise: The Perks and Pitfalls of Tableau Server W...
Scaling Tableau to the Enterprise: The Perks and Pitfalls of Tableau Server W...Scaling Tableau to the Enterprise: The Perks and Pitfalls of Tableau Server W...
Scaling Tableau to the Enterprise: The Perks and Pitfalls of Tableau Server W...
Senturus
 
Tableau: 6 Ways to Publish & Share Dashboards
Tableau: 6 Ways to Publish & Share DashboardsTableau: 6 Ways to Publish & Share Dashboards
Tableau: 6 Ways to Publish & Share Dashboards
Senturus
 
Oracle analytics cloud overview feb 2017
Oracle analytics cloud overview   feb 2017Oracle analytics cloud overview   feb 2017
Oracle analytics cloud overview feb 2017
aioughydchapter
 
Advanced Use Cases for Analytics Breakout Session
Advanced Use Cases for Analytics Breakout SessionAdvanced Use Cases for Analytics Breakout Session
Advanced Use Cases for Analytics Breakout Session
Splunk
 
Knowledge and Prompt Engineering Part 2 Focus on Prompt Design Approaches
Knowledge and Prompt Engineering Part 2 Focus on Prompt Design ApproachesKnowledge and Prompt Engineering Part 2 Focus on Prompt Design Approaches
Knowledge and Prompt Engineering Part 2 Focus on Prompt Design Approaches
Earley Information Science
 
Introduction to Self-Service Dashboarding and Report Authoring: Leveraging IB...
Introduction to Self-Service Dashboarding and Report Authoring: Leveraging IB...Introduction to Self-Service Dashboarding and Report Authoring: Leveraging IB...
Introduction to Self-Service Dashboarding and Report Authoring: Leveraging IB...
Senturus
 
Enhancing BI with Predictive Analytics with Case Study
Enhancing BI with Predictive Analytics with Case StudyEnhancing BI with Predictive Analytics with Case Study
Enhancing BI with Predictive Analytics with Case Study
Senturus
 
Ad

More from Senturus (20)

Power BI Gateway: Understanding, Installing, Configuring
Power BI Gateway: Understanding, Installing, ConfiguringPower BI Gateway: Understanding, Installing, Configuring
Power BI Gateway: Understanding, Installing, Configuring
Senturus
 
Cognos Performance Tuning Tips & Tricks
Cognos Performance Tuning Tips & TricksCognos Performance Tuning Tips & Tricks
Cognos Performance Tuning Tips & Tricks
Senturus
 
Power Automate for Power BI: Getting Started
Power Automate for Power BI: Getting StartedPower Automate for Power BI: Getting Started
Power Automate for Power BI: Getting Started
Senturus
 
Collaborative BI: 3 Ways to Use Cognos with Power BI & Tableau
Collaborative BI:  3 Ways to Use Cognos with Power BI & TableauCollaborative BI:  3 Ways to Use Cognos with Power BI & Tableau
Collaborative BI: 3 Ways to Use Cognos with Power BI & Tableau
Senturus
 
Tips for Installing Cognos Analytics 11.2.1x
Tips for Installing Cognos Analytics 11.2.1xTips for Installing Cognos Analytics 11.2.1x
Tips for Installing Cognos Analytics 11.2.1x
Senturus
 
How to Prepare for a BI Migration
How to Prepare for a BI MigrationHow to Prepare for a BI Migration
How to Prepare for a BI Migration
Senturus
 
4 Common Analytics Reporting Errors to Avoid
4 Common Analytics Reporting Errors to Avoid4 Common Analytics Reporting Errors to Avoid
4 Common Analytics Reporting Errors to Avoid
Senturus
 
Extending Power BI Functionality with R
Extending Power BI Functionality with RExtending Power BI Functionality with R
Extending Power BI Functionality with R
Senturus
 
Take Control of Your Cloud
Take Control of Your CloudTake Control of Your Cloud
Take Control of Your Cloud
Senturus
 
Using Python with Power BI
Using Python with Power BIUsing Python with Power BI
Using Python with Power BI
Senturus
 
User-Friendly Power BI Report Nav
User-Friendly Power BI Report NavUser-Friendly Power BI Report Nav
User-Friendly Power BI Report Nav
Senturus
 
Streamline Cognos Migrations & Consolidations
Streamline Cognos Migrations & ConsolidationsStreamline Cognos Migrations & Consolidations
Streamline Cognos Migrations & Consolidations
Senturus
 
What’s New in Cognos 11.2.1
What’s New in Cognos 11.2.1What’s New in Cognos 11.2.1
What’s New in Cognos 11.2.1
Senturus
 
Planning for a Power BI Enterprise Deployment
Planning for a Power BI Enterprise DeploymentPlanning for a Power BI Enterprise Deployment
Planning for a Power BI Enterprise Deployment
Senturus
 
Power BI Report Builder & Paginated Reports
Power BI Report Builder & Paginated Reports Power BI Report Builder & Paginated Reports
Power BI Report Builder & Paginated Reports
Senturus
 
Cognos Analytics 11.2 New Features
Cognos Analytics 11.2 New FeaturesCognos Analytics 11.2 New Features
Cognos Analytics 11.2 New Features
Senturus
 
Azure Synapse vs. Snowflake: The Data Warehouse Dating Game
Azure Synapse vs. Snowflake: The Data Warehouse Dating GameAzure Synapse vs. Snowflake: The Data Warehouse Dating Game
Azure Synapse vs. Snowflake: The Data Warehouse Dating Game
Senturus
 
Secrets of High Performing Report Development Teams
Secrets of High Performing Report Development TeamsSecrets of High Performing Report Development Teams
Secrets of High Performing Report Development Teams
Senturus
 
Power BI: Data Cleansing & Power Query Editor
Power BI: Data Cleansing & Power Query EditorPower BI: Data Cleansing & Power Query Editor
Power BI: Data Cleansing & Power Query Editor
Senturus
 
Cognos Data Module Architectures & Use Cases
Cognos Data Module Architectures & Use CasesCognos Data Module Architectures & Use Cases
Cognos Data Module Architectures & Use Cases
Senturus
 
Power BI Gateway: Understanding, Installing, Configuring
Power BI Gateway: Understanding, Installing, ConfiguringPower BI Gateway: Understanding, Installing, Configuring
Power BI Gateway: Understanding, Installing, Configuring
Senturus
 
Cognos Performance Tuning Tips & Tricks
Cognos Performance Tuning Tips & TricksCognos Performance Tuning Tips & Tricks
Cognos Performance Tuning Tips & Tricks
Senturus
 
Power Automate for Power BI: Getting Started
Power Automate for Power BI: Getting StartedPower Automate for Power BI: Getting Started
Power Automate for Power BI: Getting Started
Senturus
 
Collaborative BI: 3 Ways to Use Cognos with Power BI & Tableau
Collaborative BI:  3 Ways to Use Cognos with Power BI & TableauCollaborative BI:  3 Ways to Use Cognos with Power BI & Tableau
Collaborative BI: 3 Ways to Use Cognos with Power BI & Tableau
Senturus
 
Tips for Installing Cognos Analytics 11.2.1x
Tips for Installing Cognos Analytics 11.2.1xTips for Installing Cognos Analytics 11.2.1x
Tips for Installing Cognos Analytics 11.2.1x
Senturus
 
How to Prepare for a BI Migration
How to Prepare for a BI MigrationHow to Prepare for a BI Migration
How to Prepare for a BI Migration
Senturus
 
4 Common Analytics Reporting Errors to Avoid
4 Common Analytics Reporting Errors to Avoid4 Common Analytics Reporting Errors to Avoid
4 Common Analytics Reporting Errors to Avoid
Senturus
 
Extending Power BI Functionality with R
Extending Power BI Functionality with RExtending Power BI Functionality with R
Extending Power BI Functionality with R
Senturus
 
Take Control of Your Cloud
Take Control of Your CloudTake Control of Your Cloud
Take Control of Your Cloud
Senturus
 
Using Python with Power BI
Using Python with Power BIUsing Python with Power BI
Using Python with Power BI
Senturus
 
User-Friendly Power BI Report Nav
User-Friendly Power BI Report NavUser-Friendly Power BI Report Nav
User-Friendly Power BI Report Nav
Senturus
 
Streamline Cognos Migrations & Consolidations
Streamline Cognos Migrations & ConsolidationsStreamline Cognos Migrations & Consolidations
Streamline Cognos Migrations & Consolidations
Senturus
 
What’s New in Cognos 11.2.1
What’s New in Cognos 11.2.1What’s New in Cognos 11.2.1
What’s New in Cognos 11.2.1
Senturus
 
Planning for a Power BI Enterprise Deployment
Planning for a Power BI Enterprise DeploymentPlanning for a Power BI Enterprise Deployment
Planning for a Power BI Enterprise Deployment
Senturus
 
Power BI Report Builder & Paginated Reports
Power BI Report Builder & Paginated Reports Power BI Report Builder & Paginated Reports
Power BI Report Builder & Paginated Reports
Senturus
 
Cognos Analytics 11.2 New Features
Cognos Analytics 11.2 New FeaturesCognos Analytics 11.2 New Features
Cognos Analytics 11.2 New Features
Senturus
 
Azure Synapse vs. Snowflake: The Data Warehouse Dating Game
Azure Synapse vs. Snowflake: The Data Warehouse Dating GameAzure Synapse vs. Snowflake: The Data Warehouse Dating Game
Azure Synapse vs. Snowflake: The Data Warehouse Dating Game
Senturus
 
Secrets of High Performing Report Development Teams
Secrets of High Performing Report Development TeamsSecrets of High Performing Report Development Teams
Secrets of High Performing Report Development Teams
Senturus
 
Power BI: Data Cleansing & Power Query Editor
Power BI: Data Cleansing & Power Query EditorPower BI: Data Cleansing & Power Query Editor
Power BI: Data Cleansing & Power Query Editor
Senturus
 
Cognos Data Module Architectures & Use Cases
Cognos Data Module Architectures & Use CasesCognos Data Module Architectures & Use Cases
Cognos Data Module Architectures & Use Cases
Senturus
 
Ad

Recently uploaded (20)

How to join illuminati Agent in uganda call+256776963507/0741506136
How to join illuminati Agent in uganda call+256776963507/0741506136How to join illuminati Agent in uganda call+256776963507/0741506136
How to join illuminati Agent in uganda call+256776963507/0741506136
illuminati Agent uganda call+256776963507/0741506136
 
chapter 4 Variability statistical research .pptx
chapter 4 Variability statistical research .pptxchapter 4 Variability statistical research .pptx
chapter 4 Variability statistical research .pptx
justinebandajbn
 
Stack_and_Queue_Presentation_Final (1).pptx
Stack_and_Queue_Presentation_Final (1).pptxStack_and_Queue_Presentation_Final (1).pptx
Stack_and_Queue_Presentation_Final (1).pptx
binduraniha86
 
04302025_CCC TUG_DataVista: The Design Story
04302025_CCC TUG_DataVista: The Design Story04302025_CCC TUG_DataVista: The Design Story
04302025_CCC TUG_DataVista: The Design Story
ccctableauusergroup
 
C++_OOPs_DSA1_Presentation_Template.pptx
C++_OOPs_DSA1_Presentation_Template.pptxC++_OOPs_DSA1_Presentation_Template.pptx
C++_OOPs_DSA1_Presentation_Template.pptx
aquibnoor22079
 
Day 1 - Lab 1 Reconnaissance Scanning with NMAP, Vulnerability Assessment wit...
Day 1 - Lab 1 Reconnaissance Scanning with NMAP, Vulnerability Assessment wit...Day 1 - Lab 1 Reconnaissance Scanning with NMAP, Vulnerability Assessment wit...
Day 1 - Lab 1 Reconnaissance Scanning with NMAP, Vulnerability Assessment wit...
Abodahab
 
IAS-slides2-ia-aaaaaaaaaaain-business.pdf
IAS-slides2-ia-aaaaaaaaaaain-business.pdfIAS-slides2-ia-aaaaaaaaaaain-business.pdf
IAS-slides2-ia-aaaaaaaaaaain-business.pdf
mcgardenlevi9
 
AI Competitor Analysis: How to Monitor and Outperform Your Competitors
AI Competitor Analysis: How to Monitor and Outperform Your CompetitorsAI Competitor Analysis: How to Monitor and Outperform Your Competitors
AI Competitor Analysis: How to Monitor and Outperform Your Competitors
Contify
 
md-presentHHHHHHHHHHHHHHHHHHHHHHHHHHHHHHation.pptx
md-presentHHHHHHHHHHHHHHHHHHHHHHHHHHHHHHation.pptxmd-presentHHHHHHHHHHHHHHHHHHHHHHHHHHHHHHation.pptx
md-presentHHHHHHHHHHHHHHHHHHHHHHHHHHHHHHation.pptx
fatimalazaar2004
 
VKS-Python Basics for Beginners and advance.pptx
VKS-Python Basics for Beginners and advance.pptxVKS-Python Basics for Beginners and advance.pptx
VKS-Python Basics for Beginners and advance.pptx
Vinod Srivastava
 
Classification_in_Machinee_Learning.pptx
Classification_in_Machinee_Learning.pptxClassification_in_Machinee_Learning.pptx
Classification_in_Machinee_Learning.pptx
wencyjorda88
 
How iCode cybertech Helped Me Recover My Lost Funds
How iCode cybertech Helped Me Recover My Lost FundsHow iCode cybertech Helped Me Recover My Lost Funds
How iCode cybertech Helped Me Recover My Lost Funds
ireneschmid345
 
chapter3 Central Tendency statistics.ppt
chapter3 Central Tendency statistics.pptchapter3 Central Tendency statistics.ppt
chapter3 Central Tendency statistics.ppt
justinebandajbn
 
DPR_Expert_Recruitment_notice_Revised.pdf
DPR_Expert_Recruitment_notice_Revised.pdfDPR_Expert_Recruitment_notice_Revised.pdf
DPR_Expert_Recruitment_notice_Revised.pdf
inmishra17121973
 
Simple_AI_Explanation_English somplr.pptx
Simple_AI_Explanation_English somplr.pptxSimple_AI_Explanation_English somplr.pptx
Simple_AI_Explanation_English somplr.pptx
ssuser2aa19f
 
Medical Dataset including visualizations
Medical Dataset including visualizationsMedical Dataset including visualizations
Medical Dataset including visualizations
vishrut8750588758
 
GenAI for Quant Analytics: survey-analytics.ai
GenAI for Quant Analytics: survey-analytics.aiGenAI for Quant Analytics: survey-analytics.ai
GenAI for Quant Analytics: survey-analytics.ai
Inspirient
 
Digilocker under workingProcess Flow.pptx
Digilocker  under workingProcess Flow.pptxDigilocker  under workingProcess Flow.pptx
Digilocker under workingProcess Flow.pptx
satnamsadguru491
 
Developing Security Orchestration, Automation, and Response Applications
Developing Security Orchestration, Automation, and Response ApplicationsDeveloping Security Orchestration, Automation, and Response Applications
Developing Security Orchestration, Automation, and Response Applications
VICTOR MAESTRE RAMIREZ
 
Data Analytics Overview and its applications
Data Analytics Overview and its applicationsData Analytics Overview and its applications
Data Analytics Overview and its applications
JanmejayaMishra7
 
chapter 4 Variability statistical research .pptx
chapter 4 Variability statistical research .pptxchapter 4 Variability statistical research .pptx
chapter 4 Variability statistical research .pptx
justinebandajbn
 
Stack_and_Queue_Presentation_Final (1).pptx
Stack_and_Queue_Presentation_Final (1).pptxStack_and_Queue_Presentation_Final (1).pptx
Stack_and_Queue_Presentation_Final (1).pptx
binduraniha86
 
04302025_CCC TUG_DataVista: The Design Story
04302025_CCC TUG_DataVista: The Design Story04302025_CCC TUG_DataVista: The Design Story
04302025_CCC TUG_DataVista: The Design Story
ccctableauusergroup
 
C++_OOPs_DSA1_Presentation_Template.pptx
C++_OOPs_DSA1_Presentation_Template.pptxC++_OOPs_DSA1_Presentation_Template.pptx
C++_OOPs_DSA1_Presentation_Template.pptx
aquibnoor22079
 
Day 1 - Lab 1 Reconnaissance Scanning with NMAP, Vulnerability Assessment wit...
Day 1 - Lab 1 Reconnaissance Scanning with NMAP, Vulnerability Assessment wit...Day 1 - Lab 1 Reconnaissance Scanning with NMAP, Vulnerability Assessment wit...
Day 1 - Lab 1 Reconnaissance Scanning with NMAP, Vulnerability Assessment wit...
Abodahab
 
IAS-slides2-ia-aaaaaaaaaaain-business.pdf
IAS-slides2-ia-aaaaaaaaaaain-business.pdfIAS-slides2-ia-aaaaaaaaaaain-business.pdf
IAS-slides2-ia-aaaaaaaaaaain-business.pdf
mcgardenlevi9
 
AI Competitor Analysis: How to Monitor and Outperform Your Competitors
AI Competitor Analysis: How to Monitor and Outperform Your CompetitorsAI Competitor Analysis: How to Monitor and Outperform Your Competitors
AI Competitor Analysis: How to Monitor and Outperform Your Competitors
Contify
 
md-presentHHHHHHHHHHHHHHHHHHHHHHHHHHHHHHation.pptx
md-presentHHHHHHHHHHHHHHHHHHHHHHHHHHHHHHation.pptxmd-presentHHHHHHHHHHHHHHHHHHHHHHHHHHHHHHation.pptx
md-presentHHHHHHHHHHHHHHHHHHHHHHHHHHHHHHation.pptx
fatimalazaar2004
 
VKS-Python Basics for Beginners and advance.pptx
VKS-Python Basics for Beginners and advance.pptxVKS-Python Basics for Beginners and advance.pptx
VKS-Python Basics for Beginners and advance.pptx
Vinod Srivastava
 
Classification_in_Machinee_Learning.pptx
Classification_in_Machinee_Learning.pptxClassification_in_Machinee_Learning.pptx
Classification_in_Machinee_Learning.pptx
wencyjorda88
 
How iCode cybertech Helped Me Recover My Lost Funds
How iCode cybertech Helped Me Recover My Lost FundsHow iCode cybertech Helped Me Recover My Lost Funds
How iCode cybertech Helped Me Recover My Lost Funds
ireneschmid345
 
chapter3 Central Tendency statistics.ppt
chapter3 Central Tendency statistics.pptchapter3 Central Tendency statistics.ppt
chapter3 Central Tendency statistics.ppt
justinebandajbn
 
DPR_Expert_Recruitment_notice_Revised.pdf
DPR_Expert_Recruitment_notice_Revised.pdfDPR_Expert_Recruitment_notice_Revised.pdf
DPR_Expert_Recruitment_notice_Revised.pdf
inmishra17121973
 
Simple_AI_Explanation_English somplr.pptx
Simple_AI_Explanation_English somplr.pptxSimple_AI_Explanation_English somplr.pptx
Simple_AI_Explanation_English somplr.pptx
ssuser2aa19f
 
Medical Dataset including visualizations
Medical Dataset including visualizationsMedical Dataset including visualizations
Medical Dataset including visualizations
vishrut8750588758
 
GenAI for Quant Analytics: survey-analytics.ai
GenAI for Quant Analytics: survey-analytics.aiGenAI for Quant Analytics: survey-analytics.ai
GenAI for Quant Analytics: survey-analytics.ai
Inspirient
 
Digilocker under workingProcess Flow.pptx
Digilocker  under workingProcess Flow.pptxDigilocker  under workingProcess Flow.pptx
Digilocker under workingProcess Flow.pptx
satnamsadguru491
 
Developing Security Orchestration, Automation, and Response Applications
Developing Security Orchestration, Automation, and Response ApplicationsDeveloping Security Orchestration, Automation, and Response Applications
Developing Security Orchestration, Automation, and Response Applications
VICTOR MAESTRE RAMIREZ
 
Data Analytics Overview and its applications
Data Analytics Overview and its applicationsData Analytics Overview and its applications
Data Analytics Overview and its applications
JanmejayaMishra7
 

Case Study: Visualizing Complex Data in Tableau

  • 1. On a Budget Using the Cloud CASE STUDY: VISUALIZING COMPLEX DATA IN TABLEAU
  • 2. • Introduction • Harnessing Complex Data in Tableau • Using Cloud Power on a Budget • Real World Solution: Stop Meeting Like This • Demo • Solution and Recommendations Agenda Copyright 2016 Senturus, Inc. All Rights Reserved.
  • 3. Presenters Mike Weinhauer Tableau Practice Director Senturus, Inc. Jim Pelichowski Tableau Solutions Architect Senturus, Inc. Alia Santini Principal Consultant Stop Meeting Like This Copyright 2016 Senturus, Inc. All Rights Reserved.
  • 4. Free Resources: www.senturus.com RESOURCE LIBRARY An extensive, free library of past webinars, demonstrations, whitepapers, presentations, helpful hints, and more. Copyright 2016 Senturus, Inc. All Rights Reserved.
  • 5. To hear the recording from this webinar: Case Study: Visualizing Complex Data in Tableau, visit our website at: www.senturus.com/resources/how-to-visualize- complex-data-in-tableau/ While you are there, you can also view and download this deck. Hear the Recording Copyright 2016 Senturus, Inc. All Rights Reserved.
  • 7. • Dashboards, Reporting & Visualizations • Data Preparation & Data Warehouses • Self-Service Business Intelligence (BI) • Big Data & Advanced Analytics • Enterprise Planning Systems Focused on Business Analytics Copyright 2016 Senturus, Inc. All Rights Reserved.
  • 8. Business Requirements Analysis Ready Data DASHBOARDS VISUALIZATIONS AND REPORTING DECISIONS &ACTIONS We Bridge the Gap Between Data and Decision Making Copyright 2016 Senturus, Inc. All Rights Reserved.
  • 9. 900+ Clients, 2000+ Projects, 16+ Years Copyright 2016 Senturus, Inc. All Rights Reserved.
  • 10. CASE STUDY: VISUALIZING COMPLEX DATA IN TABLEAU ON A BUDGET USING THE CLOUD
  • 11. • When the sales and marketing falls short • Examples of challenging data with irregular structure – Social media – Email – Survey Getting Tableau to Work with Complex Data Copyright 2016 Senturus, Inc. All Rights Reserved.
  • 12. • We know Tableau can leverage Hadoop, Redshift… • What if I don’t have that infrastructure/knowledge? • A viable option: outsource IT expertise on the Cloud – No need to add internal IT staff – Get industrial strength performance similar to having your own data center – Secure Big Data on a Budget Copyright 2016 Senturus, Inc. All Rights Reserved.
  • 13. AN INTRODUCTION TO: STOP MEETING LIKE THIS
  • 14. To hear the recording from this webinar, visit our website. While you are there, you can also view and download this deck at: www.senturus.com/resources/how-to-visualize- complex-data-in-tableau/ The Senturus comprehensive library of recorded webinars, demos, white papers, presentations, and case studies is available on our website at: www.senturus.com/resources/ Hear the Recording Copyright 2016 Senturus, Inc. All Rights Reserved.
  • 15. Why Stop Meeting Like This Exists Copyright 2016 Senturus, Inc. All Rights Reserved.
  • 16. The Scope of the Problem We believe the way that large organizations get work done is no longer working Meetings CollaborationEmail Stop Meeting Like This is as much a movement as it is a set of tools, practices, and capabilities to help leaders reset the norm for how organizations use their time. Copyright 2016 Senturus, Inc. All Rights Reserved.
  • 17. Different Points of View on How to Address the Problem THE BIG NEW THING IN MEETINGS? “WALK AND TALK” MEETINGS: TO HAVE OR NOT TO HAVE...THAT IS THE QUESTION NEWS FLASH: MEETINGS SHOULD NEVER BE LONGER THAN 15 MINUTES CHAIR-FREE MEETINGS: A HOT NEW TREND THE MODERN MEETING IS DEAD Copyright 2016 Senturus, Inc. All Rights Reserved.
  • 18. The Opportunity For How to Fix It White Space Asynchronous Collaboration Awesome Meetings Copyright 2016 Senturus, Inc. All Rights Reserved.
  • 19. Outsource survey results database architecture to Senturus Develop the end product with our Senturus architect so that the work is shared Store data in the Cloud and use survey tools that already exist Use Tableau for data visualization Build something repeatable that can scale with us as we grow A Challenge We Faced Internally We are a startup with limited resources… … and to top it all off, do so on a budget! ….and basic technical expertise... … who wanted to display survey results in interesting ways that weren't time consuming… … and develop a database as we go… Copyright 2016 Senturus, Inc. All Rights Reserved.
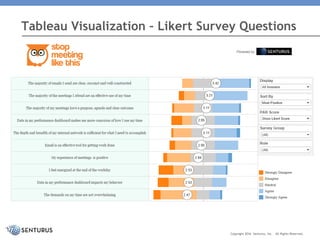
  • 20. Tableau Visualization – Likert Survey Questions Copyright 2016 Senturus, Inc. All Rights Reserved.
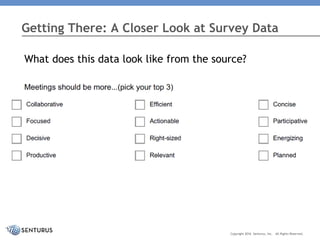
  • 21. Getting There: A Closer Look at Survey Data What does this data look like from the source? Copyright 2016 Senturus, Inc. All Rights Reserved.
  • 22. • Column headings confusing or missing • Columns that should be rows (needs pivoting) • Multiple header rows • Open text responses – Unstructured with no common width • Null or empty values Challenges Using Complex Data Copyright 2016 Senturus, Inc. All Rights Reserved.
  • 23. Tableau Works Much Better With Data Like This Copyright 2016 Senturus, Inc. All Rights Reserved.
  • 24. What About Complex Data? Copyright 2016 Senturus, Inc. All Rights Reserved.
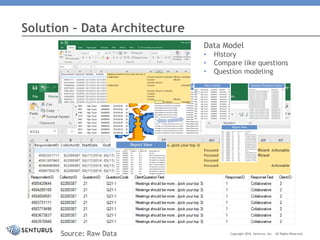
  • 25. Solution – Data Architecture Source: Raw Data Transform Data Landing Question/Response Master Report View Data Model • History • Compare like questions • Question modeling Data Landing Question/Response Master Report View Copyright 2016 Senturus, Inc. All Rights Reserved.
  • 26. Solution – Physical Architecture Tableau Desktop Cost • VM cost about $5 per survey run • Tableau Desktop portal.azure.com Copyright 2016 Senturus, Inc. All Rights Reserved.
  • 27. Sure, You Can Have Your Own Data Center Running a DC • Electricity • Engineering • Installation • Server Equipment • Facility Space • Maintenance • HVAC • Management • Rack Hardware • High Availability • Disaster Recovery • Security Copyright 2016 Senturus, Inc. All Rights Reserved.
  • 28. • Not all data is easily analyzed – complex data presents several challenges • You don’t need months, millions of $$$$, and an army of IT staff to do sophisticated analytics • SMLT can help you change your meeting and email culture and greatly improve productivity • Senturus can help you focus on your strengths by letting you leverage our strengths – delivering effective analytics solutions Summary Copyright 2016 Senturus, Inc. All Rights Reserved.
  • 29. To hear the recording from this webinar, visit our website. While you are there, you can also view and download this deck at: www.senturus.com/resources/how-to-visualize- complex-data-in-tableau/ The Senturus comprehensive library of recorded webinars, demos, white papers, presentations, and case studies is available on our website at: www.senturus.com/resources/ Hear the Recording Copyright 2016 Senturus, Inc. All Rights Reserved.
  • 31. Contact Stop Meeting Like This If your organization suffers from meeting madness • Visit: www.stopmeetinglikethis.com • Email Alia directly at: [email protected] Copyright 2016 Senturus, Inc. All Rights Reserved.
  • 32. Introduction to Tableau Workshop – Half Day • Topics include: – Understanding the Tableau product line – Learning Tableau terminology – Acquiring data – Creating and enhancing worksheets – Building a three pane interactive dashboard • July 13, 2016 • $150 • Register at: www.senturus.com/?p=5627 Copyright 2016 Senturus, Inc. All Rights Reserved.
  • 33. • 2 days – onsite personalized training • 3 days – discovery and development – Business requirements – Data sources – Support models – Architectural approaches – Install and configure Tableau Server – Jointly develop workbooks and dashboards – Future proofing and version control – Ongoing support Contact Senturus at [email protected] or 888 601 6010 Tableau Jumpstart Program Copyright 2016 Senturus, Inc. All Rights Reserved.
  • 34. www.senturus.com/events Upcoming Free Events Copyright 2016 Senturus, Inc. All Rights Reserved.
  • 35. More Free Resources on www.senturus.com Copyright 2016 Senturus, Inc. All Rights Reserved.
  • 36. To hear the recording from this webinar, visit our website. While you are there, you can also view and download this deck at: www.senturus.com/resources/how-to-visualize- complex-data-in-tableau/ The Senturus comprehensive library of recorded webinars, demos, white papers, presentations, and case studies is available on our website at: www.senturus.com/resources/ Hear the Recording Copyright 2016 Senturus, Inc. All Rights Reserved.
  • 37. Thank You! www.senturus.com [email protected] 888 601 6010 Copyright 2016 by Senturus, Inc. This entire presentation is copyrighted and may not be reused or distributed without the written consent of Senturus, Inc. Copyright 2016 Senturus, Inc. All Rights Reserved.