Chapter 6: Computing on the language (R Language Definition)
Download as PPTX, PDF5 likes3,454 views

Tokyo.Lang.R #2(http://atnd.org/events/28465)でのトーク資料。


![6.1 Direct manipulation of language objects
• Language objectsは3種類
1. call
2. expression
3. function
• まずはcall objectについてのお話
• call object = “unevaluated expressions”
– quote関数で生成
– その名の通り“まだ評価されていない”
– eval関数で評価してやる
– [[]]でlist-likeに表現の各要素?にアクセス可能
3](https://image.slidesharecdn.com/tokyolangr0220120602computingonthelanguages-ppt-120601173504-phpapp02/85/Chapter-6-Computing-on-the-language-R-Language-Definition-3-320.jpg)
![6.1 Direct manipulation of language objects
> e1 <- quote(2 + 2) > as.list(e1)
> mode(e1) [[1]]
[1] "call" `+`
> typeof(e1) call型 実際これで
[1] "language" [[2]] Listになる
> e1[[1]] [1] 2
`+`
> e1[[2]] [[3]]
[1] 2 Listのように [1] 2
> e1[[3]] アクセス可能
[1] 2
4](https://image.slidesharecdn.com/tokyolangr0220120602computingonthelanguages-ppt-120601173504-phpapp02/85/Chapter-6-Computing-on-the-language-R-Language-Definition-4-320.jpg)
![6.1 Direct manipulation of language objects
> mode(e1[[1]]) > e1[[2]] <- e1
[1] "name" > e1
> mode(e1[[2]]) 2*2*2
演算子(+,*等)や callを要素?として
[1] "numeric" 代入する事も可能
変数は”name”
> mode(e1[[3]])
[1] "numeric"
> e1[[1]] <- as.name("*")
> e1
2*2
演算子の挿げ替え
(関数も可)
5](https://image.slidesharecdn.com/tokyolangr0220120602computingonthelanguages-ppt-120601173504-phpapp02/85/Chapter-6-Computing-on-the-language-R-Language-Definition-5-320.jpg)
![6.1 Direct manipulation of language objects
> x <- quote(c(1,2)) > deparse(quote("-"(2,2)))
> as.list(x) [1] "2 - 2"
[[1]] > deparse(quote(2 - 2))
c [1] "2 - 2"
[[2]]
[1] 1
[[3]]
[1] 2 同じ表現にdeparse
されるとは限らない
> deparse(x)
[1] "c(1, 2)"
> class(deparse(x))
[1] "character" deparse(call→文字列化)
6](https://image.slidesharecdn.com/tokyolangr0220120602computingonthelanguages-ppt-120601173504-phpapp02/85/Chapter-6-Computing-on-the-language-R-Language-Definition-6-320.jpg)

![6.2 Substitutions
plot(0)
for(i in 1:4)
{
text(1, 0.2 * i, substitute(x[ix] == y, list(ix = i, y = pnorm(i))))
}
1.0
x4 0.9999683
x3 0.9986501
x2 0.9772499
x1 0.8413447
0.0
0
-1.0
0.6 0.8 1.0 1.2 1.4
Index
8](https://image.slidesharecdn.com/tokyolangr0220120602computingonthelanguages-ppt-120601173504-phpapp02/85/Chapter-6-Computing-on-the-language-R-Language-Definition-8-320.jpg)
![6.2 Substitutions
plot(0) bquote関数で
for( i in 1:4) 略記が可能
{
text(1, 0.2 * i, bquote(x[.(i)] == .(pnorm(i)) ))
}
1.0
x4 0.9999683
x3 0.9986501
x2 0.9772499
x1 0.8413447
0.0
0
-1.0
0.6 0.8 1.0 1.2 1.4
Index
9](https://image.slidesharecdn.com/tokyolangr0220120602computingonthelanguages-ppt-120601173504-phpapp02/85/Chapter-6-Computing-on-the-language-R-Language-Definition-9-320.jpg)
![6.2 Substitutions
> expr <- quote(x + y) > nested <-
> not.nested <- substitute(substitute(e,
substitute(expr, list(x = 3)) list(x = 3)), list(e = expr))
> class(not.nested) > class(nested)
substituteを
[1] "name" [1] "call"
ネストして適用
> typeof(not.nested) > typeof(nested)
[1] "symbol" [1] "language"
> eval(not.nested) > eval(nested)
x+y 3+y
第一引数(quote(x+y))を評価しないので
正しくdeparse(文字列化されない) 10](https://image.slidesharecdn.com/tokyolangr0220120602computingonthelanguages-ppt-120601173504-phpapp02/85/Chapter-6-Computing-on-the-language-R-Language-Definition-10-320.jpg)
![6.2 Substitutions
> default <- 1
> f <- eval(bquote( function(x, y = .(default)) x+y ))
> f(2)
[1] 3
かなりヤンチャな書き方もできる。。。
が、可読性が。。。
11](https://image.slidesharecdn.com/tokyolangr0220120602computingonthelanguages-ppt-120601173504-phpapp02/85/Chapter-6-Computing-on-the-language-R-Language-Definition-11-320.jpg)


![6.3 More on evaluation
• eval関数
‒ “call”オブジェクトを評価するときに使用
‒ どの“環境”で評価をするのかを指定可能
– 例(親環境評価):eval(expr,
> x <- sys.frame(sys.parent())
3
> y <- 10
> eval(quote(x+y), data.frame(x = 1:10), sys.frame(sys.parent()))
[1] 11 12 13 14 15 16 17 18 19 20
> eval(quote(x+y), sys.frame(sys.parent()))
先にデータの値を
[1] 13 使って評価してくれる
15](https://image.slidesharecdn.com/tokyolangr0220120602computingonthelanguages-ppt-120601173504-phpapp02/85/Chapter-6-Computing-on-the-language-R-Language-Definition-15-320.jpg)
![6.4 Evaluation of expression objects
• Expression object(2.1.4に記載あり)
– 特殊なLanguage Object
– Language objectとの違い
• 複数のExpressionを保持(call objectのlistみたいなもん)
• eval関数に通したときのみ評価される
> ex <- expression(2 + 2, 3 + 4)
call objectの
> ex[[1]]
リストっぽく扱える
2+2
> ex[[2]]
3+4 最後に評価されたものが値として返ってくる
> eval(ex) (中で評価は全部されてる)
[1] 7
16](https://image.slidesharecdn.com/tokyolangr0220120602computingonthelanguages-ppt-120601173504-phpapp02/85/Chapter-6-Computing-on-the-language-R-Language-Definition-16-320.jpg)
![6.4 Evaluation of expression objects
• 前述の例は基本quote({2 + 2; 3 + 4})と同じ
• Language objectとの違い
• eval関数に通したときのみ評価される
> eval(substitute(mode(x), list(x = quote(2 + 2))))
[1] "numeric" 再帰的に
evalされる
> eval(substitute(mode(x), list(x = expression(2 + 2))))
[1] "expression"
“直に”eval関数に渡されない場合は
expressionは評価されない
17](https://image.slidesharecdn.com/tokyolangr0220120602computingonthelanguages-ppt-120601173504-phpapp02/85/Chapter-6-Computing-on-the-language-R-Language-Definition-17-320.jpg)
![6.4 Evaluation of expression objects
> e <- quote(expression(2 + 2))
>e
expressionを作るcall object
expression(2 + 2)
> mode(e)
[1] "call"
> ee <- expression(2 + 2) vs
> ee
expression(2 + 2)
> mode(ee) 普通のexpression
[1] "expression"
18](https://image.slidesharecdn.com/tokyolangr0220120602computingonthelanguages-ppt-120601173504-phpapp02/85/Chapter-6-Computing-on-the-language-R-Language-Definition-18-320.jpg)
![6.5 Manipulation of function calls
• match.callは同じ引数で違う関数を呼ばれる時
によく使われる(例:lm関数の頭)
vh> f <- function (formula, data, subset, weights, na.action, method = "qr",
+ model = TRUE, x = FALSE, y = FALSE, qr = TRUE, singular.ok = TRUE,
+ contrasts = NULL, offset, ...)
+{
+ cl <- match.call()
+ mf <- match.call(expand.dots = FALSE)
+ m <- match(c("formula", "data", "subset", "weights", "na.action",
+ "offset"), names(mf), 0L)
+ mf <- mf[c(1L, m)]
+ print(mf)
+ mf$drop.unused.levels <- TRUE
+ print(mf[[1L]]) 関数名だけ
+ mf[[1L]] <- as.name("model.frame")
+ print(mf)
変更して評価
+ eval(mf, parent.frame())
+}
20](https://image.slidesharecdn.com/tokyolangr0220120602computingonthelanguages-ppt-120601173504-phpapp02/85/Chapter-6-Computing-on-the-language-R-Language-Definition-20-320.jpg)

![6.5 Manipulation of function calls
• match.callのexpand.dotsをFALSEにすると”…”が
ひと固まりのリストとして扱われる
> f <- function(x, y, ...) match.call(expand.dots = FALSE)
> f(y = 1, 2, z = 3, 4)
f(x = 2, y = 1, ... = list(z = 3, 4))
> f(y = 1, 2, z = 3, 4)$...
$z
リストとして扱われる。特に
[1] 3 f(y = 1, 2, z = 3, 4)$... <- NULL
[[2]] 等として要らないものを消去
[1] 4 する際に使用
22](https://image.slidesharecdn.com/tokyolangr0220120602computingonthelanguages-ppt-120601173504-phpapp02/85/Chapter-6-Computing-on-the-language-R-Language-Definition-22-320.jpg)


![6.5 Manipulation of function calls
> y <- 10.5
> (e <- call("round", y)) call関数でcall objectを
生成&評価
round(10.5)
> eval(e)
[1] 10
>
> x <- list(x = 1:5, y = 101:105, z = 1001:1005)
do.call関数で
> do.call("rbind", x)
引数のリストを
[,1] [,2] [,3] [,4] [,5] 全て”rbind”関数
x 1 2 3 4 5 で結合し行列化
y 101 102 103 104 105
z 1001 1002 1003 1004 1005
25](https://image.slidesharecdn.com/tokyolangr0220120602computingonthelanguages-ppt-120601173504-phpapp02/85/Chapter-6-Computing-on-the-language-R-Language-Definition-25-320.jpg)


![6.6 Manipulation of functions
変更された関数 3(x) + 10(a) = 13
> f(3) 5^3 = 125として評価 f(3)
> と評価される
[1] 125 [1] 13
> >
> f <- f.original > f <- f.original
> formals(f) <- alist(x = , a = 10) > as.list(f)
>f $x
function (x, a = 10) [[2]]
{ {
x+a x+a
alist(の結果)をformalsに
} 入れることで外から束縛 }
※alistはうまいこと”型”を割り振った”list”を作ってくれる関数 28](https://image.slidesharecdn.com/tokyolangr0220120602computingonthelanguages-ppt-120601173504-phpapp02/85/Chapter-6-Computing-on-the-language-R-Language-Definition-28-320.jpg)
![6.6 Manipulation of functions
> as.function(as.list(f))
function (x) 関数をリスト化した後、
{ 再関数化で元通り
x+a
}
>
> f <- as.function(alist(x = ,y = 2,x + y))
> f(3)
[1] 5
alistで作成したlistを関数化
29](https://image.slidesharecdn.com/tokyolangr0220120602computingonthelanguages-ppt-120601173504-phpapp02/85/Chapter-6-Computing-on-the-language-R-Language-Definition-29-320.jpg)


Ad
More Related Content
What's hot (20)
Similar to Chapter 6: Computing on the language (R Language Definition) (20)


Ad
More from Nagi Teramo (20)


Ad
Chapter 6: Computing on the language (R Language Definition)
- 1. R Language Definition version 2.14.2(2012-02-29) DRAFT Chapter 6: Computing on the language Tokyo.Lang.R #2 2012/06/02 @teramonagi
- 2. 6 Computing on the language • RはLispよりも親しみやすいインターフェイス • しかし、計算エンジンはLisp-like • (数式の)“expression”にアクセス可能 • 微分等を解析的に計算可能!(Not 数値的) • example > curve(sin(x)) > curve(cos(x)) 2
- 3. 6.1 Direct manipulation of language objects • Language objectsは3種類 1. call 2. expression 3. function • まずはcall objectについてのお話 • call object = “unevaluated expressions” – quote関数で生成 – その名の通り“まだ評価されていない” – eval関数で評価してやる – [[]]でlist-likeに表現の各要素?にアクセス可能 3
- 4. 6.1 Direct manipulation of language objects > e1 <- quote(2 + 2) > as.list(e1) > mode(e1) [[1]] [1] "call" `+` > typeof(e1) call型 実際これで [1] "language" [[2]] Listになる > e1[[1]] [1] 2 `+` > e1[[2]] [[3]] [1] 2 Listのように [1] 2 > e1[[3]] アクセス可能 [1] 2 4
- 5. 6.1 Direct manipulation of language objects > mode(e1[[1]]) > e1[[2]] <- e1 [1] "name" > e1 > mode(e1[[2]]) 2*2*2 演算子(+,*等)や callを要素?として [1] "numeric" 代入する事も可能 変数は”name” > mode(e1[[3]]) [1] "numeric" > e1[[1]] <- as.name("*") > e1 2*2 演算子の挿げ替え (関数も可) 5
- 6. 6.1 Direct manipulation of language objects > x <- quote(c(1,2)) > deparse(quote("-"(2,2))) > as.list(x) [1] "2 - 2" [[1]] > deparse(quote(2 - 2)) c [1] "2 - 2" [[2]] [1] 1 [[3]] [1] 2 同じ表現にdeparse されるとは限らない > deparse(x) [1] "c(1, 2)" > class(deparse(x)) [1] "character" deparse(call→文字列化) 6
- 7. 6.2 Substitutions • “expression”をplotラベルとして文字列化した い • そんな時のsubstitute関数。俗に言う“deparse” (オブジェクト⇒文字) • 遅延評価に使われる”promise”オブジェクトの expression スロットの値を引っこ抜く • “promise”オブジェクトは – expression:中身の“表現” – environment:評価される際の“環境“ – value:(もし一度評価されているなら)その“値“ の3つのSLOTを持っている(2.1.8より) 7
- 8. 6.2 Substitutions plot(0) for(i in 1:4) { text(1, 0.2 * i, substitute(x[ix] == y, list(ix = i, y = pnorm(i)))) } 1.0 x4 0.9999683 x3 0.9986501 x2 0.9772499 x1 0.8413447 0.0 0 -1.0 0.6 0.8 1.0 1.2 1.4 Index 8
- 9. 6.2 Substitutions plot(0) bquote関数で for( i in 1:4) 略記が可能 { text(1, 0.2 * i, bquote(x[.(i)] == .(pnorm(i)) )) } 1.0 x4 0.9999683 x3 0.9986501 x2 0.9772499 x1 0.8413447 0.0 0 -1.0 0.6 0.8 1.0 1.2 1.4 Index 9
- 10. 6.2 Substitutions > expr <- quote(x + y) > nested <- > not.nested <- substitute(substitute(e, substitute(expr, list(x = 3)) list(x = 3)), list(e = expr)) > class(not.nested) > class(nested) substituteを [1] "name" [1] "call" ネストして適用 > typeof(not.nested) > typeof(nested) [1] "symbol" [1] "language" > eval(not.nested) > eval(nested) x+y 3+y 第一引数(quote(x+y))を評価しないので 正しくdeparse(文字列化されない) 10
- 11. 6.2 Substitutions > default <- 1 > f <- eval(bquote( function(x, y = .(default)) x+y )) > f(2) [1] 3 かなりヤンチャな書き方もできる。。。 が、可読性が。。。 11
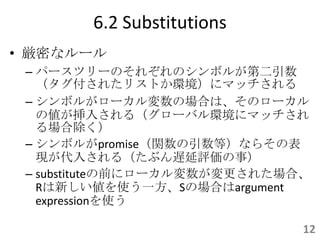
- 12. 6.2 Substitutions • 厳密なルール – パースツリーのそれぞれのシンボルが第二引数 (タグ付されたリストか環境)にマッチされる – シンボルがローカル変数の場合は、そのローカル の値が挿入される(グローバル環境にマッチされ る場合除く) – シンボルがpromise(関数の引数等)ならその表 現が代入される(たぶん遅延評価の事) – substituteの前にローカル変数が変更された場合、 Rは新しい値を使う一方、Sの場合はargument expressionを使う 12
- 13. } y <- log(y) 45, 1.09861228866811, 1.38629436111989, 1.6094379124341, logplot(1:19) 1.94591014905531, 2.07944154167984, 2.19722457733622, , 2.39789527279837, 2.484906649788, 2.56494935746154, 0.0 1.5 3.0 2.70805020110221, 2.77258872223978, 2.83321334405622, 2.89037175789616, 2.94443897916644) plot(y, ylab = ylab) 5 10 Index logplot <- function(y, ylab = deparse(substitute(y))){ 15 6.2 Substitutions 13
- 14. 6.2 Substitutions logplot <- function(y, ylab = deparse(substitute(y))){ ylab y <- log(y) plot(y, ylab = ylab) “ylab”をあらかじめ } 評価しておくと良い logplot(1:19) 3.0 1:19 1.5 0.0 5 10 15 Index 14
- 15. 6.3 More on evaluation • eval関数 ‒ “call”オブジェクトを評価するときに使用 ‒ どの“環境”で評価をするのかを指定可能 – 例(親環境評価):eval(expr, > x <- sys.frame(sys.parent()) 3 > y <- 10 > eval(quote(x+y), data.frame(x = 1:10), sys.frame(sys.parent())) [1] 11 12 13 14 15 16 17 18 19 20 > eval(quote(x+y), sys.frame(sys.parent())) 先にデータの値を [1] 13 使って評価してくれる 15
- 16. 6.4 Evaluation of expression objects • Expression object(2.1.4に記載あり) – 特殊なLanguage Object – Language objectとの違い • 複数のExpressionを保持(call objectのlistみたいなもん) • eval関数に通したときのみ評価される > ex <- expression(2 + 2, 3 + 4) call objectの > ex[[1]] リストっぽく扱える 2+2 > ex[[2]] 3+4 最後に評価されたものが値として返ってくる > eval(ex) (中で評価は全部されてる) [1] 7 16
- 17. 6.4 Evaluation of expression objects • 前述の例は基本quote({2 + 2; 3 + 4})と同じ • Language objectとの違い • eval関数に通したときのみ評価される > eval(substitute(mode(x), list(x = quote(2 + 2)))) [1] "numeric" 再帰的に evalされる > eval(substitute(mode(x), list(x = expression(2 + 2)))) [1] "expression" “直に”eval関数に渡されない場合は expressionは評価されない 17
- 18. 6.4 Evaluation of expression objects > e <- quote(expression(2 + 2)) >e expressionを作るcall object expression(2 + 2) > mode(e) [1] "call" > ee <- expression(2 + 2) vs > ee expression(2 + 2) > mode(ee) 普通のexpression [1] "expression" 18
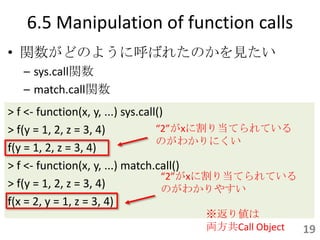
- 19. 6.5 Manipulation of function calls • 関数がどのように呼ばれたのかを見たい – sys.call関数 – match.call関数 > f <- function(x, y, ...) sys.call() > f(y = 1, 2, z = 3, 4) “2”がxに割り当てられている のがわかりにくい f(y = 1, 2, z = 3, 4) > f <- function(x, y, ...) match.call() “2”がxに割り当てられている > f(y = 1, 2, z = 3, 4) のがわかりやすい f(x = 2, y = 1, z = 3, 4) ※返り値は 両方共Call Object 19
- 20. 6.5 Manipulation of function calls • match.callは同じ引数で違う関数を呼ばれる時 によく使われる(例:lm関数の頭) vh> f <- function (formula, data, subset, weights, na.action, method = "qr", + model = TRUE, x = FALSE, y = FALSE, qr = TRUE, singular.ok = TRUE, + contrasts = NULL, offset, ...) +{ + cl <- match.call() + mf <- match.call(expand.dots = FALSE) + m <- match(c("formula", "data", "subset", "weights", "na.action", + "offset"), names(mf), 0L) + mf <- mf[c(1L, m)] + print(mf) + mf$drop.unused.levels <- TRUE + print(mf[[1L]]) 関数名だけ + mf[[1L]] <- as.name("model.frame") + print(mf) 変更して評価 + eval(mf, parent.frame()) +} 20
- 21. 6.5 Manipulation of function calls > f(y~x, data.frame(x=1:10, y = 1:10 + rnorm(10))) f(formula = y ~ x, data = data.frame(x = 1:10, y = 1:10 + rnorm(10))) f model.frame(formula = y ~ x, data = data.frame(x = 1:10, y = 1:10 + rnorm(10)), drop.unused.levels = TRUE) y x 関数名 1 1.409984 1 2 3.925316 2 変更前 3 5.449060 3 4 4.462354 4 関数名変更+項目追加 5 5.494868 5 6 6.283794 6 7 7.479154 7 8 8.675264 8 9 8.283814 9 10 9.259617 10 21
- 22. 6.5 Manipulation of function calls • match.callのexpand.dotsをFALSEにすると”…”が ひと固まりのリストとして扱われる > f <- function(x, y, ...) match.call(expand.dots = FALSE) > f(y = 1, 2, z = 3, 4) f(x = 2, y = 1, ... = list(z = 3, 4)) > f(y = 1, 2, z = 3, 4)$... $z リストとして扱われる。特に [1] 3 f(y = 1, 2, z = 3, 4)$... <- NULL [[2]] 等として要らないものを消去 [1] 4 する際に使用 22
- 23. 6.5 Manipulation of function calls • 関数呼び出しを作成する2つの関数 – call関数 – do.call関数 • call関数 – 関数名と引数のリストからcall objectを生成 • do.call関数 – call関数と似てるけど、こちら値を即評価 – modeがlistな引数に指定した関数を適用 (data.frameのmodeもlistなんで適用可能) 23
- 24. 6.5 Manipulation of function calls • 関数Callを作成する2つの関数 – call関数 – do.call関数 > f <- function(x, y, ...) sys.call() > f(y = 1, 2, z = 3, 4) “2”がxに割り当てられている のがわかりにくい f(y = 1, 2, z = 3, 4) > f <- function(x, y, ...) match.call() “2”がxに割り当てられている > f(y = 1, 2, z = 3, 4) のがわかりやすい f(x = 2, y = 1, z = 3, 4) ※返り値は 両方共Call Object 24
- 25. 6.5 Manipulation of function calls > y <- 10.5 > (e <- call("round", y)) call関数でcall objectを 生成&評価 round(10.5) > eval(e) [1] 10 > > x <- list(x = 1:5, y = 101:105, z = 1001:1005) do.call関数で > do.call("rbind", x) 引数のリストを [,1] [,2] [,3] [,4] [,5] 全て”rbind”関数 x 1 2 3 4 5 で結合し行列化 y 101 102 103 104 105 z 1001 1002 1003 1004 1005 25
- 26. 6.6 Manipulation of functions • 関数・クロージャーを操作する関数が存在 1. body:関数の中身(expression)を返却 2. formals:関数の引数を返却 3. environment:関数の環境を返却 • 関数⇔リストの相互変換 – as.list: 関数 ⇒ リスト – as.function:リスト ⇒ 関数 26
- 27. 6.6 Manipulation of functions > f.original <- function(x){x + a} > formals(f) > f <- f.original 例として $x > f(3) 使う関数 > environment(f) 以下にエラー f(3) : オブ <environment: R_GlobalEnv> ジェクト ‘a’ がありません > body(f) <- quote(5^x) > body(f) > #body(f) <- expression(5^x) { >f x+a function (x) } 5^x 関数の中身 を変更できる 27
- 28. 6.6 Manipulation of functions 変更された関数 3(x) + 10(a) = 13 > f(3) 5^3 = 125として評価 f(3) > と評価される [1] 125 [1] 13 > > > f <- f.original > f <- f.original > formals(f) <- alist(x = , a = 10) > as.list(f) >f $x function (x, a = 10) [[2]] { { x+a x+a alist(の結果)をformalsに } 入れることで外から束縛 } ※alistはうまいこと”型”を割り振った”list”を作ってくれる関数 28
- 29. 6.6 Manipulation of functions > as.function(as.list(f)) function (x) 関数をリスト化した後、 { 再関数化で元通り x+a } > > f <- as.function(alist(x = ,y = 2,x + y)) > f(3) [1] 5 alistで作成したlistを関数化 29