


![LOADING UK ELECTION DATA
Using incanter's excel namespace
(ns cljds.ch1.data
(:require [incanter
[core :as i]
[excel :as xls]]
[clojure.java.io :as io]))
(defn uk-data []
(-> (io/resource "UK2010.xls")
(str)
(xls/read-xls)))
(i/view (uk-data))](https://image.slidesharecdn.com/clojurefordatascience-150903135047-lva1-app6891/85/Clojure-for-Data-Science-9-320.jpg)

![COLUMN NAMES
(defn ex-1-1 []
(i/col-names (uk-data)))
;; => ["Press Association Reference" "Constituency Name" "Region" "Elect
ion Year" "Electorate" "Votes" "AC" "AD" "AGS" "APNI" "APP" "AWL" "AWP"
"BB" "BCP" "Bean" "Best" "BGPV" "BIB" "BIC" "Blue" "BNP" "BP Elvis" "C28
" "Cam Soc" "CG" "Ch M" "Ch P" "CIP" "CITY" "CNPG" "Comm" "Comm L" "Con"
"Cor D" "CPA" "CSP" "CTDP" "CURE" "D Lab" "D Nat" "DDP" "DUP" "ED" "EIP
" "EPA" "FAWG" "FDP" "FFR" "Grn" "GSOT" "Hum" "ICHC" "IEAC" "IFED" "ILEU
" "Impact" "Ind1" "Ind2" "Ind3" "Ind4" "Ind5" "IPT" "ISGB" "ISQM" "IUK"
"IVH" "IZB" "JAC" "Joy" "JP" "Lab" "Land" "LD" "Lib" "Libert" "LIND" "LL
PB" "LTT" "MACI" "MCP" "MEDI" "MEP" "MIF" "MK" "MPEA" "MRLP" "MRP" "Nat
Lib" "NCDV" "ND" "New" "NF" "NFP" "NICF" "Nobody" "NSPS" "PBP" "PC" "Pir
ate" "PNDP" "Poet" "PPBF" "PPE" "PPNV" "Reform" "Respect" "Rest" "RRG" "
RTBP" "SACL" "Sci" "SDLP" "SEP" "SF" "SIG" "SJP" "SKGP" "SMA" "SMRA" "SN
P" "Soc" "Soc Alt" "Soc Dem" "Soc Lab" "South" "Speaker" "SSP" "TF" "TOC
" "Trust" "TUSC" "TUV" "UCUNF" "UKIP" "UPS" "UV" "VCCA" "Vote" "Wessex R
eg" "WRP" "You" "Youth" "YRDPL"]](https://image.slidesharecdn.com/clojurefordatascience-150903135047-lva1-app6891/85/Clojure-for-Data-Science-11-320.jpg)
![ELECTORATE
(defn uk-electorate []
(->> (uk-data)
(i/$ "Electorate")
(remove nil?))](https://image.slidesharecdn.com/clojurefordatascience-150903135047-lva1-app6891/85/Clojure-for-Data-Science-12-320.jpg)

![…EXPLAINED
is `(reduce + …)`.∑
is "for all xs"∑n
i=1
is a function of x and the mean of x( −xi μx )
2
(defn variance [xs]
(let [m (mean xs)
n (count xs)
square-error (fn [x]
(Math/pow (- x m) 2))]
(/ (reduce + (map square-error xs)) n)))](https://image.slidesharecdn.com/clojurefordatascience-150903135047-lva1-app6891/85/Clojure-for-Data-Science-14-320.jpg)
![HISTOGRAM
(require '[incanter.charts :as c])
(defn ex-1-11 []
(-> (uk-electorate)
(c/histogram :nbins 20)
(i/view)))](https://image.slidesharecdn.com/clojurefordatascience-150903135047-lva1-app6891/85/Clojure-for-Data-Science-15-320.jpg)
![DISTIBUTIONS AS MODELS
[PDF]http://cljds.com/matura-2013](https://image.slidesharecdn.com/clojurefordatascience-150903135047-lva1-app6891/85/Clojure-for-Data-Science-16-320.jpg)

![HONEST BAKER
(require '[incanter.distributions :as d])
(defn honest-baker []
(let [distribution (d/normal-distribution 1000 30)]
(repeatedly #(d/draw distribution))))
(defn ex-1-16 []
(-> (take 10000 (honest-baker))
(c/histogram :nbins 25)
(i/view)))](https://image.slidesharecdn.com/clojurefordatascience-150903135047-lva1-app6891/85/Clojure-for-Data-Science-18-320.jpg)
![DISHONEST BAKER
(defn dishonest-baker []
(let [distribution (d/normal-distribution 950 30)]
(->> (repeatedly #(d/draw distribution))
(partition 13)
(map (partial apply max)))))
(defn ex-1-17 []
(-> (take 10000 (dishonest-baker))
(c/histogram :nbins 25)
(i/view)))](https://image.slidesharecdn.com/clojurefordatascience-150903135047-lva1-app6891/85/Clojure-for-Data-Science-19-320.jpg)

![SELECTION
(defn filter-election-year [data]
(i/$where {"Election Year" {:$ne nil}} data))
(defn filter-victor-constituencies [data]
(i/$where {"Con" {:$fn number?} "LD" {:$fn number?}} data))](https://image.slidesharecdn.com/clojurefordatascience-150903135047-lva1-app6891/85/Clojure-for-Data-Science-21-320.jpg)
![PROJECTION
(->> (uk-data)
(filter-election-year)
(filter-victor-constituencies)
(i/$ ["Region" "Electorate" "Con" "LD"])
(i/add-derived-column "Victors" ["Con" "LD"] +)
(i/add-derived-column "Victors Share" ["Victors" "Electorate"] /)
(i/view))](https://image.slidesharecdn.com/clojurefordatascience-150903135047-lva1-app6891/85/Clojure-for-Data-Science-22-320.jpg)
![TWO VARIABLES: SCATTER PLOTS!
(defn ex-1-33 []
(let [data (->> (uk-data)
(clean-uk-data)
(derive-uk-data))]
(-> (scatter-plot ($ "Turnout" data)
($ "Victors Share" data)
:x-label "Turnout"
:y-label "Victor's Share")
(view))))](https://image.slidesharecdn.com/clojurefordatascience-150903135047-lva1-app6891/85/Clojure-for-Data-Science-23-320.jpg)


![BINNING DATA
(defn bin [n-bins xs]
(let [min-x (apply min xs)
range-x (- (apply max xs) min-x)
max-bin (dec n-bins)
bin-fn (fn [x]
(-> x
(- min-x)
(/ range-x)
(* n-bins)
int
(min max-bin)))]
(map bin-fn xs)))
(defn ex-1-10 []
(->> (uk-electorate)
(bin 10)
(frequencies)))
;; => {0 1, 1 1, 2 4, 3 22, 4 130, 5 320, 6 156, 7 15, 9 1}](https://image.slidesharecdn.com/clojurefordatascience-150903135047-lva1-app6891/85/Clojure-for-Data-Science-27-320.jpg)
![A 2D HISTOGRAM
(defn histogram-2d [xs ys n-bins]
(-> (map vector (bin n-bins xs) (bin n-bins ys))
(frequencies)))
(defn uk-histogram-2d []
(let [data (->> (uk-data)
(clean-uk-data)
(derive-uk-data))]
(histogram-2d ($ "Turnout" data) ($ "Victors Share" data) 5)))
;; => {[2 1] 59, [3 2] 91, [4 3] 32, [1 0] 8, [2 2] 89, [3 3] 101, [4 4]
60, [0 0] 2, [1 1] 22, [2 3] 19, [3 4] 53, [0 1] 6, [1 2] 15, [2 4] 5,
[1 3] 2, [0 3] 1, [3 0] 6, [4 1] 3, [3 1] 17, [4 2] 17, [2 0] 23}](https://image.slidesharecdn.com/clojurefordatascience-150903135047-lva1-app6891/85/Clojure-for-Data-Science-28-320.jpg)

![VISUALIZATION WITH QUIL
(require '[quil.core :as q])
(defn ratio->grayscale [f]
(-> f
(* 255)
(int)
(min 255)
(max 0)
(q/color)))
(defn draw-histogram [data {:keys [n-bins size]}]
(let [[width height] size
x-scale (/ width n-bins)
y-scale (/ height n-bins)
max-value (apply max (vals data))
setup (fn []
(doseq [x (range n-bins)
y (range n-bins)]
(let [v (get data [x y] 0)
x-pos (* x x-scale)
y-pos (- height (* y y-scale))]
(q/fill (ratio->grayscale (/ v max-value)))
(q/rect x-pos y-pos x-scale y-scale))))]
(q/sketch :setup setup :size size)))](https://image.slidesharecdn.com/clojurefordatascience-150903135047-lva1-app6891/85/Clojure-for-Data-Science-30-320.jpg)

![A COLOUR HEATMAP
Interpolate between the colours of the spectrum.
(defn ratio->heat [f]
(let [colors [(q/color 0 0 255) ;; blue
(q/color 0 255 255) ;; turquoise
(q/color 0 255 0) ;; green
(q/color 255 255 0) ;; yellow
(q/color 255 0 0)] ;; red
f (-> f
(max 0.000)
(min 0.999)
(* (dec (count colors))))]
(q/lerp-color (nth colors f) (nth colors (inc f)) (rem f 1))))](https://image.slidesharecdn.com/clojurefordatascience-150903135047-lva1-app6891/85/Clojure-for-Data-Science-32-320.jpg)


![REAGENT ATOMS
(require '[reagent.core :as r])
(defn randn [mean sd]
(.. js/jStat -normal (sample mean sd)))
(defn normal-distribution [mean sd]
(repeatedly #(randn mean sd)))
(def state
(r/atom {:sample []}))
(defn update-sample! [state]
(swap! state assoc :sample
(->> (normal-distribution population-mean population-sd)
(map int)
(take sample-size))))](https://image.slidesharecdn.com/clojurefordatascience-150903135047-lva1-app6891/85/Clojure-for-Data-Science-40-320.jpg)
![CREATE THE WIDGETS
(defn new-sample [state]
[:button {:on-click #(update-sample! state)} "New Sample"])
(defn sample-list [state]
[:div
(let [sample (:sample @state)]
[:div
[:ul (for [n sample] [:li n])]
[:dl
[:dt "Sample Mean:"]
[:dd (mean sample)]]])])](https://image.slidesharecdn.com/clojurefordatascience-150903135047-lva1-app6891/85/Clojure-for-Data-Science-41-320.jpg)
![LAY OUT THE INTERFACE
(defn layout-interface []
[:div
[:h1 "Normal Sample"]
[new-sample state]
[sample-list state]])
;; Render the root component
(defn run []
(r/render-component
[layout-interface]
(.getElementById js/document "root")))](https://image.slidesharecdn.com/clojurefordatascience-150903135047-lva1-app6891/85/Clojure-for-Data-Science-42-320.jpg)


![CALCULATING THE T-STATISTIC
Based entirely on our sample statistics
(defn t-statistic [sample test-mean]
(let [sample-mean (mean sample)
sample-size (count sample)
sample-sd (standard-deviation sample)]
(/ (- sample-mean test-mean)
(/ sample-sd (Math/sqrt sample-size)))))](https://image.slidesharecdn.com/clojurefordatascience-150903135047-lva1-app6891/85/Clojure-for-Data-Science-51-320.jpg)


![PEARSON'S CORRELATION
Covariance divided by the product of standard deviations. It
measures linear correlation.
ρX, Y =
COV(X,Y)
σX σY
(defn pearsons-correlation [x y]
(/ (covariance x y)
(* (standard-deviation x)
(standard-deviation y))))](https://image.slidesharecdn.com/clojurefordatascience-150903135047-lva1-app6891/85/Clojure-for-Data-Science-67-320.jpg)


![SIMPLE LINEAR REGRESSION
(defn slope [x y]
(/ (covariance x y)
(variance x)))
(defn intercept [x y]
(- (mean y)
(* (mean x)
(slope x y))))
(defn predict [a b x]
(+ a (* b x)))](https://image.slidesharecdn.com/clojurefordatascience-150903135047-lva1-app6891/85/Clojure-for-Data-Science-71-320.jpg)
![TRAINING A MODEL
(defn swimmer-data []
(->> (athlete-data)
($where {"Height, cm" {:$ne nil} "Weight" {:$ne nil}
"Sport" {:$eq "Swimming"}})))
(defn ex-3-12 []
(let [data (swimmer-data)
heights ($ "Height, cm" data)
weights (log ($ "Weight" data))
a (intercept heights weights)
b (slope heights weights)]
(println "Intercept: " a)
(println "Slope: " b)))](https://image.slidesharecdn.com/clojurefordatascience-150903135047-lva1-app6891/85/Clojure-for-Data-Science-72-320.jpg)

![MORE DATA!
(defn features [dataset col-names]
(->> (i/$ col-names dataset)
(i/to-matrix)))
(defn gender-dummy [gender]
(if (= gender "F")
0.0 1.0))
(defn ex-3-26 []
(let [data (->> (swimmer-data)
(i/add-derived-column "Gender Dummy"
["Sex"] gender-dummy))
x (features data ["Height, cm" "Age" "Gender Dummy"])
y (i/log ($ "Weight" data))
model (s/linear-model y x)]
(:coefs model)))
;; => [2.2307529431422637 0.010714697827121089 0.002372188749408574 0.09
75412532492026]](https://image.slidesharecdn.com/clojurefordatascience-150903135047-lva1-app6891/85/Clojure-for-Data-Science-74-320.jpg)


![MAKING PREDICTIONS
y = xθT
(defn predict [theta x]
(-> (cl/t theta)
(cl/* x)
(first)))
(defn ex-3-27 []
(let [data (->> (swimmer-data)
(i/add-derived-column "Gender Dummy"
["Sex"] gender-dummy))
x (features data ["Height, cm" "Age" "Gender Dummy"])
y (i/log ($ "Weight" data))
model (s/linear-model y x)]
(i/exp (predict (i/matrix (:coefs model))
(i/matrix [1 185 22 1])))))
;; => 78.46882772631697](https://image.slidesharecdn.com/clojurefordatascience-150903135047-lva1-app6891/85/Clojure-for-Data-Science-77-320.jpg)


![STANDARD ERROR FOR A PROPORTION
SE =
p(1 − p)
n
‾ ‾‾‾‾‾‾‾‾
√
(defn standard-error-proportion [p n]
(-> (- 1 p)
(* p)
(/ n)
(Math/sqrt)))
= = 0.61
161 + 339
682 + 127
500
809
SE = 0.013](https://image.slidesharecdn.com/clojurefordatascience-150903135047-lva1-app6891/85/Clojure-for-Data-Science-86-320.jpg)


![OUR APPROACH DOESN'T SCALE
We can use a test.χ2
(defn ex-5-5 []
(let [observations (i/matrix [[200 119 181] [123 158 528]])]
(s/chisq-test :table observations)))
How likely is that this distribution occurred via chance?
{:X-sq 127.85915643930326, :col-levels (0 1 2), :row-margins {0 500.0, 1
809.0}, :table [matrix] , :p-value 1.7208259588256175E-28, :df 2, :prob
s nil, :col-margins {0 323.0, 1 277.0, 2 709.0}, :E (123.37662337662337
199.62337662337663 105.80595874713522 171.1940412528648 270.817417876241
4 438.1825821237586), :row-levels (0 1), :two-samp? true, :N 1309.0}](https://image.slidesharecdn.com/clojurefordatascience-150903135047-lva1-app6891/85/Clojure-for-Data-Science-89-320.jpg)


![IMPLEMENTING A NAIVE BAYES MODEL
(defn safe-inc [v]
(inc (or v 0)))
(defn inc-class-total [model class]
(update-in model [class :total] safe-inc))
(defn inc-predictors-count-fn [row class]
(fn [model attr]
(let [val (get row attr)]
(update-in model [class attr val] safe-inc))))](https://image.slidesharecdn.com/clojurefordatascience-150903135047-lva1-app6891/85/Clojure-for-Data-Science-96-320.jpg)
![IMPLEMENTING A NAIVE BAYES MODEL
(defn assoc-row-fn [class-attr predictors]
(fn [model row]
(let [class (get row class-attr)]
(reduce (inc-predictors-count-fn row class)
(inc-class-total model class)
predictors))))
(defn naive-bayes [data class-attr predictors]
(reduce (assoc-row-fn class-attr predictors) {} data))](https://image.slidesharecdn.com/clojurefordatascience-150903135047-lva1-app6891/85/Clojure-for-Data-Science-97-320.jpg)
![NAIVE BAYES MODEL
(defn ex-5-6 []
(let [data (titanic-samples)]
(pprint (naive-bayes data :survived [:gender :class]))))
…produces the following output…
;; {false
;; {:class {:third 528, :second 158, :first 123},
;; :gender {:male 682, :female 127},
;; :total 809},
;; true
;; {:class {:third 181, :second 119, :first 198},
;; :gender {:male 161, :female 337},
;; :total 498}}](https://image.slidesharecdn.com/clojurefordatascience-150903135047-lva1-app6891/85/Clojure-for-Data-Science-98-320.jpg)
![MAKING PREDICTIONS
(defn n [model]
(->> (vals model)
(map :total)
(apply +)))
(defn conditional-probability [model test class]
(let [evidence (get model class)
prior (/ (:total evidence)
(n model))]
(apply * prior
(for [kv test]
(/ (get-in evidence kv)
(:total evidence))))))
(defn bayes-classify [model test]
(let [probs (map (fn [class]
[class (conditional-probability model test class)])
(keys model))]
(-> (sort-by second > probs)
(ffirst))))](https://image.slidesharecdn.com/clojurefordatascience-150903135047-lva1-app6891/85/Clojure-for-Data-Science-99-320.jpg)
![DOES IT WORK?
(defn ex-5-7 []
(let [data (titanic-samples)
model (naive-bayes data :survived [:gender :class])]
(bayes-classify model {:gender :male :class :third})))
;; => false
(defn ex-5-8 []
(let [data (titanic-samples)
model (naive-bayes data :survived [:gender :class])]
(bayes-classify model {:gender :female :class :first})))
;; => true](https://image.slidesharecdn.com/clojurefordatascience-150903135047-lva1-app6891/85/Clojure-for-Data-Science-100-320.jpg)


![THE LOGISTIC FUNCTION
(defn logistic-function [theta]
(let [tt (matrix/transpose (vec theta))
z (fn [x] (- (matrix/mmul tt (vec x))))]
(fn [x]
(/ 1 (+ 1 (Math/exp (z x)))))))](https://image.slidesharecdn.com/clojurefordatascience-150903135047-lva1-app6891/85/Clojure-for-Data-Science-105-320.jpg)
![INTERPRETATION
(let [f (logistic-function [0])]
(f [1])
;; => 0.5
(f [-1])
;; => 0.5
(f [42])
;; => 0.5
)
(let [f (logistic-function [0.2])
g (logistic-function [-0.2])]
(f [5])
;; => 0.73
(g [5])
;; => 0.27
)](https://image.slidesharecdn.com/clojurefordatascience-150903135047-lva1-app6891/85/Clojure-for-Data-Science-106-320.jpg)
![COST FUNCTION
Cost varies between 0 and (a big number).
(defn cost-function [y y-hat]
(- (if (zero? y)
(Math/log (max (- 1 y-hat) Double/MIN_VALUE))
(Math/log (max y-hat (Double/MIN_VALUE))))))
(defn logistic-cost [ys y-hats]
(avg (map cost-function ys y-hats)))](https://image.slidesharecdn.com/clojurefordatascience-150903135047-lva1-app6891/85/Clojure-for-Data-Science-107-320.jpg)
![CONVERTING TITANIC DATA TO FEATURES
(defn titanic-features []
(remove (partial some nil?)
(for [row (titanic-data)]
[(:survived row)
(:pclass row)
(:sibsp row)
(:parch row)
(if (nil? (:age row)) 30 (:age row))
(if (= (:sex row) "female") 1.0 0.0)
(if (= (:embarked row) "S") 1.0 0.0)
(if (= (:embarked row) "C") 1.0 0.0)
(if (= (:embarked row) "Q") 1.0 0.0)])))](https://image.slidesharecdn.com/clojurefordatascience-150903135047-lva1-app6891/85/Clojure-for-Data-Science-108-320.jpg)
![CALCULATING THE GRADIENT
(defn gradient-fn [h-theta xs ys]
(let [g (fn [x y]
(matrix/mmul (- (h-theta x) y) x))]
(->> (map g xs ys)
(matrix/transpose)
(map avg))))
We transpose to calculate the average for each feature
across all xs rather than average for each x across all
features.](https://image.slidesharecdn.com/clojurefordatascience-150903135047-lva1-app6891/85/Clojure-for-Data-Science-109-320.jpg)

![APACHE COMMONS MATH
Provides heavy-lifting for running tasks like gradient descent.
(:import [org.apache.commons.math3.analysis MultivariateFunction Multiva
riateVectorFunction]
[org.apache.commons.math3.optim InitialGuess MaxEval SimpleBoun
ds OptimizationData SimpleValueChecker PointValuePair]
[org.apache.commons.math3.optim.nonlinear.scalar ObjectiveFunct
ion ObjectiveFunctionGradient GoalType]
[org.apache.commons.math3.optim.nonlinear.scalar.gradient NonLi
nearConjugateGradientOptimizer NonLinearConjugateGradientOptimizer$Formu
la])](https://image.slidesharecdn.com/clojurefordatascience-150903135047-lva1-app6891/85/Clojure-for-Data-Science-111-320.jpg)
![CLOJURE'S JAVA INTEROP
An object wrapper to represent a function: too many levels of
indirection?!
(defn objective-function [f]
(ObjectiveFunction. (reify MultivariateFunction
(value [_ v]
(apply f (vec v))))))
(defn objective-function-gradient [f]
(ObjectiveFunctionGradient. (reify MultivariateVectorFunction
(value [_ v]
(double-array
(apply f (vec v)))))))](https://image.slidesharecdn.com/clojurefordatascience-150903135047-lva1-app6891/85/Clojure-for-Data-Science-112-320.jpg)
![GRADIENT DESCENT
(defn make-ncg-optimizer []
(NonLinearConjugateGradientOptimizer.
NonLinearConjugateGradientOptimizer$Formula/FLETCHER_REEVES
(SimpleValueChecker. (double 1e-6) (double 1e-6))))
(defn initial-guess [guess]
(InitialGuess. (double-array guess)))
(defn max-evaluations [n]
(MaxEval. n))
(defn gradient-descent [f g estimate n]
(let [options (into-array OptimizationData
[(objective-function f)
(objective-function-gradient g)
(initial-guess estimate)
(max-evaluations n)
GoalType/MINIMIZE])]
(-> (make-ncg-optimizer)
(.optimize options)
(.getPoint)
(vec))))](https://image.slidesharecdn.com/clojurefordatascience-150903135047-lva1-app6891/85/Clojure-for-Data-Science-113-320.jpg)
![RUNNING GRADIENT DESCENT
(defn run-logistic-regression [data initial-guess]
(let [points (titanic-features)
xs (->> points (map rest) (map #(cons 1 %)))
ys (map first points)]
(gradient-descent
(fn [& theta]
(let [f (logistic-function theta)]
(logistic-cost (map f xs) ys)))
(fn [& theta]
(gradient-fn (logistic-function theta) xs ys))
initial-guess
2000)))](https://image.slidesharecdn.com/clojurefordatascience-150903135047-lva1-app6891/85/Clojure-for-Data-Science-114-320.jpg)
![PRODUCING A MODEL
(defn ex-5-11 []
(let [data (titanic-features)
initial-guess (-> data first count (take (repeatedly rand)))]
(run-logistic-regression data initial-guess)))](https://image.slidesharecdn.com/clojurefordatascience-150903135047-lva1-app6891/85/Clojure-for-Data-Science-115-320.jpg)
![MAKING PREDICTIONS
(def theta
[0.690807824623404 -0.9033828001369435 -0.3114375278698766 -0.01894319
673287219 -0.03100315579768661 2.5894858366033273 0.7939190708193374 1.3
711334887947388 0.6672555257828919])
(defn round [x]
(Math/round x))
(def logistic-model
(logistic-function theta))
(defn ex-5-13 []
(let [data (titanic-features)
test (fn [x]
(= (round (logistic-model (cons 1 (rest x))))
(round (first x))))
results (frequencies (map test data))]
(/ (get results true)
(apply + (vals results)))))
;; => 1030/1309](https://image.slidesharecdn.com/clojurefordatascience-150903135047-lva1-app6891/85/Clojure-for-Data-Science-116-320.jpg)


![COSINE SIMILARITY
cos(θ) =
A ⋅ B
∥A∥∥B∥
(defn cosine [a b]
(let [dot-product (->> (map * a b)
(apply +))
magnitude (fn [d]
(->> (map #(Math/pow % 2) d)
(apply +)
Math/sqrt))]
(/ dot-product
(* (magnitude a) (magnitude b)))))](https://image.slidesharecdn.com/clojurefordatascience-150903135047-lva1-app6891/85/Clojure-for-Data-Science-121-320.jpg)
![CREATING SPARSE VECTORS
(def dictionary
(atom {:count 0
:words {}}))
(defn add-word-to-dict [dict word]
(if (get-in dict [:words word])
dict
(-> dict
(update-in [:words] assoc word (get dict :count))
(update-in [:count] inc))))
(defn update-words [dict doc word]
(let [word-id (-> (swap! dict add-word-to-dict word)
(get-in [:words word]))]
(update-in doc [word-id] #(inc (or % 0)))))
(defn document-vector [dict ngrams]
(r/reduce (partial update-words dict) {} ngrams))](https://image.slidesharecdn.com/clojurefordatascience-150903135047-lva1-app6891/85/Clojure-for-Data-Science-122-320.jpg)


![PARKOUR MAPPING
(require '[clojure.core.reducers :as r]
'[parkour.mapreduce :as mr])
(defn document->terms [doc]
(clojure.string/split doc #"W+"))
(defn document-count-m
"Emits the unique words from each document"
{::mr/source-as :vals}
[documents]
(->> documents
(r/mapcat (comp distinct document->terms))
(r/map #(vector % 1))))](https://image.slidesharecdn.com/clojurefordatascience-150903135047-lva1-app6891/85/Clojure-for-Data-Science-134-320.jpg)

![PLAIN OLD FUNCTIONS
(->> (document-count-m ["it's lovely that you're musical"
"music is the food of love"
"war is the locomotive of history"])
(into []))
;; => [["love" 1] ["music" 1] ["music" 1] ["food" 1] ["love" 1] ["war" 1
] ["locomot" 1] ["histori" 1]]](https://image.slidesharecdn.com/clojurefordatascience-150903135047-lva1-app6891/85/Clojure-for-Data-Science-136-320.jpg)
![AND REDUCING…
(require '[parkour.io.dux :as dux]
'[transduce.reducers :as tr])
(defn unique-index-r
{::mr/source-as :keyvalgroups, ::mr/sink-as dux/named-keyvals}
[coll]
(let [global-offset (conf/get-long mr/*context* "mapred.task.partition
" -1)]
(tr/mapcat-state
(fn [local-offset [word counts]]
[(inc local-offset)
(if (identical? ::finished word)
[[:counts [global-offset local-offset]]]
[[:data [word [[global-offset local-offset] (apply + counts)]]
]])])
0 (r/mapcat identity [coll [[::finished nil]]]))))](https://image.slidesharecdn.com/clojurefordatascience-150903135047-lva1-app6891/85/Clojure-for-Data-Science-137-320.jpg)
![CREATING A JOB
(require '[parkour.graph :as pg]
'[parkour.avro :as mra]
'[abracad.avro :as avro])
(def long-pair (avro/tuple-schema [:long :long]))
(def index-value (avro/tuple-schema [long-pair :long]))
(defn df-j [dseq]
(-> (pg/input dseq)
(pg/map #'document-count-m)
(pg/partition (mra/shuffle [:string :long]))
(pg/reduce #'unique-index-r)
(pg/output :data (mra/dsink [:string index-value])
:counts (mra/dsink [:long :long]))))](https://image.slidesharecdn.com/clojurefordatascience-150903135047-lva1-app6891/85/Clojure-for-Data-Science-138-320.jpg)
![WRITING TO DISTRIBUTED CACHE
(require '[parkour.io.dval :as dval])
(defn calculate-offsets
"Build map of offsets from dseq of counts."
[dseq]
(->> dseq
(into [])
(sort-by first)
(reductions (fn [[_ t] [i n]]
[(inc i) (+ t n)])
[0 0])
(into {})))
(defn df-execute [conf dseq]
(let [[df-data df-counts] (pg/execute (df-j dseq) conf `df)
offsets-dval (dval/edn-dval (calculate-offsets df-counts))]
...))](https://image.slidesharecdn.com/clojurefordatascience-150903135047-lva1-app6891/85/Clojure-for-Data-Science-139-320.jpg)
![READING FROM DISTRIBUTED CACHE
(defn global-id
"Use offsets to calculate unique id from global and local offset"
[offsets [global-offset local-offset]]
(+ local-offset (get offsets global-offset)))
(defn words-idf-m
"Calculate the unique id and inverse document frequency for each word"
{::mr/sink-as :keys}
[offsets-dval n coll]
(let [offsets @offsets-dval]
(r/map
(fn [[word [word-offset df]]]
[word (global-id offsets word-offset) (Math/log (/ n df))])
coll)))
(defn make-dictionary [conf df-data df-counts doc-count]
(let [offsets-dval (dval/edn-dval (calculate-offsets df-counts))]
(-> (pg/input df-data)
(pg/map #'words-idf-m offsets-dval doc-count)
(pg/output (mra/dsink [words]))
(pg/fexecute conf `idf)
(->> (r/map parse-idf)
(into {}))
(dval/edn-dval))))](https://image.slidesharecdn.com/clojurefordatascience-150903135047-lva1-app6891/85/Clojure-for-Data-Science-140-320.jpg)
![CREATING TEXT VECTORS
(import '[org.apache.mahout.math RandomAccessSparseVector])
(defn create-sparse-vector [dictionary [id doc]]
(let [vector (RandomAccessSparseVector. (count dictionary))]
(doseq [[term freq] (-> doc document->terms frequencies)]
(let [term-info (get dictionary term)]
(.setQuick vector (:id term-info) (* freq (:idf term-info)))))
[id vector]))
(defn create-vectors-m [dictionary coll]
(let [dictionary @dictionary]
(r/map #(create-sparse-vector dictionary %) coll)))](https://image.slidesharecdn.com/clojurefordatascience-150903135047-lva1-app6891/85/Clojure-for-Data-Science-141-320.jpg)
![THE FINISHED JOB
(import '[org.apache.hadoop.io Text]
'[org.apache.mahout.math VectorWritable])
(defn tfidf [conf dseq dictionary-path vector-path]
(let [doc-count (->> dseq (into []) count)
[df-data df-counts] (pg/execute (df-j dseq) conf `df)
dictionary-dval (make-dictionary conf df-data df-counts doc-coun
t)]
(write-dictionary dictionary-path dictionary-dval)
(-> (pg/input dseq)
(pg/map #'create-vectors-m dictionary-dval)
(pg/output (seqf/dsink [Text VectorWritable] vector-path))
(pg/fexecute conf `vectorize))))
(defn tool [conf input output]
(let [dseq (seqf/dseq input)
dictionary-path (doto (str output "/dictionary") fs/path-delete)
vector-path (doto (str output "/vectors") fs/path-delete)]
(tfidf conf dseq dictionary-path vector-path)))
(defn -main [& args]
(System/exit (tool/run tool args)))](https://image.slidesharecdn.com/clojurefordatascience-150903135047-lva1-app6891/85/Clojure-for-Data-Science-142-320.jpg)
![RUN THE JOB
(defn ex-6-14 []
(let [input "data/reuters-sequencefile"
output "data/parkour-vectors"]
(tool/run vectorizer/tool [input output])))](https://image.slidesharecdn.com/clojurefordatascience-150903135047-lva1-app6891/85/Clojure-for-Data-Science-143-320.jpg)


![[1062BPY12001] Data analysis with R / week 2](https://cdn.slidesharecdn.com/ss_thumbnails/dataanalyzer01-180307063046-thumbnail.jpg?width=560&fit=bounds)


Ad
More Related Content
What's hot (20)
Viewers also liked (13)


Ad
Similar to Clojure for Data Science (20)


Ad
Recently uploaded (20)


Clojure for Data Science
- 2. WHY AM I GIVING THIS TALK? I am in the final stages of writing Clojure for Data Science. It will be published by later this year.http://packtpub.com
- 3. AM I QUALIFIED? I co-founded and was CTO of a data analytics company. I am a software engineer, not a statistician.
- 4. WHY IS DATA SCIENCE IMPORTANT? The robots are coming! The rise of the computational developer. These trends influence the kinds of systems we are all expected to build.
- 5. WHY CLOJURE? Clojure lends itself to interactive exploration and learning. It has fantastic data manipulating abstractions. The JVM hosts many of the workhorse data storage and processing frameworks.
- 6. WHAT I WILL COVER Distributions Statistics Visualisation with Quil Correlation Simple linear regression Multivariable linear regression with Incanter Break Categorical data Bayes classification Logistic regression with Apache Commons Math Clustering with Parkour and Apache Mahout
- 7. FOLLOW ALONG The book's GitHub is available at http://github.com/clojuredatascience ch1-introduction ch2-statistical-inference ch3-linear-regression ch5-classification ch6-clustering
- 8. PART 1: SPOTTING ELECTION FRAUD
- 9. LOADING UK ELECTION DATA Using incanter's excel namespace (ns cljds.ch1.data (:require [incanter [core :as i] [excel :as xls]] [clojure.java.io :as io])) (defn uk-data [] (-> (io/resource "UK2010.xls") (str) (xls/read-xls))) (i/view (uk-data))
- 10. IF YOU'RE FOLLOWING ALONG git clone [email protected]:clojuredatascience/ch1-introduction.git cd ch1-introduction script/download-data.sh lein run -e 1.1
- 11. COLUMN NAMES (defn ex-1-1 [] (i/col-names (uk-data))) ;; => ["Press Association Reference" "Constituency Name" "Region" "Elect ion Year" "Electorate" "Votes" "AC" "AD" "AGS" "APNI" "APP" "AWL" "AWP" "BB" "BCP" "Bean" "Best" "BGPV" "BIB" "BIC" "Blue" "BNP" "BP Elvis" "C28 " "Cam Soc" "CG" "Ch M" "Ch P" "CIP" "CITY" "CNPG" "Comm" "Comm L" "Con" "Cor D" "CPA" "CSP" "CTDP" "CURE" "D Lab" "D Nat" "DDP" "DUP" "ED" "EIP " "EPA" "FAWG" "FDP" "FFR" "Grn" "GSOT" "Hum" "ICHC" "IEAC" "IFED" "ILEU " "Impact" "Ind1" "Ind2" "Ind3" "Ind4" "Ind5" "IPT" "ISGB" "ISQM" "IUK" "IVH" "IZB" "JAC" "Joy" "JP" "Lab" "Land" "LD" "Lib" "Libert" "LIND" "LL PB" "LTT" "MACI" "MCP" "MEDI" "MEP" "MIF" "MK" "MPEA" "MRLP" "MRP" "Nat Lib" "NCDV" "ND" "New" "NF" "NFP" "NICF" "Nobody" "NSPS" "PBP" "PC" "Pir ate" "PNDP" "Poet" "PPBF" "PPE" "PPNV" "Reform" "Respect" "Rest" "RRG" " RTBP" "SACL" "Sci" "SDLP" "SEP" "SF" "SIG" "SJP" "SKGP" "SMA" "SMRA" "SN P" "Soc" "Soc Alt" "Soc Dem" "Soc Lab" "South" "Speaker" "SSP" "TF" "TOC " "Trust" "TUSC" "TUV" "UCUNF" "UKIP" "UPS" "UV" "VCCA" "Vote" "Wessex R eg" "WRP" "You" "Youth" "YRDPL"]
- 12. ELECTORATE (defn uk-electorate [] (->> (uk-data) (i/$ "Electorate") (remove nil?))
- 13. VARIANCE ( −1 n ∑n i=1 xi μx ) 2
- 14. …EXPLAINED is `(reduce + …)`.∑ is "for all xs"∑n i=1 is a function of x and the mean of x( −xi μx ) 2 (defn variance [xs] (let [m (mean xs) n (count xs) square-error (fn [x] (Math/pow (- x m) 2))] (/ (reduce + (map square-error xs)) n)))
- 15. HISTOGRAM (require '[incanter.charts :as c]) (defn ex-1-11 [] (-> (uk-electorate) (c/histogram :nbins 20) (i/view)))
- 17. POINCARÉ'S BREAD Poincaré weighed his bread every day for a year. He discovered that the weights of the bread followed a normal distribution, but that the peak was at 950g, whereas loaves of bread were supposed to be regulated at 1kg. He reported his baker to the authorities. The next year Poincaré continued to weigh his bread from the same baker, who was now wary of giving him the lighter loaves. After a year the mean loaf weight was 1kg, but this time the distribution had a positive skew. This is consistent with the baker giving Poincaré only the heaviest of his loaves. The baker was reported to the authorities again
- 18. HONEST BAKER (require '[incanter.distributions :as d]) (defn honest-baker [] (let [distribution (d/normal-distribution 1000 30)] (repeatedly #(d/draw distribution)))) (defn ex-1-16 [] (-> (take 10000 (honest-baker)) (c/histogram :nbins 25) (i/view)))
- 19. DISHONEST BAKER (defn dishonest-baker [] (let [distribution (d/normal-distribution 950 30)] (->> (repeatedly #(d/draw distribution)) (partition 13) (map (partial apply max))))) (defn ex-1-17 [] (-> (take 10000 (dishonest-baker)) (c/histogram :nbins 25) (i/view)))
- 20. THE IMPORTANCE OF VISUALISATION Anscombe's Quartet: all have identical mean and variance.
- 21. SELECTION (defn filter-election-year [data] (i/$where {"Election Year" {:$ne nil}} data)) (defn filter-victor-constituencies [data] (i/$where {"Con" {:$fn number?} "LD" {:$fn number?}} data))
- 22. PROJECTION (->> (uk-data) (filter-election-year) (filter-victor-constituencies) (i/$ ["Region" "Electorate" "Con" "LD"]) (i/add-derived-column "Victors" ["Con" "LD"] +) (i/add-derived-column "Victors Share" ["Victors" "Electorate"] /) (i/view))
- 23. TWO VARIABLES: SCATTER PLOTS! (defn ex-1-33 [] (let [data (->> (uk-data) (clean-uk-data) (derive-uk-data))] (-> (scatter-plot ($ "Turnout" data) ($ "Victors Share" data) :x-label "Turnout" :y-label "Victor's Share") (view))))
- 24. UK VOTES SCATTER
- 25. RUSSIA IS A BIGGER COUNTRY
- 26. WE NEED A BETTER VISUALIZATION
- 27. BINNING DATA (defn bin [n-bins xs] (let [min-x (apply min xs) range-x (- (apply max xs) min-x) max-bin (dec n-bins) bin-fn (fn [x] (-> x (- min-x) (/ range-x) (* n-bins) int (min max-bin)))] (map bin-fn xs))) (defn ex-1-10 [] (->> (uk-electorate) (bin 10) (frequencies))) ;; => {0 1, 1 1, 2 4, 3 22, 4 130, 5 320, 6 156, 7 15, 9 1}
- 28. A 2D HISTOGRAM (defn histogram-2d [xs ys n-bins] (-> (map vector (bin n-bins xs) (bin n-bins ys)) (frequencies))) (defn uk-histogram-2d [] (let [data (->> (uk-data) (clean-uk-data) (derive-uk-data))] (histogram-2d ($ "Turnout" data) ($ "Victors Share" data) 5))) ;; => {[2 1] 59, [3 2] 91, [4 3] 32, [1 0] 8, [2 2] 89, [3 3] 101, [4 4] 60, [0 0] 2, [1 1] 22, [2 3] 19, [3 4] 53, [0 1] 6, [1 2] 15, [2 4] 5, [1 3] 2, [0 3] 1, [3 0] 6, [4 1] 3, [3 1] 17, [4 2] 17, [2 0] 23}
- 30. VISUALIZATION WITH QUIL (require '[quil.core :as q]) (defn ratio->grayscale [f] (-> f (* 255) (int) (min 255) (max 0) (q/color))) (defn draw-histogram [data {:keys [n-bins size]}] (let [[width height] size x-scale (/ width n-bins) y-scale (/ height n-bins) max-value (apply max (vals data)) setup (fn [] (doseq [x (range n-bins) y (range n-bins)] (let [v (get data [x y] 0) x-pos (* x x-scale) y-pos (- height (* y y-scale))] (q/fill (ratio->grayscale (/ v max-value))) (q/rect x-pos y-pos x-scale y-scale))))] (q/sketch :setup setup :size size)))
- 31. A 2D HISTOGRAM
- 32. A COLOUR HEATMAP Interpolate between the colours of the spectrum. (defn ratio->heat [f] (let [colors [(q/color 0 0 255) ;; blue (q/color 0 255 255) ;; turquoise (q/color 0 255 0) ;; green (q/color 255 255 0) ;; yellow (q/color 255 0 0)] ;; red f (-> f (max 0.000) (min 0.999) (* (dec (count colors))))] (q/lerp-color (nth colors f) (nth colors (inc f)) (rem f 1))))
- 33. A FINISHED HEATMAP $> lein run -e 1.36
- 34. CREDIT Proceedings of the National Academy of Sciences, titled "Statistical Detection of Election Irregularities," a team led by Santa Fe Institute External Professor Stefan Thurner
- 35. INFERENCE
- 36. WHAT ARE STATISTICS ANYWAY? They are estimates of values, based on a sample.
- 37. WHAT ARE PARAMETERS? They are the true values, based on the entire population.
- 38. SAMPLING SIZE The values converge as the sample size increases. We can often only infer the population parameters. Sample Population n N X¯ μX SX σX
- 39. REAGENT (def population-mean 100) (def population-sd 20) (def sample-size 10)
- 40. REAGENT ATOMS (require '[reagent.core :as r]) (defn randn [mean sd] (.. js/jStat -normal (sample mean sd))) (defn normal-distribution [mean sd] (repeatedly #(randn mean sd))) (def state (r/atom {:sample []})) (defn update-sample! [state] (swap! state assoc :sample (->> (normal-distribution population-mean population-sd) (map int) (take sample-size))))
- 41. CREATE THE WIDGETS (defn new-sample [state] [:button {:on-click #(update-sample! state)} "New Sample"]) (defn sample-list [state] [:div (let [sample (:sample @state)] [:div [:ul (for [n sample] [:li n])] [:dl [:dt "Sample Mean:"] [:dd (mean sample)]]])])
- 42. LAY OUT THE INTERFACE (defn layout-interface [] [:div [:h1 "Normal Sample"] [new-sample state] [sample-list state]]) ;; Render the root component (defn run [] (r/render-component [layout-interface] (.getElementById js/document "root")))
- 43. COMPILE THE CLJS $> lein cljsbuild once
- 44. DEMO
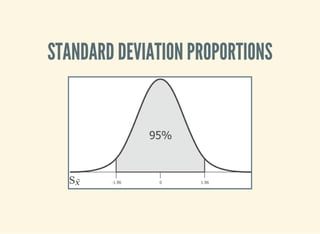
- 45. STANDARD ERROR It's the standard deviation of the sample means. SE = σX n√
- 46. STANDARD ERROR Let's see how the standard error changes with sample size.
- 47. DEMO
- 49. SMALL SAMPLES The standard error is calculated from the population standard deviation, but we don't know it! In practice they're assumed to be the same above around 30 samples, but there is another distribution that models the loss of precision with small samples.
- 50. T-DISTRIBUTION
- 51. CALCULATING THE T-STATISTIC Based entirely on our sample statistics (defn t-statistic [sample test-mean] (let [sample-mean (mean sample) sample-size (count sample) sample-sd (standard-deviation sample)] (/ (- sample-mean test-mean) (/ sample-sd (Math/sqrt sample-size)))))
- 52. DEMO
- 53. WHY THIS INTEREST IN MEANS? Because often when we want to know if a difference in populations is statistically significant, we'll compare the means.
- 54. HYPOTHESIS TESTING By convention the data is assumed not to support what the researcher is looking for. This conservative assumption is called the null hypothesis and denoted .h0 The alternate hypothesis, , can then only be supported with a given confidence interval. h1
- 55. SIGNIFICANCE The greater the significance of a result, the more certainty we have that the null hypothesis can be rejected. Let's use our range controller to adjust the significance threshold.
- 56. DEMO
- 57. PREDICTION
- 58. QUESTION What was Olympic swimmer Mark Spitz' competition weight?
- 59. POPULATION OF OLYMPIC SWIMMERS The Guardian has helpfully provided data on the vital statistics of Olympians http://www.theguardian.com/sport/datablog/2012/aug/07/olym 2012-athletes-age-weight-height#data
- 60. WEIGHT HISTOGRAM
- 62. LOG-NORMAL DISTRIBUTION "A variable might be modeled as log-normal if it can be thought of as the multiplicative product of many independent random variables, each of which is positive. This is justified by considering the central limit theorem in the log-domain."
- 63. SCATTER PLOT
- 64. WHAT IS CORRELATION ANYWAY? We've talked about variance in the context of the normal distribution.
- 65. COVARIANCE How much things vary together! COV(X, Y) = ( − )( − ) 1 n ∑n i=1 xi μx yi μy
- 66. CORRELATION A few ways of measuring it, depending on whether your data is continuous or discrete http://xkcd.com/552/
- 67. PEARSON'S CORRELATION Covariance divided by the product of standard deviations. It measures linear correlation. ρX, Y = COV(X,Y) σX σY (defn pearsons-correlation [x y] (/ (covariance x y) (* (standard-deviation x) (standard-deviation y))))
- 68. PEARSON'S CORRELATION If is 0, it doesn’t necessarily mean that the variables are not correlated. Pearson’s correlation only measures linear relationships. r
- 69. THIS IS A STATISTIC The unknown population parameter for correlation is the Greek letter . We are only able to calculate the sample statistic . ρ r How far we can trust as an estimate of will depend on two factors: r ρ the size of the coefficient the size of the sample rX, Y = COV(X,Y) sX sY
- 70. SIMPLE LINEAR REGRESSION y = α + βx
- 71. SIMPLE LINEAR REGRESSION (defn slope [x y] (/ (covariance x y) (variance x))) (defn intercept [x y] (- (mean y) (* (mean x) (slope x y)))) (defn predict [a b x] (+ a (* b x)))
- 72. TRAINING A MODEL (defn swimmer-data [] (->> (athlete-data) ($where {"Height, cm" {:$ne nil} "Weight" {:$ne nil} "Sport" {:$eq "Swimming"}}))) (defn ex-3-12 [] (let [data (swimmer-data) heights ($ "Height, cm" data) weights (log ($ "Weight" data)) a (intercept heights weights) b (slope heights weights)] (println "Intercept: " a) (println "Slope: " b)))
- 73. MAKING A PREDICTION (predict 1.691 0.0143 185) ;; => 4.3365 (i/exp (predict 1.691 0.0143 185)) ;; => 76.44 Corresponding to a predicted weight of 76.4kg In 1979, Mark Spitz was 79kg. http://www.topendsports.com/sport/swimming/profiles/spitz- mark.htm
- 74. MORE DATA! (defn features [dataset col-names] (->> (i/$ col-names dataset) (i/to-matrix))) (defn gender-dummy [gender] (if (= gender "F") 0.0 1.0)) (defn ex-3-26 [] (let [data (->> (swimmer-data) (i/add-derived-column "Gender Dummy" ["Sex"] gender-dummy)) x (features data ["Height, cm" "Age" "Gender Dummy"]) y (i/log ($ "Weight" data)) model (s/linear-model y x)] (:coefs model))) ;; => [2.2307529431422637 0.010714697827121089 0.002372188749408574 0.09 75412532492026]
- 75. MULTIVARIABLE LINEAR REGRESSION y = + +. . . +θ0 θ1 x1 θn xn
- 76. LEAST SQUARES
- 77. MAKING PREDICTIONS y = xθT (defn predict [theta x] (-> (cl/t theta) (cl/* x) (first))) (defn ex-3-27 [] (let [data (->> (swimmer-data) (i/add-derived-column "Gender Dummy" ["Sex"] gender-dummy)) x (features data ["Height, cm" "Age" "Gender Dummy"]) y (i/log ($ "Weight" data)) model (s/linear-model y x)] (i/exp (predict (i/matrix (:coefs model)) (i/matrix [1 185 22 1]))))) ;; => 78.46882772631697
- 78. HOW CLOSE? The result is around 78.47kg. Compared to 79kg, we were pretty close!
- 79. SUMMARY Distributions Statistics Visualisation with Quil Correlation Linear regression Multivariate linear regression with Incanter
- 80. INTERLUDE
- 81. CLASSIFICATION
- 82. QUESTION Did all passengers on the Titanic have an equal chance of survival?
- 83. ON THE DATA Data is based on Thomas Cason's Titanic3 dataset.
- 84. INSPECT THE DATA Class Survived Name Sex Age 1 1 Allen, Miss. Elisabeth Walton female 29 1 0 Allison, Mr. Hudson Joshua Creighton male 30
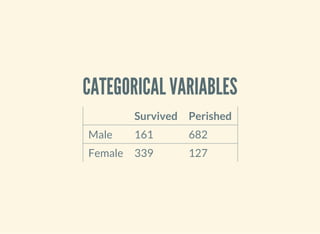
- 85. CATEGORICAL VARIABLES Survived Perished Male 161 682 Female 339 127
- 86. STANDARD ERROR FOR A PROPORTION SE = p(1 − p) n ‾ ‾‾‾‾‾‾‾‾ √ (defn standard-error-proportion [p n] (-> (- 1 p) (* p) (/ n) (Math/sqrt))) = = 0.61 161 + 339 682 + 127 500 809 SE = 0.013
- 87. HOW SIGNIFICANT? z = −p1 p2 SE P1: the proportion of women who survived is = 0.76339 446 P2: the proportion of men who survived = = 0.19161 843 SE: 0.013 z = 20.36 This is essentially impossible.
- 88. MORE CATEGORIES Survived Perished First Class 200 123 Second Class 119 158 Third Class 181 528
- 89. OUR APPROACH DOESN'T SCALE We can use a test.χ2 (defn ex-5-5 [] (let [observations (i/matrix [[200 119 181] [123 158 528]])] (s/chisq-test :table observations))) How likely is that this distribution occurred via chance? {:X-sq 127.85915643930326, :col-levels (0 1 2), :row-margins {0 500.0, 1 809.0}, :table [matrix] , :p-value 1.7208259588256175E-28, :df 2, :prob s nil, :col-margins {0 323.0, 1 277.0, 2 709.0}, :E (123.37662337662337 199.62337662337663 105.80595874713522 171.1940412528648 270.817417876241 4 438.1825821237586), :row-levels (0 1), :two-samp? true, :N 1309.0}
- 90. P-VALUE "The estimated probability of rejecting the null hypothesis of a study question when that hypothesis is true." h0
- 92. BAYES RULE P(A|B) = P(B|A)P(A) P(B) initial degree of belief in A (the prior)P(A)
- 93. BAYES TITANIC P(survive|f emale) = P(f emale|survive)P(survive) P(f emale) P(survive|f emale) = = 339 500 500 1309 446 1309 339 446
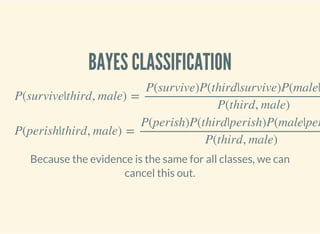
- 94. BAYES CLASSIFICATION P(survive|third, male) = P(survive)P(third|survive)P(male| P(third, male) P(perish|third, male) = P(perish)P(third|perish)P(male|per P(third, male) Because the evidence is the same for all classes, we can cancel this out.
- 95. PARSE THE DATA (titanic-samples) ;; => ({:survived true, :gender :female, :class :first, :embarked "S", : age "20-30"} {:survived true, :gender :male, :class :first, :embarked "S ", :age "30-40"} ...)
- 96. IMPLEMENTING A NAIVE BAYES MODEL (defn safe-inc [v] (inc (or v 0))) (defn inc-class-total [model class] (update-in model [class :total] safe-inc)) (defn inc-predictors-count-fn [row class] (fn [model attr] (let [val (get row attr)] (update-in model [class attr val] safe-inc))))
- 97. IMPLEMENTING A NAIVE BAYES MODEL (defn assoc-row-fn [class-attr predictors] (fn [model row] (let [class (get row class-attr)] (reduce (inc-predictors-count-fn row class) (inc-class-total model class) predictors)))) (defn naive-bayes [data class-attr predictors] (reduce (assoc-row-fn class-attr predictors) {} data))
- 98. NAIVE BAYES MODEL (defn ex-5-6 [] (let [data (titanic-samples)] (pprint (naive-bayes data :survived [:gender :class])))) …produces the following output… ;; {false ;; {:class {:third 528, :second 158, :first 123}, ;; :gender {:male 682, :female 127}, ;; :total 809}, ;; true ;; {:class {:third 181, :second 119, :first 198}, ;; :gender {:male 161, :female 337}, ;; :total 498}}
- 99. MAKING PREDICTIONS (defn n [model] (->> (vals model) (map :total) (apply +))) (defn conditional-probability [model test class] (let [evidence (get model class) prior (/ (:total evidence) (n model))] (apply * prior (for [kv test] (/ (get-in evidence kv) (:total evidence)))))) (defn bayes-classify [model test] (let [probs (map (fn [class] [class (conditional-probability model test class)]) (keys model))] (-> (sort-by second > probs) (ffirst))))
- 100. DOES IT WORK? (defn ex-5-7 [] (let [data (titanic-samples) model (naive-bayes data :survived [:gender :class])] (bayes-classify model {:gender :male :class :third}))) ;; => false (defn ex-5-8 [] (let [data (titanic-samples) model (naive-bayes data :survived [:gender :class])] (bayes-classify model {:gender :female :class :first}))) ;; => true
- 101. WHY NAIVE? Because it assumes all variables are independent. We know they are not (e.g. being male and in third class) but naive bayes weights all attributes equally. In practice it works surprisingly well, particularly where there are large numbers of features.
- 102. LOGISTIC REGRESSION
- 103. LOGISTIC REGRESSION Logistic regression uses similar techniques to linear regression but guarantees an output only between 0 and 1. (x) = xhθ θT (x) = g( x)hθ θT Where the sigmoid function is g(z) = 1 1 + e −z
- 105. THE LOGISTIC FUNCTION (defn logistic-function [theta] (let [tt (matrix/transpose (vec theta)) z (fn [x] (- (matrix/mmul tt (vec x))))] (fn [x] (/ 1 (+ 1 (Math/exp (z x)))))))
- 106. INTERPRETATION (let [f (logistic-function [0])] (f [1]) ;; => 0.5 (f [-1]) ;; => 0.5 (f [42]) ;; => 0.5 ) (let [f (logistic-function [0.2]) g (logistic-function [-0.2])] (f [5]) ;; => 0.73 (g [5]) ;; => 0.27 )
- 107. COST FUNCTION Cost varies between 0 and (a big number). (defn cost-function [y y-hat] (- (if (zero? y) (Math/log (max (- 1 y-hat) Double/MIN_VALUE)) (Math/log (max y-hat (Double/MIN_VALUE)))))) (defn logistic-cost [ys y-hats] (avg (map cost-function ys y-hats)))
- 108. CONVERTING TITANIC DATA TO FEATURES (defn titanic-features [] (remove (partial some nil?) (for [row (titanic-data)] [(:survived row) (:pclass row) (:sibsp row) (:parch row) (if (nil? (:age row)) 30 (:age row)) (if (= (:sex row) "female") 1.0 0.0) (if (= (:embarked row) "S") 1.0 0.0) (if (= (:embarked row) "C") 1.0 0.0) (if (= (:embarked row) "Q") 1.0 0.0)])))
- 109. CALCULATING THE GRADIENT (defn gradient-fn [h-theta xs ys] (let [g (fn [x y] (matrix/mmul (- (h-theta x) y) x))] (->> (map g xs ys) (matrix/transpose) (map avg)))) We transpose to calculate the average for each feature across all xs rather than average for each x across all features.
- 110. GRADIENT DESCENT The cost function will be lowest when the parameters are at their optimum.
- 111. APACHE COMMONS MATH Provides heavy-lifting for running tasks like gradient descent. (:import [org.apache.commons.math3.analysis MultivariateFunction Multiva riateVectorFunction] [org.apache.commons.math3.optim InitialGuess MaxEval SimpleBoun ds OptimizationData SimpleValueChecker PointValuePair] [org.apache.commons.math3.optim.nonlinear.scalar ObjectiveFunct ion ObjectiveFunctionGradient GoalType] [org.apache.commons.math3.optim.nonlinear.scalar.gradient NonLi nearConjugateGradientOptimizer NonLinearConjugateGradientOptimizer$Formu la])
- 112. CLOJURE'S JAVA INTEROP An object wrapper to represent a function: too many levels of indirection?! (defn objective-function [f] (ObjectiveFunction. (reify MultivariateFunction (value [_ v] (apply f (vec v)))))) (defn objective-function-gradient [f] (ObjectiveFunctionGradient. (reify MultivariateVectorFunction (value [_ v] (double-array (apply f (vec v)))))))
- 113. GRADIENT DESCENT (defn make-ncg-optimizer [] (NonLinearConjugateGradientOptimizer. NonLinearConjugateGradientOptimizer$Formula/FLETCHER_REEVES (SimpleValueChecker. (double 1e-6) (double 1e-6)))) (defn initial-guess [guess] (InitialGuess. (double-array guess))) (defn max-evaluations [n] (MaxEval. n)) (defn gradient-descent [f g estimate n] (let [options (into-array OptimizationData [(objective-function f) (objective-function-gradient g) (initial-guess estimate) (max-evaluations n) GoalType/MINIMIZE])] (-> (make-ncg-optimizer) (.optimize options) (.getPoint) (vec))))
- 114. RUNNING GRADIENT DESCENT (defn run-logistic-regression [data initial-guess] (let [points (titanic-features) xs (->> points (map rest) (map #(cons 1 %))) ys (map first points)] (gradient-descent (fn [& theta] (let [f (logistic-function theta)] (logistic-cost (map f xs) ys))) (fn [& theta] (gradient-fn (logistic-function theta) xs ys)) initial-guess 2000)))
- 115. PRODUCING A MODEL (defn ex-5-11 [] (let [data (titanic-features) initial-guess (-> data first count (take (repeatedly rand)))] (run-logistic-regression data initial-guess)))
- 116. MAKING PREDICTIONS (def theta [0.690807824623404 -0.9033828001369435 -0.3114375278698766 -0.01894319 673287219 -0.03100315579768661 2.5894858366033273 0.7939190708193374 1.3 711334887947388 0.6672555257828919]) (defn round [x] (Math/round x)) (def logistic-model (logistic-function theta)) (defn ex-5-13 [] (let [data (titanic-features) test (fn [x] (= (round (logistic-model (cons 1 (rest x)))) (round (first x)))) results (frequencies (map test data))] (/ (get results true) (apply + (vals results))))) ;; => 1030/1309
- 117. EVALUATING THE CLASSIFIER Cross-validation: we want to separate our test and training data sets Bias vs variance: your model may fail to generalise
- 118. CLUSTERING
- 119. CLUSTERING Find a grouping of a set of objects such that objects in the same group are more similar to each other than those in other groups.
- 120. SIMILARITY MEASURES Many to choose from: Jaccard, Euclidean. For text documents the Cosine measure is often chosen. Good for high-dimensional spaces Positive spaces the similarity is between 0 and 1.
- 121. COSINE SIMILARITY cos(θ) = A ⋅ B ∥A∥∥B∥ (defn cosine [a b] (let [dot-product (->> (map * a b) (apply +)) magnitude (fn [d] (->> (map #(Math/pow % 2) d) (apply +) Math/sqrt))] (/ dot-product (* (magnitude a) (magnitude b)))))
- 122. CREATING SPARSE VECTORS (def dictionary (atom {:count 0 :words {}})) (defn add-word-to-dict [dict word] (if (get-in dict [:words word]) dict (-> dict (update-in [:words] assoc word (get dict :count)) (update-in [:count] inc)))) (defn update-words [dict doc word] (let [word-id (-> (swap! dict add-word-to-dict word) (get-in [:words word]))] (update-in doc [word-id] #(inc (or % 0))))) (defn document-vector [dict ngrams] (r/reduce (partial update-words dict) {} ngrams))
- 123. EXAMPLE (->> (split "the quick brown fox jumps over the lazy dog" #"W+") (document-vector dictionary)) ;; => {7 1, 6 1, 5 1, 4 1, 3 1, 2 1, 1 1, 0 2} @dictionary ;; => {:words {"dog" 7, "lazy" 6, "over" 5, "jumps" 4, "fox" 3, "brown" 2, "quick" 1, "the" 0}, :count 8}
- 124. STEMMING / STOPWORDS http://clojars.org/stemmers (stemmer/stems "it's lovely that you're musical") ;; => ("love" "music")
- 125. WHY? (cosine-sparse (->> "music is the food of love" stemmer/stems (document-vector dictionary)) (->> "war is the locomotive of history" stemmer/stems (document-vector dictionary))) ;; => 0.0 (cosine-sparse (->> "music is the food of love" stemmer/stems (document-vector dictionary)) (->> "it's lovely that you're musical" stemmer/stems (document-vector dictionary))) ;; => 0.8164965809277259
- 126. EXAMPLE (->> "it's lovely that you're musical" stemmer/stems (document-vector dictionary)) ;; => {0 1, 2 1} @dictionary ;; => {:count 6, :words {"histori" 5, "locomot" 4, "war" 3, "love" 2, "f ood" 1, "music" 0}}
- 127. MAHOUT http://mahout.apache.org/ "The Apache Mahout™ project's goal is to build an environment for quickly creating scalable preformant machine learning applications."
- 128. GET THE DATA We're going to be clustering the Reuters dataset. Follow the readme instructions: brew install mahout script/download-reuters.sh lein run -e 6.7 mahout seqdirectory -i data/reuters-txt -o data/reuters-sequencefile
- 129. VECTOR REPRESENTATION Each document is converted into a vector representation. All vectors share a dictionary providing a unique index for each word.
- 131. PARKOUR Parkour is a Clojure library for interacting with Hadoop. It provides a thinner layer of abstraction than PigPen and Cascalog.
- 132. TF-IDF Term frequency, inverse document frenquency. tf idf (t, d, D) = tf (t, d) ⋅ idf (t, D)
- 133. WE NEED A UNIQUE ID And we need to compute it in parallel.
- 134. PARKOUR MAPPING (require '[clojure.core.reducers :as r] '[parkour.mapreduce :as mr]) (defn document->terms [doc] (clojure.string/split doc #"W+")) (defn document-count-m "Emits the unique words from each document" {::mr/source-as :vals} [documents] (->> documents (r/mapcat (comp distinct document->terms)) (r/map #(vector % 1))))
- 135. SHAPE METADATA :keyvals ;; Re-shape as vectors of key-vals pairs. :keys ;; Just the keys from each key-value pair. :vals ;; Just the values from each key-value pair.
- 136. PLAIN OLD FUNCTIONS (->> (document-count-m ["it's lovely that you're musical" "music is the food of love" "war is the locomotive of history"]) (into [])) ;; => [["love" 1] ["music" 1] ["music" 1] ["food" 1] ["love" 1] ["war" 1 ] ["locomot" 1] ["histori" 1]]
- 137. AND REDUCING… (require '[parkour.io.dux :as dux] '[transduce.reducers :as tr]) (defn unique-index-r {::mr/source-as :keyvalgroups, ::mr/sink-as dux/named-keyvals} [coll] (let [global-offset (conf/get-long mr/*context* "mapred.task.partition " -1)] (tr/mapcat-state (fn [local-offset [word counts]] [(inc local-offset) (if (identical? ::finished word) [[:counts [global-offset local-offset]]] [[:data [word [[global-offset local-offset] (apply + counts)]] ]])]) 0 (r/mapcat identity [coll [[::finished nil]]]))))
- 138. CREATING A JOB (require '[parkour.graph :as pg] '[parkour.avro :as mra] '[abracad.avro :as avro]) (def long-pair (avro/tuple-schema [:long :long])) (def index-value (avro/tuple-schema [long-pair :long])) (defn df-j [dseq] (-> (pg/input dseq) (pg/map #'document-count-m) (pg/partition (mra/shuffle [:string :long])) (pg/reduce #'unique-index-r) (pg/output :data (mra/dsink [:string index-value]) :counts (mra/dsink [:long :long]))))
- 139. WRITING TO DISTRIBUTED CACHE (require '[parkour.io.dval :as dval]) (defn calculate-offsets "Build map of offsets from dseq of counts." [dseq] (->> dseq (into []) (sort-by first) (reductions (fn [[_ t] [i n]] [(inc i) (+ t n)]) [0 0]) (into {}))) (defn df-execute [conf dseq] (let [[df-data df-counts] (pg/execute (df-j dseq) conf `df) offsets-dval (dval/edn-dval (calculate-offsets df-counts))] ...))
- 140. READING FROM DISTRIBUTED CACHE (defn global-id "Use offsets to calculate unique id from global and local offset" [offsets [global-offset local-offset]] (+ local-offset (get offsets global-offset))) (defn words-idf-m "Calculate the unique id and inverse document frequency for each word" {::mr/sink-as :keys} [offsets-dval n coll] (let [offsets @offsets-dval] (r/map (fn [[word [word-offset df]]] [word (global-id offsets word-offset) (Math/log (/ n df))]) coll))) (defn make-dictionary [conf df-data df-counts doc-count] (let [offsets-dval (dval/edn-dval (calculate-offsets df-counts))] (-> (pg/input df-data) (pg/map #'words-idf-m offsets-dval doc-count) (pg/output (mra/dsink [words])) (pg/fexecute conf `idf) (->> (r/map parse-idf) (into {})) (dval/edn-dval))))
- 141. CREATING TEXT VECTORS (import '[org.apache.mahout.math RandomAccessSparseVector]) (defn create-sparse-vector [dictionary [id doc]] (let [vector (RandomAccessSparseVector. (count dictionary))] (doseq [[term freq] (-> doc document->terms frequencies)] (let [term-info (get dictionary term)] (.setQuick vector (:id term-info) (* freq (:idf term-info))))) [id vector])) (defn create-vectors-m [dictionary coll] (let [dictionary @dictionary] (r/map #(create-sparse-vector dictionary %) coll)))
- 142. THE FINISHED JOB (import '[org.apache.hadoop.io Text] '[org.apache.mahout.math VectorWritable]) (defn tfidf [conf dseq dictionary-path vector-path] (let [doc-count (->> dseq (into []) count) [df-data df-counts] (pg/execute (df-j dseq) conf `df) dictionary-dval (make-dictionary conf df-data df-counts doc-coun t)] (write-dictionary dictionary-path dictionary-dval) (-> (pg/input dseq) (pg/map #'create-vectors-m dictionary-dval) (pg/output (seqf/dsink [Text VectorWritable] vector-path)) (pg/fexecute conf `vectorize)))) (defn tool [conf input output] (let [dseq (seqf/dseq input) dictionary-path (doto (str output "/dictionary") fs/path-delete) vector-path (doto (str output "/vectors") fs/path-delete)] (tfidf conf dseq dictionary-path vector-path))) (defn -main [& args] (System/exit (tool/run tool args)))
- 143. RUN THE JOB (defn ex-6-14 [] (let [input "data/reuters-sequencefile" output "data/parkour-vectors"] (tool/run vectorizer/tool [input output])))
- 144. K-MEANS
- 145. K-MEANS
- 146. RUNNING CLUSTERING script/run-kmeans.sh #!/bin/bash WORK_DIR=data INPUT_DIR=${WORK_DIR}/parkour-vectors mahout kmeans -i ${INPUT_DIR}/vectors -c ${WORK_DIR}/clusters-out -o ${WORK_DIR}/kmeans-out -dm org.apache.mahout.common.distance.CosineDistanceMeasure -x 20 -k 5 -cd 0.01 -ow --clustering mahout clusterdump -i ${WORK_DIR}/kmeans-out/clusters-*-final -o ${WORK_DIR}/clusterdump.txt -d ${INPUT_DIR}/dictionary/part-r-00000 -dt sequencefile -dm org.apache.mahout.common.distance.CosineDistanceMeasure --pointsDir ${WORK_DIR}/kmeans-out/clusteredPoints -b 100 -n 20 -sp 0 -e
- 147. HOW MANY CLUSTERS?
- 148. WHAT DID I LEAVE OUT? Cluster quality measures Spectral and LDA clustering Collaborative filtering with Mahout Random forests Spark for movie recommendations with Sparkling Graph data with Loom and Datomic MapReduce with Cascalog and PigPen Adapting algorithms for massive scale Time series and forecasting Dimensionality reduction, feature selection More visualisation techniques Lots more…
- 149. BOOK Clojure for Data Science will be available in the second half of the year from .http://packtpub.com http://cljds.com