SlideShare a Scribd company logo
© drtamil@gmail.com 2020
Cochran-Mantel-Haenszel
FK6193
Dr Azmi Mohd Tamil
© drtamil@gmail.com 2020
Historically
• Pearson’s Chi-Square Test (1904)
• Likelihood Ratio Test
• Cochran Test (1954)
• Mantel-Haenszel Test (1959)
• Breslow-Day Test (1980)
• Tarone (1985)
© drtamil@gmail.com 2020
Mantel-Haenszel
• An excellent method for adjusting for
confounding factors when analysing the
relationship between a dichotomous risk
factor and a dichotomous outcome.
© drtamil@gmail.com 2020
Example
• Those with high catecholamine are
believed to be of high risk for coronary
heart disease. However age & ECG
changes are probable confounders.
– RF - Catecholamine (Low / High)
– Outcome - CHD (Present / Absent)
– Confounders
• Age (<55, 55+)
• ECG ( +, - )
© drtamil@gmail.com 2020
Combine All
CHD + CHD -
High Cat 27(22.1%) 95 122
Low Cat 44(9.0%) 443 487
71 538 609
Crude OR = 2.86, X2=16.25
© drtamil@gmail.com 2020
Stratification
• To control confounding factors, we divide
the sample into a series of strata, which
are now internally homogenous with
regards to the confounding factors.
• The odds ratio calculated within each
stratum are free of bias arising from
confounding.
© drtamil@gmail.com 2020
Age < 55, ECG -
CHD + CHD -
High Cat 1(12.5%) 7 8
Low Cat 17(6.2%) 257 274
18 264 282
OR = (1 x 257)/(7 x 17) = 2.16
© drtamil@gmail.com 2020
Age < 55, ECG +
CHD + CHD -
High Cat 3(17.6%) 14 17
Low Cat 7(11.9%) 52 59
10 66 76
OR = (3 x 52)/(14 x 7) = 1.59
© drtamil@gmail.com 2020
Age 55+, ECG -
CHD + CHD -
High Cat 9(23.1%) 30 39
Low Cat 15(12.3%) 107 122
24 137 161
OR = (9 x 10⁷)/(30 x 15) = 2.14
© drtamil@gmail.com 2020
Age 55+, ECG +
CHD + CHD -
High Cat 14(24.1%) 44 58
Low Cat 5(15.6%) 27 32
19 71 90
OR = (14 x 27)/(44 x 5) = 1.72
© drtamil@gmail.com 2020
Odds Ratio
Stratum Risk + Risk - OR
<55, ECG+ 3(17.6%) 7(11.9%) 1.59
55+, ECG+ 14(24.1%) 5(15.6%) 1.72
55+, ECG- 9(23.1%) 15(12.3%) 2.14
<55, ECG- 1(12.5%) 17(6.2%) 2.16
Combined 27(22.1%) 44(9.0%) 2.86
© drtamil@gmail.com 2020
CI=OR.exp+1.96√1/a+1/b+1/c+1/d
Stratum OR Lower Higher
<55, ECG+ 1.59 0.36 6.96
55+, ECG+ 1.72 0.56 5.31
55+, ECG- 2.14 0.85 5.37
<55, ECG- 2.16 0.25 18.58
Combined 2.86 1.69 4.85
© drtamil@gmail.com 2020
Odds Ratio
Stratum OR
<55, ECG+ 1.59
55+, ECG+ 1.72
55+, ECG- 2.14
<55, ECG- 2.16
Combined 2.86
• Despite stratification, stress
constantly leads to higher odds
(but not significant) of getting
CHD.
• There seems to be little effect
modification due to age and
ECG. The odds are similar.
But combined table stronger
& highly significant
OR=2.86;1.69<OR<4.85.
• Need an adjusted summary
measure & adjust for effect of
age & ECG.
© drtamil@gmail.com 2020
Chi-Square
Cochran-Mantel-Haenszel
© drtamil@gmail.com 2020
Testing for Overall Association
D+ D-
E+ a b a+b
E- c d c+d
a+c b+d n
© drtamil@gmail.com 2020
Age < 55, ECG -
CHD + CHD -
High Cat 1 7 8
Low Cat 17 257 274
18 264 282
© drtamil@gmail.com 2020
Age < 55, ECG +
CHD + CHD -
High Cat 3 14 17
Low Cat 7 52 59
10 66 76
© drtamil@gmail.com 2020
Age 55+, ECG -
CHD + CHD -
High Cat 9 30 39
Low Cat 15 107 122
24 137 161
© drtamil@gmail.com 2020
Age 55+, ECG +
CHD + CHD -
High Cat 14 44 58
Low Cat 5 27 32
19 71 90
© drtamil@gmail.com 2020
Example
© drtamil@gmail.com 2020
Refer to Table 3.
Look at df = 1.
X2MHtest = 4.15, larger than
3.84 (p=0.05) but smaller
than 5.02 (p=0.025).
5.02>4.15>3.84
Therefore if X2MHtest=4.15,
0.025<p<0.05.
© drtamil@gmail.com 2020
Interpretation
• There is a significant relationship between
CAT and CHD, adjusted simultaneously
for age and ECG (p < 0.05; X2
MHtest).
Important: In the numerator, sum before squaring.
Under the null hypothesis X2
MHtest ~ Chi square (1 df)
© drtamil@gmail.com 2020
Mantel-Haenszel
Adjusted Odds Ratio
© drtamil@gmail.com 2020
Estimating The Adjusted OR
Stratum OR Lower Higher
<55, ECG+ 1.59 0.36 6.96
55+, ECG+ 1.72 0.56 5.31
55+, ECG- 2.14 0.85 5.37
<55, ECG- 2.16 0.25 18.58
Crude OR 2.86 1.69 4.85
© drtamil@gmail.com 2020
Mantel-Haenszel Estimator of
Common Odds Ratio
( )
( )
=
n
bc
n
ad
MHˆ
© drtamil@gmail.com 2020
Common/Average Odds Ratio
D+ D-
E+ a b a+b
E- c d c+d
a+c b+d n
© drtamil@gmail.com 2020
Common/Average Odds Ratio
© drtamil@gmail.com 2020
Age < 55, ECG -
CHD + CHD -
High Cat 1 7 8
Low Cat 17 257 274
18 264 282
© drtamil@gmail.com 2020
Age < 55, ECG +
CHD + CHD -
High Cat 3 14 17
Low Cat 7 52 59
10 66 76
© drtamil@gmail.com 2020
Age 55+, ECG -
CHD + CHD -
High Cat 9 30 39
Low Cat 15 107 122
24 137 161
© drtamil@gmail.com 2020
Age 55+, ECG +
CHD + CHD -
High Cat 14 44 58
Low Cat 5 27 32
19 71 90
© drtamil@gmail.com 2020
Conf. Interval, OR=1.89, X2=4.15
© drtamil@gmail.com 2020
Conclusion
• There is a significant relationship between
CAT and CHD, adjusted simultaneously
for age and ECG (p < 0.05; X2
MHtest).
• The adjusted OR is 1.89 (1.02, 3.49).
Since the CI did not include the value of 1,
therefore it is significant.
• Those who are stressed have significantly
higher 2 times risk of developing CHD
compared to those not stressed, after
adjusting for age and ECG changes.
© drtamil@gmail.com 2020
Breslow-Day Test
Azmi Mohd Tamil
© drtamil@gmail.com 2020
Introduction
• Breslow & Day provided a test for
assessing the homogeneity of the odds
ratios across many tables/stratum.
• Its derivation involves solving a quadratic
equation, therefore not advisable to
calculate manually.
• I used an Excel trick to bypass the need
for quadratic equation.
© drtamil@gmail.com 2020
where Ak( ψ) and var(ak ; ψ), denote the expected number and
the asymptotic variance of exposed cases based on the MH
adjusted odds ratio ψ , respectively.
Yep, the words doesn’t make any sense at all. You will hopefully
understand it once you see the calculation in action.
Breslow & Day proposed a statistic (Equation 4.32) for testing
the null hypothesis of homogeneity of the K true odds ratios. It
sums up the squared deviations of observed and fitted values,
each standardized by its variance
© drtamil@gmail.com 2020
Equation 4.32
Breslow-Day uses the Mantel-Haenszel Odds Ratio to generate the
expected tables. The most optimum would be to use conditional
maximum likelihood estimator but that would need computing power.
© drtamil@gmail.com 2020
Step 1
• Calculate the Mantel-Haenszel adjusted
Odds Ratio.
© drtamil@gmail.com 2020
Step 2
• MH OR=1.89. If for every stratum, the
expected Odds Ratio is 1.89, what is the
expected value of cell a for all tables?
• This is where you need computers to
calculate for you. Shown only for 1st table.
• 1.89 = ad/bc = A x (274-18+A)
(8-A) x (18-A)
• A = 0.8941.
Stress CHD+ CHD- Total
High 1 7 8
Low 17 257 274
Total 18 264 282
Observed Data
OR
Stress CHD+ CHD- Total
High 0.8941 7.1059 8 1.890
Low 17.1059 256.8941 274
Total 18 264 282
Expected Data
© drtamil@gmail.com 2020
Quadratic Equation (1st Stratum)
• ad/bc = 1.89
• 1.89 = A x (274-18+A) where
(8-A) x (18-A)
– a = A
– b = (8 – A)
– c = (18 – A)
– d = 274 – c = (274 – 18 + A)
A
Credit to Dr Ihsan Zamzuri
p102428@siswa.ukm.edu.my
© drtamil@gmail.com 2020
Quadratic Equation
• 1.89 = A x (274-18+A)
(8-A) x (18-A)
• 1.89 = A2 + 256A
A2–26A+144
• 1.89A2 – 49.14A + 272.16 = A2 + 256A
• 1.89A2 – A2 – 49.14A – 256A + 272.16 = 0
• 0.89A2 – 305.14A + 272.16 = 0
A
Credit to Dr Ihsan Zamzuri
p102428@siswa.ukm.edu.my
© drtamil@gmail.com 2020
Quadratic Equation Using fx-570
• 0.89A2 – 305.14A + 272.16 = 0
• y = 0.89x2 – 305.14x + 272.16
• Press Mode 3x & select EQN for equation.
• For “Unknowns”, press right to display
“degree” then select 2 for quadratic
equation.
• Enter 0.89 for a, -305.14 for b and 272.16
for c.
• Answer x1=341.959682, x2=0.89425089.
Credit to Dr Ihsan Zamzuri p102428@siswa.ukm.edu.my
© drtamil@gmail.com 2020
We take X=0.89425 since
341.95968 is too big for Table 1
Stress CHD+ CHD- Total
High 0.8943 7.1057 8 1.890
Low 17.1057 256.8943 274
Total 18 264 282
Credit to Dr Ihsan Zamzuri p102428@siswa.ukm.edu.my
© drtamil@gmail.com 2020
Step 3
• For each stratum, obtain the null
hypothesis variance of the cell count.
• Var=(1/0.8943+1/7.1057+1/17.1057+1/256.8943)-1
= 0.75684.
OR
Stress CHD+ CHD- Total
High 0.8943 7.1057 8 1.890
Low 17.1057 256.8943 274
Total 18 264 282
Expected Data
© drtamil@gmail.com 2020
OR
Stress CHD+ CHD- Total
High 0.8943 7.1057 8 1.890
Low 17.1057 256.8943 274
Total 18 264 282
Expected Data
Step 4
• a = observed value
• A = expected value
• (1-0.8943)2
0.75684
= 0.014762.
• Repeat for all tables.
Stress CHD+ CHD- Total
High 1 7 8
Low 17 257 274
Total 18 264 282
Observed Data
© drtamil@gmail.com 2020
Stratum OR OR A€ V€ Breslow
Stress CHD+ CHD- Total Stress CHD+ CHD- Total
Young High 1 7 8 2.16 High 0.8943 7.1057 8 1.890 0.8943 0.7568 0.014762
ECG- Low 17 257 274 Low 17.1057 256.8943 274
Total 18 264 282 Total 18 264 282
Stress CHD+ CHD- Total Stress CHD+ CHD- Total
Young High 3 14 17 1.59 High 3.309 13.691 17 1.890 3.3090 1.8388 0.051924
ECG+ Low 7 52 59 Low 6.691 52.309 59
Total 10 66 76 Total 10 66 76
Stress CHD+ CHD- Total Stress CHD+ CHD- Total
Old High 9 30 39 2.14 High 8.442 30.558 39 1.890 8.4420 4.4474 0.07001
ECG- Low 15 107 122 Low 15.558 106.442 122
Total 24 137 161 Total 24 137 161
Stress CHD+ CHD- Total Stress CHD+ CHD- Total
Old High 14 44 58 1.72 High 14.284 43.716 58 1.890 14.2840 2.9276 0.02755
ECG+ Low 5 27 32 Low 4.716 27.284 32
Total 19 71 90 Total 19 71 90
Stress CHD+ CHD- Total
TOTALS High 27 95 122 2.86 26.929 9.971 0.164
Low 44 443 487
Total 71 538 609
Observed Data Expected Data
Excel Spreadsheet
© drtamil@gmail.com 2020
Step 5
• Sum up all the differences and check the p
value from the chi square table (df = 3,
since 4 stratum).
• χ2
BDTest = 0.164; (d.f.=3) therefore p > 0.5.
• Since the test of homogeneity is not
significant, all the OR of the stratums are
homogenous.
© drtamil@gmail.com 2020
Refer to Table 3.
Look at df = 3.
X2BDtest = 0.164, smaller
than 2.37 (p=0.5)
0.164>2.37
Therefore if X2BDtest=0.164,
p>0.5.
© drtamil@gmail.com 2020
Same result as SPSS
© drtamil@gmail.com 2020
Tarone Adjustment
Should subtract Tarone correction from Breslow-Day statistic
to get better chi-square approximation.
Tarone correction =
© drtamil@gmail.com 2020
Why Tarone?
• Tarone noted that by using the MH Odds Ratio estimator
instead of the better conditional maximum likelihood
estimator, the Breslow–Day test statistic becomes like
the conditional likelihood score test. Since the MH
estimator is inefficient, Tarone noted that the test statistic
is stochastically larger than a χ2 random variable under
the homogeneity hypothesis.
• Tarone wrote in 1985; “this paper derives the appropriate
modification of the heterogeneity score test when the
parameter of interest is estimated by an inefficient, but
consistent, estimator.”
© drtamil@gmail.com 2020
Summary
• CMH test assumes common odds ratio  and
tests if it is 1.
• Mantel-Haenszel estimate of the odds ratio
averages numerators and denominators before
taking the ratio.
• Breslow-Day test checks if odds ratios are
indeed common using discrepancies in
(observed – expected) cell counts.
• Tarone’s adjustment claims that using MH Odds
Ratio estimator for the test of homogeneity, is
inefficient, therefore needs to be corrected. But
the formula is all Greek to me, so I give up.
© drtamil@gmail.com 2020
In SPSS
• In this data, we are trying to see the
relationship between CAT & CHD and see
whether AGE & ECG changes are
Confounders.
© drtamil@gmail.com 2020
Data For Exercise
https://wp.me/p4mYLF-81
© drtamil@gmail.com 2020
Weighted Analysis
© drtamil@gmail.com 2020
Combined Analysis
© drtamil@gmail.com 2020
Combine
© drtamil@gmail.com 2020
Analyse->Descriptives->Crosstab
© drtamil@gmail.com 2020
Select CMH statistics
© drtamil@gmail.com 2020
Odds Ratio by Stratum
© drtamil@gmail.com 2020
Odds Ratio
Stratum OR
<55, ECG+ 1.59
55+, ECG+ 1.72
55+, ECG- 2.14
<55, ECG- 2.16
Crude OR 2.86
• There seems to be
little effect
modification due to
age and ECG. But
combined table
stronger & highly
significant.
• Need to adjust for
effect of age & ECG.
© drtamil@gmail.com 2020
No Interaction between Age & ECG
Changes with Catecholamine Level
Since the test of homogeneity is not significant, all
the OR of the stratums are homogenous. The
changing level of Age & ECG did not change CHD
OR much.
© drtamil@gmail.com 2020
Adjusted OR = 1.891, different than
unadjusted OR=2.86. p value is
significant, indicating OR sig. since
Confidence Interval did not include 1.
© drtamil@gmail.com 2020
Magnitude of Confounding > 10%
• May cause an overestimate (positive
confounding) or an underestimate (negative
confounding).
• Can be quantified by computing the percentage
difference between the crude and adjusted
measures.
• If Adjusted OR = 1.891, Crude OR=2.86.
– Epid; (2.86 – 1.891)/1.891 = 51.24%
– Stats; (2.86 - 1.891)/2.86 = 33.88%
• % larger than 10%, therefore Age/ECG changes
are positive confounding factors for CAT.
© drtamil@gmail.com 2020
X2
MH
• Even after adjusting for Age & ECG changes,
X2
CMH is 4.19, p=0.041, therefore sig association
between CAT level & CHD.
© drtamil@gmail.com 2020
Using SPSS X2
CMH
© drtamil@gmail.com 2020
Using SPSS X2
CMH
© drtamil@gmail.com 2020
Using Continuity Correction X2
MH
χ2
MH = {|∑[a−(a+b)(a+c)/n]|−0.5}2
——————————————
∑(a+b)(a+c)(b+d)(c+d)/(n3−n2)
© drtamil@gmail.com 2020
When to use Continuity Correction?
• https://www.statsdirect.com/help/
meta_analysis/mh.htm
• If any cell count in any of the stratum
tables is zero, then the continuity
correction should be applied.
• χ2
MH (|∑(a−(a+b)(a+c)/n)|−0.5)2
= —————————————
∑(a+b)(a+c)(b+d)(c+d)/(n3−n2)
© drtamil@gmail.com 2020
Using StatCalc X2
MH
=608*((27*443)-(95*44))2
(71*538*122*487)
=16.21978128
• http://web1.sph.emory.edu/activepi/Instructors/
Kevin_MSword/lesson_12boh.htm
• The Mantel-Haenszel Test in StatCalc is a
large-sample version of Fisher's Exact Test, not
the same as CMH Chi-square.
© drtamil@gmail.com 2020
Using StatCalc X2
MH
=608*((27*443)-(95*44))2
(71*538*122*487)
=16.21978128
© drtamil@gmail.com 2020
Conclusion
• There is a significant relationship between
CAT and CHD, adjusted simultaneously
for age and ECG (p < 0.05; X2
CMH).
• The adjusted OR is 1.89 (1.02, 3.49).
Since the CI did not include the value of 1,
therefore it is significant.
• Those who are stressed have significantly
higher 2 times risk of developing CHD
compared to those not stressed, after
adjusting for age and ECG changes.
© drtamil@gmail.com 2020
References
• David G. Kleinbaum, Lawrence L. Kupper, Hal
Morgenstern. 1982. Epidemiologic Research: Principles
and Quantitative Methods. John Wiley & Sons.
(pages 325, 447-460)
• N. E. Breslow & N. E. Day. 1980. Statistical Methods In
Cancer Research Volume 1 - The Analysis Of Case-
control Studies. International Agency For Research On
Cancer, World Health Organization. (pages 136-146)
• Robert E. Tarone. 1985. On Heterogeneity Tests Based
On Efficient Scores. Biometrika, Volume 72, Issue 1,
April 1985. (pages 91–95).

More Related Content

PDF
Mantel Haenszel methods in epidemiology (Stratification)
PDF
Types of correlation coefficients
PDF
Student's t test
PDF
Kaplan meier survival curves and the log-rank test
PPTX
Computing transformations
PPTX
correlation and regression.pptx
PPTX
Regression analysis
PPTX
Multiple logistic regression
Mantel Haenszel methods in epidemiology (Stratification)
Types of correlation coefficients
Student's t test
Kaplan meier survival curves and the log-rank test
Computing transformations
correlation and regression.pptx
Regression analysis
Multiple logistic regression

What's hot (20)

PPTX
Statistics-Regression analysis
PPTX
Regression
PPTX
Regression ppt
PPTX
Tests of significance
PDF
Ct lecture 17. introduction to logistic regression
PPTX
Bias and errors
PPTX
Simple Linear Regression
PPTX
Presentation on regression analysis
PPTX
Regression analysis
PPTX
Correlation biostatistics
PDF
Kolmogorov Smirnov good-of-fit test
PDF
Correlation Analysis
PPTX
Chi square test final
PDF
Bias and confounding
PPTX
case control study
PPTX
Odds ratio
PPTX
Karl pearson's coefficient of correlation (1)
PPTX
Regression analysis
PPT
Ch4 Confidence Interval
PPT
Logistic regression
Statistics-Regression analysis
Regression
Regression ppt
Tests of significance
Ct lecture 17. introduction to logistic regression
Bias and errors
Simple Linear Regression
Presentation on regression analysis
Regression analysis
Correlation biostatistics
Kolmogorov Smirnov good-of-fit test
Correlation Analysis
Chi square test final
Bias and confounding
case control study
Odds ratio
Karl pearson's coefficient of correlation (1)
Regression analysis
Ch4 Confidence Interval
Logistic regression
Ad

Similar to Cochran Mantel Haenszel Test with Breslow-Day Test & Quadratic Equation (20)

PDF
Cochran-Mantel-Haenszel Test with Breslow-Day & Tarone Correction
PPT
23-Statistical_tests_(chi-square,Fishers___&Macnemars))(UG1435-36).ppt
PPT
Statistical tests for categorical data(2020)88.ppt
PPT
Chi-square, Yates, Fisher & McNemar
PPTX
Chi square(hospital admin) A
PPTX
Company Induction process and Onboarding
PPTX
Chi square distribution and analysis of frequencies.pptx
PDF
7. Chi square test.pdf pharmaceutical biostatistics
PPTX
Chi square test
PPTX
Biostatistics- lesson is chapter-10.pptx
PPTX
Chi-square_test_of_significance Genetics.pptx
PPTX
Research Methodology 1
PPTX
Chisquare
PDF
Choosing appropriate statistical test RSS6 2104
PPTX
Lecture chi squire. For Postgraduate and Undergraduate
PPT
chi square test lecture for nurses in pakistan
PDF
Bandaging types for student nursesbnnnnznxnn
PDF
InnerSoft STATS - Methods and formulas help
DOCX
NGR 7848 Fundamentals of Statistics for Clinicians Ho.docx
PPT
Medical statistics Basic concept and applications [Square one]
Cochran-Mantel-Haenszel Test with Breslow-Day & Tarone Correction
23-Statistical_tests_(chi-square,Fishers___&Macnemars))(UG1435-36).ppt
Statistical tests for categorical data(2020)88.ppt
Chi-square, Yates, Fisher & McNemar
Chi square(hospital admin) A
Company Induction process and Onboarding
Chi square distribution and analysis of frequencies.pptx
7. Chi square test.pdf pharmaceutical biostatistics
Chi square test
Biostatistics- lesson is chapter-10.pptx
Chi-square_test_of_significance Genetics.pptx
Research Methodology 1
Chisquare
Choosing appropriate statistical test RSS6 2104
Lecture chi squire. For Postgraduate and Undergraduate
chi square test lecture for nurses in pakistan
Bandaging types for student nursesbnnnnznxnn
InnerSoft STATS - Methods and formulas help
NGR 7848 Fundamentals of Statistics for Clinicians Ho.docx
Medical statistics Basic concept and applications [Square one]
Ad

More from Azmi Mohd Tamil (20)

PDF
STANDARD Authorisation To Fly-FORM-02-01.pdf
PDF
HIS Standard in HUKM Hospital Information System
PDF
Hybrid setup - How to conduct simultaneous face-to-face and online presentati...
PDF
Audiovisual and technicalities from preparation to retrieval how to enhance m...
PDF
Broadcast quality online teaching at zero budget
PDF
Video for Teaching & Learning: OBS
PDF
Bengkel 21-12-2020 - Etika atas Talian & Alat Minima
PPT
GIS & History of Mapping in Malaya (lecture notes circa 2009)
PDF
Blended e-learning in UKMFolio
PDF
How to Compute & Recode SPSS Data
PDF
Introduction to Data Analysis With R and R Studio
PDF
Hack#38 - How to Stream Zoom to Facebook & YouTube Without Using An Encoder o...
PDF
Hack#37 - How to simultaneously live stream to 4 sites using a single hardwar...
PDF
New Emerging And Reemerging Infections circa 2006
PDF
Hacks#36 -Raspberry Pi 4 Mini Computer
PDF
Hack#35 How to FB Live using a Video Encoder
PDF
Hack#34 - Online Teaching with Microsoft Teams
PDF
Hack#33 How To FB-Live
PDF
Skype for Business for UKM
PDF
Introduction to Structural Equation Modeling
STANDARD Authorisation To Fly-FORM-02-01.pdf
HIS Standard in HUKM Hospital Information System
Hybrid setup - How to conduct simultaneous face-to-face and online presentati...
Audiovisual and technicalities from preparation to retrieval how to enhance m...
Broadcast quality online teaching at zero budget
Video for Teaching & Learning: OBS
Bengkel 21-12-2020 - Etika atas Talian & Alat Minima
GIS & History of Mapping in Malaya (lecture notes circa 2009)
Blended e-learning in UKMFolio
How to Compute & Recode SPSS Data
Introduction to Data Analysis With R and R Studio
Hack#38 - How to Stream Zoom to Facebook & YouTube Without Using An Encoder o...
Hack#37 - How to simultaneously live stream to 4 sites using a single hardwar...
New Emerging And Reemerging Infections circa 2006
Hacks#36 -Raspberry Pi 4 Mini Computer
Hack#35 How to FB Live using a Video Encoder
Hack#34 - Online Teaching with Microsoft Teams
Hack#33 How To FB-Live
Skype for Business for UKM
Introduction to Structural Equation Modeling

Recently uploaded (20)

PDF
Mga Unang Hakbang Tungo Sa Tao by Joe Vibar Nero.pdf
PPTX
Strengthening open access through collaboration: building connections with OP...
PPTX
Congenital Hypothyroidism pptx
PPTX
Odoo 18 Sales_ Managing Quotation Validity
PPTX
Software Engineering BSC DS UNIT 1 .pptx
PDF
Sunset Boulevard Student Revision Booklet
PDF
LDMMIA Reiki Yoga Workshop 15 MidTerm Review
PDF
Module 3: Health Systems Tutorial Slides S2 2025
PPTX
Introduction_to_Human_Anatomy_and_Physiology_for_B.Pharm.pptx
PDF
What Is Coercive Control? Understanding and Recognizing Hidden Abuse
PPTX
family health care settings home visit - unit 6 - chn 1 - gnm 1st year.pptx
PPTX
Nursing Management of Patients with Disorders of Ear, Nose, and Throat (ENT) ...
PDF
5.Universal-Franchise-and-Indias-Electoral-System.pdfppt/pdf/8th class social...
PPTX
Open Quiz Monsoon Mind Game Prelims.pptx
PPTX
An introduction to Prepositions for beginners.pptx
PDF
UTS Health Student Promotional Representative_Position Description.pdf
PDF
Landforms and landscapes data surprise preview
PDF
PG-BPSDMP 2 TAHUN 2025PG-BPSDMP 2 TAHUN 2025.pdf
PPTX
Introduction to Child Health Nursing – Unit I | Child Health Nursing I | B.Sc...
PPTX
Information Texts_Infographic on Forgetting Curve.pptx
Mga Unang Hakbang Tungo Sa Tao by Joe Vibar Nero.pdf
Strengthening open access through collaboration: building connections with OP...
Congenital Hypothyroidism pptx
Odoo 18 Sales_ Managing Quotation Validity
Software Engineering BSC DS UNIT 1 .pptx
Sunset Boulevard Student Revision Booklet
LDMMIA Reiki Yoga Workshop 15 MidTerm Review
Module 3: Health Systems Tutorial Slides S2 2025
Introduction_to_Human_Anatomy_and_Physiology_for_B.Pharm.pptx
What Is Coercive Control? Understanding and Recognizing Hidden Abuse
family health care settings home visit - unit 6 - chn 1 - gnm 1st year.pptx
Nursing Management of Patients with Disorders of Ear, Nose, and Throat (ENT) ...
5.Universal-Franchise-and-Indias-Electoral-System.pdfppt/pdf/8th class social...
Open Quiz Monsoon Mind Game Prelims.pptx
An introduction to Prepositions for beginners.pptx
UTS Health Student Promotional Representative_Position Description.pdf
Landforms and landscapes data surprise preview
PG-BPSDMP 2 TAHUN 2025PG-BPSDMP 2 TAHUN 2025.pdf
Introduction to Child Health Nursing – Unit I | Child Health Nursing I | B.Sc...
Information Texts_Infographic on Forgetting Curve.pptx

Cochran Mantel Haenszel Test with Breslow-Day Test & Quadratic Equation

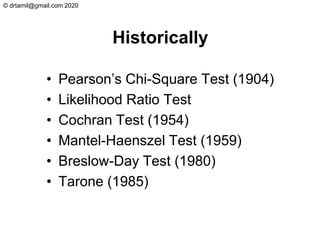
  • 2. © [email protected] 2020 Historically • Pearson’s Chi-Square Test (1904) • Likelihood Ratio Test • Cochran Test (1954) • Mantel-Haenszel Test (1959) • Breslow-Day Test (1980) • Tarone (1985)
  • 3. © [email protected] 2020 Mantel-Haenszel • An excellent method for adjusting for confounding factors when analysing the relationship between a dichotomous risk factor and a dichotomous outcome.
  • 4. © [email protected] 2020 Example • Those with high catecholamine are believed to be of high risk for coronary heart disease. However age & ECG changes are probable confounders. – RF - Catecholamine (Low / High) – Outcome - CHD (Present / Absent) – Confounders • Age (<55, 55+) • ECG ( +, - )
  • 5. © [email protected] 2020 Combine All CHD + CHD - High Cat 27(22.1%) 95 122 Low Cat 44(9.0%) 443 487 71 538 609 Crude OR = 2.86, X2=16.25
  • 6. © [email protected] 2020 Stratification • To control confounding factors, we divide the sample into a series of strata, which are now internally homogenous with regards to the confounding factors. • The odds ratio calculated within each stratum are free of bias arising from confounding.
  • 7. © [email protected] 2020 Age < 55, ECG - CHD + CHD - High Cat 1(12.5%) 7 8 Low Cat 17(6.2%) 257 274 18 264 282 OR = (1 x 257)/(7 x 17) = 2.16
  • 8. © [email protected] 2020 Age < 55, ECG + CHD + CHD - High Cat 3(17.6%) 14 17 Low Cat 7(11.9%) 52 59 10 66 76 OR = (3 x 52)/(14 x 7) = 1.59
  • 9. © [email protected] 2020 Age 55+, ECG - CHD + CHD - High Cat 9(23.1%) 30 39 Low Cat 15(12.3%) 107 122 24 137 161 OR = (9 x 10⁷)/(30 x 15) = 2.14
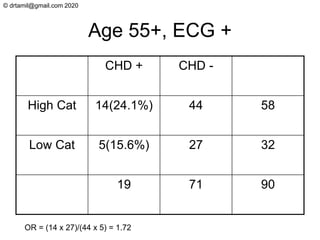
  • 10. © [email protected] 2020 Age 55+, ECG + CHD + CHD - High Cat 14(24.1%) 44 58 Low Cat 5(15.6%) 27 32 19 71 90 OR = (14 x 27)/(44 x 5) = 1.72
  • 11. © [email protected] 2020 Odds Ratio Stratum Risk + Risk - OR <55, ECG+ 3(17.6%) 7(11.9%) 1.59 55+, ECG+ 14(24.1%) 5(15.6%) 1.72 55+, ECG- 9(23.1%) 15(12.3%) 2.14 <55, ECG- 1(12.5%) 17(6.2%) 2.16 Combined 27(22.1%) 44(9.0%) 2.86
  • 12. © [email protected] 2020 CI=OR.exp+1.96√1/a+1/b+1/c+1/d Stratum OR Lower Higher <55, ECG+ 1.59 0.36 6.96 55+, ECG+ 1.72 0.56 5.31 55+, ECG- 2.14 0.85 5.37 <55, ECG- 2.16 0.25 18.58 Combined 2.86 1.69 4.85
  • 13. © [email protected] 2020 Odds Ratio Stratum OR <55, ECG+ 1.59 55+, ECG+ 1.72 55+, ECG- 2.14 <55, ECG- 2.16 Combined 2.86 • Despite stratification, stress constantly leads to higher odds (but not significant) of getting CHD. • There seems to be little effect modification due to age and ECG. The odds are similar. But combined table stronger & highly significant OR=2.86;1.69<OR<4.85. • Need an adjusted summary measure & adjust for effect of age & ECG.
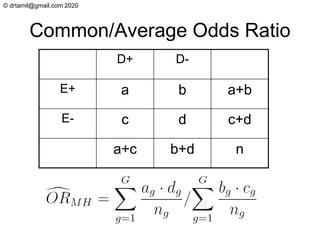
  • 15. © [email protected] 2020 Testing for Overall Association D+ D- E+ a b a+b E- c d c+d a+c b+d n
  • 16. © [email protected] 2020 Age < 55, ECG - CHD + CHD - High Cat 1 7 8 Low Cat 17 257 274 18 264 282
  • 17. © [email protected] 2020 Age < 55, ECG + CHD + CHD - High Cat 3 14 17 Low Cat 7 52 59 10 66 76
  • 18. © [email protected] 2020 Age 55+, ECG - CHD + CHD - High Cat 9 30 39 Low Cat 15 107 122 24 137 161
  • 19. © [email protected] 2020 Age 55+, ECG + CHD + CHD - High Cat 14 44 58 Low Cat 5 27 32 19 71 90
  • 21. © [email protected] 2020 Refer to Table 3. Look at df = 1. X2MHtest = 4.15, larger than 3.84 (p=0.05) but smaller than 5.02 (p=0.025). 5.02>4.15>3.84 Therefore if X2MHtest=4.15, 0.025<p<0.05.
  • 22. © [email protected] 2020 Interpretation • There is a significant relationship between CAT and CHD, adjusted simultaneously for age and ECG (p < 0.05; X2 MHtest). Important: In the numerator, sum before squaring. Under the null hypothesis X2 MHtest ~ Chi square (1 df)
  • 24. © [email protected] 2020 Estimating The Adjusted OR Stratum OR Lower Higher <55, ECG+ 1.59 0.36 6.96 55+, ECG+ 1.72 0.56 5.31 55+, ECG- 2.14 0.85 5.37 <55, ECG- 2.16 0.25 18.58 Crude OR 2.86 1.69 4.85
  • 25. © [email protected] 2020 Mantel-Haenszel Estimator of Common Odds Ratio ( ) ( ) = n bc n ad MHˆ
  • 26. © [email protected] 2020 Common/Average Odds Ratio D+ D- E+ a b a+b E- c d c+d a+c b+d n
  • 28. © [email protected] 2020 Age < 55, ECG - CHD + CHD - High Cat 1 7 8 Low Cat 17 257 274 18 264 282
  • 29. © [email protected] 2020 Age < 55, ECG + CHD + CHD - High Cat 3 14 17 Low Cat 7 52 59 10 66 76
  • 30. © [email protected] 2020 Age 55+, ECG - CHD + CHD - High Cat 9 30 39 Low Cat 15 107 122 24 137 161
  • 31. © [email protected] 2020 Age 55+, ECG + CHD + CHD - High Cat 14 44 58 Low Cat 5 27 32 19 71 90
  • 32. © [email protected] 2020 Conf. Interval, OR=1.89, X2=4.15
  • 33. © [email protected] 2020 Conclusion • There is a significant relationship between CAT and CHD, adjusted simultaneously for age and ECG (p < 0.05; X2 MHtest). • The adjusted OR is 1.89 (1.02, 3.49). Since the CI did not include the value of 1, therefore it is significant. • Those who are stressed have significantly higher 2 times risk of developing CHD compared to those not stressed, after adjusting for age and ECG changes.
  • 35. © [email protected] 2020 Introduction • Breslow & Day provided a test for assessing the homogeneity of the odds ratios across many tables/stratum. • Its derivation involves solving a quadratic equation, therefore not advisable to calculate manually. • I used an Excel trick to bypass the need for quadratic equation.
  • 36. © [email protected] 2020 where Ak( ψ) and var(ak ; ψ), denote the expected number and the asymptotic variance of exposed cases based on the MH adjusted odds ratio ψ , respectively. Yep, the words doesn’t make any sense at all. You will hopefully understand it once you see the calculation in action. Breslow & Day proposed a statistic (Equation 4.32) for testing the null hypothesis of homogeneity of the K true odds ratios. It sums up the squared deviations of observed and fitted values, each standardized by its variance
  • 37. © [email protected] 2020 Equation 4.32 Breslow-Day uses the Mantel-Haenszel Odds Ratio to generate the expected tables. The most optimum would be to use conditional maximum likelihood estimator but that would need computing power.
  • 38. © [email protected] 2020 Step 1 • Calculate the Mantel-Haenszel adjusted Odds Ratio.
  • 39. © [email protected] 2020 Step 2 • MH OR=1.89. If for every stratum, the expected Odds Ratio is 1.89, what is the expected value of cell a for all tables? • This is where you need computers to calculate for you. Shown only for 1st table. • 1.89 = ad/bc = A x (274-18+A) (8-A) x (18-A) • A = 0.8941. Stress CHD+ CHD- Total High 1 7 8 Low 17 257 274 Total 18 264 282 Observed Data OR Stress CHD+ CHD- Total High 0.8941 7.1059 8 1.890 Low 17.1059 256.8941 274 Total 18 264 282 Expected Data
  • 40. © [email protected] 2020 Quadratic Equation (1st Stratum) • ad/bc = 1.89 • 1.89 = A x (274-18+A) where (8-A) x (18-A) – a = A – b = (8 – A) – c = (18 – A) – d = 274 – c = (274 – 18 + A) A Credit to Dr Ihsan Zamzuri [email protected]
  • 41. © [email protected] 2020 Quadratic Equation • 1.89 = A x (274-18+A) (8-A) x (18-A) • 1.89 = A2 + 256A A2–26A+144 • 1.89A2 – 49.14A + 272.16 = A2 + 256A • 1.89A2 – A2 – 49.14A – 256A + 272.16 = 0 • 0.89A2 – 305.14A + 272.16 = 0 A Credit to Dr Ihsan Zamzuri [email protected]
  • 42. © [email protected] 2020 Quadratic Equation Using fx-570 • 0.89A2 – 305.14A + 272.16 = 0 • y = 0.89x2 – 305.14x + 272.16 • Press Mode 3x & select EQN for equation. • For “Unknowns”, press right to display “degree” then select 2 for quadratic equation. • Enter 0.89 for a, -305.14 for b and 272.16 for c. • Answer x1=341.959682, x2=0.89425089. Credit to Dr Ihsan Zamzuri [email protected]
  • 43. © [email protected] 2020 We take X=0.89425 since 341.95968 is too big for Table 1 Stress CHD+ CHD- Total High 0.8943 7.1057 8 1.890 Low 17.1057 256.8943 274 Total 18 264 282 Credit to Dr Ihsan Zamzuri [email protected]
  • 44. © [email protected] 2020 Step 3 • For each stratum, obtain the null hypothesis variance of the cell count. • Var=(1/0.8943+1/7.1057+1/17.1057+1/256.8943)-1 = 0.75684. OR Stress CHD+ CHD- Total High 0.8943 7.1057 8 1.890 Low 17.1057 256.8943 274 Total 18 264 282 Expected Data
  • 45. © [email protected] 2020 OR Stress CHD+ CHD- Total High 0.8943 7.1057 8 1.890 Low 17.1057 256.8943 274 Total 18 264 282 Expected Data Step 4 • a = observed value • A = expected value • (1-0.8943)2 0.75684 = 0.014762. • Repeat for all tables. Stress CHD+ CHD- Total High 1 7 8 Low 17 257 274 Total 18 264 282 Observed Data
  • 46. © [email protected] 2020 Stratum OR OR A€ V€ Breslow Stress CHD+ CHD- Total Stress CHD+ CHD- Total Young High 1 7 8 2.16 High 0.8943 7.1057 8 1.890 0.8943 0.7568 0.014762 ECG- Low 17 257 274 Low 17.1057 256.8943 274 Total 18 264 282 Total 18 264 282 Stress CHD+ CHD- Total Stress CHD+ CHD- Total Young High 3 14 17 1.59 High 3.309 13.691 17 1.890 3.3090 1.8388 0.051924 ECG+ Low 7 52 59 Low 6.691 52.309 59 Total 10 66 76 Total 10 66 76 Stress CHD+ CHD- Total Stress CHD+ CHD- Total Old High 9 30 39 2.14 High 8.442 30.558 39 1.890 8.4420 4.4474 0.07001 ECG- Low 15 107 122 Low 15.558 106.442 122 Total 24 137 161 Total 24 137 161 Stress CHD+ CHD- Total Stress CHD+ CHD- Total Old High 14 44 58 1.72 High 14.284 43.716 58 1.890 14.2840 2.9276 0.02755 ECG+ Low 5 27 32 Low 4.716 27.284 32 Total 19 71 90 Total 19 71 90 Stress CHD+ CHD- Total TOTALS High 27 95 122 2.86 26.929 9.971 0.164 Low 44 443 487 Total 71 538 609 Observed Data Expected Data Excel Spreadsheet
  • 47. © [email protected] 2020 Step 5 • Sum up all the differences and check the p value from the chi square table (df = 3, since 4 stratum). • χ2 BDTest = 0.164; (d.f.=3) therefore p > 0.5. • Since the test of homogeneity is not significant, all the OR of the stratums are homogenous.
  • 48. © [email protected] 2020 Refer to Table 3. Look at df = 3. X2BDtest = 0.164, smaller than 2.37 (p=0.5) 0.164>2.37 Therefore if X2BDtest=0.164, p>0.5.
  • 50. © [email protected] 2020 Tarone Adjustment Should subtract Tarone correction from Breslow-Day statistic to get better chi-square approximation. Tarone correction =
  • 51. © [email protected] 2020 Why Tarone? • Tarone noted that by using the MH Odds Ratio estimator instead of the better conditional maximum likelihood estimator, the Breslow–Day test statistic becomes like the conditional likelihood score test. Since the MH estimator is inefficient, Tarone noted that the test statistic is stochastically larger than a χ2 random variable under the homogeneity hypothesis. • Tarone wrote in 1985; “this paper derives the appropriate modification of the heterogeneity score test when the parameter of interest is estimated by an inefficient, but consistent, estimator.”
  • 52. © [email protected] 2020 Summary • CMH test assumes common odds ratio  and tests if it is 1. • Mantel-Haenszel estimate of the odds ratio averages numerators and denominators before taking the ratio. • Breslow-Day test checks if odds ratios are indeed common using discrepancies in (observed – expected) cell counts. • Tarone’s adjustment claims that using MH Odds Ratio estimator for the test of homogeneity, is inefficient, therefore needs to be corrected. But the formula is all Greek to me, so I give up.
  • 53. © [email protected] 2020 In SPSS • In this data, we are trying to see the relationship between CAT & CHD and see whether AGE & ECG changes are Confounders.
  • 54. © [email protected] 2020 Data For Exercise https://wp.me/p4mYLF-81
  • 62. © [email protected] 2020 Odds Ratio Stratum OR <55, ECG+ 1.59 55+, ECG+ 1.72 55+, ECG- 2.14 <55, ECG- 2.16 Crude OR 2.86 • There seems to be little effect modification due to age and ECG. But combined table stronger & highly significant. • Need to adjust for effect of age & ECG.
  • 63. © [email protected] 2020 No Interaction between Age & ECG Changes with Catecholamine Level Since the test of homogeneity is not significant, all the OR of the stratums are homogenous. The changing level of Age & ECG did not change CHD OR much.
  • 64. © [email protected] 2020 Adjusted OR = 1.891, different than unadjusted OR=2.86. p value is significant, indicating OR sig. since Confidence Interval did not include 1.
  • 65. © [email protected] 2020 Magnitude of Confounding > 10% • May cause an overestimate (positive confounding) or an underestimate (negative confounding). • Can be quantified by computing the percentage difference between the crude and adjusted measures. • If Adjusted OR = 1.891, Crude OR=2.86. – Epid; (2.86 – 1.891)/1.891 = 51.24% – Stats; (2.86 - 1.891)/2.86 = 33.88% • % larger than 10%, therefore Age/ECG changes are positive confounding factors for CAT.
  • 66. © [email protected] 2020 X2 MH • Even after adjusting for Age & ECG changes, X2 CMH is 4.19, p=0.041, therefore sig association between CAT level & CHD.
  • 69. © [email protected] 2020 Using Continuity Correction X2 MH χ2 MH = {|∑[a−(a+b)(a+c)/n]|−0.5}2 —————————————— ∑(a+b)(a+c)(b+d)(c+d)/(n3−n2)
  • 70. © [email protected] 2020 When to use Continuity Correction? • https://www.statsdirect.com/help/ meta_analysis/mh.htm • If any cell count in any of the stratum tables is zero, then the continuity correction should be applied. • χ2 MH (|∑(a−(a+b)(a+c)/n)|−0.5)2 = ————————————— ∑(a+b)(a+c)(b+d)(c+d)/(n3−n2)
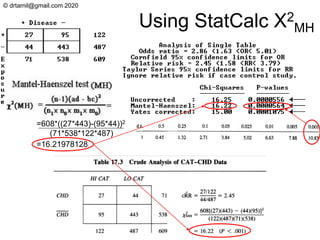
  • 71. © [email protected] 2020 Using StatCalc X2 MH =608*((27*443)-(95*44))2 (71*538*122*487) =16.21978128 • http://web1.sph.emory.edu/activepi/Instructors/ Kevin_MSword/lesson_12boh.htm • The Mantel-Haenszel Test in StatCalc is a large-sample version of Fisher's Exact Test, not the same as CMH Chi-square.
  • 72. © [email protected] 2020 Using StatCalc X2 MH =608*((27*443)-(95*44))2 (71*538*122*487) =16.21978128
  • 73. © [email protected] 2020 Conclusion • There is a significant relationship between CAT and CHD, adjusted simultaneously for age and ECG (p < 0.05; X2 CMH). • The adjusted OR is 1.89 (1.02, 3.49). Since the CI did not include the value of 1, therefore it is significant. • Those who are stressed have significantly higher 2 times risk of developing CHD compared to those not stressed, after adjusting for age and ECG changes.
  • 74. © [email protected] 2020 References • David G. Kleinbaum, Lawrence L. Kupper, Hal Morgenstern. 1982. Epidemiologic Research: Principles and Quantitative Methods. John Wiley & Sons. (pages 325, 447-460) • N. E. Breslow & N. E. Day. 1980. Statistical Methods In Cancer Research Volume 1 - The Analysis Of Case- control Studies. International Agency For Research On Cancer, World Health Organization. (pages 136-146) • Robert E. Tarone. 1985. On Heterogeneity Tests Based On Efficient Scores. Biometrika, Volume 72, Issue 1, April 1985. (pages 91–95).