SlideShare a Scribd company logo
1
01. Name of the Problem: Program for the generation of Bresenham Line Drawing.
Objective: To generate basic line according to Bresenham’s Line-Drawing Algorithm.
Algorithm:
1. Input the two line endpoints and store the left endpoint in (x0, y0).
2. Set the color for frame-buffer position (x0, y0); i.e., plot the first point.
3. Calculate the constants _x, _y, 2_y, and 2_y − 2_x, and obtain the Starting value for the
decision parameter as p0 = 2_y − _x.
4. At each xk along the line, starting at k = 0, perform the following test: If pk < 0, the next point
to plot is (xk + 1, yk ) and pk+1 = pk + 2_y.Otherwise, the next point to plot is (xk + 1, yk + 1)
and pk+1 = pk + 2_y − 2_x.
5. Repeat step 4 _x − 1 more times.
Source Program:
#include<iostream>
#include<graphics.h>
using namespace std;
int main()
{
initwindow(500,600);
int x0,y0,x1,y1;
cout<<"Enter the First Line Coordinates:";
cin>>x0>>y0;
cout<<"Enter the Second Line Coordinates:";
cin>>x1>>y1;
int dx=x1-x0;
int dy=y1-y0;
int d=2*dy-dx;
int incrE=2*dy;
int incrNE=2*(dy-dx);
int x=x0;
int y=y0;
2
putpixel(x,y,5);
while(x<x1)
{
if(d<=0)
{
d+=incrE;
x++;
}
else
{
d+=incrNE;
x++;
y++;
}
putpixel(x,y,5);
}
delay(50000);
closegraph();
return 0;
}
Input and Output:
Figure: Input for the line drawing.
3
Figure: output of the line drawing.
Result and Discussion: From the sample output we can see that the Bresenham’s Line-
Drawing is very successful. For the following above Bresenham’s Line-Drawing code the output
picture is generated.
4
02. Name of the Problem: Program for the generation of Digital Differential Analyzer
(DDA) Line Drawing.
Objective: To generate basic line according to Digital Differential Analyzer (DDA) Line
Drawing Algorithm.
Algorithm:
1. Input the two line endpoints and store the left endpoint in (x0, y0).
2. Set the color for frame-buffer position (x0, y0); i.e., plot the first point.
3. Calculate the constants x, y, 2y, and 2y − 2x, and If x= 1 the next point to plot is yk+1 =yk + m
and If y= 1 the next point to plot is xk+1 =xk + 1/m
4. At each xk along the line, starting at k = 0, perform the following test: If x= -1 the next point
to plot is yk+1 =yk – m and If y= -1 the next point to plot is xk+1 =xk – 1/m and
5. Repeat step (4) x − 1 more times.
Source Program:
#include <graphics.h>
#include <stdio.h>
#include <math.h>
int main( )
{
float x,y,x1,y1,x2,y2,dx,dy,pixel;
int i,gd,gm;
printf("Enter the value of x1 : ");
scanf("%f",&x1);
printf("Enter the value of y1 : ");
scanf("%f",&y1);
printf("Enter the value of x2 : ");
scanf("%f",&x2);
printf("Enter the value of y1 : ");
scanf("%f",&y2);
detectgraph(&gd,&gm);
5
initgraph(&gd,&gm,"");
dx=abs(x2-x1);
dy=abs(y2-y1);
if(dx>=dy)
pixel=dx;
else
pixel=dy;
dx=dx/pixel;
dy=dy/pixel;
x=x1;
y=y1;
i=1;
while(i<=pixel)
{
putpixel(x,y,15);
x=x+dx;
y=y+dy;
i=i+1;
}
getch();
delay(1000);
}
6
Input and Output:
Figure: Input for the line drawing.
Figure: output of the line drawing.
Result and Discussion: From the sample output we can see that the Digital Differential
Analyzer (DDA) Line Drawing is very successful. For the following above Digital Differential
Analyzer (DDA) Line Drawing code the output picture is generated.
7
03. Name of the Problem: Program for the generation of Midpoint Circle Drawing.
Objective: To generate basic circle according to Midpoint Circle Drawing Algorithm.
Algorithm:
1. Input radius r and circle center (xc , yc ), then set the coordinates for the first point on the
circumference of a circle centered on the origin as (x0, y0) = (0, r )
2. Calculate the initial value of the decision parameter as p0 = (5/ 4) − r
3. At each xk position, starting at k = 0, perform the following test: If pk <0, the next point along
the circle centered on (0, 0) is (xk+1, yk ) and pk+1 = pk + 2xk+1 + 1 Otherwise, the next point
along the circle is (xk + 1, yk − 1) and pk+1 = pk + 2xk+1 + 1 − 2yk+1 where 2xk+1 = 2xk + 2
and 2yk+1 = 2yk − 2.
4. Determine symmetry points in the other seven octants.
5. Move each calculated pixel position (x, y) onto the circular path centered at (xc , yc ) and plot
the coordinate values as follows: x = x + xc , y = y + yc.
6. Repeat steps 3 through 5 until x ≥ y.
Source Program:
#include<iostream>
#include<graphics.h>
using namespace std;
void drawcircle(int x0, int y0, int radius)
{
int x = radius;
int y = 0;
int err = 0;
while (x >= y)
{
putpixel(x0 + x, y0 + y, 7);
putpixel(x0 + y, y0 + x, 7);
putpixel(x0 - y, y0 + x, 7);
putpixel(x0 - x, y0 + y, 7);
putpixel(x0 - x, y0 - y, 7);
8
putpixel(x0 - y, y0 - x, 7);
putpixel(x0 + y, y0 - x, 7);
putpixel(x0 + x, y0 - y, 7);
if (err <= 0)
{
y += 1;
err += 2*y + 1;
}
if (err > 0)
{
x -= 1;
err -= 2*x + 1;
}
}
}
int main()
{
int gdriver=DETECT, gmode, error, x, y, r;
initgraph(&gdriver, &gmode, "c:turboc3bgi");
cout<<"Enter radius of circle: ";
cin>>r;
cout<<"Enter co-ordinates of center(x and y): ";
cin>>x>>y;
drawcircle(x, y, r);
delay(50000);
closegraph();
return 0;
}
9
Input and Output:
Figure: Input for the circle drawing.
Figure: output of the circle drawing.
Result and Discussion: From the sample output we can see that the Midpoint Circle
Drawing was very successful. For the following above Midpoint Circle Drawing code the output
picture is generated.
10
04. Name of the Problem: Program for the generation of Midpoint Ellipse Drawing.
Objective: To generate basic ellipse according to Midpoint Ellipse Drawing Algorithm.
Algorithm:
1. Input rx, ry, and ellipse center (xc , yc ), and obtain the first point on an ellipse centered on the
origin as (x0, y0) = (0, ry)
2. Calculate the initial value of the decision parameter in region 1 as p10 = r 2
y− r 2
xry + 1 /4 r2
x
3. At each xk position in region 1, starting at k = 0, perform the following test: If p1k <0, the next
point along the ellipse centered on (0, 0) is (xk+1, yk ) and p1k+1 = p1k + 2r 2
y xk+1 + r 2
y
.Otherwise, the next point along the ellipse is (xk + 1, yk − 1) andp1k+1 = p1k + 2r 2
yxk+1 − 2r
2
x yk+1 + r 2
y with2r 2
yxk+1 = 2r 2
yxk + 2r 2
y, 2r 2
x yk+1 = 2r 2
x yk − 2r 2
x and continue until 2r
2
yx ≥ 2r x y.
4. Calculate the initial value of the decision parameter in region 2 as p20 = r 2
Y(x0 + ½)2
+ r 2
x
(y0 − 1)2 − r 2
xr 2
y where (x0, y0) is the last position calculated in region 1.
5. At each yk position in region 2, starting at k = 0, perform the following test: If p2k >0, the next
point along the ellipse centered on (0, 0) is (xk , yk − 1) and p2k+1 = p2k − 2r 2
x yk+1 + r 2
x
.Otherwise, the next point along the ellipse is (xk + 1, yk − 1) and p2k+1 = p2k + 2r 2
yxk+1 − 2r
2
x yk+1 + r 2
x using the same incremental calculations for x and y as in region 1. Continue until y
= 0.
6. For both regions, determine symmetry points in the other three quadrants.
7. Move each calculated pixel position (x, y) onto the elliptical path centered on (xc , yc ) and
plot these coordinate values: x = x + xc , y = y + yc.
Source Program:
#include<graphics.h>
#include<stdlib.h>
#include<iostream>
using namespace std;
int main()
{
int gd = DETECT, gm;
int xc,yc,x,y;float p;
long rx,ry;
initgraph(&gd, &gm, "C:TCBGI");
11
cout<<"Enter coordinates of centre : ";
cin>>xc>>yc;
cout<<"Enter x,y radius of ellipse: ";
cin>>rx>>ry;
p=ry*ry-rx*rx*ry+rx*rx/4;
x=0;y=ry;
while(2.0*ry*ry*x <= 2.0*rx*rx*y)
{ if(p < 0)
{ x++;
p = p+2*ry*ry*x+ry*ry;
} else
{ x++;y--;
p = p+2*ry*ry*x-2*rx*rx*y-ry*ry;}
putpixel(xc+x,yc+y,WHITE);
putpixel(xc+x,yc-y,WHITE);
putpixel(xc-x,yc+y,WHITE);
putpixel(xc-x,yc-y,WHITE);
}
p=ry*ry*(x+0.5)*(x+0.5)+rx*rx*(y-1)*(y-1)-rx*rx*ry*ry;
while(y > 0)
{ if(p <= 0)
{ x++;y--;
p = p+2*ry*ry*x-2*rx*rx*y+rx*rx;
} else
{ y--;
p = p-2*rx*rx*y+rx*rx;
}
putpixel(xc+x,yc+y,WHITE);
putpixel(xc+x,yc-y,WHITE);
putpixel(xc-x,yc+y,WHITE);
12
putpixel(xc-x,yc-y,WHITE);
} delay(50000);
closegraph();
return 0;
}
Input and Output:
Figure: Input for the ellipse drawing.
Figure: output of the ellipse drawing.
Result and Discussion: From the sample output we can see that the Midpoint Ellipse
Drawing is very successful. For the following above Midpoint Ellipse Drawing code the output
picture is generated.
13
05. Name of the Problem: Program for the generation of Translating an object.
Objective: To reposition an object it along a straight-line path from on coordinate location to
another coordinate according to Translation Algorithm.
Algorithm:
1) Start
2) Initialize the graphics mode.
3) Construct a 2D object (use Drawpoly()) e.g. (x,y)
4) Get the translation value tx, ty
5) Move the 2d object with tx, ty (x’=x+tx,y’=y+ty)
6) Plot (x’,y’)
Source Program:
#include<bits/stdc++.h>
#include<graphics.h>
using namespace std;
void translateLine ( int P[][2], int T[])
{
initwindow(600,800);
int gd = DETECT, gm, errorcode;
initgraph (&gd, &gm, "c:tcbgi");
ine(getmaxx()/2,0,getmaxx()/2,getmaxy());
line(0,getmaxy()/2,getmaxx(),getmaxy()/2);
line(P[0][0], P[0][1], P[1][0], P[1][1]);
P[0][0] = P[0][0] + T[0];
P[0][1] = P[0][1] + T[1];
P[1][0] = P[1][0] + T[0];
P[1][1] = P[1][1] + T[1];
setcolor(3);
line(P[0][0], P[0][1], P[1][0], P[1][1]);
14
closegraph();
}
int main()
{
int P[2][2] = {60, 70, 30, 50}; // coordinates of point
int T[] = {10, 20}; // translation factor
translateLine (P, T);
delay(50000);
closegraph();
return 0;
}
Input and Output:
Coordinates of point: 60, 70, 30, 50
Translation factor: 10, 20
Figure: output of the ellipse drawing.
Result and Discussion: From the sample output we can see that the translating an object is
very successful. For the following above translation code the output picture is generated.
15
06. Name of the Problem: Program for the generation of Rotating an Object.
Objective: To reposition an object it along a circular path in the xy plane according to
Rotation Algorithm.
Algorithm:
1. Start
2. Initialize the graphics mode.
3. Construct a 2D object (use Drawpoly()) e.g. (x,y)
4. Get the Rotation angle
5.Rotate the object by the angle ф
x’=x cos ф - y sin ф
y’=x sin ф - y cosф
6. Plot (x’,y’)
Source Program:
#include<graphics.h>
#include<stdlib.h>
#include<stdio.h>
#include<math.h>
int main()
{
int graphdriver=DETECT,graphmode,errorcode;
int i;
int x2,y2,x1,y1,x,y,xn,yn;
double r11,r12,r21,r22,th;
printf("Enter the 2 line end points:");
printf("x1,y1,x2,y2:");
scanf("%d%d%d%d",&x1,&y1,&x2,&y2);
initgraph(&graphdriver,&graphmode,"c:tcbgi");
16
line(x1,y1,x2,y2);
printf("nEnter the angle:");
scanf("%lf",&th);
r11=cos((th*3.1428)/180);
r12=sin((th*3.1428)/180);
r21=(-sin((th*3.1428)/180));
r22=cos((th*3.1428)/180);
xn=((x2*r11)-(y2*r12));
yn=((x2*r12)+(y2*r11));
line(x1,y1,xn,yn);
getch();
closegraph();
}
Input and Output:
Figure: Input for the rotation of an Object.
17
Figure: output of the rotation of an Object
Result and Discussion: From the sample output we can see that the rotation of an Object is
very successful. For the following above Rotation of an object code the output picture is
generated.
18
07. Name of the Problem: Program for the generation of scaling an object.
Objective: To alter the size of an object by multiplying the coordinate values(x, y) according
to Scaling Algorithm.
Algorithm:
1. Start
2. Initialize the graphics mode.
3. Construct a 2D object (use Drawpoly()) e.g. (x,y)
4. Get the scaling value Sx,Sy
5. Resize the object with Sx,Sy (x’=x*Sx,y’=y*Sy)
6. Plot (x’,y’)
Source Program:
#include<stdio.h>
#include<graphics.h>
void findNewCoordinate(int s[][2], int p[][1])
{
int temp[2][1] = { 0 };
for (int i = 0; i < 2; i++)
for (int j = 0; j < 1; j++)
for (int k = 0; k < 2; k++)
temp[i][j] += (s[i][k] * p[k][j]);
p[0][0] = temp[0][0];
p[1][0] = temp[1][0];
}
void scale(int x[], int y[], int sx, int sy)
{ line(x[0], y[0], x[1], y[1]);
line(x[1], y[1], x[2], y[2]);
line(x[2], y[2], x[0], y[0]);
19
int s[2][2] = { sx, 0, 0, sy };
int p[2][1];
for (int i = 0; i < 3; i++)
{
p[0][0] = x[i];
p[1][0] = y[i];
findNewCoordinate(s, p);
x[i] = p[0][0];
y[i] = p[1][0];
}
line(x[0], y[0], x[1], y[1]);
line(x[1], y[1], x[2], y[2]);
line(x[2], y[2], x[0], y[0]);
}
int main()
{
int x[] = { 50, 100, 150 };
int y[] = { 100, 50, 100 };
int sx = 2, sy = 2;
int gd, gm;
detectgraph(&gd, &gm);
initgraph(&gd, &gm," ");
scale(x, y, sx,sy);
getch();
return 0;
}
20
Input and Output:
Drawing X axis: line (0,240,640,240)
Drawing Y axis: line (320, 0,320,480)
Original object: 500, 20
Transformed object: 500, 50
Figure: output of the scaling of an object.
Result and Discussion: From the sample output we can see that the scaling of an object is
very successful. For the following above the scaling of an object code the output picture is
generated.
Ad

More Related Content

What's hot (20)

Mid point circle algorithm
Mid point circle algorithmMid point circle algorithm
Mid point circle algorithm
Mani Kanth
 
Dda algorithm
Dda algorithmDda algorithm
Dda algorithm
Mani Kanth
 
Character generation
Character generationCharacter generation
Character generation
Ankit Garg
 
2D transformation (Computer Graphics)
2D transformation (Computer Graphics)2D transformation (Computer Graphics)
2D transformation (Computer Graphics)
Timbal Mayank
 
Polygon filling
Polygon fillingPolygon filling
Polygon filling
Ankit Garg
 
Output primitives in Computer Graphics
Output primitives in Computer GraphicsOutput primitives in Computer Graphics
Output primitives in Computer Graphics
Kamal Acharya
 
3D transformation in computer graphics
3D transformation in computer graphics3D transformation in computer graphics
3D transformation in computer graphics
SHIVANI SONI
 
Character generation techniques
Character generation techniquesCharacter generation techniques
Character generation techniques
Mani Kanth
 
Attributes of Output Primitives
Attributes of Output PrimitivesAttributes of Output Primitives
Attributes of Output Primitives
Renita Santhmayora
 
Computer Graphic - Lines, Circles and Ellipse
Computer Graphic - Lines, Circles and EllipseComputer Graphic - Lines, Circles and Ellipse
Computer Graphic - Lines, Circles and Ellipse
2013901097
 
Ellipses drawing algo.
Ellipses drawing algo.Ellipses drawing algo.
Ellipses drawing algo.
Mohd Arif
 
Cyrus beck line clipping algorithm
Cyrus beck line clipping algorithmCyrus beck line clipping algorithm
Cyrus beck line clipping algorithm
Pooja Dixit
 
Circle generation algorithm
Circle generation algorithmCircle generation algorithm
Circle generation algorithm
Ankit Garg
 
Computer graphics LINE DRAWING algorithm.pptx
Computer graphics LINE DRAWING algorithm.pptxComputer graphics LINE DRAWING algorithm.pptx
Computer graphics LINE DRAWING algorithm.pptx
R S Anu Prabha
 
Intro to scan conversion
Intro to scan conversionIntro to scan conversion
Intro to scan conversion
Mohd Arif
 
Polygon clipping
Polygon clippingPolygon clipping
Polygon clipping
Mohd Arif
 
Unit 3
Unit 3Unit 3
Unit 3
ypnrao
 
Bresenham's line drawing algorithm
Bresenham's line drawing algorithmBresenham's line drawing algorithm
Bresenham's line drawing algorithm
nehrurevathy
 
Circle drawing algo.
Circle drawing algo.Circle drawing algo.
Circle drawing algo.
Mohd Arif
 
3 d viewing
3 d viewing3 d viewing
3 d viewing
Deepak Singh
 
Mid point circle algorithm
Mid point circle algorithmMid point circle algorithm
Mid point circle algorithm
Mani Kanth
 
Character generation
Character generationCharacter generation
Character generation
Ankit Garg
 
2D transformation (Computer Graphics)
2D transformation (Computer Graphics)2D transformation (Computer Graphics)
2D transformation (Computer Graphics)
Timbal Mayank
 
Polygon filling
Polygon fillingPolygon filling
Polygon filling
Ankit Garg
 
Output primitives in Computer Graphics
Output primitives in Computer GraphicsOutput primitives in Computer Graphics
Output primitives in Computer Graphics
Kamal Acharya
 
3D transformation in computer graphics
3D transformation in computer graphics3D transformation in computer graphics
3D transformation in computer graphics
SHIVANI SONI
 
Character generation techniques
Character generation techniquesCharacter generation techniques
Character generation techniques
Mani Kanth
 
Attributes of Output Primitives
Attributes of Output PrimitivesAttributes of Output Primitives
Attributes of Output Primitives
Renita Santhmayora
 
Computer Graphic - Lines, Circles and Ellipse
Computer Graphic - Lines, Circles and EllipseComputer Graphic - Lines, Circles and Ellipse
Computer Graphic - Lines, Circles and Ellipse
2013901097
 
Ellipses drawing algo.
Ellipses drawing algo.Ellipses drawing algo.
Ellipses drawing algo.
Mohd Arif
 
Cyrus beck line clipping algorithm
Cyrus beck line clipping algorithmCyrus beck line clipping algorithm
Cyrus beck line clipping algorithm
Pooja Dixit
 
Circle generation algorithm
Circle generation algorithmCircle generation algorithm
Circle generation algorithm
Ankit Garg
 
Computer graphics LINE DRAWING algorithm.pptx
Computer graphics LINE DRAWING algorithm.pptxComputer graphics LINE DRAWING algorithm.pptx
Computer graphics LINE DRAWING algorithm.pptx
R S Anu Prabha
 
Intro to scan conversion
Intro to scan conversionIntro to scan conversion
Intro to scan conversion
Mohd Arif
 
Polygon clipping
Polygon clippingPolygon clipping
Polygon clipping
Mohd Arif
 
Unit 3
Unit 3Unit 3
Unit 3
ypnrao
 
Bresenham's line drawing algorithm
Bresenham's line drawing algorithmBresenham's line drawing algorithm
Bresenham's line drawing algorithm
nehrurevathy
 
Circle drawing algo.
Circle drawing algo.Circle drawing algo.
Circle drawing algo.
Mohd Arif
 

Similar to Computer graphics lab report with code in cpp (20)
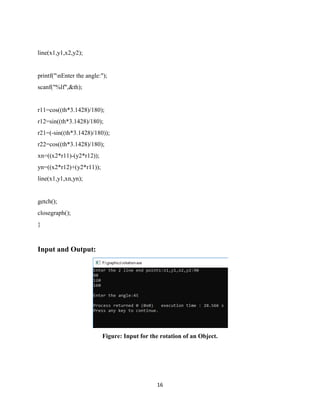
Chapter 3 Output Primitives
Chapter 3 Output PrimitivesChapter 3 Output Primitives
Chapter 3 Output Primitives
PrathimaBaliga
 
Computer Graphics - lines, Circles and ellipse
Computer Graphics - lines, Circles and ellipseComputer Graphics - lines, Circles and ellipse
Computer Graphics - lines, Circles and ellipse
Hisham Al Kurdi, EAVA, DMC-D-4K, HCCA-P, HCAA-D
 
Computer Graphics Unit 2
Computer Graphics Unit 2Computer Graphics Unit 2
Computer Graphics Unit 2
SanthiNivas
 
Computer graphics
Computer graphics   Computer graphics
Computer graphics
Prianka Padmanaban
 
Computer graphics
Computer graphics   Computer graphics
Computer graphics
Prianka Padmanaban
 
Chapter 3 - Part 1 [Autosaved].pptx
Chapter 3 - Part 1 [Autosaved].pptxChapter 3 - Part 1 [Autosaved].pptx
Chapter 3 - Part 1 [Autosaved].pptx
Kokebe2
 
Lines and curves algorithms
Lines and curves algorithmsLines and curves algorithms
Lines and curves algorithms
Mohammad Sadiq
 
Computer graphics
Computer graphicsComputer graphics
Computer graphics
Nanhen Verma
 
Output Primitives in Computer Graphics and Multimedia
Output Primitives in Computer Graphics and MultimediaOutput Primitives in Computer Graphics and Multimedia
Output Primitives in Computer Graphics and Multimedia
saranyan75
 
Computer Graphics and Multimedia Output primitives
Computer Graphics and Multimedia Output primitivesComputer Graphics and Multimedia Output primitives
Computer Graphics and Multimedia Output primitives
saranyan75
 
Computer Graphics_Module 2_Output Primitives.pdf
Computer Graphics_Module 2_Output Primitives.pdfComputer Graphics_Module 2_Output Primitives.pdf
Computer Graphics_Module 2_Output Primitives.pdf
tabbu23
 
2.Line,circle drawing.ppt line circlw drawing algorith
2.Line,circle drawing.ppt line circlw drawing algorith2.Line,circle drawing.ppt line circlw drawing algorith
2.Line,circle drawing.ppt line circlw drawing algorith
SwatiChauhan63735
 
CD504 CGM_Lab Manual_004e08d3838702ed11fc6d03cc82f7be.pdf
CD504 CGM_Lab Manual_004e08d3838702ed11fc6d03cc82f7be.pdfCD504 CGM_Lab Manual_004e08d3838702ed11fc6d03cc82f7be.pdf
CD504 CGM_Lab Manual_004e08d3838702ed11fc6d03cc82f7be.pdf
RajJain516913
 
2.circle
2.circle2.circle
2.circle
SakshiNailwal
 
Unit 2
Unit 2Unit 2
Unit 2
ypnrao
 
Line drawing algorithm and antialiasing techniques
Line drawing algorithm and antialiasing techniquesLine drawing algorithm and antialiasing techniques
Line drawing algorithm and antialiasing techniques
Ankit Garg
 
Computer graphics 2
Computer graphics 2Computer graphics 2
Computer graphics 2
Prabin Gautam
 
Output Primitive and Brenshamas Line.pptx
Output Primitive and Brenshamas Line.pptxOutput Primitive and Brenshamas Line.pptx
Output Primitive and Brenshamas Line.pptx
NaveenaKarthik3
 
Computer graphics lab manual
Computer graphics lab manualComputer graphics lab manual
Computer graphics lab manual
Ankit Kumar
 
raster algorithm.pdf
raster algorithm.pdfraster algorithm.pdf
raster algorithm.pdf
Mattupallipardhu
 
Chapter 3 Output Primitives
Chapter 3 Output PrimitivesChapter 3 Output Primitives
Chapter 3 Output Primitives
PrathimaBaliga
 
Computer Graphics Unit 2
Computer Graphics Unit 2Computer Graphics Unit 2
Computer Graphics Unit 2
SanthiNivas
 
Chapter 3 - Part 1 [Autosaved].pptx
Chapter 3 - Part 1 [Autosaved].pptxChapter 3 - Part 1 [Autosaved].pptx
Chapter 3 - Part 1 [Autosaved].pptx
Kokebe2
 
Lines and curves algorithms
Lines and curves algorithmsLines and curves algorithms
Lines and curves algorithms
Mohammad Sadiq
 
Output Primitives in Computer Graphics and Multimedia
Output Primitives in Computer Graphics and MultimediaOutput Primitives in Computer Graphics and Multimedia
Output Primitives in Computer Graphics and Multimedia
saranyan75
 
Computer Graphics and Multimedia Output primitives
Computer Graphics and Multimedia Output primitivesComputer Graphics and Multimedia Output primitives
Computer Graphics and Multimedia Output primitives
saranyan75
 
Computer Graphics_Module 2_Output Primitives.pdf
Computer Graphics_Module 2_Output Primitives.pdfComputer Graphics_Module 2_Output Primitives.pdf
Computer Graphics_Module 2_Output Primitives.pdf
tabbu23
 
2.Line,circle drawing.ppt line circlw drawing algorith
2.Line,circle drawing.ppt line circlw drawing algorith2.Line,circle drawing.ppt line circlw drawing algorith
2.Line,circle drawing.ppt line circlw drawing algorith
SwatiChauhan63735
 
CD504 CGM_Lab Manual_004e08d3838702ed11fc6d03cc82f7be.pdf
CD504 CGM_Lab Manual_004e08d3838702ed11fc6d03cc82f7be.pdfCD504 CGM_Lab Manual_004e08d3838702ed11fc6d03cc82f7be.pdf
CD504 CGM_Lab Manual_004e08d3838702ed11fc6d03cc82f7be.pdf
RajJain516913
 
Unit 2
Unit 2Unit 2
Unit 2
ypnrao
 
Line drawing algorithm and antialiasing techniques
Line drawing algorithm and antialiasing techniquesLine drawing algorithm and antialiasing techniques
Line drawing algorithm and antialiasing techniques
Ankit Garg
 
Output Primitive and Brenshamas Line.pptx
Output Primitive and Brenshamas Line.pptxOutput Primitive and Brenshamas Line.pptx
Output Primitive and Brenshamas Line.pptx
NaveenaKarthik3
 
Computer graphics lab manual
Computer graphics lab manualComputer graphics lab manual
Computer graphics lab manual
Ankit Kumar
 
Ad

More from Alamgir Hossain (13)

How to write a project proposal for software engineering course
How to write a project proposal for software engineering courseHow to write a project proposal for software engineering course
How to write a project proposal for software engineering course
Alamgir Hossain
 
Malware Detection Approaches using Data Mining Techniques.pptx
Malware Detection Approaches using Data Mining Techniques.pptxMalware Detection Approaches using Data Mining Techniques.pptx
Malware Detection Approaches using Data Mining Techniques.pptx
Alamgir Hossain
 
5 nested if in c with proper example
5 nested if in c with proper example5 nested if in c with proper example
5 nested if in c with proper example
Alamgir Hossain
 
4. decision making and some basic problem
4. decision making and some basic problem4. decision making and some basic problem
4. decision making and some basic problem
Alamgir Hossain
 
3. user input and some basic problem
3. user input and some basic problem3. user input and some basic problem
3. user input and some basic problem
Alamgir Hossain
 
2. introduction of a c program
2. introduction of a c program2. introduction of a c program
2. introduction of a c program
Alamgir Hossain
 
1. importance of c
1. importance of c1. importance of c
1. importance of c
Alamgir Hossain
 
Report on student-faculty document sharing android project
Report on student-faculty document sharing android projectReport on student-faculty document sharing android project
Report on student-faculty document sharing android project
Alamgir Hossain
 
A lab report on modeling and simulation with python code
A lab report on modeling and simulation with python codeA lab report on modeling and simulation with python code
A lab report on modeling and simulation with python code
Alamgir Hossain
 
Lab report on to plot efficiency of pure and slotted aloha in matlab a data c...
Lab report on to plot efficiency of pure and slotted aloha in matlab a data c...Lab report on to plot efficiency of pure and slotted aloha in matlab a data c...
Lab report on to plot efficiency of pure and slotted aloha in matlab a data c...
Alamgir Hossain
 
Lab report for Prolog program in artificial intelligence.
Lab report for Prolog program in artificial intelligence.Lab report for Prolog program in artificial intelligence.
Lab report for Prolog program in artificial intelligence.
Alamgir Hossain
 
Digital signal Processing all matlab code with Lab report
Digital signal Processing all matlab code with Lab report Digital signal Processing all matlab code with Lab report
Digital signal Processing all matlab code with Lab report
Alamgir Hossain
 
Microsoft Teams
Microsoft TeamsMicrosoft Teams
Microsoft Teams
Alamgir Hossain
 
How to write a project proposal for software engineering course
How to write a project proposal for software engineering courseHow to write a project proposal for software engineering course
How to write a project proposal for software engineering course
Alamgir Hossain
 
Malware Detection Approaches using Data Mining Techniques.pptx
Malware Detection Approaches using Data Mining Techniques.pptxMalware Detection Approaches using Data Mining Techniques.pptx
Malware Detection Approaches using Data Mining Techniques.pptx
Alamgir Hossain
 
5 nested if in c with proper example
5 nested if in c with proper example5 nested if in c with proper example
5 nested if in c with proper example
Alamgir Hossain
 
4. decision making and some basic problem
4. decision making and some basic problem4. decision making and some basic problem
4. decision making and some basic problem
Alamgir Hossain
 
3. user input and some basic problem
3. user input and some basic problem3. user input and some basic problem
3. user input and some basic problem
Alamgir Hossain
 
2. introduction of a c program
2. introduction of a c program2. introduction of a c program
2. introduction of a c program
Alamgir Hossain
 
Report on student-faculty document sharing android project
Report on student-faculty document sharing android projectReport on student-faculty document sharing android project
Report on student-faculty document sharing android project
Alamgir Hossain
 
A lab report on modeling and simulation with python code
A lab report on modeling and simulation with python codeA lab report on modeling and simulation with python code
A lab report on modeling and simulation with python code
Alamgir Hossain
 
Lab report on to plot efficiency of pure and slotted aloha in matlab a data c...
Lab report on to plot efficiency of pure and slotted aloha in matlab a data c...Lab report on to plot efficiency of pure and slotted aloha in matlab a data c...
Lab report on to plot efficiency of pure and slotted aloha in matlab a data c...
Alamgir Hossain
 
Lab report for Prolog program in artificial intelligence.
Lab report for Prolog program in artificial intelligence.Lab report for Prolog program in artificial intelligence.
Lab report for Prolog program in artificial intelligence.
Alamgir Hossain
 
Digital signal Processing all matlab code with Lab report
Digital signal Processing all matlab code with Lab report Digital signal Processing all matlab code with Lab report
Digital signal Processing all matlab code with Lab report
Alamgir Hossain
 
Ad

Recently uploaded (20)

How to Manage Purchase Alternatives in Odoo 18
How to Manage Purchase Alternatives in Odoo 18How to Manage Purchase Alternatives in Odoo 18
How to Manage Purchase Alternatives in Odoo 18
Celine George
 
Presentation of the MIPLM subject matter expert Erdem Kaya
Presentation of the MIPLM subject matter expert Erdem KayaPresentation of the MIPLM subject matter expert Erdem Kaya
Presentation of the MIPLM subject matter expert Erdem Kaya
MIPLM
 
dynastic art of the Pallava dynasty south India
dynastic art of the Pallava dynasty south Indiadynastic art of the Pallava dynasty south India
dynastic art of the Pallava dynasty south India
PrachiSontakke5
 
World war-1(Causes & impacts at a glance) PPT by Simanchala Sarab(BABed,sem-4...
World war-1(Causes & impacts at a glance) PPT by Simanchala Sarab(BABed,sem-4...World war-1(Causes & impacts at a glance) PPT by Simanchala Sarab(BABed,sem-4...
World war-1(Causes & impacts at a glance) PPT by Simanchala Sarab(BABed,sem-4...
larencebapu132
 
K12 Tableau Tuesday - Algebra Equity and Access in Atlanta Public Schools
K12 Tableau Tuesday  - Algebra Equity and Access in Atlanta Public SchoolsK12 Tableau Tuesday  - Algebra Equity and Access in Atlanta Public Schools
K12 Tableau Tuesday - Algebra Equity and Access in Atlanta Public Schools
dogden2
 
Odoo Inventory Rules and Routes v17 - Odoo Slides
Odoo Inventory Rules and Routes v17 - Odoo SlidesOdoo Inventory Rules and Routes v17 - Odoo Slides
Odoo Inventory Rules and Routes v17 - Odoo Slides
Celine George
 
apa-style-referencing-visual-guide-2025.pdf
apa-style-referencing-visual-guide-2025.pdfapa-style-referencing-visual-guide-2025.pdf
apa-style-referencing-visual-guide-2025.pdf
Ishika Ghosh
 
One Hot encoding a revolution in Machine learning
One Hot encoding a revolution in Machine learningOne Hot encoding a revolution in Machine learning
One Hot encoding a revolution in Machine learning
momer9505
 
Introduction to Vibe Coding and Vibe Engineering
Introduction to Vibe Coding and Vibe EngineeringIntroduction to Vibe Coding and Vibe Engineering
Introduction to Vibe Coding and Vibe Engineering
Damian T. Gordon
 
How to track Cost and Revenue using Analytic Accounts in odoo Accounting, App...
How to track Cost and Revenue using Analytic Accounts in odoo Accounting, App...How to track Cost and Revenue using Analytic Accounts in odoo Accounting, App...
How to track Cost and Revenue using Analytic Accounts in odoo Accounting, App...
Celine George
 
Contact Lens:::: An Overview.pptx.: Optometry
Contact Lens:::: An Overview.pptx.: OptometryContact Lens:::: An Overview.pptx.: Optometry
Contact Lens:::: An Overview.pptx.: Optometry
MushahidRaza8
 
CBSE - Grade 8 - Science - Chemistry - Metals and Non Metals - Worksheet
CBSE - Grade 8 - Science - Chemistry - Metals and Non Metals - WorksheetCBSE - Grade 8 - Science - Chemistry - Metals and Non Metals - Worksheet
CBSE - Grade 8 - Science - Chemistry - Metals and Non Metals - Worksheet
Sritoma Majumder
 
Link your Lead Opportunities into Spreadsheet using odoo CRM
Link your Lead Opportunities into Spreadsheet using odoo CRMLink your Lead Opportunities into Spreadsheet using odoo CRM
Link your Lead Opportunities into Spreadsheet using odoo CRM
Celine George
 
2541William_McCollough_DigitalDetox.docx
2541William_McCollough_DigitalDetox.docx2541William_McCollough_DigitalDetox.docx
2541William_McCollough_DigitalDetox.docx
contactwilliamm2546
 
Exercise Physiology MCQS By DR. NASIR MUSTAFA
Exercise Physiology MCQS By DR. NASIR MUSTAFAExercise Physiology MCQS By DR. NASIR MUSTAFA
Exercise Physiology MCQS By DR. NASIR MUSTAFA
Dr. Nasir Mustafa
 
SCI BIZ TECH QUIZ (OPEN) PRELIMS XTASY 2025.pptx
SCI BIZ TECH QUIZ (OPEN) PRELIMS XTASY 2025.pptxSCI BIZ TECH QUIZ (OPEN) PRELIMS XTASY 2025.pptx
SCI BIZ TECH QUIZ (OPEN) PRELIMS XTASY 2025.pptx
Ronisha Das
 
"Basics of Heterocyclic Compounds and Their Naming Rules"
"Basics of Heterocyclic Compounds and Their Naming Rules""Basics of Heterocyclic Compounds and Their Naming Rules"
"Basics of Heterocyclic Compounds and Their Naming Rules"
rupalinirmalbpharm
 
Engage Donors Through Powerful Storytelling.pdf
Engage Donors Through Powerful Storytelling.pdfEngage Donors Through Powerful Storytelling.pdf
Engage Donors Through Powerful Storytelling.pdf
TechSoup
 
How to Manage Opening & Closing Controls in Odoo 17 POS
How to Manage Opening & Closing Controls in Odoo 17 POSHow to Manage Opening & Closing Controls in Odoo 17 POS
How to Manage Opening & Closing Controls in Odoo 17 POS
Celine George
 
Introduction-to-Communication-and-Media-Studies-1736283331.pdf
Introduction-to-Communication-and-Media-Studies-1736283331.pdfIntroduction-to-Communication-and-Media-Studies-1736283331.pdf
Introduction-to-Communication-and-Media-Studies-1736283331.pdf
james5028
 
How to Manage Purchase Alternatives in Odoo 18
How to Manage Purchase Alternatives in Odoo 18How to Manage Purchase Alternatives in Odoo 18
How to Manage Purchase Alternatives in Odoo 18
Celine George
 
Presentation of the MIPLM subject matter expert Erdem Kaya
Presentation of the MIPLM subject matter expert Erdem KayaPresentation of the MIPLM subject matter expert Erdem Kaya
Presentation of the MIPLM subject matter expert Erdem Kaya
MIPLM
 
dynastic art of the Pallava dynasty south India
dynastic art of the Pallava dynasty south Indiadynastic art of the Pallava dynasty south India
dynastic art of the Pallava dynasty south India
PrachiSontakke5
 
World war-1(Causes & impacts at a glance) PPT by Simanchala Sarab(BABed,sem-4...
World war-1(Causes & impacts at a glance) PPT by Simanchala Sarab(BABed,sem-4...World war-1(Causes & impacts at a glance) PPT by Simanchala Sarab(BABed,sem-4...
World war-1(Causes & impacts at a glance) PPT by Simanchala Sarab(BABed,sem-4...
larencebapu132
 
K12 Tableau Tuesday - Algebra Equity and Access in Atlanta Public Schools
K12 Tableau Tuesday  - Algebra Equity and Access in Atlanta Public SchoolsK12 Tableau Tuesday  - Algebra Equity and Access in Atlanta Public Schools
K12 Tableau Tuesday - Algebra Equity and Access in Atlanta Public Schools
dogden2
 
Odoo Inventory Rules and Routes v17 - Odoo Slides
Odoo Inventory Rules and Routes v17 - Odoo SlidesOdoo Inventory Rules and Routes v17 - Odoo Slides
Odoo Inventory Rules and Routes v17 - Odoo Slides
Celine George
 
apa-style-referencing-visual-guide-2025.pdf
apa-style-referencing-visual-guide-2025.pdfapa-style-referencing-visual-guide-2025.pdf
apa-style-referencing-visual-guide-2025.pdf
Ishika Ghosh
 
One Hot encoding a revolution in Machine learning
One Hot encoding a revolution in Machine learningOne Hot encoding a revolution in Machine learning
One Hot encoding a revolution in Machine learning
momer9505
 
Introduction to Vibe Coding and Vibe Engineering
Introduction to Vibe Coding and Vibe EngineeringIntroduction to Vibe Coding and Vibe Engineering
Introduction to Vibe Coding and Vibe Engineering
Damian T. Gordon
 
How to track Cost and Revenue using Analytic Accounts in odoo Accounting, App...
How to track Cost and Revenue using Analytic Accounts in odoo Accounting, App...How to track Cost and Revenue using Analytic Accounts in odoo Accounting, App...
How to track Cost and Revenue using Analytic Accounts in odoo Accounting, App...
Celine George
 
Contact Lens:::: An Overview.pptx.: Optometry
Contact Lens:::: An Overview.pptx.: OptometryContact Lens:::: An Overview.pptx.: Optometry
Contact Lens:::: An Overview.pptx.: Optometry
MushahidRaza8
 
CBSE - Grade 8 - Science - Chemistry - Metals and Non Metals - Worksheet
CBSE - Grade 8 - Science - Chemistry - Metals and Non Metals - WorksheetCBSE - Grade 8 - Science - Chemistry - Metals and Non Metals - Worksheet
CBSE - Grade 8 - Science - Chemistry - Metals and Non Metals - Worksheet
Sritoma Majumder
 
Link your Lead Opportunities into Spreadsheet using odoo CRM
Link your Lead Opportunities into Spreadsheet using odoo CRMLink your Lead Opportunities into Spreadsheet using odoo CRM
Link your Lead Opportunities into Spreadsheet using odoo CRM
Celine George
 
2541William_McCollough_DigitalDetox.docx
2541William_McCollough_DigitalDetox.docx2541William_McCollough_DigitalDetox.docx
2541William_McCollough_DigitalDetox.docx
contactwilliamm2546
 
Exercise Physiology MCQS By DR. NASIR MUSTAFA
Exercise Physiology MCQS By DR. NASIR MUSTAFAExercise Physiology MCQS By DR. NASIR MUSTAFA
Exercise Physiology MCQS By DR. NASIR MUSTAFA
Dr. Nasir Mustafa
 
SCI BIZ TECH QUIZ (OPEN) PRELIMS XTASY 2025.pptx
SCI BIZ TECH QUIZ (OPEN) PRELIMS XTASY 2025.pptxSCI BIZ TECH QUIZ (OPEN) PRELIMS XTASY 2025.pptx
SCI BIZ TECH QUIZ (OPEN) PRELIMS XTASY 2025.pptx
Ronisha Das
 
"Basics of Heterocyclic Compounds and Their Naming Rules"
"Basics of Heterocyclic Compounds and Their Naming Rules""Basics of Heterocyclic Compounds and Their Naming Rules"
"Basics of Heterocyclic Compounds and Their Naming Rules"
rupalinirmalbpharm
 
Engage Donors Through Powerful Storytelling.pdf
Engage Donors Through Powerful Storytelling.pdfEngage Donors Through Powerful Storytelling.pdf
Engage Donors Through Powerful Storytelling.pdf
TechSoup
 
How to Manage Opening & Closing Controls in Odoo 17 POS
How to Manage Opening & Closing Controls in Odoo 17 POSHow to Manage Opening & Closing Controls in Odoo 17 POS
How to Manage Opening & Closing Controls in Odoo 17 POS
Celine George
 
Introduction-to-Communication-and-Media-Studies-1736283331.pdf
Introduction-to-Communication-and-Media-Studies-1736283331.pdfIntroduction-to-Communication-and-Media-Studies-1736283331.pdf
Introduction-to-Communication-and-Media-Studies-1736283331.pdf
james5028
 

Computer graphics lab report with code in cpp

  • 1. 1 01. Name of the Problem: Program for the generation of Bresenham Line Drawing. Objective: To generate basic line according to Bresenham’s Line-Drawing Algorithm. Algorithm: 1. Input the two line endpoints and store the left endpoint in (x0, y0). 2. Set the color for frame-buffer position (x0, y0); i.e., plot the first point. 3. Calculate the constants _x, _y, 2_y, and 2_y − 2_x, and obtain the Starting value for the decision parameter as p0 = 2_y − _x. 4. At each xk along the line, starting at k = 0, perform the following test: If pk < 0, the next point to plot is (xk + 1, yk ) and pk+1 = pk + 2_y.Otherwise, the next point to plot is (xk + 1, yk + 1) and pk+1 = pk + 2_y − 2_x. 5. Repeat step 4 _x − 1 more times. Source Program: #include<iostream> #include<graphics.h> using namespace std; int main() { initwindow(500,600); int x0,y0,x1,y1; cout<<"Enter the First Line Coordinates:"; cin>>x0>>y0; cout<<"Enter the Second Line Coordinates:"; cin>>x1>>y1; int dx=x1-x0; int dy=y1-y0; int d=2*dy-dx; int incrE=2*dy; int incrNE=2*(dy-dx); int x=x0; int y=y0;
  • 3. 3 Figure: output of the line drawing. Result and Discussion: From the sample output we can see that the Bresenham’s Line- Drawing is very successful. For the following above Bresenham’s Line-Drawing code the output picture is generated.
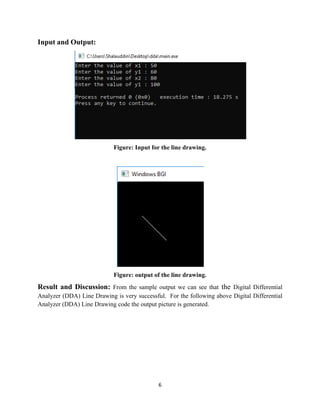
  • 4. 4 02. Name of the Problem: Program for the generation of Digital Differential Analyzer (DDA) Line Drawing. Objective: To generate basic line according to Digital Differential Analyzer (DDA) Line Drawing Algorithm. Algorithm: 1. Input the two line endpoints and store the left endpoint in (x0, y0). 2. Set the color for frame-buffer position (x0, y0); i.e., plot the first point. 3. Calculate the constants x, y, 2y, and 2y − 2x, and If x= 1 the next point to plot is yk+1 =yk + m and If y= 1 the next point to plot is xk+1 =xk + 1/m 4. At each xk along the line, starting at k = 0, perform the following test: If x= -1 the next point to plot is yk+1 =yk – m and If y= -1 the next point to plot is xk+1 =xk – 1/m and 5. Repeat step (4) x − 1 more times. Source Program: #include <graphics.h> #include <stdio.h> #include <math.h> int main( ) { float x,y,x1,y1,x2,y2,dx,dy,pixel; int i,gd,gm; printf("Enter the value of x1 : "); scanf("%f",&x1); printf("Enter the value of y1 : "); scanf("%f",&y1); printf("Enter the value of x2 : "); scanf("%f",&x2); printf("Enter the value of y1 : "); scanf("%f",&y2); detectgraph(&gd,&gm);
  • 6. 6 Input and Output: Figure: Input for the line drawing. Figure: output of the line drawing. Result and Discussion: From the sample output we can see that the Digital Differential Analyzer (DDA) Line Drawing is very successful. For the following above Digital Differential Analyzer (DDA) Line Drawing code the output picture is generated.
  • 7. 7 03. Name of the Problem: Program for the generation of Midpoint Circle Drawing. Objective: To generate basic circle according to Midpoint Circle Drawing Algorithm. Algorithm: 1. Input radius r and circle center (xc , yc ), then set the coordinates for the first point on the circumference of a circle centered on the origin as (x0, y0) = (0, r ) 2. Calculate the initial value of the decision parameter as p0 = (5/ 4) − r 3. At each xk position, starting at k = 0, perform the following test: If pk <0, the next point along the circle centered on (0, 0) is (xk+1, yk ) and pk+1 = pk + 2xk+1 + 1 Otherwise, the next point along the circle is (xk + 1, yk − 1) and pk+1 = pk + 2xk+1 + 1 − 2yk+1 where 2xk+1 = 2xk + 2 and 2yk+1 = 2yk − 2. 4. Determine symmetry points in the other seven octants. 5. Move each calculated pixel position (x, y) onto the circular path centered at (xc , yc ) and plot the coordinate values as follows: x = x + xc , y = y + yc. 6. Repeat steps 3 through 5 until x ≥ y. Source Program: #include<iostream> #include<graphics.h> using namespace std; void drawcircle(int x0, int y0, int radius) { int x = radius; int y = 0; int err = 0; while (x >= y) { putpixel(x0 + x, y0 + y, 7); putpixel(x0 + y, y0 + x, 7); putpixel(x0 - y, y0 + x, 7); putpixel(x0 - x, y0 + y, 7); putpixel(x0 - x, y0 - y, 7);
  • 8. 8 putpixel(x0 - y, y0 - x, 7); putpixel(x0 + y, y0 - x, 7); putpixel(x0 + x, y0 - y, 7); if (err <= 0) { y += 1; err += 2*y + 1; } if (err > 0) { x -= 1; err -= 2*x + 1; } } } int main() { int gdriver=DETECT, gmode, error, x, y, r; initgraph(&gdriver, &gmode, "c:turboc3bgi"); cout<<"Enter radius of circle: "; cin>>r; cout<<"Enter co-ordinates of center(x and y): "; cin>>x>>y; drawcircle(x, y, r); delay(50000); closegraph(); return 0; }
  • 9. 9 Input and Output: Figure: Input for the circle drawing. Figure: output of the circle drawing. Result and Discussion: From the sample output we can see that the Midpoint Circle Drawing was very successful. For the following above Midpoint Circle Drawing code the output picture is generated.
  • 10. 10 04. Name of the Problem: Program for the generation of Midpoint Ellipse Drawing. Objective: To generate basic ellipse according to Midpoint Ellipse Drawing Algorithm. Algorithm: 1. Input rx, ry, and ellipse center (xc , yc ), and obtain the first point on an ellipse centered on the origin as (x0, y0) = (0, ry) 2. Calculate the initial value of the decision parameter in region 1 as p10 = r 2 y− r 2 xry + 1 /4 r2 x 3. At each xk position in region 1, starting at k = 0, perform the following test: If p1k <0, the next point along the ellipse centered on (0, 0) is (xk+1, yk ) and p1k+1 = p1k + 2r 2 y xk+1 + r 2 y .Otherwise, the next point along the ellipse is (xk + 1, yk − 1) andp1k+1 = p1k + 2r 2 yxk+1 − 2r 2 x yk+1 + r 2 y with2r 2 yxk+1 = 2r 2 yxk + 2r 2 y, 2r 2 x yk+1 = 2r 2 x yk − 2r 2 x and continue until 2r 2 yx ≥ 2r x y. 4. Calculate the initial value of the decision parameter in region 2 as p20 = r 2 Y(x0 + ½)2 + r 2 x (y0 − 1)2 − r 2 xr 2 y where (x0, y0) is the last position calculated in region 1. 5. At each yk position in region 2, starting at k = 0, perform the following test: If p2k >0, the next point along the ellipse centered on (0, 0) is (xk , yk − 1) and p2k+1 = p2k − 2r 2 x yk+1 + r 2 x .Otherwise, the next point along the ellipse is (xk + 1, yk − 1) and p2k+1 = p2k + 2r 2 yxk+1 − 2r 2 x yk+1 + r 2 x using the same incremental calculations for x and y as in region 1. Continue until y = 0. 6. For both regions, determine symmetry points in the other three quadrants. 7. Move each calculated pixel position (x, y) onto the elliptical path centered on (xc , yc ) and plot these coordinate values: x = x + xc , y = y + yc. Source Program: #include<graphics.h> #include<stdlib.h> #include<iostream> using namespace std; int main() { int gd = DETECT, gm; int xc,yc,x,y;float p; long rx,ry; initgraph(&gd, &gm, "C:TCBGI");
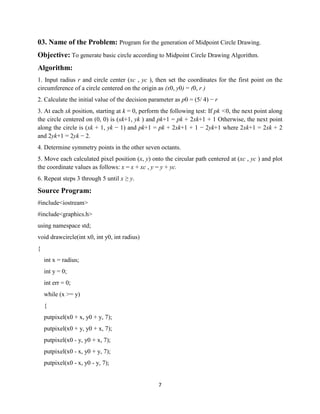
  • 11. 11 cout<<"Enter coordinates of centre : "; cin>>xc>>yc; cout<<"Enter x,y radius of ellipse: "; cin>>rx>>ry; p=ry*ry-rx*rx*ry+rx*rx/4; x=0;y=ry; while(2.0*ry*ry*x <= 2.0*rx*rx*y) { if(p < 0) { x++; p = p+2*ry*ry*x+ry*ry; } else { x++;y--; p = p+2*ry*ry*x-2*rx*rx*y-ry*ry;} putpixel(xc+x,yc+y,WHITE); putpixel(xc+x,yc-y,WHITE); putpixel(xc-x,yc+y,WHITE); putpixel(xc-x,yc-y,WHITE); } p=ry*ry*(x+0.5)*(x+0.5)+rx*rx*(y-1)*(y-1)-rx*rx*ry*ry; while(y > 0) { if(p <= 0) { x++;y--; p = p+2*ry*ry*x-2*rx*rx*y+rx*rx; } else { y--; p = p-2*rx*rx*y+rx*rx; } putpixel(xc+x,yc+y,WHITE); putpixel(xc+x,yc-y,WHITE); putpixel(xc-x,yc+y,WHITE);
  • 12. 12 putpixel(xc-x,yc-y,WHITE); } delay(50000); closegraph(); return 0; } Input and Output: Figure: Input for the ellipse drawing. Figure: output of the ellipse drawing. Result and Discussion: From the sample output we can see that the Midpoint Ellipse Drawing is very successful. For the following above Midpoint Ellipse Drawing code the output picture is generated.
  • 13. 13 05. Name of the Problem: Program for the generation of Translating an object. Objective: To reposition an object it along a straight-line path from on coordinate location to another coordinate according to Translation Algorithm. Algorithm: 1) Start 2) Initialize the graphics mode. 3) Construct a 2D object (use Drawpoly()) e.g. (x,y) 4) Get the translation value tx, ty 5) Move the 2d object with tx, ty (x’=x+tx,y’=y+ty) 6) Plot (x’,y’) Source Program: #include<bits/stdc++.h> #include<graphics.h> using namespace std; void translateLine ( int P[][2], int T[]) { initwindow(600,800); int gd = DETECT, gm, errorcode; initgraph (&gd, &gm, "c:tcbgi"); ine(getmaxx()/2,0,getmaxx()/2,getmaxy()); line(0,getmaxy()/2,getmaxx(),getmaxy()/2); line(P[0][0], P[0][1], P[1][0], P[1][1]); P[0][0] = P[0][0] + T[0]; P[0][1] = P[0][1] + T[1]; P[1][0] = P[1][0] + T[0]; P[1][1] = P[1][1] + T[1]; setcolor(3); line(P[0][0], P[0][1], P[1][0], P[1][1]);
  • 14. 14 closegraph(); } int main() { int P[2][2] = {60, 70, 30, 50}; // coordinates of point int T[] = {10, 20}; // translation factor translateLine (P, T); delay(50000); closegraph(); return 0; } Input and Output: Coordinates of point: 60, 70, 30, 50 Translation factor: 10, 20 Figure: output of the ellipse drawing. Result and Discussion: From the sample output we can see that the translating an object is very successful. For the following above translation code the output picture is generated.
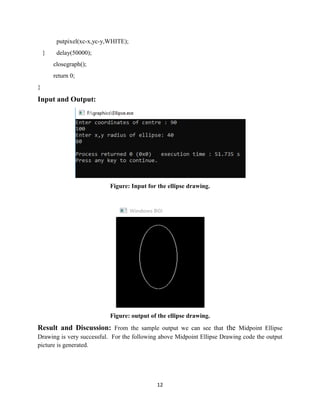
  • 15. 15 06. Name of the Problem: Program for the generation of Rotating an Object. Objective: To reposition an object it along a circular path in the xy plane according to Rotation Algorithm. Algorithm: 1. Start 2. Initialize the graphics mode. 3. Construct a 2D object (use Drawpoly()) e.g. (x,y) 4. Get the Rotation angle 5.Rotate the object by the angle ф x’=x cos ф - y sin ф y’=x sin ф - y cosф 6. Plot (x’,y’) Source Program: #include<graphics.h> #include<stdlib.h> #include<stdio.h> #include<math.h> int main() { int graphdriver=DETECT,graphmode,errorcode; int i; int x2,y2,x1,y1,x,y,xn,yn; double r11,r12,r21,r22,th; printf("Enter the 2 line end points:"); printf("x1,y1,x2,y2:"); scanf("%d%d%d%d",&x1,&y1,&x2,&y2); initgraph(&graphdriver,&graphmode,"c:tcbgi");
  • 17. 17 Figure: output of the rotation of an Object Result and Discussion: From the sample output we can see that the rotation of an Object is very successful. For the following above Rotation of an object code the output picture is generated.
  • 18. 18 07. Name of the Problem: Program for the generation of scaling an object. Objective: To alter the size of an object by multiplying the coordinate values(x, y) according to Scaling Algorithm. Algorithm: 1. Start 2. Initialize the graphics mode. 3. Construct a 2D object (use Drawpoly()) e.g. (x,y) 4. Get the scaling value Sx,Sy 5. Resize the object with Sx,Sy (x’=x*Sx,y’=y*Sy) 6. Plot (x’,y’) Source Program: #include<stdio.h> #include<graphics.h> void findNewCoordinate(int s[][2], int p[][1]) { int temp[2][1] = { 0 }; for (int i = 0; i < 2; i++) for (int j = 0; j < 1; j++) for (int k = 0; k < 2; k++) temp[i][j] += (s[i][k] * p[k][j]); p[0][0] = temp[0][0]; p[1][0] = temp[1][0]; } void scale(int x[], int y[], int sx, int sy) { line(x[0], y[0], x[1], y[1]); line(x[1], y[1], x[2], y[2]); line(x[2], y[2], x[0], y[0]);
  • 19. 19 int s[2][2] = { sx, 0, 0, sy }; int p[2][1]; for (int i = 0; i < 3; i++) { p[0][0] = x[i]; p[1][0] = y[i]; findNewCoordinate(s, p); x[i] = p[0][0]; y[i] = p[1][0]; } line(x[0], y[0], x[1], y[1]); line(x[1], y[1], x[2], y[2]); line(x[2], y[2], x[0], y[0]); } int main() { int x[] = { 50, 100, 150 }; int y[] = { 100, 50, 100 }; int sx = 2, sy = 2; int gd, gm; detectgraph(&gd, &gm); initgraph(&gd, &gm," "); scale(x, y, sx,sy); getch(); return 0; }
  • 20. 20 Input and Output: Drawing X axis: line (0,240,640,240) Drawing Y axis: line (320, 0,320,480) Original object: 500, 20 Transformed object: 500, 50 Figure: output of the scaling of an object. Result and Discussion: From the sample output we can see that the scaling of an object is very successful. For the following above the scaling of an object code the output picture is generated.