SlideShare a Scribd company logo
PUNJAB COLLEGE OF
      TECHNICAL EDUCATION


PRACTICAL
   FILE                 BC-507

SUBMITTED BY:          SUBMITTED BY:
Ms.Richa Sharma         Neha Sharma
Assistant Professor     (94972346352)
P.C.T.E.              BCA-5th Sem


                                        Page | 0
Index

S.No Contents                      Page no. Remarks
1.   Introduction to graphics      2
2.   Applications of graphics      3-5
3.   Graphics In-built functions   6-15
4.   Programs of Algorithm      16-26
     a) Direct method of line
     b) DDA Algorithm
     c) Bresenham algorithm
     d) Direct method of Circle
     e) Polar Circle
     f) Bresenham Circle
     g) Midpoint Circle
     h) Direct Ellipse
     i) Polar Ellipse
     j) Mid point Ellipse
5.   Static Application
6.   Ist dynamic Application
7.   IInd Dynamic Application


                                              Page | 1
1. Introduction To Graphics


Computer graphics are graphics created using computers and, more generally, the
representation and manipulation of image data by a computer with help from specialized
software and hardware.

The development of computer graphics has made computers easier to interact with, and
better for understanding and interpreting many types of data. Developments in computer
graphics have had a profound impact on many types of media and have revolutionized
animation, movies and the video game industry.

the term computer graphics refers to several different things:

   the representation and manipulation of image data by a computer
   the various technologies used to create and manipulate images
   the images so produced, and
   the sub-field of computer science which studies methods for digitally synthesizing and
   manipulating visual content


                                                                                 Page | 2
2. Application of Graphics
Computer graphics may be used in the following areas:

       COMPUTER AIDED DESIGN
       PRESENTATION GRAPHICS
       COMPUTER ART
       ENTERTAINMENT
       EDUCATION AND TRAINING
       VISUALIZATION
       IMAGE PROCESSING
       GRAPHICAL USER INTERFACE
       VIDEO GAMES

Computers have become a powerful tool for the rapid and economical production of
pictures. Advances in computer technology have made interactive computer graphics a
practical tool. Today, computer graphics is used in the areas as science, engineering,
medicine, business, industry, government, art, entertainment, advertising, education, and
training.


COMPUTER AIDED DESIGN
       A major use of computer graphics is in design processes, particularly for
engineering and architectural systems. For some design applications; objects are first
displayed in a wireframe outline form that shows the overall sham and internal features of
objects.

       Software packages for CAD applications typically provide the designer with a multi-
window environment. Each window can show enlarged sections or different views of
objects. Standard shapes for electrical, electronic, and logic circuits are often supplied by
the design package. The connections between the components have been mad
automatically.

       Animations are often used in CAD applications.
       Real-time animations using wire frame displays are useful for testing performance
       of a vehicle.
       Wire frame models allow the designer to see the interior parts of the vehicle during
       motion.
       When object designs are complete, realistic lighting models and surface rendering
       are applied.
       Manufacturing process of object can also be controlled through CAD.

                                                                                   Page | 3
Interactive graphics methods are used to layout the buildings.
     Three-dimensional interior layouts and lighting also provided.
     With virtual-reality systems, the designers can go for a simulated walk inside the
     building.


PRESENTATION GRAPHICS
    It is used to produce illustrations for reports or to generate slide for with
     projections.
    Examples of presentation graphics are bar charts, line graphs, surface graphs, pie
     charts and displays showing relationships between parameters.
    3-D graphics can provide more attraction to the presentation.


COMPUTER ART
    Computer graphics methods are widely used in both fine are and commercial art
     applications.
    The artist uses a combination of 3D modeling packages, texture mapping, drawing
     programs and CAD software.
    Pen plotter with specially designed software can create “automatic art”.
    “Mathematical Art” can be produced using mathematical functions, fractal
     procedures.
    These methods are also applied in commercial art.
    Photorealistic techniques are used to render images of a product.
    Animations are also used frequently in advertising, and television commercials are
     produced frame by frame. Film animations require 24 frames for each second in the
     animation sequence.
    A common graphics method employed in many commercials is morphing, where
     one object is transformed into another.


ENTERTAINMENT
    CG methods are now commonly used in making motion pictures, music videos and
     television shows.
    Many TV series regularly employ computer graphics method.
    Graphics objects can be combined with a live action.


EDUCATION AND TRAINING
    Computer-generated models of physical, financial and economic systems are often
     used as educational aids.

                                                                             Page | 4
   For some training applications, special systems are designed.
    Eg. Training of ship captains, aircraft pilots etc.,
    Some simulators have no video screens, but most simulators provide graphics
     screen for visual operation. Some of them provide only the control panel.


VISUALIZATION
    The numerical and scientific data are converted to a visual form for analysis and to
     study the behavior called visualization.
    Producing graphical representation for scientific data sets are calls scientific
     visualization.
    And business visualization is used to represent the data sets related to commerce
     and industry.
    The visualization can be either 2D or 3D.


IMAGE PROCESSING
    Computer graphics is used to create a picture.
    Image processing applies techniques to modify or interpret existing pictures.
    To apply image processing methods, the image must be digitized first.
    Medical applications also make extensive use of image processing techniques for
     picture enhancements, simulations of operations, etc.


GRAPHICAL USER INTERFACE
    Nowadays software packages provide graphics user interface (GUI) for the user to
     work easily.
    A major component in GUI is a window.
    Multiple windows can be opened at a time.
    To activate any one of the window, the user needs just to check on that window.
    Menus and icons are used for fast selection of processing operations.
    Icons are used as shortcut to perform functions. The advantages of icons are which
     takes less screen space.
    And some other interfaces like text box, buttons, and list are also used.


                                                                               Page | 5
3. Inbuilt Functions:


1. Arc
Arc draws a circular arc in the current drawing color.

Declaration:

Void arc(int x, int y , int Stangle, int endangle , int radius )

ARGUMENT                     What it is Does

(x,y)                        Center point of arc

Stangle                     Start angle in degrees

Endangle                     End angle in degrees

Radius                       Radius of arc

The arc travels from Stangle to Endangle

If Stangle =0 and Endangle = 360 , the call to arc draws a complete circle


2. Initgraph
Initializes the graphic system

Decalaration:

Void far initgraph(int far * graphdriver);

Int far * graphmode , char far *pathdriver);

Remarks:

To start the graphics system , you must first call the initgraph

Initgraph initializes the graphics system by loading a graphics the driver from disk (or
validating a registered driver ) then putting the system into graphics mode .

                                                                                   Page | 6
Initgraph also resets all the graphics settings (color ,palette ,current position , viewport
,etc) to their defaults , then resets graphresult to 0 .

Argument           What it is  does

*graphdriver         Integer that specifies the graphic driver to be used . you can give

                   graphdriver a value using a constant of the graphics_drivers
enumeration

                   type .

*graphmode         Integer that specifies the initial graphics mode .(unless *graphdriver

                   =DETECT).

If *graphdriver =DETECT , initgraph sets *graphmode to the highest resolution available
for the detected driver . You can give the *graphmode a value using a constant of the
graphics_modes enumeration type .

*graphdriver and *graphmode must be set to the valid graphics _drivers and
graphics_mode values or you will get unpredictable results . ( the exception is graphdriver
= DETECT).

After a call to the initgraph , *graphdriver is set to the current graphics driver , and
*graphmode is set to the current graphics mode .


3. closegraph
Shuts down the graphics system

Declaration :

void far closegraph( void );

Remarks :

Closegraph deallocates all memory allocated by the graphics system . It then restores the
screen to the mode it was in before you called initgraph .

( the graphics system deallocates memory such as the drivers , fonts , and an internal
buffer , through a call to the _graphfreemem)


                                                                                       Page | 7
Return Value : None


4.line
Line draws a line between the two specified points

Declaration :

Void far line ( int x1, int y1 , int x2 , int y2 );

Remarks :

Line draws a line from the ( x1, y1 ) to ( x2,y2 ) using the current color , line style nad thick
ness . it does not the update the current position (cp).


5. setcolor
Setcolor sets the current drawing color

Declaration:

Void far setcolor( int color)

Remarks :

Setcolor sets the current drawing color to color , which can range from 0 to getmaxcolor

To select a drawing color is the value that pixels are set to the when the program draws
lines etc.

Return value :

Setcolor does not return


6.setbkcolor

                                                                                       Page | 8
Setbkcolor sets the current background the color using the palette

Declaration :

Void far setbkcolor( int color );

Remarks :

Setbkcolor sets the background to the color specified by color

Color :

color is either a number or symbolic name specifying the color to set

For example , if you want to set the background color to blue , you can call

setbkcolor (BLUE) /* or */ setbkcolor(1)

On CGA and EGA systems , setbkcolor changes the background color by changing the first
entry in the palette.

Return:

Setbkcolor does not return


7.Ellipse
Ellipse draws an elliptical arc

Declaration :

Void far ellipse ( int x, int y , int stangle , int endangle , int xradius , int yradius ) ;

Remarks :

Ellipse draws an elliptical arc in the current drawing color .

Argument                  What it is

( x,y)                     Center of ellipse

Xradius                    Horizontal axis

Yradius                    Vertical axis

                                                                                               Page | 9
Stangle                    starting angle

Endangle                   ending angle

The ellipse travels from stangle to endangle .

If stangle = 0 and endangle = 360 , the call to the ellipse draws a complete ellipse .

The linestyle parameter does not affect the arcs , circles , ellipse or pie slices . only the

thickness parameter is used .

Return value :

None


8.Flood fill :
Flood fills a bounded region

Declaration :

void far floodfill( int x, int y , int border );

Remarks :

Floodfill fills an enclosed area on bitmap devices .

The area bounded by the color border is flooded with the current fill pattern and fill color .

(x,y) is the “seed point ”.

     If the seed is within an enclosed area , the inside will be filled .
     If the seed is outside the enclosed area, the exterior will be filled .

Use fillpoly instead of floodfill whenever possible so you can maintain code compatibility
with future versions .


9.Outtextxy

                                                                                       Page | 10
Outtextxy displays a string at the specified location ( graphics mode )

Declaration :

Void far outtextxy (int x , int y , char far * textstring );

Remarks :

Outtextxy displays a text string using the current justification settings and the current font
, direction and size .

Outtextxy displays the textstring in the viewport at the position ( x,y)

To maintain the code compatibility when using the several fonts , use textwidth and
textheight to determine the dimensions of the string .

If a string is printed with the default font using the outtext ot outtextxy ,any part of the
string that extends outside the current viewport is truncated .

Outtextxy for use in graphics mode , they will not work in the text mode.

Return value :

None


10.Settextjustify

Sets text justification for graphics mode .
Decalration :

void far settextjustify ( int horiz , int vert ) ;

Remarks :

Text output after a call to settextjustify is justified around the current position (CP)
horizontally and vertically , as specified .

The default justification settings are :

     LEFT_TEXT ( for horizontal )
     TOP_TEXT ( for vertical )


                                                                                      Page | 11
The enumeration text_justify in GRAPHICS. H provides names for the horiz and vert
settings passed to the settextjustify .

 Settextjusitfy affects the text written with outtext and cant be used with text – mode and
stream functions .

Return Values :

If invalid input is passed to the settextjustify , graph result returns -11 and the current text
justification remains unchanged .


11.Circle
Circle draws a circle

Decalration :

Void far circle(int x , int y , int radius );

ARGUMENT                      What it is Does

(x,y)                         Center point of circle

Radius                        Radius of circle

Remarks :

It draws a circle in the current drawing color.


12.Rectangle:
Draws a rectangle ( graphics mode )

Declaration :

Void far rectangle (int left , int top , int right , int bottom );

Remarks :

Rectangle draws a rectangle in the current line style , thickness and drawing color.


                                                                                     Page | 12
(left , top ) is the upper left corner of the rectangle , and (right , bottom ) is the lower right
corner .

Return Values :

None


13.Setlinestyle:

Set the current line style and width or pattern
Declaration :
void far setlinestyle ( int line style , unsigned upattern , int thickness);

Remarks :

Setlinestyle sets the style for all lines drawn by line , rectangle etc.

Return Values :

If invalid input is passed to setlinestyle , graphresult returns -11 , the current line style
remains unchanged .


14.Getmaxx ()and Getmaxy()
Return maximum x or y co-ordinates of screen.

Declaration :

Int far getmaxx (void );

Int far getmaxy (void );

Remarks :

1 . getmaxx returns the maximum X value (screen relative ) for the current graphics
driver and mode .


                                                                                        Page | 13
2. getmaxy returns the maximum Y value ( screen relative ) for the current graphics
drivers and mode .

For Example :

On a CGA in 320 * 200 mode , getmaxx returns 319 and getmaxy returns the 199

Return Values :

1) Getmaxx : maximum x screen co-ordinates.
2) Getmaxy : maximum y screen co-ordinates .


15.Cleardevice()
Clears the graphic screen .

Declaration :

Void far cleardevice (void);

Remarks :

Cleardevice erases the entire graphics screen and moves the CP (Current Position ) to
home (0,0).

Return Values : None.


16.Setfillstyle()
Set the fill pattern and color .

Declaration :

void far setfillstyle (int pattern , int color);

Remarks :

Setfillstyle set the current fill pattern and fill color

To set a user defined fill pattern , do not give a pattern of 12 (USER_FILL) to setfillstyle ,
instead , call setfillpattern .


                                                                                     Page | 14
Return Values : None.

If invalid input is passed to the setfillstyle ,graphresult return -11 and the current fill
pattern and fill color remain unchanged .


17. delay
Delay function is used to suspend execution of a program for a particular time.

Declaration :- void delay(unsigned int);

Here unsigned int is the number of milliseconds ( remember 1 second = 1000 milliseconds
). To use delay function in your program you should include the dos.h header file.


                                                                                       Page | 15
Programs of Algorithms


Program1: Direct Method Of Line Drawing
CODING:

#include<graphics.h>

#include<iostream.h>

#include<conio.h>

void main()

{

int gd=DETECT,gm;

initgraph(&gd,&gm,"");

int x1,x2,c,y1,y2,dy,dx,m;

cout<<"tttt-----------------------------n";

cout<<"tttt DIRECT LINE BY NEHA SHARMAn";

cout<<"tttt-----------------------------n";


cout<<"enter the coordinatesn";

cin>>x1>>y1>>x2>>y2;

dy=y2-y1;

dx=x2-x1;

m=dy/dx;

c=y1-m*x1;

while(x1<=x2)


                                                   Page | 16
{

if(m<=1)

{

x1=x1+1;

y1=m*x1+c;

putpixel(x1,y1,WHITE);

}

else

{

y1=y1+1;

x1=(y1-c)/m;

putpixel(x1,y1,WHITE);

}

}

getch();

}

OUTPUT:


                         Page | 17
Program 2. Digital Differential Analyzer For Line
Drawing
CODING:

#include<graphics.h>

#include<iostream.h>

#include<conio.h>

void main()

{

int gd=DETECT,gm;

initgraph(&gd,&gm,"");

int x1,x2,c,y1,y2,dy,dx,m;

cout<<"ttt------------------n";

cout<<"tttDDA By Neha Sharman";

cout<<"ttt------------------n";

cout<<"enter the coordinatesn";

cin>>x1>>y1>>x2>>y2;

dy=y2-y1;

dx=x2-x1;

m=dy/dx;

//c=y1-m*x1;

while(x1<=x2)

{

if(m<=1)

{


                                            Page | 18
x1=x1+1;

y1=y1+m;

putpixel(x1,y1,WHITE);

}

else

{

y1=y1+1;

x1=x1+(1/m);

putpixel(x1,y1,WHITE);

}

}

getch();

closegraph();

}

OUTPUT:


                         Page | 19
Program3: Bresenham Line Drawing Algorithm
CODING:

#include<graphics.h>

#include<iostream.h>

#include<conio.h>

void main()

{

int gd=DETECT,gm;

initgraph(&gd,&gm,"");

int f,fe,fne,x1,x2,y1,y2,dy,dx,m;

cout<<"-----------------";

cout<<"nBy Neha Sharman";

cout<<"-----------------";

cout<<"nenter the cordinatesn";

cin>>x1>>y1>>x2>>y2;

dy=y2-y1;

dx=x2-x1;

f=(2*dy)-dx;

while(x1<=x2)

{

if(f<=0)

{

x1=x1+1;

//y1=y1;


                                      Page | 20
f=2*dy;

putpixel(x1,y1,WHITE);

f=f+fe;

}

else

{

y1=y1+1;

x1=x1+1;

f=(2*dy)-(2*dx);

putpixel(x1,y1,WHITE);

f=f+fne;

}

}

getch();

closegraph();

}

OUTPUT:


                         Page | 21
Program 4: Direct MethodPolynomial
MethodCartesian Co-Ordinate Algortihm For
Circle Drawing
CODING:

#include<conio.h>

#include<graphics.h>

#include<math.h>

#include<iostream.h>

void main()

{

int gd=DETECT,gm;

initgraph(&gd,&gm,"");

int x1,y1,xc,yc,r,x2;

cout<<"tttt-----------------------------n";

cout<<"tttt DIRECT CIRCLE BY NEHA SHARMAn";

cout<<"tttt-----------------------------n";

cout<<"enter the x center y center and radiusn";

cin>>xc>>yc>>r;

x1=0;

x2=r/sqrt(2);

while(x1<=x2)

{

y1=sqrt(r*r-x1*x1);

putpixel(y1+xc,x1+yc,WHITE);


                                                    Page | 22
putpixel(x1+yc,y1+xc,WHITE);

putpixel(x1+yc,-y1+xc,WHITE);

putpixel(-y1+xc,x1+yc,WHITE);

putpixel(-y1+xc,-x1+yc,WHITE);

putpixel(-x1+yc,-y1+xc,WHITE);

putpixel(-x1+yc,y1+xc,WHITE);

putpixel(y1+xc,-x1+yc,WHITE);

x1=x1+1;

}

getch();

}

OUTPUT:


                                 Page | 23
Program 5: Polar Circle Drawing Algorithm
CODING:

#include<conio.h>

#include<graphics.h>

#include<math.h>

#include<iostream.h>

void main()

{

int gd=DETECT,gm;

initgraph(&gd,&gm,"");

float x1,y1,xc,yc,r,t;

cout<<"enter the x center y center and radius";

cin>>xc>>yc>>r;

x1=0;

y1=r;

t=1/r;

while(x1<=y1)

{

putpixel(y1+xc,x1+yc,WHITE);

putpixel(x1+yc,y1+xc,WHITE);

putpixel(x1+yc,-y1+xc,WHITE);

putpixel(-y1+xc,x1+yc,WHITE);

putpixel(-y1+xc,-x1+yc,WHITE);

putpixel(-x1+yc,-y1+xc,WHITE);


                                                  Page | 24
putpixel(-x1+yc,y1+xc,WHITE);

putpixel(y1+xc,-x1+yc,WHITE);

float temp=y1;

y1=(y1*cos(t))+(x1*sin(t));

x1=(x1*cos(t))-(temp*sin(t));

}


getch();

}

OUTPUT:


                                Page | 25
Program 6: Bresenham Circle Drawing
Algorithm
CODING:

#include<conio.h>

#include<graphics.h>

#include<math.h>

#include<iostream.h>

void main()

{

int gd=DETECT,gm;

initgraph(&gd,&gm,"");

float x1,y1,f,xc,yc,r,t;

cout<<"enter the x center y center and radius";

cin>>xc>>yc>>r;

x1=0;

y1=r;

f=3-(2*r);

while(x1<=y1)

{

if(f<=0)

{

f=f+6+4*x;

x=x+1;

}


                                                  Page | 26
else

{

f=f+10+(4*x)-(4*y);

x=x+1;

y=y-1;

}

putpixel(y1+xc,x1+yc,WHITE);

putpixel(x1+yc,y1+xc,WHITE);

putpixel(x1+yc,-y1+xc,WHITE);

putpixel(-y1+xc,x1+yc,WHITE);

putpixel(-y1+xc,-x1+yc,WHITE);

putpixel(-x1+yc,-y1+xc,WHITE);

putpixel(-x1+yc,y1+xc,WHITE);

putpixel(y1+xc,-x1+yc,WHITE);

}

getch();

closegraph();

                                 }


                                     Page | 27
Program 7: Mid Point Circle Drawing Algorithm
CODING:

#include<conio.h>

#include<graphics.h>

#include<math.h>

#include<iostream.h>

void main()

{

int gd=DETECT,gm;

initgraph(&gd,&gm,"");

float x1,y1,f,xc,yc,r;

cout<<"MIDPOINT CIRCLEBY NEHA SHARMAn";

cout<<"enter the x center y center and radiusn";

cin>>xc>>yc>>r;

x1=0;

y1=r;

f=1-r;

while(x1<=y1)

{

if(f<=0)

{

f=f+3+2*x1;

x1=x1+1;

}


                                                    Page | 28
else

{

f=f+5+(2*x1)-(2*y1);

x1=x1+1;

y1=y1-1;

}

putpixel(y1+xc,x1+yc,WHITE);

putpixel(x1+xc,y1+yc,WHITE);

putpixel(x1+xc,-y1+yc,WHITE);

putpixel(-y1+xc,x1+yc,WHITE);

putpixel(-y1+xc,-x1+yc,WHITE);

putpixel(-x1+xc,-y1+yc,WHITE);

putpixel(-x1+xc,y1+yc,WHITE);

putpixel(y1+xc,-x1+yc,WHITE);

}

getch();

closegraph();

}

OUTPUT:


                                 Page | 29
Program 8: DirectPolynomial Algorithm Of
Ellipse Drawing
CODING:

#include<conio.h>

#include<iostream.h>

#include<graphics.h>

#include<math.h>

void main()

{

int gd=DETECT,gm;

initgraph(&gd,&gm,"");

float xc,yc,rx,ry,x1,y1,x2;


cout<<"DIRECT ELLIPSE BY NEHA SHARMAn";

cout<<"enter xc,yc,x radius,y radiusn" ;

cin>>xc>>yc>>rx>>ry;

x1=0;

x2=rx;

while(x1<=x2)

{

y1=(ry/rx)*sqrt((rx*rx)-(x1*x1));

putpixel(x1+xc,y1+yc,WHITE);

putpixel(x1+xc,-y1+yc,WHITE);

putpixel(-x1+xc,-y1+yc,WHITE);


                                            Page | 30
putpixel(-x1+xc,y1+yc,WHITE);

x1=x1+1;

}


getch();

closegraph();

}


OUTPUT:


                                Page | 31
Program 9: Polar Ellipse Drawing Algorithm
CODING:

#include<conio.h>

#include<iostream.h>

#include<graphics.h>

#include<math.h>

void main()

{

int gd=DETECT,gm;

initgraph(&gd,&gm,"");

float xc,yc,rx,ry,t1,t2,x1,y1,x2;


cout<<"POLAR ELLIPSE BY NEHA SHARMAn";

cout<<"enter xc,yc,x radius,y radiusn" ;

cin>>xc>>yc>>rx>>ry;

t1=0;

t2=90;

while(t1<=t2)

{

y1=ry*sin(t1);

x1=rx*cos(t1);

putpixel(x1+xc,y1+yc,WHITE);

putpixel(x1+xc,-y1+yc,WHITE);

putpixel(-x1+xc,-y1+yc,WHITE);


                                            Page | 32
putpixel(-x1+xc,y1+yc,WHITE);

t1=t1+1;

}


getch();

closegraph();

}


OUTPUT:


                                Page | 33
10. Program To Draw Ellipse Using Midpoint
Ellipse Algorithm
Coding:
#include<iostream.h>
#include<conio.h>
#include<graphics.h>
#include<math.h>
void main()
{
int gd=DETECT, gm;
initgraph(&gd,&gm,"");
float xc,yc,x,y,xr,yr,f;
cout<<”tttt------------------------------------”;
cout<<"ntttMID POINT ELLIPSE BY MOHITn";

cout<<”ntttt---------------------------------------”;
cout<<"nEnter the coordinates xc,yc,xr ,yr";
cin>>xc>>yc>>xr>>yr;
x=0;
y=yr;
f=(yr*yr)+(xr*xr)/4-(xr*xr)*yr;
while(2*(yr*yr)*x<=2*(xr*xr)*y)
{
if(f<=0)
{
f=f+(3+(2*x))*(yr*yr);
x++;
putpixel(x+xc,y+yc,WHITE);
putpixel(-x+xc,y+yc,WHITE);
putpixel(-x+xc,-y+yc,WHITE);

                                                             Page | 34
putpixel(x+xc,-y+yc,WHITE);
}
else
{
f=f+3*(yr*yr)+2*x*(yr*yr)+2*(xr*xr)-2*y*(xr*xr);
x++;
y--;
putpixel(x+xc,y+yc,WHITE);
putpixel(-x+xc,y+yc,WHITE);
putpixel(-x+xc,-y+yc,WHITE);
putpixel(x+xc,-y+yc,WHITE);
}
}
f=(yr*yr)/4-2*(xr*xr)*yr+(xr*xr);
while(y>=0)
{
if(f<=0)
{
f=f+(3-(2*y))*(xr*xr);
x++;
y--;
putpixel(x+xc,y+yc,WHITE);
putpixel(-x+xc,y+yc,WHITE);
putpixel(-x+xc,-y+yc,WHITE);
putpixel(x+xc,-y+yc,WHITE);
}
else
{
f=f+2*(yr*yr)+2*x*(yr*yr)+3*(xr*xr)-2*y*(xr*xr);
y--;


                                                   Page | 35
putpixel(x+xc,y+yc,WHITE);
putpixel(-x+xc,y+yc,WHITE);
putpixel(-x+xc,-y+yc,WHITE);
putpixel(x+xc,-y+yc,WHITE);
}
}
getch();
closegraph();
}


OUTPUT:


    Mid Point Ellipse Drawing Algorithm


                                          Page | 36

More Related Content

What's hot (20)

PPTX
Spline representations
Nikhil krishnan
 
PPT
2 d geometric transformations
Mohd Arif
 
PPTX
Random scan displays and raster scan displays
Somya Bagai
 
PPTX
Introduction to Computer graphics
PrathimaBaliga
 
PPTX
Cyrus beck line clipping algorithm
Pooja Dixit
 
PPTX
Introduction to computer graphics
Kamal Acharya
 
PPTX
Introduction to computer graphics
Rajamanickam Gomathijayam
 
PDF
COMPUTER GRAPHICS PROJECT REPORT
vineet raj
 
PPTX
5. gray level transformation
MdFazleRabbi18
 
PPTX
what is Font in multimedia
maliksiddique1
 
PPT
lecture2 computer graphics graphics hardware(Computer graphics tutorials)
Daroko blog(www.professionalbloggertricks.com)
 
PPTX
Graphics software and standards
Mani Kanth
 
PDF
Computer graphics curves and surfaces (1)
RohitK71
 
PPTX
Applications of computer graphics
-jyothish kumar sirigidi
 
PPTX
Design of Accumulator Unit
Harshad Koshti
 
PPTX
Raster animation
abhijit754
 
ODP
image compression ppt
Shivangi Saxena
 
PPTX
Attributes of Output Primitives
Renita Santhmayora
 
PPTX
3d transformation computer graphics
University of Potsdam
 
PDF
Digital Image Processing: Image Segmentation
Mostafa G. M. Mostafa
 
Spline representations
Nikhil krishnan
 
2 d geometric transformations
Mohd Arif
 
Random scan displays and raster scan displays
Somya Bagai
 
Introduction to Computer graphics
PrathimaBaliga
 
Cyrus beck line clipping algorithm
Pooja Dixit
 
Introduction to computer graphics
Kamal Acharya
 
Introduction to computer graphics
Rajamanickam Gomathijayam
 
COMPUTER GRAPHICS PROJECT REPORT
vineet raj
 
5. gray level transformation
MdFazleRabbi18
 
what is Font in multimedia
maliksiddique1
 
lecture2 computer graphics graphics hardware(Computer graphics tutorials)
Daroko blog(www.professionalbloggertricks.com)
 
Graphics software and standards
Mani Kanth
 
Computer graphics curves and surfaces (1)
RohitK71
 
Applications of computer graphics
-jyothish kumar sirigidi
 
Design of Accumulator Unit
Harshad Koshti
 
Raster animation
abhijit754
 
image compression ppt
Shivangi Saxena
 
Attributes of Output Primitives
Renita Santhmayora
 
3d transformation computer graphics
University of Potsdam
 
Digital Image Processing: Image Segmentation
Mostafa G. M. Mostafa
 

Viewers also liked (20)

DOCX
Computer Graphics Lab File C Programs
Kandarp Tiwari
 
PDF
Basics of Computer graphics lab
Priya Goyal
 
DOC
COMPUTER GRAPHICS LAB MANUAL
Vivek Kumar Sinha
 
PDF
Computer Graphics Programes
Abhishek Sharma
 
PPTX
Graphics Programming in C
Kasun Ranga Wijeweera
 
PPTX
Introduction to graphics programming in c
baabtra.com - No. 1 supplier of quality freshers
 
DOC
SE Computer, Programming Laboratory(210251) University of Pune
Bhavesh Shah
 
DOCX
Graphics practical lab manual
Vivek Kumar Sinha
 
PPTX
Graphics in C++
Ahsan Mughal
 
PPTX
Graphics in C programming
Kamal Acharya
 
DOCX
Computer graphics file
aman1001
 
PDF
Computer graphics lab manual
Ankit Kumar
 
PPT
Lecture on graphics
Rafi_Dar
 
PDF
C Graphics Functions
SHAKOOR AB
 
PPT
Computer Graphics Applications
Saravana Priya
 
PPT
Midpoint circle algo
Mohd Arif
 
PDF
Graphics Programming in C under GNU Linux (Ubuntu distribution)
Tushar B Kute
 
DOCX
Computer graphics lab assignment
Abdullah Al Shiam
 
DOCX
Computer graphics
amitsarda3
 
PPTX
Area filling algo
Prince Soni
 
Computer Graphics Lab File C Programs
Kandarp Tiwari
 
Basics of Computer graphics lab
Priya Goyal
 
COMPUTER GRAPHICS LAB MANUAL
Vivek Kumar Sinha
 
Computer Graphics Programes
Abhishek Sharma
 
Graphics Programming in C
Kasun Ranga Wijeweera
 
Introduction to graphics programming in c
baabtra.com - No. 1 supplier of quality freshers
 
SE Computer, Programming Laboratory(210251) University of Pune
Bhavesh Shah
 
Graphics practical lab manual
Vivek Kumar Sinha
 
Graphics in C++
Ahsan Mughal
 
Graphics in C programming
Kamal Acharya
 
Computer graphics file
aman1001
 
Computer graphics lab manual
Ankit Kumar
 
Lecture on graphics
Rafi_Dar
 
C Graphics Functions
SHAKOOR AB
 
Computer Graphics Applications
Saravana Priya
 
Midpoint circle algo
Mohd Arif
 
Graphics Programming in C under GNU Linux (Ubuntu distribution)
Tushar B Kute
 
Computer graphics lab assignment
Abdullah Al Shiam
 
Computer graphics
amitsarda3
 
Area filling algo
Prince Soni
 
Ad

Similar to Computer Graphics Practical (20)

DOCX
Graphics file
shweta-sharma99
 
DOCX
Computer graphics
shafiq sangi
 
PPTX
Introduction to Computer Graphics
Abdullah Khan
 
PPTX
COMPUTER GRAPHICS DAY1
Barnali Gupta Banik
 
PPTX
computer graphics unit 1-I.pptx
bcanawakadalcollege
 
PDF
Computer graphics notes
smruti sarangi
 
PPTX
Computer Graphics Introduction, Open GL, Line and Circle drawing algorithm
Deepika Walanjkar
 
PPTX
introduction to graphics unit 1 image processing
shivani5543
 
PPTX
Computer Graphics Representation Introduction.pptx
DepartmentofElectric4
 
PPTX
Computer Graphics Representation model .pptx
DepartmentofElectric4
 
PPTX
Introduction_computer_graphics_unit-1.pptx
shivanipuran1
 
PDF
CG_1.pdf
bcanawakadalcollege
 
PPTX
Computer Graphics Unit 1 for BCA IV SEM.pptx
dgojms
 
PPTX
Computer Graphics definition types and application .pptx
nkamath968
 
PPT
Lecture applications of cg
avelraj
 
PPT
Introduction to graphics
Sowmya Jyothi
 
PPTX
CG MODULE 1 NOTES ppppppppppppppppppppppppppppppp.pptx
TheertheshTheertha1
 
PPTX
unit1_updated.pptx
RYZEN14
 
PDF
Computer graphics by bahadar sher
university of Malakand Dir Lower
 
PPTX
L1-Introduction to CG aaaaaaaaaaaaaaa.pptx
cs350892
 
Graphics file
shweta-sharma99
 
Computer graphics
shafiq sangi
 
Introduction to Computer Graphics
Abdullah Khan
 
COMPUTER GRAPHICS DAY1
Barnali Gupta Banik
 
computer graphics unit 1-I.pptx
bcanawakadalcollege
 
Computer graphics notes
smruti sarangi
 
Computer Graphics Introduction, Open GL, Line and Circle drawing algorithm
Deepika Walanjkar
 
introduction to graphics unit 1 image processing
shivani5543
 
Computer Graphics Representation Introduction.pptx
DepartmentofElectric4
 
Computer Graphics Representation model .pptx
DepartmentofElectric4
 
Introduction_computer_graphics_unit-1.pptx
shivanipuran1
 
Computer Graphics Unit 1 for BCA IV SEM.pptx
dgojms
 
Computer Graphics definition types and application .pptx
nkamath968
 
Lecture applications of cg
avelraj
 
Introduction to graphics
Sowmya Jyothi
 
CG MODULE 1 NOTES ppppppppppppppppppppppppppppppp.pptx
TheertheshTheertha1
 
unit1_updated.pptx
RYZEN14
 
Computer graphics by bahadar sher
university of Malakand Dir Lower
 
L1-Introduction to CG aaaaaaaaaaaaaaa.pptx
cs350892
 
Ad

More from Neha Sharma (9)

PPT
Web Browsers
Neha Sharma
 
PPTX
Transportation Problem in Operational Research
Neha Sharma
 
PPTX
Microsoft Surface
Neha Sharma
 
PPTX
Terrorist Attacks
Neha Sharma
 
DOCX
Microsoft Surface
Neha Sharma
 
PPTX
Top Reality Shows
Neha Sharma
 
PPTX
IPv6
Neha Sharma
 
PPTX
Steganography
Neha Sharma
 
PPTX
Interesting Facts about Maths
Neha Sharma
 
Web Browsers
Neha Sharma
 
Transportation Problem in Operational Research
Neha Sharma
 
Microsoft Surface
Neha Sharma
 
Terrorist Attacks
Neha Sharma
 
Microsoft Surface
Neha Sharma
 
Top Reality Shows
Neha Sharma
 
Steganography
Neha Sharma
 
Interesting Facts about Maths
Neha Sharma
 

Recently uploaded (20)

PPSX
Usergroup - OutSystems Architecture.ppsx
Kurt Vandevelde
 
PPTX
Curietech AI in action - Accelerate MuleSoft development
shyamraj55
 
PDF
The Future of Product Management in AI ERA.pdf
Alyona Owens
 
PDF
5 Things to Consider When Deploying AI in Your Enterprise
Safe Software
 
PPTX
UserCon Belgium: Honey, VMware increased my bill
stijn40
 
PDF
Hello I'm "AI" Your New _________________
Dr. Tathagat Varma
 
PDF
FME as an Orchestration Tool with Principles From Data Gravity
Safe Software
 
PPTX
01_Approach Cyber- DORA Incident Management.pptx
FinTech Belgium
 
PDF
Python Conference Singapore - 19 Jun 2025
ninefyi
 
PDF
Quantum AI Discoveries: Fractal Patterns Consciousness and Cyclical Universes
Saikat Basu
 
PPTX
MARTSIA: A Tool for Confidential Data Exchange via Public Blockchain - Poster...
Michele Kryston
 
PPTX
Smarter Governance with AI: What Every Board Needs to Know
OnBoard
 
PPTX
Paycifi - Programmable Trust_Breakfast_PPTXT
FinTech Belgium
 
PPTX
MARTSIA: A Tool for Confidential Data Exchange via Public Blockchain - Pitch ...
Michele Kryston
 
PDF
Salesforce Summer '25 Release Frenchgathering.pptx.pdf
yosra Saidani
 
PDF
“Scaling i.MX Applications Processors’ Native Edge AI with Discrete AI Accele...
Edge AI and Vision Alliance
 
PDF
ArcGIS Utility Network Migration - The Hunter Water Story
Safe Software
 
PDF
Redefining Work in the Age of AI - What to expect? How to prepare? Why it mat...
Malinda Kapuruge
 
PDF
Cracking the Code - Unveiling Synergies Between Open Source Security and AI.pdf
Priyanka Aash
 
PDF
2025_06_18 - OpenMetadata Community Meeting.pdf
OpenMetadata
 
Usergroup - OutSystems Architecture.ppsx
Kurt Vandevelde
 
Curietech AI in action - Accelerate MuleSoft development
shyamraj55
 
The Future of Product Management in AI ERA.pdf
Alyona Owens
 
5 Things to Consider When Deploying AI in Your Enterprise
Safe Software
 
UserCon Belgium: Honey, VMware increased my bill
stijn40
 
Hello I'm "AI" Your New _________________
Dr. Tathagat Varma
 
FME as an Orchestration Tool with Principles From Data Gravity
Safe Software
 
01_Approach Cyber- DORA Incident Management.pptx
FinTech Belgium
 
Python Conference Singapore - 19 Jun 2025
ninefyi
 
Quantum AI Discoveries: Fractal Patterns Consciousness and Cyclical Universes
Saikat Basu
 
MARTSIA: A Tool for Confidential Data Exchange via Public Blockchain - Poster...
Michele Kryston
 
Smarter Governance with AI: What Every Board Needs to Know
OnBoard
 
Paycifi - Programmable Trust_Breakfast_PPTXT
FinTech Belgium
 
MARTSIA: A Tool for Confidential Data Exchange via Public Blockchain - Pitch ...
Michele Kryston
 
Salesforce Summer '25 Release Frenchgathering.pptx.pdf
yosra Saidani
 
“Scaling i.MX Applications Processors’ Native Edge AI with Discrete AI Accele...
Edge AI and Vision Alliance
 
ArcGIS Utility Network Migration - The Hunter Water Story
Safe Software
 
Redefining Work in the Age of AI - What to expect? How to prepare? Why it mat...
Malinda Kapuruge
 
Cracking the Code - Unveiling Synergies Between Open Source Security and AI.pdf
Priyanka Aash
 
2025_06_18 - OpenMetadata Community Meeting.pdf
OpenMetadata
 

Computer Graphics Practical

  • 1. PUNJAB COLLEGE OF TECHNICAL EDUCATION PRACTICAL FILE BC-507 SUBMITTED BY: SUBMITTED BY: Ms.Richa Sharma Neha Sharma Assistant Professor (94972346352) P.C.T.E. BCA-5th Sem Page | 0
  • 2. Index S.No Contents Page no. Remarks 1. Introduction to graphics 2 2. Applications of graphics 3-5 3. Graphics In-built functions 6-15 4. Programs of Algorithm 16-26 a) Direct method of line b) DDA Algorithm c) Bresenham algorithm d) Direct method of Circle e) Polar Circle f) Bresenham Circle g) Midpoint Circle h) Direct Ellipse i) Polar Ellipse j) Mid point Ellipse 5. Static Application 6. Ist dynamic Application 7. IInd Dynamic Application Page | 1
  • 3. 1. Introduction To Graphics Computer graphics are graphics created using computers and, more generally, the representation and manipulation of image data by a computer with help from specialized software and hardware. The development of computer graphics has made computers easier to interact with, and better for understanding and interpreting many types of data. Developments in computer graphics have had a profound impact on many types of media and have revolutionized animation, movies and the video game industry. the term computer graphics refers to several different things: the representation and manipulation of image data by a computer the various technologies used to create and manipulate images the images so produced, and the sub-field of computer science which studies methods for digitally synthesizing and manipulating visual content Page | 2
  • 4. 2. Application of Graphics Computer graphics may be used in the following areas: COMPUTER AIDED DESIGN PRESENTATION GRAPHICS COMPUTER ART ENTERTAINMENT EDUCATION AND TRAINING VISUALIZATION IMAGE PROCESSING GRAPHICAL USER INTERFACE VIDEO GAMES Computers have become a powerful tool for the rapid and economical production of pictures. Advances in computer technology have made interactive computer graphics a practical tool. Today, computer graphics is used in the areas as science, engineering, medicine, business, industry, government, art, entertainment, advertising, education, and training. COMPUTER AIDED DESIGN A major use of computer graphics is in design processes, particularly for engineering and architectural systems. For some design applications; objects are first displayed in a wireframe outline form that shows the overall sham and internal features of objects. Software packages for CAD applications typically provide the designer with a multi- window environment. Each window can show enlarged sections or different views of objects. Standard shapes for electrical, electronic, and logic circuits are often supplied by the design package. The connections between the components have been mad automatically. Animations are often used in CAD applications. Real-time animations using wire frame displays are useful for testing performance of a vehicle. Wire frame models allow the designer to see the interior parts of the vehicle during motion. When object designs are complete, realistic lighting models and surface rendering are applied. Manufacturing process of object can also be controlled through CAD. Page | 3
  • 5. Interactive graphics methods are used to layout the buildings. Three-dimensional interior layouts and lighting also provided. With virtual-reality systems, the designers can go for a simulated walk inside the building. PRESENTATION GRAPHICS  It is used to produce illustrations for reports or to generate slide for with projections.  Examples of presentation graphics are bar charts, line graphs, surface graphs, pie charts and displays showing relationships between parameters.  3-D graphics can provide more attraction to the presentation. COMPUTER ART  Computer graphics methods are widely used in both fine are and commercial art applications.  The artist uses a combination of 3D modeling packages, texture mapping, drawing programs and CAD software.  Pen plotter with specially designed software can create “automatic art”.  “Mathematical Art” can be produced using mathematical functions, fractal procedures.  These methods are also applied in commercial art.  Photorealistic techniques are used to render images of a product.  Animations are also used frequently in advertising, and television commercials are produced frame by frame. Film animations require 24 frames for each second in the animation sequence.  A common graphics method employed in many commercials is morphing, where one object is transformed into another. ENTERTAINMENT  CG methods are now commonly used in making motion pictures, music videos and television shows.  Many TV series regularly employ computer graphics method.  Graphics objects can be combined with a live action. EDUCATION AND TRAINING  Computer-generated models of physical, financial and economic systems are often used as educational aids. Page | 4
  • 6. For some training applications, special systems are designed.  Eg. Training of ship captains, aircraft pilots etc.,  Some simulators have no video screens, but most simulators provide graphics screen for visual operation. Some of them provide only the control panel. VISUALIZATION  The numerical and scientific data are converted to a visual form for analysis and to study the behavior called visualization.  Producing graphical representation for scientific data sets are calls scientific visualization.  And business visualization is used to represent the data sets related to commerce and industry.  The visualization can be either 2D or 3D. IMAGE PROCESSING  Computer graphics is used to create a picture.  Image processing applies techniques to modify or interpret existing pictures.  To apply image processing methods, the image must be digitized first.  Medical applications also make extensive use of image processing techniques for picture enhancements, simulations of operations, etc. GRAPHICAL USER INTERFACE  Nowadays software packages provide graphics user interface (GUI) for the user to work easily.  A major component in GUI is a window.  Multiple windows can be opened at a time.  To activate any one of the window, the user needs just to check on that window.  Menus and icons are used for fast selection of processing operations.  Icons are used as shortcut to perform functions. The advantages of icons are which takes less screen space.  And some other interfaces like text box, buttons, and list are also used. Page | 5
  • 7. 3. Inbuilt Functions: 1. Arc Arc draws a circular arc in the current drawing color. Declaration: Void arc(int x, int y , int Stangle, int endangle , int radius ) ARGUMENT What it is Does (x,y) Center point of arc Stangle Start angle in degrees Endangle End angle in degrees Radius Radius of arc The arc travels from Stangle to Endangle If Stangle =0 and Endangle = 360 , the call to arc draws a complete circle 2. Initgraph Initializes the graphic system Decalaration: Void far initgraph(int far * graphdriver); Int far * graphmode , char far *pathdriver); Remarks: To start the graphics system , you must first call the initgraph Initgraph initializes the graphics system by loading a graphics the driver from disk (or validating a registered driver ) then putting the system into graphics mode . Page | 6
  • 8. Initgraph also resets all the graphics settings (color ,palette ,current position , viewport ,etc) to their defaults , then resets graphresult to 0 . Argument What it is does *graphdriver Integer that specifies the graphic driver to be used . you can give graphdriver a value using a constant of the graphics_drivers enumeration type . *graphmode Integer that specifies the initial graphics mode .(unless *graphdriver =DETECT). If *graphdriver =DETECT , initgraph sets *graphmode to the highest resolution available for the detected driver . You can give the *graphmode a value using a constant of the graphics_modes enumeration type . *graphdriver and *graphmode must be set to the valid graphics _drivers and graphics_mode values or you will get unpredictable results . ( the exception is graphdriver = DETECT). After a call to the initgraph , *graphdriver is set to the current graphics driver , and *graphmode is set to the current graphics mode . 3. closegraph Shuts down the graphics system Declaration : void far closegraph( void ); Remarks : Closegraph deallocates all memory allocated by the graphics system . It then restores the screen to the mode it was in before you called initgraph . ( the graphics system deallocates memory such as the drivers , fonts , and an internal buffer , through a call to the _graphfreemem) Page | 7
  • 9. Return Value : None 4.line Line draws a line between the two specified points Declaration : Void far line ( int x1, int y1 , int x2 , int y2 ); Remarks : Line draws a line from the ( x1, y1 ) to ( x2,y2 ) using the current color , line style nad thick ness . it does not the update the current position (cp). 5. setcolor Setcolor sets the current drawing color Declaration: Void far setcolor( int color) Remarks : Setcolor sets the current drawing color to color , which can range from 0 to getmaxcolor To select a drawing color is the value that pixels are set to the when the program draws lines etc. Return value : Setcolor does not return 6.setbkcolor Page | 8
  • 10. Setbkcolor sets the current background the color using the palette Declaration : Void far setbkcolor( int color ); Remarks : Setbkcolor sets the background to the color specified by color Color : color is either a number or symbolic name specifying the color to set For example , if you want to set the background color to blue , you can call setbkcolor (BLUE) /* or */ setbkcolor(1) On CGA and EGA systems , setbkcolor changes the background color by changing the first entry in the palette. Return: Setbkcolor does not return 7.Ellipse Ellipse draws an elliptical arc Declaration : Void far ellipse ( int x, int y , int stangle , int endangle , int xradius , int yradius ) ; Remarks : Ellipse draws an elliptical arc in the current drawing color . Argument What it is ( x,y) Center of ellipse Xradius Horizontal axis Yradius Vertical axis Page | 9
  • 11. Stangle starting angle Endangle ending angle The ellipse travels from stangle to endangle . If stangle = 0 and endangle = 360 , the call to the ellipse draws a complete ellipse . The linestyle parameter does not affect the arcs , circles , ellipse or pie slices . only the thickness parameter is used . Return value : None 8.Flood fill : Flood fills a bounded region Declaration : void far floodfill( int x, int y , int border ); Remarks : Floodfill fills an enclosed area on bitmap devices . The area bounded by the color border is flooded with the current fill pattern and fill color . (x,y) is the “seed point ”.  If the seed is within an enclosed area , the inside will be filled .  If the seed is outside the enclosed area, the exterior will be filled . Use fillpoly instead of floodfill whenever possible so you can maintain code compatibility with future versions . 9.Outtextxy Page | 10
  • 12. Outtextxy displays a string at the specified location ( graphics mode ) Declaration : Void far outtextxy (int x , int y , char far * textstring ); Remarks : Outtextxy displays a text string using the current justification settings and the current font , direction and size . Outtextxy displays the textstring in the viewport at the position ( x,y) To maintain the code compatibility when using the several fonts , use textwidth and textheight to determine the dimensions of the string . If a string is printed with the default font using the outtext ot outtextxy ,any part of the string that extends outside the current viewport is truncated . Outtextxy for use in graphics mode , they will not work in the text mode. Return value : None 10.Settextjustify Sets text justification for graphics mode . Decalration : void far settextjustify ( int horiz , int vert ) ; Remarks : Text output after a call to settextjustify is justified around the current position (CP) horizontally and vertically , as specified . The default justification settings are :  LEFT_TEXT ( for horizontal )  TOP_TEXT ( for vertical ) Page | 11
  • 13. The enumeration text_justify in GRAPHICS. H provides names for the horiz and vert settings passed to the settextjustify . Settextjusitfy affects the text written with outtext and cant be used with text – mode and stream functions . Return Values : If invalid input is passed to the settextjustify , graph result returns -11 and the current text justification remains unchanged . 11.Circle Circle draws a circle Decalration : Void far circle(int x , int y , int radius ); ARGUMENT What it is Does (x,y) Center point of circle Radius Radius of circle Remarks : It draws a circle in the current drawing color. 12.Rectangle: Draws a rectangle ( graphics mode ) Declaration : Void far rectangle (int left , int top , int right , int bottom ); Remarks : Rectangle draws a rectangle in the current line style , thickness and drawing color. Page | 12
  • 14. (left , top ) is the upper left corner of the rectangle , and (right , bottom ) is the lower right corner . Return Values : None 13.Setlinestyle: Set the current line style and width or pattern Declaration : void far setlinestyle ( int line style , unsigned upattern , int thickness); Remarks : Setlinestyle sets the style for all lines drawn by line , rectangle etc. Return Values : If invalid input is passed to setlinestyle , graphresult returns -11 , the current line style remains unchanged . 14.Getmaxx ()and Getmaxy() Return maximum x or y co-ordinates of screen. Declaration : Int far getmaxx (void ); Int far getmaxy (void ); Remarks : 1 . getmaxx returns the maximum X value (screen relative ) for the current graphics driver and mode . Page | 13
  • 15. 2. getmaxy returns the maximum Y value ( screen relative ) for the current graphics drivers and mode . For Example : On a CGA in 320 * 200 mode , getmaxx returns 319 and getmaxy returns the 199 Return Values : 1) Getmaxx : maximum x screen co-ordinates. 2) Getmaxy : maximum y screen co-ordinates . 15.Cleardevice() Clears the graphic screen . Declaration : Void far cleardevice (void); Remarks : Cleardevice erases the entire graphics screen and moves the CP (Current Position ) to home (0,0). Return Values : None. 16.Setfillstyle() Set the fill pattern and color . Declaration : void far setfillstyle (int pattern , int color); Remarks : Setfillstyle set the current fill pattern and fill color To set a user defined fill pattern , do not give a pattern of 12 (USER_FILL) to setfillstyle , instead , call setfillpattern . Page | 14
  • 16. Return Values : None. If invalid input is passed to the setfillstyle ,graphresult return -11 and the current fill pattern and fill color remain unchanged . 17. delay Delay function is used to suspend execution of a program for a particular time. Declaration :- void delay(unsigned int); Here unsigned int is the number of milliseconds ( remember 1 second = 1000 milliseconds ). To use delay function in your program you should include the dos.h header file. Page | 15
  • 17. Programs of Algorithms Program1: Direct Method Of Line Drawing CODING: #include<graphics.h> #include<iostream.h> #include<conio.h> void main() { int gd=DETECT,gm; initgraph(&gd,&gm,""); int x1,x2,c,y1,y2,dy,dx,m; cout<<"tttt-----------------------------n"; cout<<"tttt DIRECT LINE BY NEHA SHARMAn"; cout<<"tttt-----------------------------n"; cout<<"enter the coordinatesn"; cin>>x1>>y1>>x2>>y2; dy=y2-y1; dx=x2-x1; m=dy/dx; c=y1-m*x1; while(x1<=x2) Page | 16
  • 19. Program 2. Digital Differential Analyzer For Line Drawing CODING: #include<graphics.h> #include<iostream.h> #include<conio.h> void main() { int gd=DETECT,gm; initgraph(&gd,&gm,""); int x1,x2,c,y1,y2,dy,dx,m; cout<<"ttt------------------n"; cout<<"tttDDA By Neha Sharman"; cout<<"ttt------------------n"; cout<<"enter the coordinatesn"; cin>>x1>>y1>>x2>>y2; dy=y2-y1; dx=x2-x1; m=dy/dx; //c=y1-m*x1; while(x1<=x2) { if(m<=1) { Page | 18
  • 21. Program3: Bresenham Line Drawing Algorithm CODING: #include<graphics.h> #include<iostream.h> #include<conio.h> void main() { int gd=DETECT,gm; initgraph(&gd,&gm,""); int f,fe,fne,x1,x2,y1,y2,dy,dx,m; cout<<"-----------------"; cout<<"nBy Neha Sharman"; cout<<"-----------------"; cout<<"nenter the cordinatesn"; cin>>x1>>y1>>x2>>y2; dy=y2-y1; dx=x2-x1; f=(2*dy)-dx; while(x1<=x2) { if(f<=0) { x1=x1+1; //y1=y1; Page | 20
  • 23. Program 4: Direct MethodPolynomial MethodCartesian Co-Ordinate Algortihm For Circle Drawing CODING: #include<conio.h> #include<graphics.h> #include<math.h> #include<iostream.h> void main() { int gd=DETECT,gm; initgraph(&gd,&gm,""); int x1,y1,xc,yc,r,x2; cout<<"tttt-----------------------------n"; cout<<"tttt DIRECT CIRCLE BY NEHA SHARMAn"; cout<<"tttt-----------------------------n"; cout<<"enter the x center y center and radiusn"; cin>>xc>>yc>>r; x1=0; x2=r/sqrt(2); while(x1<=x2) { y1=sqrt(r*r-x1*x1); putpixel(y1+xc,x1+yc,WHITE); Page | 22
  • 25. Program 5: Polar Circle Drawing Algorithm CODING: #include<conio.h> #include<graphics.h> #include<math.h> #include<iostream.h> void main() { int gd=DETECT,gm; initgraph(&gd,&gm,""); float x1,y1,xc,yc,r,t; cout<<"enter the x center y center and radius"; cin>>xc>>yc>>r; x1=0; y1=r; t=1/r; while(x1<=y1) { putpixel(y1+xc,x1+yc,WHITE); putpixel(x1+yc,y1+xc,WHITE); putpixel(x1+yc,-y1+xc,WHITE); putpixel(-y1+xc,x1+yc,WHITE); putpixel(-y1+xc,-x1+yc,WHITE); putpixel(-x1+yc,-y1+xc,WHITE); Page | 24
  • 27. Program 6: Bresenham Circle Drawing Algorithm CODING: #include<conio.h> #include<graphics.h> #include<math.h> #include<iostream.h> void main() { int gd=DETECT,gm; initgraph(&gd,&gm,""); float x1,y1,f,xc,yc,r,t; cout<<"enter the x center y center and radius"; cin>>xc>>yc>>r; x1=0; y1=r; f=3-(2*r); while(x1<=y1) { if(f<=0) { f=f+6+4*x; x=x+1; } Page | 26
  • 29. Program 7: Mid Point Circle Drawing Algorithm CODING: #include<conio.h> #include<graphics.h> #include<math.h> #include<iostream.h> void main() { int gd=DETECT,gm; initgraph(&gd,&gm,""); float x1,y1,f,xc,yc,r; cout<<"MIDPOINT CIRCLEBY NEHA SHARMAn"; cout<<"enter the x center y center and radiusn"; cin>>xc>>yc>>r; x1=0; y1=r; f=1-r; while(x1<=y1) { if(f<=0) { f=f+3+2*x1; x1=x1+1; } Page | 28
  • 31. Program 8: DirectPolynomial Algorithm Of Ellipse Drawing CODING: #include<conio.h> #include<iostream.h> #include<graphics.h> #include<math.h> void main() { int gd=DETECT,gm; initgraph(&gd,&gm,""); float xc,yc,rx,ry,x1,y1,x2; cout<<"DIRECT ELLIPSE BY NEHA SHARMAn"; cout<<"enter xc,yc,x radius,y radiusn" ; cin>>xc>>yc>>rx>>ry; x1=0; x2=rx; while(x1<=x2) { y1=(ry/rx)*sqrt((rx*rx)-(x1*x1)); putpixel(x1+xc,y1+yc,WHITE); putpixel(x1+xc,-y1+yc,WHITE); putpixel(-x1+xc,-y1+yc,WHITE); Page | 30
  • 33. Program 9: Polar Ellipse Drawing Algorithm CODING: #include<conio.h> #include<iostream.h> #include<graphics.h> #include<math.h> void main() { int gd=DETECT,gm; initgraph(&gd,&gm,""); float xc,yc,rx,ry,t1,t2,x1,y1,x2; cout<<"POLAR ELLIPSE BY NEHA SHARMAn"; cout<<"enter xc,yc,x radius,y radiusn" ; cin>>xc>>yc>>rx>>ry; t1=0; t2=90; while(t1<=t2) { y1=ry*sin(t1); x1=rx*cos(t1); putpixel(x1+xc,y1+yc,WHITE); putpixel(x1+xc,-y1+yc,WHITE); putpixel(-x1+xc,-y1+yc,WHITE); Page | 32
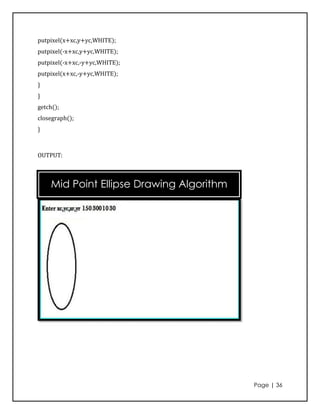
  • 35. 10. Program To Draw Ellipse Using Midpoint Ellipse Algorithm Coding: #include<iostream.h> #include<conio.h> #include<graphics.h> #include<math.h> void main() { int gd=DETECT, gm; initgraph(&gd,&gm,""); float xc,yc,x,y,xr,yr,f; cout<<”tttt------------------------------------”; cout<<"ntttMID POINT ELLIPSE BY MOHITn"; cout<<”ntttt---------------------------------------”; cout<<"nEnter the coordinates xc,yc,xr ,yr"; cin>>xc>>yc>>xr>>yr; x=0; y=yr; f=(yr*yr)+(xr*xr)/4-(xr*xr)*yr; while(2*(yr*yr)*x<=2*(xr*xr)*y) { if(f<=0) { f=f+(3+(2*x))*(yr*yr); x++; putpixel(x+xc,y+yc,WHITE); putpixel(-x+xc,y+yc,WHITE); putpixel(-x+xc,-y+yc,WHITE); Page | 34