SlideShare a Scribd company logo
THE ENTITY
RELATION
DIAGRAM
LESSON 3
2
LEARNING COMPETENCY
Document the program scope and limits according to project
standards [TLE_ICTCP9-12PLIIa-j-2]
Learning Objectives:
What am I learning?
 List the components of an Entity Relationship Diagram (ERD) that are
essential for defining the scope and limits of a database project.
Why am I learning it?
 Break down a database design project into its core entities and
relationships to determine the scope and identify any potential limits or
constraints.
3
LEARNING COMPETENCY
Document the program scope and limits according to project
standards [TLE_ICTCP9-12PLIIa-j-2]
Learning Objectives:
How will I know when I have learned it?
• Develop a detailed Entity Relationship Diagram (ERD) and
accompanying documentation that clearly defines the program scope
and limits according to project standards.
Introduction to
ENTITY
RELATION
DIAGRAM
LESSON 3.1
An Entity Relationship Diagram is a diagram that
represents relationships among entities in a
database. It is commonly known as an ER Diagram.
An ER Diagram in DBMS plays a crucial role in
designing the database. Today’s business world
previews all the requirements demanded by the
users in the form of an ER Diagram. Later, it's
forwarded to the database administrators to design
the database.
WHAT IS ERD?
WHAT IS ERD?
An Entity Relationship Diagram (ER Diagram)
pictorially explains the relationship between entities
to be stored in a database. Fundamentally, the ER
Diagram is a structural design of the database.
It acts as a framework created with specialized
symbols for the purpose of defining the relationship
between the database entities. ER diagram is created
based on three principal components: entities,
attributes, and relationships.
COMPUTER PROGRAMMING-LESSON3-ENTITY.pptx
The following diagram showcases two entities -
Student and Course, and their relationship. The
relationship described between student and course
is many-to-many, as a course can be opted by
several students, and a student can opt for more
than one course. Student entity possesses attributes
- Stu_Id, Stu_Name & Stu_Age. The course entity has
attributes such as Cou_ID & Cou_Name.
WHAT IS ER Model?
An Entity-Relationship Model represents
the structure of the database with the help
of a diagram. ER Modelling is a systematic
process to design a database as it would
require you to analyze all data
requirements before implementing your
database.
HISTORY OF ER Model?
Peter Chen proposed ER Diagrams in
1971 to create a uniform convention that
can be used as a conceptual modeling
tool. Many models were presented and
discussed, but none were suitable. The
data structure diagrams offered by
Charles Bachman also inspired his model.
Why Use ER Diagrams in
DBMS?
• ER Diagram helps you conceptualize the
database and lets you know which fields
need to be embedded for a particular
entity.
• ER Diagram gives a better
understanding of the information to be
stored in a database
Why Use ER Diagrams in
DBMS?
• It reduces complexity and allows
database designers to build databases
quickly.
• It helps to describe elements using
Entity-Relationship models.
• It allows users to get a preview of the
logical structure of the database.
Symbols Used in ER
Diagrams
• Rectangles: This Entity Relationship
Diagram symbol represents entity types
• Ellipses: This symbol represents
attributes
• Diamonds: This symbol represents
relationship types
Symbols Used in ER
Diagrams
• Lines: It links attributes to entity types
and entity types with other relationship
types
• Primary key: Here, it underlines the
attributes
• Double Ellipses: Represents multi-valued
attributes
COMPUTER PROGRAMMING-LESSON3-ENTITY.pptx
Entities
-Weak Entity
Attributes
-Key Attribute
-Composite Attribute
-Multivalued Attribute
-Derived Attribute
Relationships
-One-to-One Relationships
-One-to-Many Relationships
-Many-to-One Relationships
-Many-to-Many Relationships
Components of ER Diagram
an ER Diagram based on three basic concepts:
1. Entities
An entity can be either a living
or non-living component.
It showcases an entity as a
rectangle in an ER diagram.
Entities
For example, in a student study course, both
the student and the course are entities.
WEAK Entity
An entity that makes reliance over
another entity is called a weak entity
You showcase the weak entity as a
double rectangle in ER Diagram.
WEAK ENTITY
In the example below, school is a strong entity because it has a
primary key attribute - school number. Unlike school, the
classroom is a weak entity because it does not have any primary
key and the room number here acts only as a discriminator.
2. attribute
An attribute exhibits the
properties of an entity.
attributes
You can illustrate an attribute with an
oval shape in an ER diagram.
Types of attribute
-KEY attribute
Key attribute uniquely identifies
an entity from an entity set.
It underlines the text of a key
attribute.
Key attribute
For example: For a student entity, the roll
number can uniquely identify a student
from a set of students.
COMPOSITE attribute
An attribute that is composed of
several other attributes is
known as a composite attribute.
composite attribute
An oval showcases the composite attribute,
and the composite attribute oval is further
connected with other ovals.
multivalued attribute
Some attributes can possess over
one value, those attributes are
called multivalued attributes.
multivalued attribute
The double oval shape is used to
represent a multivalued attribute.
multivalued attribute
For example, a customer entity allows only one
telephone number for each customer. If a
customer has more than one phone number and
wants all of them in the database, then the
customer entity cannot handle them.
derived attribute
An attribute that can be derived from
other attributes of the entity is known
as a derived attribute. those that may
be computed from other attributes,
such as totals
derived attribute
In the ER diagram, the dashed oval
represents the derived attribute. For
example, if we have an attribute for birth
date then age is derivable.
3. Relationship
The diamond shape showcases a
relationship in the ER diagram.
It depicts the relationship between
two entities.
Relationship
In the example below, both the student and the
course are entities, and study is the relationship
between them.
One-to-One Relationship
When a single element of an entity
is associated with a single element
of another entity, it is called a one-
to-one relationship.
One-to-one Relationship
For example, a student has only one
identification card and an identification
card is given to one person.
One-to-many Relationship
When a single element of an
entity is associated with more
than one element of another
entity, it is called a one-to-many
relationship
One-to-many Relationship
For example, a customer can place many
orders, but an order cannot be placed by
many customers.
many-to-one Relationship
When more than one element of
an entity is related to a single
element of another entity, then it
is called a many-to-one
relationship.
many-to-one Relationship
For example, students have to opt for a
single course, but a course can have many
students.
many-to-many Relationship
Many-to-Many Relationship
When more than one element of an
entity is associated with more than
one element of another entity, this is
called a many-to-many relationship.
many-to-one Relationship
For example, you can assign an employee
to many projects and a project can have
many employees.
How to Draw an ER Diagram?
Below are some important points to draw ER diagram:
• First, identify all the Entities. Embed all the entities
in a rectangle and label them properly.
• Identify relationships between entities and connect
them using a diamond in the middle, illustrating the
relationship. Do not connect relationships with each
other.
How to Draw an ER Diagram?
Below are some important points to draw ER diagram:
• Connect attributes for entities and label them
properly.
• Eradicate any redundant entities or relationships.
• Make sure your ER Diagram supports all the data
provided to design the database.
• Effectively use colors to highlight key areas in your
diagrams.
Conclusion
ER Diagram in DBMS is widely used
to describe the conceptual design of
databases. It helps both users and
database developers to preview the
structure of the database before
implementing the database.
INTRODUCTION
TO
DATABASE
GN
LESSON 3.2
Database Design in DBMS
Database Design can be defined as a set of
procedures or collection of tasks involving
various steps taken to implement a database.
However, depending on specific requirements
above criteria might change. But these are
the most common things that ensure a good
database design.
Following are some critical points to keep in
mind to achieve a good database design:
1.Data consistency and integrity must be
maintained.
2. Low Redundancy
3. Faster searching through indices
4. Security measures should be taken by enforcing
various integrity constraints.
5. Data should be stored in fragmented bits of
information in the most atomic format possible.
Steps that a Database Designer can take to
Ensure Good Database Design
Step 1: Determine the goal of your database, and
ensure clear communication with the stakeholders
(if any). Understanding the purpose of a database
will help in thinking of various use cases & where
the problem may arise & how we can prevent it.
Step 2: List down all the entities that will be present
in the database & what relationships exist among
them.
Steps that a Database Designer can take to
Ensure Good Database Design
Step 3: Organize the information into different
tables such that no or very little redundancy is
there.
Step 4: Ensure uniqueness in every table. The
uniqueness of records present in any relation is a
very crucial part of database design that helps us
avoid redundancy. Identify the key attributes to
uniquely identify every row from columns…
Steps that a Database Designer can take to
Ensure Good Database Design
You can use various key constraints to ensure the
uniqueness of your table, also keep in mind the uniquely
identifying records must consume as little space as
possible & shall not contain any NULL values.
Step 5: After all the tables are structured, and information
is organized apply Normalization Forms to identify
anomalies that may arise & redundancy that can cause
inconsistency in the database.
Primary Terminologies Used in Database
Design
Following are the terminologies that a person
should be familiar with before designing a database:
•Redundancy: refers to the duplicity of the
data. There can be specific use cases when we
need or don’t need redundancy in our
Database. For ex: If we have a banking system
application then we may need to strictly prevent
redundancy in our Database.
Primary Terminologies Used in Database
Design
Following are the terminologies that a person
should be familiar with before designing a
database:
•Schema: is a logical container that
defines the structure & manages the
organization of the data stored in it. It
consists of rows and columns having
data types for each column.
Primary Terminologies Used in Database
Design
Following are the terminologies that a person
should be familiar with before designing a database:
•Records/Tuples: is the same thing,
basically its where our data is stored
inside a table
•Indexing: is a data structure
technique to promote efficient retrieval
Primary Terminologies Used in Database
Design
Following are the terminologies that a person
should be familiar with before designing a database:
•Data Integrity & Consistency:
Data integrity refers to the quality of
the information stored in our database
and consistency refers to the
correctness of the data stored.
Primary Terminologies Used in Database
Design
Following are the terminologies that a person
should be familiar with before designing a database:
•Data Models: provide us with visual
modeling techniques to visualize the
data & the relationship that exists
among those data. Ex: model, Network
Model, Object Oriented Model,
Primary Terminologies Used in Database
Design
Following are the terminologies that a person
should be familiar with before designing a database:
•Functional Dependency: is a relationship
between two attributes of the table that
represents that the value of one attribute
can be determined by another. Ex: {A ->
B}, A & B are two attributes and attribute A
can uniquely determine the value of B.
Primary Terminologies Used in Database
Design
Following are the terminologies that a person should
be familiar with before designing a database:
•Transaction: is a single logical unit of
work. It signifies that some changes are
made in the database.
Primary Terminologies Used in Database
Design
Following are the terminologies that a person
should be familiar with before designing a database:
•Schedule: defines the sequence of
transactions in which they’re executed
by one or multiple users.
Primary Terminologies Used in Database
Design
Following are the terminologies that a person
should be familiar with before designing a database:
•Concurrency: refers to allowing
multiple transactions to operate
simultaneously without interfering with
one another.
DATABASE DESIGN LIFE
CLYCLE
1. Requirement Analysis
It’s very crucial to understand the requirements of our application so
that you can think in productive terms. And imply appropriate
integrity constraints to maintain the data integrity & consistency.
DATABASE DESIGN LIFE
CLYCLE
2. Logical & Physical Design
This is the actual design phase that involves various
steps that are to be taken while designing a
database. This phase is further divided into two
stages:
• Logical Data Model Design: This phase consists
of coming up with a high-level design of our
database based on initially gathered requirements
DATABASE DESIGN LIFE
CLYCLE
A high-level overview on paper is made of the
database without considering the physical level
design, this phase proceeds by identifying the kind of
data to be stored and what relationship will exist
among those data.
Entity, Key attributes identification & what constraints
are to be implemented is the core functionality of this
phase. It involves techniques such as Data Modeling
to visualize data, normalization to prevent
DATABASE DESIGN LIFE
CLYCLE
An Example of Physical
Design
DATABASE DESIGN LIFE
CLYCLE
An Example of Logical Design
DATABASE DESIGN LIFE
CLYCLE
3. Data Insertion and testing for various integrity
constraints
Finally, after implementing the physical design of the
database, we’re ready to input the data & test our
integrity. This phase involves testing our database for
its integrity to see if something got left out or, if
anything new to add & then integrating it with the
desired application.
DATABASE DESIGN LIFE
CLYCLE
Physical Design of Data Model: This phase
involves the implementation of the logical
design made in the previous stage. All the
relationships among data and integrity
constraints are implemented to maintain
consistency & generate the actual
database.
DATABASE DESIGN LIFE
CLYCLE
Logical Data Model Design
The logical data model design defines the
structure of data and what relationship
exists among those data. The following are
the major components of the logical
design:
DATABASE DESIGN LIFE
CLYCLE
1. Data Models: Data modeling is a visual modeling technique used to
get a high-level overview of our database. Data models help us
understand the needs and requirements of our database by defining the
design of our database through diagrammatic representation. Ex:
model, Network model, Relational Model, object-oriented data model.
DATABASE DESIGN LIFE
CLYCLE
2. Entities are objects in the real world, which can have certain
properties & these properties are referred to as attributes of that
particular entity. There are 2 types of entities: Strong and weak
entity, weak entity do not have a key attribute to identify them,
their existence solely depends on one 1-specific strong entity &
also have full participation in a relationship whereas strong entity
does have a key attribute to uniquely identify them.
Weak entity example: Loan -> Loan will be given to a customer
(which is optional) & the load will be identified by the customer_id
to whom the lone is granted.
DATABASE DESIGN LIFE
CLYCLE
3. Relationships: How data is logically related to each
other defines the relationship of that data with other
entities. In simple words, the association of one
entity with another is defined here.
A relationship can be further categorized into –
unary, binary, and ternary relationships.
•Unary: In this, the associating entity & the associated entity both
are the same. Ex: Employee Manages themselves, and students
are also given the post of monitor hence here the student
themselves is a monitor.
DATABASE DESIGN LIFE
CLYCLE
•Binary: This is a very common relationship that you
will come across while designing a database.
Ex: Student is enrolled in courses, Employee is
managed by different managers, One student can
be taught by many professors.
•Ternary: In this, we have 3 entities involved in a
single relationship. Ex: an employee works on a
project for a client. Note that, here we have 3
entities: Employee, Project & Client.
DATABASE DESIGN LIFE
CLYCLE
4. Attributes: Attributes are nothing but properties of a specific entity
that define its behavior. For example, an employee can have unique_id,
name, age, date of birth (DOB), salary, department, Manager, project id,
etc.
5. Normalization: After all the entities are put in place and the
relationship among data is defined, we need to look for loopholes or
possible ambiguities that may arise.
Data Normalization is a basic procedure defined for databases to
eliminate such anomalies & prevent redundancy.
74
WRITTEN TASK 3
DATABASE ANALYSIS
Direction: Make a database design based on the
case studies we discussed in the previous lesson.
Break down the essential details into their core
entities and relationships.
75
WRITTEN TASK 3
1. School Management System
2. Online Retail Store
3. Hospital Management System
4. Library Management System
5. Employee Management System
RUBRICS
CRITERIA DESCRIPTION SCORE
Identification of Tables,
Fields & Relationships
Accurately identifies all necessary
tables, fields and Relationship with
strong justification for each.
10
Clarity and Organization The analysis is exceptionally clear,
well-organized, and easy to follow 10
Justification and Analysis Provides thorough and insightful
justification for all identified
components, showing a deep
understanding of database design
principles.
10
TOTAL 30
77
PERFORMANCE CHECK 3
ENTITY RELATIONSHIP DIAGRAM
ANALYSIS
Direction: Develop a detailed Entity Relationship
Diagram (ERD) based on the case studies we
discussed in the previous lesson. Define the
necessary details according to project standards.
78
1. School Management System
2. Online Retail Store
3. Hospital Management System
4. Library Management System
5. Employee Management System
RUBRICS
CRITERIA DESCRIPTION SCORE
Identification of Tables,
Fields & Relationships
Accurately identifies all necessary
tables, fields and Relationship with
strong justification for each.
10
Clarity and Organization The analysis is exceptionally clear,
well-organized, and easy to follow 10
Justification and Analysis Provides thorough and insightful
justification for all identified
components, showing a deep
understanding of entity relationship
diagram design principles.
10
TOTAL 30
Ad

More Related Content

Similar to COMPUTER PROGRAMMING-LESSON3-ENTITY.pptx (20)

Unit1 rdbms study_materials
Unit1 rdbms study_materialsUnit1 rdbms study_materials
Unit1 rdbms study_materials
gayaramesh
 
Unit1 rdbms study_materials-converted (1) (1)
Unit1 rdbms study_materials-converted (1) (1)Unit1 rdbms study_materials-converted (1) (1)
Unit1 rdbms study_materials-converted (1) (1)
gayaramesh
 
Unit1 rdbms study_materials
Unit1 rdbms study_materialsUnit1 rdbms study_materials
Unit1 rdbms study_materials
gayaramesh
 
Unit1 rdbms study_materials-converted (1) (1)
Unit1 rdbms study_materials-converted (1) (1)Unit1 rdbms study_materials-converted (1) (1)
Unit1 rdbms study_materials-converted (1) (1)
gayaramesh
 
Data Models & Introduction to UML
Data Models & Introduction to UML Data Models & Introduction to UML
Data Models & Introduction to UML
نبيله نواز
 
Data Models & Introduction to UML
Data Models & Introduction to UML Data Models & Introduction to UML
Data Models & Introduction to UML
نبيله نواز
 
ICT DBA3 09 0710 Model Data Objects.pdf
ICT DBA3 09 0710 Model Data Objects.pdfICT DBA3 09 0710 Model Data Objects.pdf
ICT DBA3 09 0710 Model Data Objects.pdf
Infotech27
 
ICT DBA3 09 0710 Model Data Objects.pdf
ICT DBA3 09 0710 Model Data Objects.pdfICT DBA3 09 0710 Model Data Objects.pdf
ICT DBA3 09 0710 Model Data Objects.pdf
Infotech27
 
Database Management System(UNIT 1)
Database Management System(UNIT 1)Database Management System(UNIT 1)
Database Management System(UNIT 1)
Dr. SURBHI SAROHA
 
Database Management System(UNIT 1)
Database Management System(UNIT 1)Database Management System(UNIT 1)
Database Management System(UNIT 1)
Dr. SURBHI SAROHA
 
Database Management System(UNIT 1)
Database Management System(UNIT 1)Database Management System(UNIT 1)
Database Management System(UNIT 1)
Dr. SURBHI SAROHA
 
Database Management System(UNIT 1)
Database Management System(UNIT 1)Database Management System(UNIT 1)
Database Management System(UNIT 1)
Dr. SURBHI SAROHA
 
Data models
Data modelsData models
Data models
Hira Bukhari
 
Data models
Data modelsData models
Data models
Hira Bukhari
 
Data models
Data modelsData models
Data models
Hira Bukhari
 
Data models
Data modelsData models
Data models
Hira Bukhari
 
Bca examination 2015 dbms
Bca examination 2015 dbmsBca examination 2015 dbms
Bca examination 2015 dbms
Anjaan Gajendra
 
Bca examination 2015 dbms
Bca examination 2015 dbmsBca examination 2015 dbms
Bca examination 2015 dbms
Anjaan Gajendra
 
DBMS-2.pptx
DBMS-2.pptxDBMS-2.pptx
DBMS-2.pptx
kingVox
 
DBMS-2.pptx
DBMS-2.pptxDBMS-2.pptx
DBMS-2.pptx
kingVox
 
Unit1 rdbms study_materials
Unit1 rdbms study_materialsUnit1 rdbms study_materials
Unit1 rdbms study_materials
gayaramesh
 
Unit1 rdbms study_materials-converted (1) (1)
Unit1 rdbms study_materials-converted (1) (1)Unit1 rdbms study_materials-converted (1) (1)
Unit1 rdbms study_materials-converted (1) (1)
gayaramesh
 
Unit1 rdbms study_materials
Unit1 rdbms study_materialsUnit1 rdbms study_materials
Unit1 rdbms study_materials
gayaramesh
 
Unit1 rdbms study_materials-converted (1) (1)
Unit1 rdbms study_materials-converted (1) (1)Unit1 rdbms study_materials-converted (1) (1)
Unit1 rdbms study_materials-converted (1) (1)
gayaramesh
 
Data Models & Introduction to UML
Data Models & Introduction to UML Data Models & Introduction to UML
Data Models & Introduction to UML
نبيله نواز
 
Data Models & Introduction to UML
Data Models & Introduction to UML Data Models & Introduction to UML
Data Models & Introduction to UML
نبيله نواز
 
ICT DBA3 09 0710 Model Data Objects.pdf
ICT DBA3 09 0710 Model Data Objects.pdfICT DBA3 09 0710 Model Data Objects.pdf
ICT DBA3 09 0710 Model Data Objects.pdf
Infotech27
 
ICT DBA3 09 0710 Model Data Objects.pdf
ICT DBA3 09 0710 Model Data Objects.pdfICT DBA3 09 0710 Model Data Objects.pdf
ICT DBA3 09 0710 Model Data Objects.pdf
Infotech27
 
Database Management System(UNIT 1)
Database Management System(UNIT 1)Database Management System(UNIT 1)
Database Management System(UNIT 1)
Dr. SURBHI SAROHA
 
Database Management System(UNIT 1)
Database Management System(UNIT 1)Database Management System(UNIT 1)
Database Management System(UNIT 1)
Dr. SURBHI SAROHA
 
Database Management System(UNIT 1)
Database Management System(UNIT 1)Database Management System(UNIT 1)
Database Management System(UNIT 1)
Dr. SURBHI SAROHA
 
Database Management System(UNIT 1)
Database Management System(UNIT 1)Database Management System(UNIT 1)
Database Management System(UNIT 1)
Dr. SURBHI SAROHA
 
Bca examination 2015 dbms
Bca examination 2015 dbmsBca examination 2015 dbms
Bca examination 2015 dbms
Anjaan Gajendra
 
Bca examination 2015 dbms
Bca examination 2015 dbmsBca examination 2015 dbms
Bca examination 2015 dbms
Anjaan Gajendra
 
DBMS-2.pptx
DBMS-2.pptxDBMS-2.pptx
DBMS-2.pptx
kingVox
 
DBMS-2.pptx
DBMS-2.pptxDBMS-2.pptx
DBMS-2.pptx
kingVox
 

Recently uploaded (20)

The ever evoilving world of science /7th class science curiosity /samyans aca...
The ever evoilving world of science /7th class science curiosity /samyans aca...The ever evoilving world of science /7th class science curiosity /samyans aca...
The ever evoilving world of science /7th class science curiosity /samyans aca...
Sandeep Swamy
 
Stein, Hunt, Green letter to Congress April 2025
Stein, Hunt, Green letter to Congress April 2025Stein, Hunt, Green letter to Congress April 2025
Stein, Hunt, Green letter to Congress April 2025
Mebane Rash
 
To study the nervous system of insect.pptx
To study the nervous system of insect.pptxTo study the nervous system of insect.pptx
To study the nervous system of insect.pptx
Arshad Shaikh
 
YSPH VMOC Special Report - Measles Outbreak Southwest US 5-3-2025.pptx
YSPH VMOC Special Report - Measles Outbreak  Southwest US 5-3-2025.pptxYSPH VMOC Special Report - Measles Outbreak  Southwest US 5-3-2025.pptx
YSPH VMOC Special Report - Measles Outbreak Southwest US 5-3-2025.pptx
Yale School of Public Health - The Virtual Medical Operations Center (VMOC)
 
SCI BIZ TECH QUIZ (OPEN) PRELIMS XTASY 2025.pptx
SCI BIZ TECH QUIZ (OPEN) PRELIMS XTASY 2025.pptxSCI BIZ TECH QUIZ (OPEN) PRELIMS XTASY 2025.pptx
SCI BIZ TECH QUIZ (OPEN) PRELIMS XTASY 2025.pptx
Ronisha Das
 
Niamh Lucey, Mary Dunne. Health Sciences Libraries Group (LAI). Lighting the ...
Niamh Lucey, Mary Dunne. Health Sciences Libraries Group (LAI). Lighting the ...Niamh Lucey, Mary Dunne. Health Sciences Libraries Group (LAI). Lighting the ...
Niamh Lucey, Mary Dunne. Health Sciences Libraries Group (LAI). Lighting the ...
Library Association of Ireland
 
How to Customize Your Financial Reports & Tax Reports With Odoo 17 Accounting
How to Customize Your Financial Reports & Tax Reports With Odoo 17 AccountingHow to Customize Your Financial Reports & Tax Reports With Odoo 17 Accounting
How to Customize Your Financial Reports & Tax Reports With Odoo 17 Accounting
Celine George
 
Operations Management (Dr. Abdulfatah Salem).pdf
Operations Management (Dr. Abdulfatah Salem).pdfOperations Management (Dr. Abdulfatah Salem).pdf
Operations Management (Dr. Abdulfatah Salem).pdf
Arab Academy for Science, Technology and Maritime Transport
 
Sinhala_Male_Names.pdf Sinhala_Male_Name
Sinhala_Male_Names.pdf Sinhala_Male_NameSinhala_Male_Names.pdf Sinhala_Male_Name
Sinhala_Male_Names.pdf Sinhala_Male_Name
keshanf79
 
How to manage Multiple Warehouses for multiple floors in odoo point of sale
How to manage Multiple Warehouses for multiple floors in odoo point of saleHow to manage Multiple Warehouses for multiple floors in odoo point of sale
How to manage Multiple Warehouses for multiple floors in odoo point of sale
Celine George
 
World war-1(Causes & impacts at a glance) PPT by Simanchala Sarab(BABed,sem-4...
World war-1(Causes & impacts at a glance) PPT by Simanchala Sarab(BABed,sem-4...World war-1(Causes & impacts at a glance) PPT by Simanchala Sarab(BABed,sem-4...
World war-1(Causes & impacts at a glance) PPT by Simanchala Sarab(BABed,sem-4...
larencebapu132
 
Exploring-Substances-Acidic-Basic-and-Neutral.pdf
Exploring-Substances-Acidic-Basic-and-Neutral.pdfExploring-Substances-Acidic-Basic-and-Neutral.pdf
Exploring-Substances-Acidic-Basic-and-Neutral.pdf
Sandeep Swamy
 
How to Set warnings for invoicing specific customers in odoo
How to Set warnings for invoicing specific customers in odooHow to Set warnings for invoicing specific customers in odoo
How to Set warnings for invoicing specific customers in odoo
Celine George
 
Phoenix – A Collaborative Renewal of Children’s and Young People’s Services C...
Phoenix – A Collaborative Renewal of Children’s and Young People’s Services C...Phoenix – A Collaborative Renewal of Children’s and Young People’s Services C...
Phoenix – A Collaborative Renewal of Children’s and Young People’s Services C...
Library Association of Ireland
 
Multi-currency in odoo accounting and Update exchange rates automatically in ...
Multi-currency in odoo accounting and Update exchange rates automatically in ...Multi-currency in odoo accounting and Update exchange rates automatically in ...
Multi-currency in odoo accounting and Update exchange rates automatically in ...
Celine George
 
2541William_McCollough_DigitalDetox.docx
2541William_McCollough_DigitalDetox.docx2541William_McCollough_DigitalDetox.docx
2541William_McCollough_DigitalDetox.docx
contactwilliamm2546
 
Anti-Depressants pharmacology 1slide.pptx
Anti-Depressants pharmacology 1slide.pptxAnti-Depressants pharmacology 1slide.pptx
Anti-Depressants pharmacology 1slide.pptx
Mayuri Chavan
 
P-glycoprotein pamphlet: iteration 4 of 4 final
P-glycoprotein pamphlet: iteration 4 of 4 finalP-glycoprotein pamphlet: iteration 4 of 4 final
P-glycoprotein pamphlet: iteration 4 of 4 final
bs22n2s
 
LDMMIA Reiki Master Spring 2025 Mini Updates
LDMMIA Reiki Master Spring 2025 Mini UpdatesLDMMIA Reiki Master Spring 2025 Mini Updates
LDMMIA Reiki Master Spring 2025 Mini Updates
LDM Mia eStudios
 
Unit 6_Introduction_Phishing_Password Cracking.pdf
Unit 6_Introduction_Phishing_Password Cracking.pdfUnit 6_Introduction_Phishing_Password Cracking.pdf
Unit 6_Introduction_Phishing_Password Cracking.pdf
KanchanPatil34
 
The ever evoilving world of science /7th class science curiosity /samyans aca...
The ever evoilving world of science /7th class science curiosity /samyans aca...The ever evoilving world of science /7th class science curiosity /samyans aca...
The ever evoilving world of science /7th class science curiosity /samyans aca...
Sandeep Swamy
 
Stein, Hunt, Green letter to Congress April 2025
Stein, Hunt, Green letter to Congress April 2025Stein, Hunt, Green letter to Congress April 2025
Stein, Hunt, Green letter to Congress April 2025
Mebane Rash
 
To study the nervous system of insect.pptx
To study the nervous system of insect.pptxTo study the nervous system of insect.pptx
To study the nervous system of insect.pptx
Arshad Shaikh
 
SCI BIZ TECH QUIZ (OPEN) PRELIMS XTASY 2025.pptx
SCI BIZ TECH QUIZ (OPEN) PRELIMS XTASY 2025.pptxSCI BIZ TECH QUIZ (OPEN) PRELIMS XTASY 2025.pptx
SCI BIZ TECH QUIZ (OPEN) PRELIMS XTASY 2025.pptx
Ronisha Das
 
Niamh Lucey, Mary Dunne. Health Sciences Libraries Group (LAI). Lighting the ...
Niamh Lucey, Mary Dunne. Health Sciences Libraries Group (LAI). Lighting the ...Niamh Lucey, Mary Dunne. Health Sciences Libraries Group (LAI). Lighting the ...
Niamh Lucey, Mary Dunne. Health Sciences Libraries Group (LAI). Lighting the ...
Library Association of Ireland
 
How to Customize Your Financial Reports & Tax Reports With Odoo 17 Accounting
How to Customize Your Financial Reports & Tax Reports With Odoo 17 AccountingHow to Customize Your Financial Reports & Tax Reports With Odoo 17 Accounting
How to Customize Your Financial Reports & Tax Reports With Odoo 17 Accounting
Celine George
 
Sinhala_Male_Names.pdf Sinhala_Male_Name
Sinhala_Male_Names.pdf Sinhala_Male_NameSinhala_Male_Names.pdf Sinhala_Male_Name
Sinhala_Male_Names.pdf Sinhala_Male_Name
keshanf79
 
How to manage Multiple Warehouses for multiple floors in odoo point of sale
How to manage Multiple Warehouses for multiple floors in odoo point of saleHow to manage Multiple Warehouses for multiple floors in odoo point of sale
How to manage Multiple Warehouses for multiple floors in odoo point of sale
Celine George
 
World war-1(Causes & impacts at a glance) PPT by Simanchala Sarab(BABed,sem-4...
World war-1(Causes & impacts at a glance) PPT by Simanchala Sarab(BABed,sem-4...World war-1(Causes & impacts at a glance) PPT by Simanchala Sarab(BABed,sem-4...
World war-1(Causes & impacts at a glance) PPT by Simanchala Sarab(BABed,sem-4...
larencebapu132
 
Exploring-Substances-Acidic-Basic-and-Neutral.pdf
Exploring-Substances-Acidic-Basic-and-Neutral.pdfExploring-Substances-Acidic-Basic-and-Neutral.pdf
Exploring-Substances-Acidic-Basic-and-Neutral.pdf
Sandeep Swamy
 
How to Set warnings for invoicing specific customers in odoo
How to Set warnings for invoicing specific customers in odooHow to Set warnings for invoicing specific customers in odoo
How to Set warnings for invoicing specific customers in odoo
Celine George
 
Phoenix – A Collaborative Renewal of Children’s and Young People’s Services C...
Phoenix – A Collaborative Renewal of Children’s and Young People’s Services C...Phoenix – A Collaborative Renewal of Children’s and Young People’s Services C...
Phoenix – A Collaborative Renewal of Children’s and Young People’s Services C...
Library Association of Ireland
 
Multi-currency in odoo accounting and Update exchange rates automatically in ...
Multi-currency in odoo accounting and Update exchange rates automatically in ...Multi-currency in odoo accounting and Update exchange rates automatically in ...
Multi-currency in odoo accounting and Update exchange rates automatically in ...
Celine George
 
2541William_McCollough_DigitalDetox.docx
2541William_McCollough_DigitalDetox.docx2541William_McCollough_DigitalDetox.docx
2541William_McCollough_DigitalDetox.docx
contactwilliamm2546
 
Anti-Depressants pharmacology 1slide.pptx
Anti-Depressants pharmacology 1slide.pptxAnti-Depressants pharmacology 1slide.pptx
Anti-Depressants pharmacology 1slide.pptx
Mayuri Chavan
 
P-glycoprotein pamphlet: iteration 4 of 4 final
P-glycoprotein pamphlet: iteration 4 of 4 finalP-glycoprotein pamphlet: iteration 4 of 4 final
P-glycoprotein pamphlet: iteration 4 of 4 final
bs22n2s
 
LDMMIA Reiki Master Spring 2025 Mini Updates
LDMMIA Reiki Master Spring 2025 Mini UpdatesLDMMIA Reiki Master Spring 2025 Mini Updates
LDMMIA Reiki Master Spring 2025 Mini Updates
LDM Mia eStudios
 
Unit 6_Introduction_Phishing_Password Cracking.pdf
Unit 6_Introduction_Phishing_Password Cracking.pdfUnit 6_Introduction_Phishing_Password Cracking.pdf
Unit 6_Introduction_Phishing_Password Cracking.pdf
KanchanPatil34
 
Ad

COMPUTER PROGRAMMING-LESSON3-ENTITY.pptx

  • 2. 2 LEARNING COMPETENCY Document the program scope and limits according to project standards [TLE_ICTCP9-12PLIIa-j-2] Learning Objectives: What am I learning?  List the components of an Entity Relationship Diagram (ERD) that are essential for defining the scope and limits of a database project. Why am I learning it?  Break down a database design project into its core entities and relationships to determine the scope and identify any potential limits or constraints.
  • 3. 3 LEARNING COMPETENCY Document the program scope and limits according to project standards [TLE_ICTCP9-12PLIIa-j-2] Learning Objectives: How will I know when I have learned it? • Develop a detailed Entity Relationship Diagram (ERD) and accompanying documentation that clearly defines the program scope and limits according to project standards.
  • 5. An Entity Relationship Diagram is a diagram that represents relationships among entities in a database. It is commonly known as an ER Diagram. An ER Diagram in DBMS plays a crucial role in designing the database. Today’s business world previews all the requirements demanded by the users in the form of an ER Diagram. Later, it's forwarded to the database administrators to design the database. WHAT IS ERD?
  • 6. WHAT IS ERD? An Entity Relationship Diagram (ER Diagram) pictorially explains the relationship between entities to be stored in a database. Fundamentally, the ER Diagram is a structural design of the database. It acts as a framework created with specialized symbols for the purpose of defining the relationship between the database entities. ER diagram is created based on three principal components: entities, attributes, and relationships.
  • 8. The following diagram showcases two entities - Student and Course, and their relationship. The relationship described between student and course is many-to-many, as a course can be opted by several students, and a student can opt for more than one course. Student entity possesses attributes - Stu_Id, Stu_Name & Stu_Age. The course entity has attributes such as Cou_ID & Cou_Name.
  • 9. WHAT IS ER Model? An Entity-Relationship Model represents the structure of the database with the help of a diagram. ER Modelling is a systematic process to design a database as it would require you to analyze all data requirements before implementing your database.
  • 10. HISTORY OF ER Model? Peter Chen proposed ER Diagrams in 1971 to create a uniform convention that can be used as a conceptual modeling tool. Many models were presented and discussed, but none were suitable. The data structure diagrams offered by Charles Bachman also inspired his model.
  • 11. Why Use ER Diagrams in DBMS? • ER Diagram helps you conceptualize the database and lets you know which fields need to be embedded for a particular entity. • ER Diagram gives a better understanding of the information to be stored in a database
  • 12. Why Use ER Diagrams in DBMS? • It reduces complexity and allows database designers to build databases quickly. • It helps to describe elements using Entity-Relationship models. • It allows users to get a preview of the logical structure of the database.
  • 13. Symbols Used in ER Diagrams • Rectangles: This Entity Relationship Diagram symbol represents entity types • Ellipses: This symbol represents attributes • Diamonds: This symbol represents relationship types
  • 14. Symbols Used in ER Diagrams • Lines: It links attributes to entity types and entity types with other relationship types • Primary key: Here, it underlines the attributes • Double Ellipses: Represents multi-valued attributes
  • 16. Entities -Weak Entity Attributes -Key Attribute -Composite Attribute -Multivalued Attribute -Derived Attribute Relationships -One-to-One Relationships -One-to-Many Relationships -Many-to-One Relationships -Many-to-Many Relationships Components of ER Diagram an ER Diagram based on three basic concepts:
  • 17. 1. Entities An entity can be either a living or non-living component. It showcases an entity as a rectangle in an ER diagram.
  • 18. Entities For example, in a student study course, both the student and the course are entities.
  • 19. WEAK Entity An entity that makes reliance over another entity is called a weak entity You showcase the weak entity as a double rectangle in ER Diagram.
  • 20. WEAK ENTITY In the example below, school is a strong entity because it has a primary key attribute - school number. Unlike school, the classroom is a weak entity because it does not have any primary key and the room number here acts only as a discriminator.
  • 21. 2. attribute An attribute exhibits the properties of an entity.
  • 22. attributes You can illustrate an attribute with an oval shape in an ER diagram.
  • 24. -KEY attribute Key attribute uniquely identifies an entity from an entity set. It underlines the text of a key attribute.
  • 25. Key attribute For example: For a student entity, the roll number can uniquely identify a student from a set of students.
  • 26. COMPOSITE attribute An attribute that is composed of several other attributes is known as a composite attribute.
  • 27. composite attribute An oval showcases the composite attribute, and the composite attribute oval is further connected with other ovals.
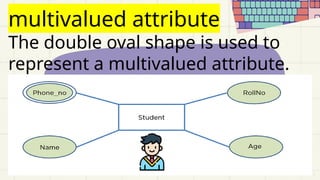
  • 28. multivalued attribute Some attributes can possess over one value, those attributes are called multivalued attributes.
  • 29. multivalued attribute The double oval shape is used to represent a multivalued attribute.
  • 30. multivalued attribute For example, a customer entity allows only one telephone number for each customer. If a customer has more than one phone number and wants all of them in the database, then the customer entity cannot handle them.
  • 31. derived attribute An attribute that can be derived from other attributes of the entity is known as a derived attribute. those that may be computed from other attributes, such as totals
  • 32. derived attribute In the ER diagram, the dashed oval represents the derived attribute. For example, if we have an attribute for birth date then age is derivable.
  • 33. 3. Relationship The diamond shape showcases a relationship in the ER diagram. It depicts the relationship between two entities.
  • 34. Relationship In the example below, both the student and the course are entities, and study is the relationship between them.
  • 35. One-to-One Relationship When a single element of an entity is associated with a single element of another entity, it is called a one- to-one relationship.
  • 36. One-to-one Relationship For example, a student has only one identification card and an identification card is given to one person.
  • 37. One-to-many Relationship When a single element of an entity is associated with more than one element of another entity, it is called a one-to-many relationship
  • 38. One-to-many Relationship For example, a customer can place many orders, but an order cannot be placed by many customers.
  • 39. many-to-one Relationship When more than one element of an entity is related to a single element of another entity, then it is called a many-to-one relationship.
  • 40. many-to-one Relationship For example, students have to opt for a single course, but a course can have many students.
  • 41. many-to-many Relationship Many-to-Many Relationship When more than one element of an entity is associated with more than one element of another entity, this is called a many-to-many relationship.
  • 42. many-to-one Relationship For example, you can assign an employee to many projects and a project can have many employees.
  • 43. How to Draw an ER Diagram? Below are some important points to draw ER diagram: • First, identify all the Entities. Embed all the entities in a rectangle and label them properly. • Identify relationships between entities and connect them using a diamond in the middle, illustrating the relationship. Do not connect relationships with each other.
  • 44. How to Draw an ER Diagram? Below are some important points to draw ER diagram: • Connect attributes for entities and label them properly. • Eradicate any redundant entities or relationships. • Make sure your ER Diagram supports all the data provided to design the database. • Effectively use colors to highlight key areas in your diagrams.
  • 45. Conclusion ER Diagram in DBMS is widely used to describe the conceptual design of databases. It helps both users and database developers to preview the structure of the database before implementing the database.
  • 47. Database Design in DBMS Database Design can be defined as a set of procedures or collection of tasks involving various steps taken to implement a database. However, depending on specific requirements above criteria might change. But these are the most common things that ensure a good database design.
  • 48. Following are some critical points to keep in mind to achieve a good database design: 1.Data consistency and integrity must be maintained. 2. Low Redundancy 3. Faster searching through indices 4. Security measures should be taken by enforcing various integrity constraints. 5. Data should be stored in fragmented bits of information in the most atomic format possible.
  • 49. Steps that a Database Designer can take to Ensure Good Database Design Step 1: Determine the goal of your database, and ensure clear communication with the stakeholders (if any). Understanding the purpose of a database will help in thinking of various use cases & where the problem may arise & how we can prevent it. Step 2: List down all the entities that will be present in the database & what relationships exist among them.
  • 50. Steps that a Database Designer can take to Ensure Good Database Design Step 3: Organize the information into different tables such that no or very little redundancy is there. Step 4: Ensure uniqueness in every table. The uniqueness of records present in any relation is a very crucial part of database design that helps us avoid redundancy. Identify the key attributes to uniquely identify every row from columns…
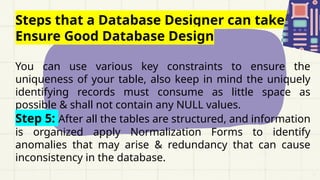
  • 51. Steps that a Database Designer can take to Ensure Good Database Design You can use various key constraints to ensure the uniqueness of your table, also keep in mind the uniquely identifying records must consume as little space as possible & shall not contain any NULL values. Step 5: After all the tables are structured, and information is organized apply Normalization Forms to identify anomalies that may arise & redundancy that can cause inconsistency in the database.
  • 52. Primary Terminologies Used in Database Design Following are the terminologies that a person should be familiar with before designing a database: •Redundancy: refers to the duplicity of the data. There can be specific use cases when we need or don’t need redundancy in our Database. For ex: If we have a banking system application then we may need to strictly prevent redundancy in our Database.
  • 53. Primary Terminologies Used in Database Design Following are the terminologies that a person should be familiar with before designing a database: •Schema: is a logical container that defines the structure & manages the organization of the data stored in it. It consists of rows and columns having data types for each column.
  • 54. Primary Terminologies Used in Database Design Following are the terminologies that a person should be familiar with before designing a database: •Records/Tuples: is the same thing, basically its where our data is stored inside a table •Indexing: is a data structure technique to promote efficient retrieval
  • 55. Primary Terminologies Used in Database Design Following are the terminologies that a person should be familiar with before designing a database: •Data Integrity & Consistency: Data integrity refers to the quality of the information stored in our database and consistency refers to the correctness of the data stored.
  • 56. Primary Terminologies Used in Database Design Following are the terminologies that a person should be familiar with before designing a database: •Data Models: provide us with visual modeling techniques to visualize the data & the relationship that exists among those data. Ex: model, Network Model, Object Oriented Model,
  • 57. Primary Terminologies Used in Database Design Following are the terminologies that a person should be familiar with before designing a database: •Functional Dependency: is a relationship between two attributes of the table that represents that the value of one attribute can be determined by another. Ex: {A -> B}, A & B are two attributes and attribute A can uniquely determine the value of B.
  • 58. Primary Terminologies Used in Database Design Following are the terminologies that a person should be familiar with before designing a database: •Transaction: is a single logical unit of work. It signifies that some changes are made in the database.
  • 59. Primary Terminologies Used in Database Design Following are the terminologies that a person should be familiar with before designing a database: •Schedule: defines the sequence of transactions in which they’re executed by one or multiple users.
  • 60. Primary Terminologies Used in Database Design Following are the terminologies that a person should be familiar with before designing a database: •Concurrency: refers to allowing multiple transactions to operate simultaneously without interfering with one another.
  • 61. DATABASE DESIGN LIFE CLYCLE 1. Requirement Analysis It’s very crucial to understand the requirements of our application so that you can think in productive terms. And imply appropriate integrity constraints to maintain the data integrity & consistency.
  • 62. DATABASE DESIGN LIFE CLYCLE 2. Logical & Physical Design This is the actual design phase that involves various steps that are to be taken while designing a database. This phase is further divided into two stages: • Logical Data Model Design: This phase consists of coming up with a high-level design of our database based on initially gathered requirements
  • 63. DATABASE DESIGN LIFE CLYCLE A high-level overview on paper is made of the database without considering the physical level design, this phase proceeds by identifying the kind of data to be stored and what relationship will exist among those data. Entity, Key attributes identification & what constraints are to be implemented is the core functionality of this phase. It involves techniques such as Data Modeling to visualize data, normalization to prevent
  • 64. DATABASE DESIGN LIFE CLYCLE An Example of Physical Design
  • 65. DATABASE DESIGN LIFE CLYCLE An Example of Logical Design
  • 66. DATABASE DESIGN LIFE CLYCLE 3. Data Insertion and testing for various integrity constraints Finally, after implementing the physical design of the database, we’re ready to input the data & test our integrity. This phase involves testing our database for its integrity to see if something got left out or, if anything new to add & then integrating it with the desired application.
  • 67. DATABASE DESIGN LIFE CLYCLE Physical Design of Data Model: This phase involves the implementation of the logical design made in the previous stage. All the relationships among data and integrity constraints are implemented to maintain consistency & generate the actual database.
  • 68. DATABASE DESIGN LIFE CLYCLE Logical Data Model Design The logical data model design defines the structure of data and what relationship exists among those data. The following are the major components of the logical design:
  • 69. DATABASE DESIGN LIFE CLYCLE 1. Data Models: Data modeling is a visual modeling technique used to get a high-level overview of our database. Data models help us understand the needs and requirements of our database by defining the design of our database through diagrammatic representation. Ex: model, Network model, Relational Model, object-oriented data model.
  • 70. DATABASE DESIGN LIFE CLYCLE 2. Entities are objects in the real world, which can have certain properties & these properties are referred to as attributes of that particular entity. There are 2 types of entities: Strong and weak entity, weak entity do not have a key attribute to identify them, their existence solely depends on one 1-specific strong entity & also have full participation in a relationship whereas strong entity does have a key attribute to uniquely identify them. Weak entity example: Loan -> Loan will be given to a customer (which is optional) & the load will be identified by the customer_id to whom the lone is granted.
  • 71. DATABASE DESIGN LIFE CLYCLE 3. Relationships: How data is logically related to each other defines the relationship of that data with other entities. In simple words, the association of one entity with another is defined here. A relationship can be further categorized into – unary, binary, and ternary relationships. •Unary: In this, the associating entity & the associated entity both are the same. Ex: Employee Manages themselves, and students are also given the post of monitor hence here the student themselves is a monitor.
  • 72. DATABASE DESIGN LIFE CLYCLE •Binary: This is a very common relationship that you will come across while designing a database. Ex: Student is enrolled in courses, Employee is managed by different managers, One student can be taught by many professors. •Ternary: In this, we have 3 entities involved in a single relationship. Ex: an employee works on a project for a client. Note that, here we have 3 entities: Employee, Project & Client.
  • 73. DATABASE DESIGN LIFE CLYCLE 4. Attributes: Attributes are nothing but properties of a specific entity that define its behavior. For example, an employee can have unique_id, name, age, date of birth (DOB), salary, department, Manager, project id, etc. 5. Normalization: After all the entities are put in place and the relationship among data is defined, we need to look for loopholes or possible ambiguities that may arise. Data Normalization is a basic procedure defined for databases to eliminate such anomalies & prevent redundancy.
  • 74. 74 WRITTEN TASK 3 DATABASE ANALYSIS Direction: Make a database design based on the case studies we discussed in the previous lesson. Break down the essential details into their core entities and relationships.
  • 75. 75 WRITTEN TASK 3 1. School Management System 2. Online Retail Store 3. Hospital Management System 4. Library Management System 5. Employee Management System
  • 76. RUBRICS CRITERIA DESCRIPTION SCORE Identification of Tables, Fields & Relationships Accurately identifies all necessary tables, fields and Relationship with strong justification for each. 10 Clarity and Organization The analysis is exceptionally clear, well-organized, and easy to follow 10 Justification and Analysis Provides thorough and insightful justification for all identified components, showing a deep understanding of database design principles. 10 TOTAL 30
  • 77. 77 PERFORMANCE CHECK 3 ENTITY RELATIONSHIP DIAGRAM ANALYSIS Direction: Develop a detailed Entity Relationship Diagram (ERD) based on the case studies we discussed in the previous lesson. Define the necessary details according to project standards.
  • 78. 78 1. School Management System 2. Online Retail Store 3. Hospital Management System 4. Library Management System 5. Employee Management System
  • 79. RUBRICS CRITERIA DESCRIPTION SCORE Identification of Tables, Fields & Relationships Accurately identifies all necessary tables, fields and Relationship with strong justification for each. 10 Clarity and Organization The analysis is exceptionally clear, well-organized, and easy to follow 10 Justification and Analysis Provides thorough and insightful justification for all identified components, showing a deep understanding of entity relationship diagram design principles. 10 TOTAL 30