SlideShare a Scribd company logo
A Presentation By, Sourav Snai,
Debjit Das,
Amrita Nandi,
Arpita Acharjya
 Continuous probability distribution is a
probability in which a random variable X
can be taken on any values (continuous)
because there are infinite values that X
could assume, the probability of X taking
on any one specific values is zero.
Therefore we often take ranges of values.
Any variable can have two types of values.
Either the values can be fixed number
which is also known as discrete values or
a specified range that is known as
continuous values
 The probability that a continuous
variable will take a specific value is zero.
 Because of this we can never express
continuous probability in tabular form it
is always expressed in a equation form or
a formula to describe such kind of
distribution.
 A continuous random variable say Y is
following uniform distribution such that
the probability between 4 and 9 is ‘r’.
Find the value of r.
Solution-
In a uniform distribution, the probability is
same for all possible values of a given
variable between the specified range so if
P is the probability of any value between
Say a and b ten P=
1
--------------
(b – a)
Since the sum of all probability is 1 .
Here P=r, a=4 and b=9
 So
1
r = _______________
( 9 – 4 )
1
= _____
5
 Uniform probability.
 Normal probability.
 Exponential probability.
 the normal probability distribution is the
most important distribution for
describing a continuous random variable.
 It is used for finding
- height of the people.
- scientific measurement.
- test scores.
- amount of rain fall.
 Normal Probability Density Function
 μ = mean
 σ = standard deviation
 Л = 3.14159
 ℮ = 2.71828
2
)(
2
1
2
1
)( 





x
exf
Continuous probability Business Statistics, Management
 The highest point on the normal curve is
the mean, which is also the median and
the mode.
 The mean can be any numerical value:
negative or positive.
 The standard deviation determines the
width of the curve. Larger values result
in wider, flatter curves.
 Probability for the normal variable are
given by the areas under the curve. The
total area under the curve is 1
.5 to the left of the mean and .5 to the right.
 The uniform probability is perhaps the
simplest distribution for a continuous random
variable.
 This is a rectangular in shape and is defined by
minimum and maximum values.
Continuous probability Business Statistics, Management
 Used to measure the time that elapses between
two occurrences of an event (the time between
arrivals)
 Examples:
 Time between trucks arriving at an
unloading dock
 Time between transactions at an ATM
Machine
 Time between phone calls to the main
operator
 The probability that an arrival time is equal to
or less than some specified time a is
P(0 ≤ x ≤ a) = 1- e^-λa
Where 1/λ is the mean time between events.
Note that if the number of occurrences per
time period is Poisson with mean , then the
time between occurrences is exponential with
mean time 1/ 
 Shape the exponential distribution.
Example: Customers arrive at the claims counter at
the rate of 15 per hour. What is the probability that
the arrival time between consecutive customers is
less than five minutes?
 Time between arrivals is exponentially distributed with
mean time between arrivals of 4 minutes (15 per 60
minutes, on average)
 1/ = 4.0, so  = .25
 P(x < 5) = 1 - e-a = 1 – e-(.25)(5) = .7135
 Scenario analysis.
- worst case
- best case
The worst case would contain some values
from the lower end of the probability,
likely form the middle and the best case
would contain upper end values.
Risk evaluation.
determines the chances of loss or profit
earned in the business organization.
Sales forecasting.
it helps to determine the sales quantity of
a product in a particular term(year,
quarter, month).
Probability in manufacturing.
it can help to determine the cost benefit
ratio or the transfer of a new
manufacturing technology process by
addressing the likelihood of improved
profit.
 From the above we can see that all the three
distribution has application in business but the
most important of all being normal
distribution. It is extensively used in statistical
decision making. It can be transformed to the
corresponding standard normal distribution
which can be used to find probability
associated with the origin normal distribution.
We could also see how it is used to find the
profit and loss chances in a business.
Even in our day to day life probability is involved
i.e. - the probability of attending math class by
students on a Monday after a nice holiday of
two days. If we think really carefully it is
involved in every aspect of our life. Even
during birth of a baby the probability of a boy
being born is ½ and a girl is ½ since either a
boy or girl can be born therefore P = 1.
probability is just not a book subject it can be
applied in every situation in our life.
Adamas University
References: www.slideshare.com
www.google.com/wikipedia/
Nav Kumar Sir’s Notes

More Related Content

What's hot (19)

PPT
Probability theory
Gaditek
 
PPT
Basic Concept Of Probability
guest45a926
 
PPT
Probability concept and Probability distribution
Southern Range, Berhampur, Odisha
 
PPT
Chapter 7 Powerpoint
ZIADALRIFAI
 
PPTX
Binomial probability distributions
Long Beach City College
 
PPTX
Discreet and continuous probability
nj1992
 
PPT
4 1 probability and discrete probability distributions
Lama K Banna
 
PPT
Probability 4.1
herbison
 
PPTX
Binomial distribution
Robert Tinaro
 
PPT
kinds of distribution
Unsa Shakir
 
PPTX
Basic Probability Distribution
Sreeraj S R
 
PPTX
Probability
Nikhil Gupta
 
PPT
Probability Distribution
Pharmacy Universe
 
PPTX
Probability distribution
Nafiur Rahman Tuhin
 
PPT
Probability distribution
Ranjan Kumar
 
PDF
Discrete probability distribution (complete)
ISYousafzai
 
PPT
1630 the binomial distribution
Dr Fereidoun Dejahang
 
PPTX
random variable and distribution
lovemucheca
 
PPTX
Probability
Sanila Khalid
 
Probability theory
Gaditek
 
Basic Concept Of Probability
guest45a926
 
Probability concept and Probability distribution
Southern Range, Berhampur, Odisha
 
Chapter 7 Powerpoint
ZIADALRIFAI
 
Binomial probability distributions
Long Beach City College
 
Discreet and continuous probability
nj1992
 
4 1 probability and discrete probability distributions
Lama K Banna
 
Probability 4.1
herbison
 
Binomial distribution
Robert Tinaro
 
kinds of distribution
Unsa Shakir
 
Basic Probability Distribution
Sreeraj S R
 
Probability
Nikhil Gupta
 
Probability Distribution
Pharmacy Universe
 
Probability distribution
Nafiur Rahman Tuhin
 
Probability distribution
Ranjan Kumar
 
Discrete probability distribution (complete)
ISYousafzai
 
1630 the binomial distribution
Dr Fereidoun Dejahang
 
random variable and distribution
lovemucheca
 
Probability
Sanila Khalid
 

Viewers also liked (10)

PPTX
Errors in Statistical Survey
ThankGod Damion Okpe
 
PPTX
Data displays in statistics
annieg8989
 
KEY
Statistics Intro
mscartersmaths
 
PPTX
Use of statistics in real life
Harsh Rajput
 
PPS
19 August Statistics For Business And Management
Dr. Trilok Kumar Jain
 
PDF
Intro to statistics
Ulster BOCES
 
PPT
Applications of statistics in daily life
minah habib
 
PPT
Statistics
pikuoec
 
PPTX
Introduction to statistics
akbhanj
 
PPTX
Strategic Performance Management System
Daisy Punzalan Bragais
 
Errors in Statistical Survey
ThankGod Damion Okpe
 
Data displays in statistics
annieg8989
 
Statistics Intro
mscartersmaths
 
Use of statistics in real life
Harsh Rajput
 
19 August Statistics For Business And Management
Dr. Trilok Kumar Jain
 
Intro to statistics
Ulster BOCES
 
Applications of statistics in daily life
minah habib
 
Statistics
pikuoec
 
Introduction to statistics
akbhanj
 
Strategic Performance Management System
Daisy Punzalan Bragais
 
Ad

Similar to Continuous probability Business Statistics, Management (20)

DOCX
Module-2_Notes-with-Example for data science
pujashri1975
 
PPTX
Inorganic CHEMISTRY
Saikumar raja
 
PPTX
2 UNIT-DSP.pptx
PothyeswariPothyes
 
PPTX
Statistics in research
Balaji P
 
DOCX
MSL 5080, Methods of Analysis for Business Operations 1 .docx
madlynplamondon
 
PPTX
Introduction-to-Probability-Distributions [Autosaved].pptx
AmarpreetKaur72156
 
PPTX
UNIT 4 PTRP final Convergence in probability.pptx
kalpana413121
 
PPTX
Statistical Analysis with R- III
Akhila Prabhakaran
 
PDF
Prob distros
Carlos Rodriguez
 
DOCX
Pampers CaseIn an increasingly competitive diaper market, P&G’.docx
bunyansaturnina
 
DOCX
Answer the questions in one paragraph 4-5 sentences. · Why did t.docx
boyfieldhouse
 
PPTX
Finance MOS 2310 Lesson 7 Chapter 13-14.pptx
Jasmine724221
 
PPTX
Hypothesis testing.pptx
rklums91
 
PPTX
STSTISTICS AND PROBABILITY THEORY .pptx
VenuKumar65
 
DOCX
Confidence Interval ModuleOne of the key concepts of statist.docx
maxinesmith73660
 
PPTX
Probability distribution Function & Decision Trees in machine learning
Sadia Zafar
 
PPTX
Introduction to Statistics and Probability
Bhavana Singh
 
PPT
FandTtests.ppt
UMAIRASHFAQ20
 
PPTX
QUANTIFYING UNCERTAINTY .....................
abhisheknagaraju126
 
PPTX
binomialpoissonandnormaldistribution-221219042035-3aefa4b3.pptx
MuhammadAwaisKamboh
 
Module-2_Notes-with-Example for data science
pujashri1975
 
Inorganic CHEMISTRY
Saikumar raja
 
2 UNIT-DSP.pptx
PothyeswariPothyes
 
Statistics in research
Balaji P
 
MSL 5080, Methods of Analysis for Business Operations 1 .docx
madlynplamondon
 
Introduction-to-Probability-Distributions [Autosaved].pptx
AmarpreetKaur72156
 
UNIT 4 PTRP final Convergence in probability.pptx
kalpana413121
 
Statistical Analysis with R- III
Akhila Prabhakaran
 
Prob distros
Carlos Rodriguez
 
Pampers CaseIn an increasingly competitive diaper market, P&G’.docx
bunyansaturnina
 
Answer the questions in one paragraph 4-5 sentences. · Why did t.docx
boyfieldhouse
 
Finance MOS 2310 Lesson 7 Chapter 13-14.pptx
Jasmine724221
 
Hypothesis testing.pptx
rklums91
 
STSTISTICS AND PROBABILITY THEORY .pptx
VenuKumar65
 
Confidence Interval ModuleOne of the key concepts of statist.docx
maxinesmith73660
 
Probability distribution Function & Decision Trees in machine learning
Sadia Zafar
 
Introduction to Statistics and Probability
Bhavana Singh
 
FandTtests.ppt
UMAIRASHFAQ20
 
QUANTIFYING UNCERTAINTY .....................
abhisheknagaraju126
 
binomialpoissonandnormaldistribution-221219042035-3aefa4b3.pptx
MuhammadAwaisKamboh
 
Ad

Recently uploaded (20)

PPTX
isaacnewton-250718125311-e7ewqeqweqwa74d99.pptx
MahmoudHalim13
 
PPTX
Nursing Shift Supervisor 24/7 in a week .pptx
amjadtanveer
 
PPTX
UVA-Ortho-PPT-Final-1.pptx Data analytics relevant to the top
chinnusindhu1
 
PPTX
GLOBAL_Gender-module-5_committing-equity-responsive-budget.pptx
rashmisahu90
 
PPTX
Slide studies GC- CRC - PC - HNC baru.pptx
LLen8
 
DOCX
Q1_LE_Mathematics 8_Lesson 4_Week 4.docx
ROWELLJAYMALAPIT
 
PPTX
apidays Munich 2025 - Streamline & Secure LLM Traffic with APISIX AI Gateway ...
apidays
 
PDF
apidays Munich 2025 - Let’s build, debug and test a magic MCP server in Postm...
apidays
 
PPTX
SRIJAN_Projecttttt_Report_Cover_PPT.pptx
SakshiLodhi9
 
PPTX
Part 1 - Descriptive Statistics and Actuarial
NhnFrsh
 
PPT
introdution to python with a very little difficulty
HUZAIFABINABDULLAH
 
PPT
Classification and Prediction_ai_101.ppt
fmodtel
 
PDF
Before tackling these green level readers child Will need to be able to
startshws
 
PPTX
nadsfbajkbfdbhbahfbadjhfbdsbdfsbdfdhbjsdhbfjjf
TauqeerUddin
 
PDF
apidays Munich 2025 - Integrate Your APIs into the New AI Marketplace, Senthi...
apidays
 
PPTX
Introduction to Artificial Intelligence.pptx
StarToon1
 
PDF
apidays Munich 2025 - Developer Portals, API Catalogs, and Marketplaces, Miri...
apidays
 
PPTX
Credit Card Fraud Detection Presentation
rasmilalama
 
PPTX
materials that are required to used.pptx
drkaran1421
 
PPTX
Learning Tendency Analysis of Scratch Programming Course(Entry Class) for Upp...
ryouta039
 
isaacnewton-250718125311-e7ewqeqweqwa74d99.pptx
MahmoudHalim13
 
Nursing Shift Supervisor 24/7 in a week .pptx
amjadtanveer
 
UVA-Ortho-PPT-Final-1.pptx Data analytics relevant to the top
chinnusindhu1
 
GLOBAL_Gender-module-5_committing-equity-responsive-budget.pptx
rashmisahu90
 
Slide studies GC- CRC - PC - HNC baru.pptx
LLen8
 
Q1_LE_Mathematics 8_Lesson 4_Week 4.docx
ROWELLJAYMALAPIT
 
apidays Munich 2025 - Streamline & Secure LLM Traffic with APISIX AI Gateway ...
apidays
 
apidays Munich 2025 - Let’s build, debug and test a magic MCP server in Postm...
apidays
 
SRIJAN_Projecttttt_Report_Cover_PPT.pptx
SakshiLodhi9
 
Part 1 - Descriptive Statistics and Actuarial
NhnFrsh
 
introdution to python with a very little difficulty
HUZAIFABINABDULLAH
 
Classification and Prediction_ai_101.ppt
fmodtel
 
Before tackling these green level readers child Will need to be able to
startshws
 
nadsfbajkbfdbhbahfbadjhfbdsbdfsbdfdhbjsdhbfjjf
TauqeerUddin
 
apidays Munich 2025 - Integrate Your APIs into the New AI Marketplace, Senthi...
apidays
 
Introduction to Artificial Intelligence.pptx
StarToon1
 
apidays Munich 2025 - Developer Portals, API Catalogs, and Marketplaces, Miri...
apidays
 
Credit Card Fraud Detection Presentation
rasmilalama
 
materials that are required to used.pptx
drkaran1421
 
Learning Tendency Analysis of Scratch Programming Course(Entry Class) for Upp...
ryouta039
 

Continuous probability Business Statistics, Management

  • 1. A Presentation By, Sourav Snai, Debjit Das, Amrita Nandi, Arpita Acharjya
  • 2.  Continuous probability distribution is a probability in which a random variable X can be taken on any values (continuous) because there are infinite values that X could assume, the probability of X taking on any one specific values is zero. Therefore we often take ranges of values.
  • 3. Any variable can have two types of values. Either the values can be fixed number which is also known as discrete values or a specified range that is known as continuous values
  • 4.  The probability that a continuous variable will take a specific value is zero.  Because of this we can never express continuous probability in tabular form it is always expressed in a equation form or a formula to describe such kind of distribution.
  • 5.  A continuous random variable say Y is following uniform distribution such that the probability between 4 and 9 is ‘r’. Find the value of r. Solution- In a uniform distribution, the probability is same for all possible values of a given variable between the specified range so if P is the probability of any value between
  • 6. Say a and b ten P= 1 -------------- (b – a) Since the sum of all probability is 1 . Here P=r, a=4 and b=9
  • 7.  So 1 r = _______________ ( 9 – 4 ) 1 = _____ 5
  • 8.  Uniform probability.  Normal probability.  Exponential probability.
  • 9.  the normal probability distribution is the most important distribution for describing a continuous random variable.  It is used for finding - height of the people. - scientific measurement. - test scores. - amount of rain fall.
  • 10.  Normal Probability Density Function  μ = mean  σ = standard deviation  Л = 3.14159  ℮ = 2.71828 2 )( 2 1 2 1 )(       x exf
  • 12.  The highest point on the normal curve is the mean, which is also the median and the mode.
  • 13.  The mean can be any numerical value: negative or positive.  The standard deviation determines the width of the curve. Larger values result in wider, flatter curves.  Probability for the normal variable are given by the areas under the curve. The total area under the curve is 1
  • 14. .5 to the left of the mean and .5 to the right.
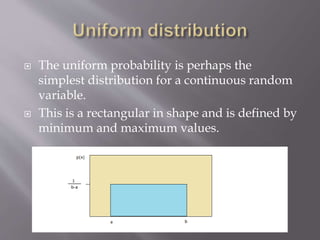
  • 15.  The uniform probability is perhaps the simplest distribution for a continuous random variable.  This is a rectangular in shape and is defined by minimum and maximum values.
  • 21.  Used to measure the time that elapses between two occurrences of an event (the time between arrivals)  Examples:  Time between trucks arriving at an unloading dock  Time between transactions at an ATM Machine  Time between phone calls to the main operator
  • 22.  The probability that an arrival time is equal to or less than some specified time a is P(0 ≤ x ≤ a) = 1- e^-λa Where 1/λ is the mean time between events. Note that if the number of occurrences per time period is Poisson with mean , then the time between occurrences is exponential with mean time 1/ 
  • 23.  Shape the exponential distribution.
  • 24. Example: Customers arrive at the claims counter at the rate of 15 per hour. What is the probability that the arrival time between consecutive customers is less than five minutes?  Time between arrivals is exponentially distributed with mean time between arrivals of 4 minutes (15 per 60 minutes, on average)  1/ = 4.0, so  = .25  P(x < 5) = 1 - e-a = 1 – e-(.25)(5) = .7135
  • 25.  Scenario analysis. - worst case - best case The worst case would contain some values from the lower end of the probability, likely form the middle and the best case would contain upper end values.
  • 26. Risk evaluation. determines the chances of loss or profit earned in the business organization. Sales forecasting. it helps to determine the sales quantity of a product in a particular term(year, quarter, month).
  • 27. Probability in manufacturing. it can help to determine the cost benefit ratio or the transfer of a new manufacturing technology process by addressing the likelihood of improved profit.
  • 28.  From the above we can see that all the three distribution has application in business but the most important of all being normal distribution. It is extensively used in statistical decision making. It can be transformed to the corresponding standard normal distribution which can be used to find probability associated with the origin normal distribution. We could also see how it is used to find the profit and loss chances in a business.
  • 29. Even in our day to day life probability is involved i.e. - the probability of attending math class by students on a Monday after a nice holiday of two days. If we think really carefully it is involved in every aspect of our life. Even during birth of a baby the probability of a boy being born is ½ and a girl is ½ since either a boy or girl can be born therefore P = 1. probability is just not a book subject it can be applied in every situation in our life.