


![8
The Threat Visualizer interface, powered by Darktrace’s self-learning technology, continuously
assessesthebehaviorofdevicesandusersacrossthewiderdigitalestate.Activityfromremote
endpoint devices, servers located in local datacenters, serverless architecture in public cloud
environments or users working in third-party SaaS services is surfaced side-by-side.
Anomalous interactions and activity are highlighted to the end-user and prioritized for
investigation by Darktrace’s Cyber AI Analyst. Many operators start with these high-level
investigations and then analyze detailed metadata and device or user activity in specialized
interfaces.
The Threat Visualizer interface is flexible and accommodates a number of workflows and
threat-investigation processes.
TheThreatVisualizerinterfacecanbeaccessedfromabrowserbynavigatingtotheIP(physical
instance only) or hostname (e.g., https://[region]-XXXX-01.cloud.darktrace.
com) of the instance. The login screen will be displayed. The minimum supported browsers to
access the Darktrace Threat Visualizer application are Chrome 85, Firefox 81, Safari 14.
Enteryour username and password to log in. The password can be reset at any time from the
Permissions Admin page of the interface if required.
If you are accessing the Threat Visualizer via your organization’s SSO system, click the Log in
via SSO button, and log in to your SSO system as standard. You will then be redirected to the
Threat Visualizer after a successful login.
For cloud based instances of the Threat Visualizer, or environments where 2FA has been
enabled by an administrator, a QR code will be displayed on first access. Please scan this QR
codewithyourpreferred multi-factorauthentication app such as GoogleAuthenticatororDuo
Security.
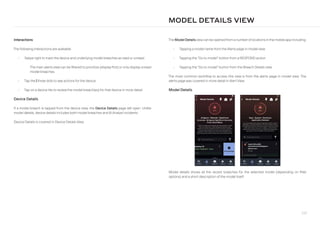
Afteryouhaveloggedin,theThreatVisualizerhomescreenwillbedisplayed.Thedefaultlanding
page can be altered from Account Settings, or your administrator may have configured it for
you already. The available options are: Threat Visualizer (default), Dynamic Threat Dashboard,
Email Console, Platform Accounts Console, and System Status Page.
Please note, five consecutive failed login attempts will result in the account being locked for
five minutes. Subsequent failed attempts will increase the lockout time.
LOGGING INTO THE THREAT VISUALIZER FOR THE FIRST TIME](https://image.slidesharecdn.com/darktracethreatvisualizeruserguide-231011215555-7bca9746/85/Darktrace_Threat_Visualizer_User_Guide-pdf-8-320.jpg)


![44
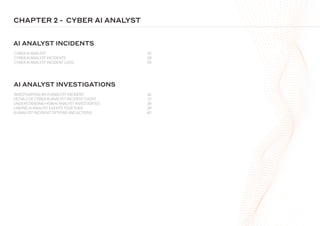
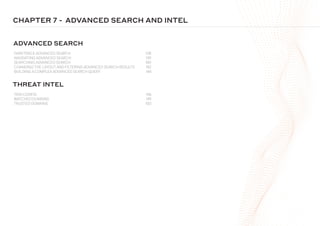
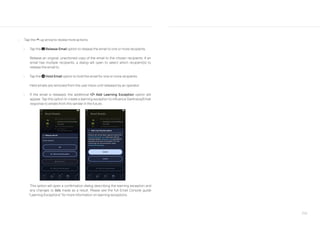
DEVICE INVESTIGATION OPTIONS
The icon for the device is decided by its device type. Device type is derived by Darktrace from
observation of the device behavior - it can be overwritten in Device Admin (see Device Admin)
or from the icons in the omnisearch bar (see below).
Belowthe device options are anytags that have been applied to the device.Tags offera simple
labelling system for network devices, credentials and users detected in external platforms
(SaaS users)which can be used to identifyimportant resources, control eligibilityforDarktrace
RESPOND responses and alter model logic. Tags with an hourglass-half hourglass icon indicate an expiry
time is associated with the tag - click this icon to alter the expiry. More information can be
found in Adding and Reviewing Tags.
On the right oftheworkspace is a panelwith statistics about the device’s connections overthe
time window chosen in the selector. The time window is shown belowthe timezone. By default,
the time window is 5 minutes.
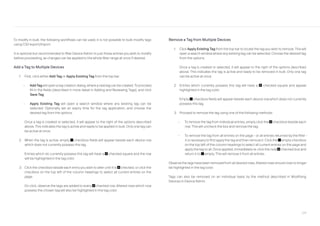
On the left of the device name is an icon representing the device type. The device type is
automatically derived and can be manually overwritten.
To the right of the device name are a series of icons; these icons and options will differ
depending on the type of device.
Darktrace RESPOND
If the device or user is subject to a Darktrace RESPOND action at the current time, the
omnisearch will appear shaded green. If an action is currently pending confirmation for the
device, the omnisearch will appear shaded orange. A Darktrace RESPOND icon - a - will also
appear beside the device type.
Device Options
ICON APPLICABLE TO DESCRIPTION
dt-asm-icon Open Device in
ASM
Network
Where the Darktrace PREVENT/Attack Surface
Management integration is present, matched
devices will display this icon. Click to pivot to the
matched asset in ASM.
dt-e2e-icon Open Device in
E2E
All
Where Darktrace PREVENT/End-to-End is
configured, click to pivot to the device in the E2E
interface.
Device Options
At the top of the workspace, in the omnisearch bar, the device focused upon is shown. The
bar displays the device label, hostname and IP address, where available. For third-party
platform user devices, the device name is displayed in the format [SaaS::][service]
[username]. For devices monitored by Darktrace DETECT RESPOND/Endpoint agents,
only the hostname and label are displayed as the device may have many concurrent IPs.](https://image.slidesharecdn.com/darktracethreatvisualizeruserguide-231011215555-7bca9746/85/Darktrace_Threat_Visualizer_User_Guide-pdf-44-320.jpg)


![50
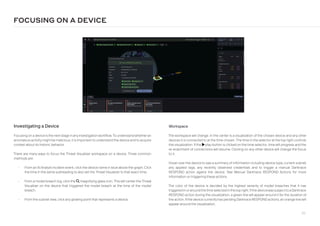
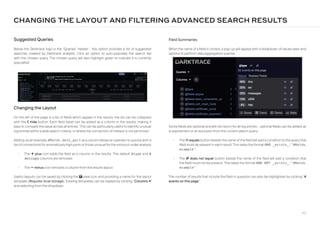
OPTION DESCRIPTION
a Launch
RESPOND Action
For network and endpoint devices, trigger a RESPOND action
populated with the details of the event log line. Particularly useful
for the “Block Matching Connections” inhibitor type. See Manual
Darktrace RESPOND Actions for more information on triggering
these actions. Requires a relevant Darktrace RESPOND license to be
present.
search-plus View advanced
search for this
event
This options opens the Darktrace Advanced Search interface to
explore a more detailed version of the event or connection log for
granular analysis For some events there may be more than one
search result with additional contextual information. More information
about Advanced Search can be found in Darktrace Advanced Search.
arrow-to-bottom Create a packet
capture file for this
event
Opens a dialog to create a packet capture device for the specific
chosen connection (see Creating Packet Captures). This option is not
available for SaaS user devices.
info-circle Search
Defender for
Process Details
If the Darktrace DefenderAdvanced Hunting integration is configured,
users can request process data from Microsoft Defender for
connection events. This option will only appear for connections
older than 15 minutes for devices observed by both Darktrace and
Microsoft Defender. For more information, please see Darktrace
Microsoft DefenderAdvanced Hunting Integration.
user Search Defender
for User Logins
If the Darktrace DefenderAdvanced Hunting integration is configured,
users can request a list of users who logged into the device around
the time of the activity from Microsoft Defender. This option will
only appear for devices observed by both Darktrace and Microsoft
Defender. For more information, please see Darktrace Microsoft
DefenderAdvanced Hunting Integration.
copy Copy to
clipboard
Copies the exact log line to the clipboard.
history Visualize
connection history
This option opens a 3D visualization of historic similar connections
such as those on the same port, those to the destination device and
those for the connection pair. This option is not available for SaaS user
devices.
filter Filter Event Log
by this [protocol/
port/IP]
Multiple options to filter the log by specific aspects of the connection
will appear. Granular filters can be applied to the event log to focus on
specific behavior; these are discussed in more detail in Filtering the
Device Event Log. This option is not available for SaaS user devices.
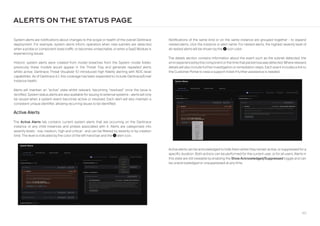
The device event log is a detailed list of activity and connections in chronological order. When
investigating an alert, reviewing the behavior of the device before and after the alert can be
useful to acquire important context.
Understanding the Device Event Log
Each log entry is sorted in time order, working backwards from the time selected in the top
right. The time window can be narrowed by adding a time filer using the filter option.
Each log entry describes the device and the activity performed. For network devices, this
might be a connection from the device IP to a specific host on a specific port. For SaaS user
devices, the log is structured to show the action, the user and the location it was performed
from. The event log also contains contextual information like changes to device information,
USING THE DEVICE EVENT LOG
commentary from Darktrace anomaly detection and model breaches triggered.
More log lines can be loaded by scrolling to the end of the log and clicking “load more”. The
number of lines loaded at a time can also be altered here.
Log Entry Options
Between the time stamp and log line is an caret-down arrow icon with extra options:](https://image.slidesharecdn.com/darktracethreatvisualizeruserguide-231011215555-7bca9746/85/Darktrace_Threat_Visualizer_User_Guide-pdf-50-320.jpg)

![52
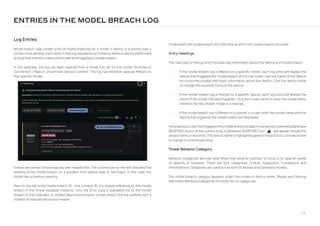
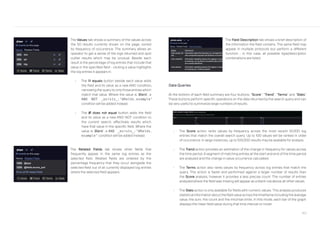
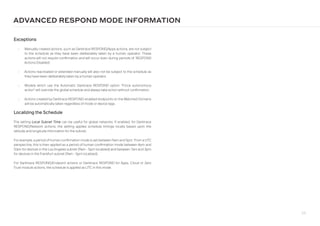
Investigating a Connection Entry
A typical network or endpoint device will have a log made up mostly of connection events.
Connections are indicated by an arrow pointing in the direction of the connection. Each
connection entry is broken up into important parts.
For example:
INVESTIGATING A CONNECTION IN THE DEVICE EVENT LOG
long-arrow-left ws123.holdingsinc.com was still connected to darktrace.com via proxy.holdingsinc.com
[443]
Afterthe device is a simple description ofthe connection status. Examples include “connected
to”, “made a successful DNS request for”, “was blocked from connecting to”. The connection
direction is part of this status: “was still connected to by” indicates our chosen device is the
destination, “connected to” means it was the source.
First isthe connection direction - a long-arrow-left left-facing arrowindicatesthe connectionwas outbound,
a long-arrow-right right-facing arrow indicates the connection is inbound. An arrow with a cross indicates a
failed connection. A flashing arrow means the connection is ongoing at the Threat Visualizer
time selected.
Click the direction arrow for detailed information about the connection such as source and
destination IPs, data transferred and protocol. This info can be “popped out” in a separate
window to refer back to.
Next, hoveroverthe name ofthe device fora summarytooltipwith basic information about the
device. The first device in the log line should be the device currently focused on.
Following the status is the endpoint, device or host that was connected to (or the device was
connected to by).
• If the source or destination is an internal device, hover over the name of the device for
a summary tooltip with basic information about the device. Click the device name to
change the Threat Visualizer focus to this other device.
• If the source or destination is an external hostname, multiple interactions are available:
• Hover overthe endpoint or host for a summarytooltip with basic information about
the rarity of the endpoint in the context of the network.
• Clickthe external-link-alt link icon to open the external sites summary. Similarto device summary,
this summary gives information devices that have connected to the external
location. More information is available in External Sites Summaryand External Sites
Summary for IPs and Hostnames.
• Click the hostname or endpoint name to open an additional event log focused on
that host.
• If workflow integrations that allow lookups for external IPs and hostnames are
enabled (such a VirusTotal), a exclamation-circle pivot icon will appear for these entries.](https://image.slidesharecdn.com/darktracethreatvisualizeruserguide-231011215555-7bca9746/85/Darktrace_Threat_Visualizer_User_Guide-pdf-52-320.jpg)

![54
After the event is the actor - the user who performed the action (“performed by”). In most
cases, this user will be the same user the Threat Visualizer is focused on. However, users can
also change things about other users such as an admin changing their permissions. In this
case, the SaaS user device currentlyfocused on is the resource being changed. These events
will appearwith the userwho performed the action as the actor, and the chosen device as the
resource. Color coding the log by actor can be a useful way to identify these inbound events.
Click the actor to change the focus of the Threat Visualizer.
If the action impacts a resource such as a folder, a calendar invite, a user, a file - this will
appear next. The resource can also be the user currently focused upon if another user does
something to affect them. Color coding the log by resource will also add the resource type in
square brackets at the end of the line.
Investigating a SaaS Activity Entry (Notice)
Log lines for SaaS and cloud users are structured slightlydifferentlyto connection events. The
log lines take the format of event, actor, resource, source. For example:
INVESTIGATING SAAS ACTIVITY IN THE DEVICE EVENT LOG
info-circle Login performed by isabella.west_admin@holdingsinc.com - from 172.217.169.36 (ASN
Example ASN)
info-circle FileUploaded performed by isabella.west_admin@holdingsinc.com on Document.docx -
from 172.217.169.36 (ASN Example ASN) [File]
info-circle Update User performed by carla.hurst@holdingsinc.com on User isabella.west_admin@
holdingsinc.com - from 172.217.169.36 (ASN Example ASN)
The info-circle info icon that appears first can be clicked to open a tooltip with detailed information
about the event, the user and the resource that was changed. This info can be “popped out” in
a separate window to refer back to.
Users can perform a wide range of actions across different SaaS platforms; for ease, events
are grouped into high level categories such as “SaaS Login” or“SaaS Resource Modified”. Click
the event to open an event log of all actions in the same category across all users. The SaaS-
specific “event” color coding allows rare events to be distinguished amongst frequent logins
or file actions.](https://image.slidesharecdn.com/darktracethreatvisualizeruserguide-231011215555-7bca9746/85/Darktrace_Threat_Visualizer_User_Guide-pdf-54-320.jpg)

![56
FILTERING THE DEVICE EVENT LOG
Advanced Filters and Options
ICON DESCRIPTION
history Unsync from
Threat Visualizer
time
The device event log displays activity logs going backwards
chronologically from the time selected in the top right. If the time is
changed, the log will change. Unsyncing the log allows the time to be
changed whilst still preserving the logs.
Unsync log
from the Threat
Visualizer filters
The connection panel on the right of the workspace can be filtered
to show specific ports or hostnames. These filters are also applied to
the event log unless it is unsynced.
bars Hide duplicate
connections
If a device repeatedly connects to an endpoint, this filter restricts the
log to show only one entry per-endpoint and port.
align-left Hide event
descriptions
Darktrace anomaly detection may add commentary to events that
are deemed unusual. This filter hides those comments inline in the
event log.
greater-than Any Size
Limit events in the log to those that transferred over a defined
threshold of data.
search View advanced
search
This icon opens the Darktrace Advanced Search interface to explore
a more detailed version of the event log for granular analysis. By
default, the search is limited to the device IP over a period of
1hr before the Visualizer time selected. More information about
Advanced Search can be found in Darktrace Advanced Search. This
option is not available for SaaS or endpoint devices.
arrow-to-bottom View packet
capture
Opens a dialog to create a packet capture device for connections
to/from the device IP over a chosen time window (see Creating
Packet Captures). For devices monitored by Darktrace DETECT
RESPOND/Endpoint agents, the interface IPforwhich the capture
should be created must be selected first. This option is not available
for SaaS user devices.
Filtering the Log Information
When you are familiarwith the parts of each log line, the next step is to filterthe log to focus on
just the information and activity of interest. At the top of the event log several device-related
options are available. The options that appear will vary depending on your environment and
the makeup of network traffic or user activity returned by the log:
ICON DESCRIPTION
dts-filter-plus-circle
This icon allows a text filter to match against fields such as hostname,
application protocol and ASN in the log entries. It can also be used
to change the current time window for logs. Only one filter of each
type can be defined.
dts-filter-slash Remove filters
This icon will appear if filters are applied and can be used to remove
the current filter set.
filter Choose which
type of events to
show in the log
The device event log includes many different types of event; the filter
limits the log to just specific types of events, or filters out specific
event types. The log can be filtered to show or exclude all network
connections, new connections, unusual connections, connections
blocked by Darktrace RESPOND, changes to device information
(“history”), model breaches triggered by the device, and contextual
information or activity (“notices”). SaaS user activity is always of the
“notice” type.
dts-filter-internal-external Choose whether
to show internal or
external events in
the log.
For connectivity, filter the log to show only events to/from internal
endpoints, to/from external endpoints, or both.
dts-filter-incoming Toggle
incoming/outgoing
events
Filter the log to only incoming connections, outgoing connections
or both.
palette Color-code
events by their
properties
Color-code the event log lines by the specific filter. Doing so will
add additional details after the event line. For example, coloring by
port will add the port in square brackets (e.g. [443]). Default color
coding is controlled in each user’s account settings. Event logs for
SaaS user devices will present different filtering options specific to
SaaS activity.
ellipsis-v Advanced options
Provides access to advanced options and filters. Refer to the table
below for more information.](https://image.slidesharecdn.com/darktracethreatvisualizeruserguide-231011215555-7bca9746/85/Darktrace_Threat_Visualizer_User_Guide-pdf-56-320.jpg)


![80
COMMONLY APPLIED TAGS
The ThreatVisualizersupports a flexible label system called Tags to allowanalysts to be able to
rapidly label and refer to groups of devices within the platform. One use case for this feature is
to enable monitoring of high-risk users or devices such as departing employees or key assets.
Tags can be applied manually, applied automatically by models as a breach action or applied
as part of the Darktrace mathematical modeling.
The following tags are commonly used within the Darktrace platform:
TAG DESCRIPTION
Admin
Device will be excluded from common admin related models (for
example, unusual admin session models).
Security Device
Device is a known security device which can affect the behavior
of other devices by making thousands of inbound connections
- excludes it from related models for such activity (for example,
network scanning models).
Exclude Data
Transfer
Device should not breach on unusual data transfer models (for
example, backup servers).
Model Excluded
Device will not breach any models, but its connections are still
recorded and visible as normal.
High Risk
Device has breached a network scan or attack tools model in the
past 48 hours.
Active Threat
Device has breached a Darktrace RESPOND/Network (Antigena
Network) model (excludes Compliance models) with a breach score
greater than 25% in the past two hours.
Key User
Device has authenticated using a key user account (requires
configuration of key users in the corresponding model).
Conflicting User
Agent
Device has been detected using at least three different user agents
in individual connections within the last 4 minutes (for example, Linux,
Windows and iOS).
DHCP Relay
Device has been identified to relay local DHCP requests to a DHCP
server.
If addingwith an expirytime, select the desired timewindowfrom the dropdown and then click
Save changes to add the tag.
When the device has manytags, these are collapsed and can be shown in a popup, searchable
dialog by clicking the “+[#] tags”
Scoped Tags
Scoping is a special syntax that can be used to create groups of tags (or “scopes”). Scoped
tags are mutually exclusive; only one tag of a specific scope can be present on a device at
once. Attempting to add another tag from the same scope will replace the existing tag.
For example, a device has the tag Team::Finance (which has the scope Team). If a user
or model attempts to add the tag Team::Marketing to the device, doing so will remove
Team::Finance. This is because the two tags have the same scope - Team - and only one
tag from the Team scope can be present on the device at once.
This can be useful when tags are used to indicate a status or membership of a group where
it would not make sense to have more than one entry. For example, a set of tags could be
created to describe the employment status of users: EmployeeStatus::AwaitingStart,
EmployeeStatus::Current,EmployeeStatus::LeaverEmployeeStatus::Left.
A user can move between these states but would never occupy more than one state.
To create a scoped tag, use the syntax [a]::[b] when creating the label for the tag, where a
is the scope and b can be any text.
A double colon - :: - must be used as part of the tag label or the tag will not be scoped.](https://image.slidesharecdn.com/darktracethreatvisualizeruserguide-231011215555-7bca9746/85/Darktrace_Threat_Visualizer_User_Guide-pdf-80-320.jpg)


![138
Main Menu
Select “search-plus Advanced Search” from the main menu of the Threat Visualizer, or “search Advanced
Search” from the Platform Accounts Console (formerly SaaS Console) sidebar.
Event of Interest
To review a Threat Visualizer event log entry in Advanced Search, click the caret-down triangle icon
beside the entry and select the option “View advanced search for this event”. This applies to
all log types, including the model breach log, device event log, and event log. This option may
not be available for all connections or events.
For the Platform Accounts Console, Advanced Search can be accessed from any event log
line with the search search icon. Additionally, the caret-down triangle icon may appear beside detailed event
properties such as actor or IP address. Selecting “Search Advanced Search for [this value]”
from the options will open a simple search for that characteristic.
What is Advanced Search?
Darktrace analyzes network traffic through Deep Packet Inspection; each connection is
processed and logs containing key metadata about the connection are produced. Similarly,
Darktrace/Apps, Darktrace/Cloud and Darktrace/Zero Trust modules and other integrations
analyze activity data from third-party platforms and create log entries for each event. The
Threat Visualizer interface displays a relevant subset of this metadata in device event logs and
breach logs, howeveras an investigation progresses,the need can ariseto reviewconnections
and events in more detail.
The Advanced Search interface provides searchable access to the detailed metadata logs
produced by network traffic and event analysis. For advanced users, complex query syntax
and data aggregation analysis are available. For those just getting started, simple queries can
be built up slowly and saved for future use.
Launching Advanced Search
There are two ways to access Advanced Search: from an event of interest or from the main
menu.
DARKTRACE ADVANCED SEARCH](https://image.slidesharecdn.com/darktracethreatvisualizeruserguide-231011215555-7bca9746/85/Darktrace_Threat_Visualizer_User_Guide-pdf-138-320.jpg)


![144
The latterexample matches specifictop-level domain extensions - regardless ofthe hostname
- that are indicative of encryption certificates used by TOR nodes.
Searching by Field
To search for (orwithin) the value of a field, use the name of the field followed by a colon:
Examples:
@fields.host:www.darktrace.com
@fields.source_ip:10.10.*
For numeric values, greater-than () and less-than () operators can be used to identifyvalues
above or below a certain threshold.
Example:
@fields.orig_bytes:0
The notation TO within square brackets designates a range of numbers.
Example:
@fields.dest_port:[6881 TO 6999]
The example above identifies a range of ports associated with the use of the BitTorrent file-
sharing protocol.
Constructing a Search
Advanced Search allows forcomplex structured searches to be performed to retrieve detailed
log information on connections. A wide starting search can be quickly focused using the
buttons found across the interface to include and exclude values and fields.
Searches over a longer period will take longer to complete. Searches that take too long will
be aborted to prevent negative impacts on the performance of other parts of the Darktrace
system. Narrowing the scope of the search by time or by making a more specific query will
help the search to return results more quickly.
Suggested searches created byDarktrace analysts are also provided on the left; click “Queries”
to view a list of these entries, then click an option to auto-populate the search bar with the
chosen query.
Basic String Search
Words can be entered freeform and will be looked for across all values in the database.
Enclosing a value in quotation marks will search for an exact string match and treat spaces as
part of the search term.
Example:
google
Awildcard (*) can be used to represent any number of characters,
Examples:
*.darktrace.com
@fields.certificate_issuer:*.com AND @fields.certificate_subject:*.net
BUILDING A COMPLEX ADVANCED SEARCH QUERY](https://image.slidesharecdn.com/darktracethreatvisualizeruserguide-231011215555-7bca9746/85/Darktrace_Threat_Visualizer_User_Guide-pdf-144-320.jpg)


![163
MODEL DEFEATS
In this example, the model is prevented from breaching if the device that sends data
outbound has a hostname that matches the regular expression (u-infra-)[0-9]+.When
the comparator is positive - e.g. “matches”, “is”, “contains” - the defeat essentially excludes a
subset of devices or activity from triggering a breach.
Conditional Defeats
From Darktrace Threat Visualizer 6, defeats can be conditional - one defeat can contain
multiple “AND” conditions that limit the scope. Where the model is a checklist, the overall logic
can be thought of like:
What Are Defeats?
Defeats are different from negative filters. Filters in the model logic limit the connections,
events or activity eligible to trigger a breach down to only those that are relevant. These are
integral parts of the model logic. Defeats are specific conditions which prevent a model from
breaching - they are distinct from the logic. Because of this distinction, defeats are specific
to each environment and do not prevent the main model logic from being updated. Adding
a defeat to a Darktrace-maintained model does not make it ineligible for model bundle
updates.
Defeat conditions offer more specificity than device-based exclusions or restrictions and can
also target a large range of devices by characteristics like device type or hostname. Defeats
can be a useful tool to tune existing models to suit your environment as your deployment
develops, whilst also leveraging the expertise of the Darktrace analyst team as they update
default models to match the ever-changing threat landscape.
Defeat Logic
In contrast to components, no defeats can evaluate as true for the model to breach - each
defeat should be considered as a series of “AND NOT” logic lines against the whole model.
Where the model is a checklist, the overall logic can be thought of like:
[component 1] AND [component 2] AND NOT [defeat 1] AND NOT [defeat 2]
For example, an organization has an update infrastructure that regularly sends large files
to external locations - all internal devices in that infrastructure use a hostname convention
“u-infra-##”. These devices can be excluded from the scope of the model with the defeat:
[Internal source device hostname] [matches regular expression] [(u-infra-)[0-9]+]
[component 1 must be true] AND [component 2 must be true] AND NOT [IF ([A]) is true]
AND NOT [IF ([A] AND [B]) is true]
Continuingthe example above,we can restrictthe defeatto justthosewhich matchthe regular
expression and are detected as server device types.
IF ([Internal source device hostname] [matches regular expression] [(u-infra-)[0-9]+]) AND
([Internal source device type] [is] [Server - Any])
To add a condition, click the horizontal-rule line icon on the right of the defeat line.](https://image.slidesharecdn.com/darktracethreatvisualizeruserguide-231011215555-7bca9746/85/Darktrace_Threat_Visualizer_User_Guide-pdf-163-320.jpg)
![164
Negative Defeats
Defeats can also be used to limit the scope of a model - this is a very powerful tool to tailor
modelstoyourenvironmentbutmustbecarefullyexecutedtoavoidover-limiting.Forexample,
adding the following defeat would restrict the model to only breach when the device has the
File Server tag:
[Tagged internal source] [does not have tag] [File Server]
If a defeat condition evaluates as true, it prevents the model from breaching entirely. In the
above case, the defeat will evaluate as true for all devices not tagged with “File Server” -
essentially limiting the model to only breach when the device is tagged.
Defeats with negative comparators can therefore constrain a model to very specific breach
criteria.
Bulk Editing Defeats
Defeats can be downloaded and edited as a .csv file, then re-uploaded to the model. This can
be a quick way to add the same defeat conditions across multiple models.
Models curated and maintained by the Darktrace analyst team are mapped to the MITRE
ATTCK Framework, where applicable. This applies to both standard Darktrace DETECT
models mapped to MITREATTCKEnterprise techniques, and Darktrace/OT models mapped
to MITRE ATTCK ICS techniques.
This mapping is a valuable tool to understand coverage and for teams with internal playbooks
for howto address each technique. For each model, the MITRE ATTCK Mapping tab displays
MITRE ATTCK MAPPINGS
the tactics and techniques the model covers are displayed on this tab.
For each technique, click ” View in MITRE” to open detailed information about the technique
on the MITRE website.
AJSONfile ofall mappings can be downloadedfrom anymodel. In Darktrace/OTenvironments,
this option will download both the standard Darktrace DETECT mapping file and the
specialized Darktrace/OT ICS mapping file. This mapping file can be uploaded to the MITRE
ATTCK navigator to browse the mapped techniques. If you are unsure how to use this file,
refer to the instructions provided in “JSON Usage Instructions external-link”](https://image.slidesharecdn.com/darktracethreatvisualizeruserguide-231011215555-7bca9746/85/Darktrace_Threat_Visualizer_User_Guide-pdf-164-320.jpg)


![168
Example Match:
mail.google.co.uk
google.co.uk
Example Breach Condition
[Connection Hostname] [matches] [?oogle.co.uk]
Example Match:
google.co.uk
Contains / does not contain
Tries to locate the exact string provided anywhere within the filtered field.
Example Breach Condition
[Connection Hostname] [contains] [`darktrace`]
Example Match:
darktrace.com
Matches regular expression / does not match regular expression
Attempts to match a value in the field against a regular expression. Does not support lookups.
The comparator is case-sensitive but can be made insensitive by surrounding the expression
with forward-slash and appending an ‘i’.
Filters are combined with comparators and values to create breach conditions.
Filter Comparators
Matches / does not match
Attempts to match the string provided against the value in the field. If * is used, performs a
simple wildcard match of any length. If ? is used, performs a wildcard match against a single
character.
Example Breach Condition
[Connection Hostname] [matches] [*oogle.co.uk]
Model Filters
Each metric has a list of applicable filters that can be used to limit its scope. For example,
connection metrics can be filtered by hostname rarity, ports and connection details such as
length and data transfer. SaaS activity, representing discrete events, can be filtered by the
user involved, the SaaS platform, the geographic location of the action, etc.
ADDING FILTERS TO A MODEL COMPONENT](https://image.slidesharecdn.com/darktracethreatvisualizeruserguide-231011215555-7bca9746/85/Darktrace_Threat_Visualizer_User_Guide-pdf-168-320.jpg)
![169
Example Breach Conditions
[Tagged Internal Source] [does not have tag] [Admin]
Numeric Comparators
Thefollowingnumericcomparatorsaresupported.Dependingonthefilter,notallcomparators
may be available.
• (Less than)
• = (Less than or equal to)
• = (Equal to)
• != (Not equal to)
• = (Greater than or equal to)
• (Greater than)
Example Breach Conditions
[Rare external IP] [=] [90]
Other Filters
Some very specific filters do not have comparators orvalues. For example, the “Direction” filter
offers the values “Incoming only” and “Outgoing only” instead of defining a comparator. The
“Same IP” and “Unique IPs” filters do not have any comparators or values at all. The majority of
filters behave exactly as described above. Where filters differ, the logic should still be clear.
Example Breach Condition
[Message] [matches regular expression]
[(Anomalous|Compromise|Device|Unusual Activity|User|Infrastructure).*]
Example Match:
Device / New Failed External Connections
Is longer than / is shorter than
This comparator accepts a number, representing the number of bytes.
Example Breach Condition
[DNS Hostname Lookup] [is longer than] [0]
Is / Is not
Allows for values to be selected from a list of predefined values. Also includes booleans.
Example Breach Conditions
[Day of the Week] [is] [Sunday]
[Proxied Connection] [is] [False]
Has tag / does not have tag
For tagged internal sources or destinations, allows the tag to be selected from a list.](https://image.slidesharecdn.com/darktracethreatvisualizeruserguide-231011215555-7bca9746/85/Darktrace_Threat_Visualizer_User_Guide-pdf-169-320.jpg)
![170
Metric: [External Data Transfer] [] [100 MB] in [60 Minutes]
Filters:
A - [Day of the Week] [is] [Sunday]
B - [Proxied Connection] [is] [False]
C - [Tagged Internal Source] [does not have tag] [Admin]
Breach Conditions: A B C
This limits the component to only breach when all filters - A and B and C are satisfied. In this
case, the component would only breach when a non-admin device transfer more than 100mb
externallywithin an hour on a Sundaywithout using a proxy.
There is often more than one set of criteria we wish to apply to a component, for example
when an event can be identified differently over UDP or TCP. Components are therefore not
limited to one set of breach conditions - multiple sets can be built in an OR relationship with
one another.
Breach conditions connectfilterstogetherin logical sequences. Eachfilterhas an alphabetical
reference which corresponds to a ‘bubble’ in the conditions. When a bubble is clicked on, it
becomes highlighted and is now a required condition for the component to breach.
Multiple required components should be thought of in an ‘AND’ relationship.
Worked Example
Filter Logic
When more than one filter is defined for a component, the Breach Conditions section will
appear - this is where the relationship between filters is defined.
DEFINING MODEL COMPONENT BREACH CONDITIONS](https://image.slidesharecdn.com/darktracethreatvisualizeruserguide-231011215555-7bca9746/85/Darktrace_Threat_Visualizer_User_Guide-pdf-170-320.jpg)
![171
Metric: [External Data Transfer] [] [100 MB] in [60 Minutes]
Filters:
A - [Day of the Week] [is] [Sunday]
B - [Proxied Connection] [is] [False]
C - [Tagged Internal Source] [does not have tag] [Admin]
Breach Conditions:
A B
B C
Here, the same filters are in use, but component can breach in two different scenarios - either
A and B are satisfied, or B and C are satisfied. In this case, the component would breach when
any device transfers more than 100mb externally within an hour on a Sunday without using a
proxy, OR if a non-admin device transfers more than 100mb externally within an hour on any
daywithout using a proxy.
At the end of each breach condition, the logic is summarized for review. These conditions can
be chained together to create complex and carefully targeted model components.
“Always Required”
Some filters are very restrictive, such as connection direction or restrictions on IPs, and
therefore must be applied across all breach condition lines regardless. These filters have blue
‘bubbles’ and will display “Always Required” in the tooltip on hover.
Adding Display Fields
The final step of defining a component is selecting display fields. Display fields control the at-
a-glance information displayed to the userwhen a breach is triggered bythe component, they
do not impact the logic of the model itself. Display fields should include the most important
information an analyst would need to triage a model breach.
For example, in a connection-based model an analyst would need to knowthe IP, protocol and
port involved in the breach event. In a SaaS model, it would be useful to know the resource
(like file or cloud infrastructure element) involved in the activity or the ASN of the source IP to
identify the geographic location.
In the componentyou areworking on, expand the Display Fields headerand click ‘+ Add Field’.
The default display field for the main component metric will be added. For example, for the
“Connections” metric, the default displayfield is “Connection Hostname”. To choose a different
field, click on the name and a selection of relevant filters will appear in the dropdown.
Worked Example](https://image.slidesharecdn.com/darktracethreatvisualizeruserguide-231011215555-7bca9746/85/Darktrace_Threat_Visualizer_User_Guide-pdf-171-320.jpg)


![217
Please refer to Darktrace RESPOND/Network Quick
Setup Process - Deployment Options and Darktrace
RESPOND/Network Deployment Scenarios for
informationonhowtoapplyaDarktrace-recommended
default for Darktrace RESPOND/Network tags.
Eligibility in Custom Models
Default Darktrace RESPOND/Network Models will only
takeactionagainstondeviceswithoneoftheDarktrace
RESPOND/Network tags applied. For custom models
with Darktrace RESPOND responses enabled, it is
recommended that the model excludes devices
without the appropriate tags. This can be achieved
with the following logic, modified as appropriate forthe
model target:
Tagged [Internal Source/Internal
Destination] Has Tag [Antigena All/
Antigena Compliance/etc]
By default, no devices are tagged and therefore no devices are eligible for Darktrace
RESPOND/Network coverage. Tags can be applied manually, can be applied through the
Device Admin page (see Modifying Devices in Device Admin), through an API integration (see
/tags/entities), or through the recommended route - the Darktrace RESPOND/Network
Quick Setup Process.
Darktrace RESPOND/Network takes action against network-borne threats with connection-
level blocks; there are four high-level categories of activity that Darktrace RESPOND/Network
will target with these actions. Devices must be opted into Darktrace RESPOND/Network
responses, either on a per-category or global basis.
The types of activity Darktrace RESPOND/Network will take action against are grouped into
four categories: “Compliance”, “External Threat”, “Insider Threat” and “Significant Anomaly”.
Each category contains Darktrace RESPOND/Network models which target specific activity
within that category. For example, the Compliance category contains a model which targets
the use of generative AI tools, while the External Threat category contains models which
detect ransomware and cryptomining activity.
When a device performs activitywhich meets the criteria ofa model in one ofthese categories,
Darktrace RESPONDwill check if it has a tagwhich corresponds to the activitycategorybefore
proceeding to take an action. This is tag-based eligibility.
Please note, Darktrace RESPOND was previously known as “Antigena”. This terminology is
preserved in many places for the purposes of ensuring continuity.
Darktrace RESPOND/Network tags
There are five Darktrace RESPOND/Network tags, corresponding to the model categories:
• Antigena Compliance
• Antigena External Threat
• Antigena Insider Threat
• Antigena Significant Anomaly
• Antigena All
When a device is given the Antigena Compliance tag, for example, it becomes eligible to
receive Darktrace RESPOND/Network responses triggered by models in the Compliance
category. The final tag - Antigena All - makes the device eligible for responses from all
categories.
DARKTRACE RESPOND/NETWORK TAGS](https://image.slidesharecdn.com/darktracethreatvisualizeruserguide-231011215555-7bca9746/85/Darktrace_Threat_Visualizer_User_Guide-pdf-217-320.jpg)


Ad
More Related Content
What's hot (20)
Similar to Darktrace_Threat_Visualizer_User_Guide.pdf (20)


Ad
Recently uploaded (20)


Ad
Darktrace_Threat_Visualizer_User_Guide.pdf
- 1. DARKTRACE THREAT VISUALIZER 6.1 USER GUIDE
- 2. CONTENTS CYBER AI ANALYST 31 AI ANALYST INCIDENTS AI ANALYST INVESTIGATIONS OTHER INVESTIGATION TOOLS 71 EXTERNAL SITES SUMMARY ALTERNATIVE APPROACHES APPLYING TAGS EXPLORE REPORTING THREAT VISUALIZER BASICS 5 THE THREAT VISUALIZER USING THE WORKSPACE THE THREAT TRAY INVESTIGATING A DEVICE 42 FOCUS ON A DEVICE DEVICE EVENT LOGS OTHER INVESTIGATION METHODS DARKTRACE MODEL BREACHES 59 MODEL BREACH ALERTS MODEL BREACH LOGS PLATFORM ACCOUNTS CONSOLE 90 GETTING STARTED THE DASHBOARD MODEL BREACHES CYBER AI ANALYST PROFILES OTHER FEATURES ADVANCED SEARCH AND INTEL 137 ADVANCED SEARCH THREAT INTEL
- 3. CONTENTS DARKTRACE RESPOND 188 DARKTRACE RESPOND ACTIONS DARKTRACE RESPOND MODELS DARKTRACE RESPOND STATE DARKTRACE RESPOND/APPS, RESPOND/CLOUD AND RESPOND/ZERO TRUST DARKTRACE RESPOND/NETWORK MODEL EDITOR 152 USING THE MODEL EDITOR UNDERSTANDING A MODEL MAKING A NEW MODEL ADMIN INTERFACES 175 DEVICE SUBNET ADMIN PERMISSIONS ADMIN SYSTEM STATUS THE MOBILE APP 225 GETTING STARTED CYBER AI ANALYST DEVICES AND MODELS DARKTRACE RESPOND DARKTRACE/EMAIL OTHER VIEWS AND SETTINGS
- 4. 4 Darktrace’s Threat Visualizer is a powerful tool for intuitive visual storytelling alongside rich data that can be used to identify and investigate potential emerging threats as they develop. This document is intended to help Darktrace users get the best possible results from the Threat Visualizer. Darktrace Threat Visualizer Next generation threat detection is about more than simply finding what you can conceive of in advance – it is about implicitly understanding what you, as a security professional, need to know about. Darktrace’s threat detection capability uses a self-learning approach. Instead of trying to pre- define what ‘bad’ looks like, Darktrace builds an evolving understanding of an organization’s ‘pattern of life’ (or ‘self’), spotting very subtle changes in behaviors, as they occur to enable rapid investigation and response to in-progress attacks. INTRODUCTION
- 5. CHAPTER 1 - SUGGESTED WORKFLOWS FOR INVESTIGATING AN ALERT 6 LOGGING INTO THE THREAT VISUALIZER FOR THE FIRST TIME 8 INTRODUCING THE THREAT VISUALIZER WORKSPACE 9 MAIN MENU GUIDE 10 UNDERSTANDING THE SUMMARY PANEL 15 ADVANCED SUMMARY PANEL INFO 17 VIEWING THE NETWORK 19 EXPANDING A SUBNET 20 OTHER SUBNET VIEW FEATURES 22 USING THE OMNISEARCH BAR 23 CHANGING THE TIME 24 THE THREAT TRAY 25 FILTERING ALERTS WITH BEHAVIOR CATEGORIES 27 FILTERING ALERTS WITH BASIC FILTERS 28 FILTERING ALERTS WITH ADVANCED FILTERS 29 THE THREAT VISUALIZER USING THE WORKSPACE THE THREAT TRAY THREAT VISUALIZER BASICS
- 6. 6 Suggested Workflow from a Cyber AI Analyst Incident Cyber AI Analyst will review and investigate all Model Breaches that occur on the system as a starting point for its analysis process. It will then form incidents - a collection of one or more related events - centered around a device. Incidents involving multiple devices will be classified as ‘cross-network’. The CyberAIAnalyst,with its global network awareness and machine-speed investigation time, performs the heavy-lifting of the analysis process. 1. Log into the Threat Visualizer and click the Cyber AI Analyst icon in the Threat Tray or open the AI Analyst tab on the Darktrace mobile app. Review the incidents it has created. 2. Selectthemostsevereincidentorthemostinterestingtoyoubasedonyourknowledge ofthe business and network setup. Reviewthe summary created byCyberAI Analyst to quickly understand what each incident may involve. 3. Review the summary of each event within the incident and understand how the events relate chronologically using the activity-over-time visualization. On the mobile app, read the incident overview and swipe between the events. 4. Scan the detailed event information to gauge the involved connections and reviewthe related anomalies. Confirm if AI Analyst is currently processing any further breaches for the device. Optionally check the attack stages that AI Analyst has derived for each event. 5. If the activity of interest relates directly to a model breach, investigate the breach log. 6. Check the Actions section to see if Darktrace RESPOND/Network blocked the associated activity. Follow up the suggestions made by AI Analyst to resolve the incident. 7. Optionally create a PDF report describing the events. 8. Acknowledge each event as the investigation is concluded or acknowledge the entire incident if resolved. Where to Start Exploring behaviorcan be useful forimproving the understanding ofwhat is trulyhappening in the digital business and how it is all interconnected. There are five primaryways in which analyst teams can begin seeing and reacting to identified alerts or incidents produced by Darktrace 1. The Cyber AI Analyst automatically analyzes, investigates and triages all model breaches on your network. The incidents it creates give a concise summary and actionable steps to investigate any detected threats further. 2. A “threat tray” is shown at the bottom of the 3D Threat Visualizer interface in most screens and will be displayed on login. The 3D Threat Visualizer enables deep investigation of behaviors. 3. A Dynamic Threat Dashboard triage screen (accessible from the menu at top left of the home screen). This screen is intended for extremely rapid triage with a minimum of interaction. Note that it will scroll through incidents if left unattended which can be useful on SOC TV display screens. 4. A simplified SOC dashboard triage screen is available via the Darktrace mobile app. 5. Automated alerts may be exported into SIEMs orvia API to other SOC systems and will include a link back to the incident data in the Threat Visualizer. Organizations with a Darktrace/Apps, Darktrace/Cloud or Darktrace/Zero Trust module can utilize the Platform Accounts Console (formerly SaaS Console) for triage and analysis. This specialized interface is focused on the investigation of incidents within SaaS and Cloud environments. For more information, please see Getting Started with the Platform Accounts Console. SUGGESTED WORKFLOWS FOR INVESTIGATING AN ALERT
- 7. 7 8. Check whether similar devices are behaving in a similar way (via similar devices in device summary). 9. If appropriate, create and review raw packets (pcap) for interesting connections. 10. Consider using third-party resources for context regarding a suspicious domain, IP address or file. Suggested Workflow from a Model Breach When investigating an alert, a typical workflow will involve starting with summary information. This is shown by default in the Dynamic Threat Dashboard or can be seen by clicking the eye icon. The analyst is not swampedwith too much to dealwith all at once – enablingyou to triage quicklywhether the anomaly is worthy of further review. You canthenvisuallyplaybackthe behaviorand event information, drilling down into increasing levels of detail, and broadening the investigation to correlate for related behaviors across the network at each stage of the investigation. As an example: 1. Log into the ThreatVisualizerand eitheraccess the Dynamic Threat Dashboard, orfilter the threat tray to include a manageable number of Model Breaches using the severity slider and adjusting the time period for which to display model breaches i.e. last 24 hours. 2. Investigate the alerts that seem most interesting to you based on your knowledge of the business and network setup. Regardless of how anomalous the activity is, if you are more interested in malware infections than data exfiltration, then looking at a ‘beaconing’ Model Breach first might be more relevant than looking at an ‘unusual data transfer’ Model Breach. 3. Identifywhat type of device this is and how it normally behaves. 4. Look at which events contributed to the breach. 5. Look at whether the device has related anomalies at the time or previously. 6. See exactly how anomalous this activity was or plot against related activities to spot any other anomalies or to display how important Darktrace considers that particular anomaly (overlay additional metrics including importance metrics in the graph). 7. Considerreplaying the events to betterunderstand the context ofwhatwas happening. If in the dynamic threat dashboard, click on the displayed 3D Threat Visualizer widget. Once in the 3D View, open up the device event log at the top left and press the play button on the timeline at top right.
- 8. 8 The Threat Visualizer interface, powered by Darktrace’s self-learning technology, continuously assessesthebehaviorofdevicesandusersacrossthewiderdigitalestate.Activityfromremote endpoint devices, servers located in local datacenters, serverless architecture in public cloud environments or users working in third-party SaaS services is surfaced side-by-side. Anomalous interactions and activity are highlighted to the end-user and prioritized for investigation by Darktrace’s Cyber AI Analyst. Many operators start with these high-level investigations and then analyze detailed metadata and device or user activity in specialized interfaces. The Threat Visualizer interface is flexible and accommodates a number of workflows and threat-investigation processes. TheThreatVisualizerinterfacecanbeaccessedfromabrowserbynavigatingtotheIP(physical instance only) or hostname (e.g., https://[region]-XXXX-01.cloud.darktrace. com) of the instance. The login screen will be displayed. The minimum supported browsers to access the Darktrace Threat Visualizer application are Chrome 85, Firefox 81, Safari 14. Enteryour username and password to log in. The password can be reset at any time from the Permissions Admin page of the interface if required. If you are accessing the Threat Visualizer via your organization’s SSO system, click the Log in via SSO button, and log in to your SSO system as standard. You will then be redirected to the Threat Visualizer after a successful login. For cloud based instances of the Threat Visualizer, or environments where 2FA has been enabled by an administrator, a QR code will be displayed on first access. Please scan this QR codewithyourpreferred multi-factorauthentication app such as GoogleAuthenticatororDuo Security. Afteryouhaveloggedin,theThreatVisualizerhomescreenwillbedisplayed.Thedefaultlanding page can be altered from Account Settings, or your administrator may have configured it for you already. The available options are: Threat Visualizer (default), Dynamic Threat Dashboard, Email Console, Platform Accounts Console, and System Status Page. Please note, five consecutive failed login attempts will result in the account being locked for five minutes. Subsequent failed attempts will increase the lockout time. LOGGING INTO THE THREAT VISUALIZER FOR THE FIRST TIME
- 9. 9 • In the top right is the time selector. The chosen time is used as a starting point for replaying visualizations of connections and event logs will display events backwards from this time. Changing the time is covered in more detail in Changing the Time. • On the left of the workspace is the summary. The summary provides key statistics about events, bandwidth, devices and AI Analyst investigations. Each element of the summary is described in Understanding the Summary Panel and Advanced Summary Panel Info. • The main workspace displays an overview of your network. The default shows a visualization of subnets in your network on a world map. This is covered in more detail in Viewing the Network. • Finally, at the bottom of the workspace, is the threat tray which displays alerts from Darktrace analysis. The threat tray is explained over a series of articles - starting with The Threat Tray is recommended. After logging in, the Threat Visualizer home screen will be displayed. The main workspace is used to visualize devices and connectivity, to open investigation windows and event logs, and to view alerts from Darktrace anomaly detection. In the top left are two icons: ICON DESCRIPTION home Home Clear any focused devices orwindows and return to the main workspace bars Main Menu Access a list of key investigation, configuration and administration interfaces. A full, detailed list of menu items is available in Main Menu Guide. INTRODUCING THE THREAT VISUALIZER WORKSPACE Other key elements of the workspace are always displayed: • The omnisearch bar can be used to search across devices, users, subnets, and external endpoints observed by Darktrace. The omnisearch bar is covered in more detail in Using the Omnisearch Bar.
- 10. 10 search-plus Advanced Search Opens a new browsertab to Darktrace advanced search. Referto Darktrace Advanced Search for more information. tags Tags The ThreatVisualizersupports a flexible label system called Tags to allowanalysts to be able to rapidly label and refer to groups of devices within the platform. One use case for this feature is to enable monitoring of high-risk users or devices such as departing employees or key assets. Refer to Adding and Reviewing Tags for more information. arrow-circle-down Packet Capture Clicktoviewthe list ofPCAPfilesyou have createdwhich are stored onthe Darktrace appliance. Refer to Creating Packet Captures for more information. a Darktrace RESPOND Actions Presents currently active and expired actions taken by Darktrace RESPOND components (excludes Darktrace/Email) and allows the actions schedule to be configured. Current and historic actions can be exported as a CSV. Refer to Reviewing Darktrace RESPOND Actions for more information. Requires an active Darktrace RESPOND license. dt-respond-network Darktrace RESPOND/Network Quick Setup Process The Darktrace RESPOND/Network Quick Setup Process is a deployment assistant for Darktrace RESPOND/Network - choose a Darktrace recommended “One-Click Setup”, or dive into granular configuration to tailor Darktrace RESPOND to your exact use case. Contains the Darktrace RESPOND/Network Summary, Darktrace RESPOND/Network Quick Setup Process and Darktrace RESPOND/Network Spot Tester (technical preview). Requires an active Darktrace RESPOND/Network license. envelope Email Console Pivots to the Darktrace/Email interface for investigation and autonomous actions on your email domains. Please see the documentation on Darktrace/Email for more information. cloud Platform Accounts Console The Platform Accounts Console (formerly SaaS Console) is a specialized user interface for investigatinganomalousactivityanduserbehaviorinandacrossSaaSandCloudenvironments, surfacing the events and analysis from Darktrace/Apps, Darktrace/Cloud and Darktrace/Zero Trust modules in one centralized location. Please see The PlatformAccounts Console formore information. The Darktrace Main Menu offers an instant way to get to the main features within the UI. Clicking on the menu icon in the top left will display all available options. These will change depending on the user and the permissions granted to them. MAIN MENU GUIDE
- 11. 11 exclamation-triangle Models Model Editor A Model is used to define a set of conditions which, when met, will alert the system to the occurrence of a particular event. Refer to The Model Editor for more information. list Model Summary List ofthe modelswith analysis ofhowmanytimes and howstronglyeach model has breached since the appliance was installed. sync-alt Model Updates This page allows you to view recent updates to the models. Refer to Model Updates or the Darktrace System Administration Guide for more information. book Reporting analytics Cyber AI Insights Report Cyber AI Insights reports provide an overview of your organization’s current Darktrace coverage, key statistics on threat trends across deployed components, data on response times by Darktrace RESPOND and analyst engagement. Refer to CyberAI Insights Reports for more information. newspaper Executive Threat Report Executive Threat reports are high level, visual overviews of network activity and model breach events. Refer to Executive Threat Reports for more information. download Download Reports This page allows Threat Intelligence reports and both manually generated and scheduled Executive Threat Reports to be retrieved. dt-asm-icon Darktrace PREVENT/ASM Darktrace PREVENT/Attack Surface Management (ASM) provides continuous, tailored detection of externally exposed assets and potentially malicious domain impersonation for organizations. This option allows users with the appropriate permissions to pivot to the ASM interface; please see the Darktrace PREVENT/ASM user guide available from the Customer Portal for more information. dt-e2e-icon Darktrace PREVENT/E2E Darktrace PREVENT/End-to-End (E2E) supports your organization’s security team by modeling attack paths in real time. With a unique, AI-powered view across your digital estate, Darktrace PREVENT/E2E provides continual insight to reduce risk, remediate vulnerabilities and defend the network’s most critical assets. Please see the Darktrace PREVENT/E2E user guide, starting with Introduction to PREVENT/E2E, for more information. c AI Analyst c Launch Investigation Manually trigger a new AI Analyst investigation on a device or SaaS user. See Triggered AI Analyst Investigations for more information. list View Investigations Opens a list of current and previous AI Analyst triggered investigations.
- 12. 12 user Permissions Admin The Permissions Admin interface allows user permissions and data visibility to be controlled at an individual and group level. Group permissions for LDAP and SSO users can also be configured. For detailed information on users, groups, permissions and data visibility, please refer to Permissions Admin. This interface has replaced the legacy User Admin and Group Admin interfaces. unlock-alt Permissions This interface has been superseded by Permissions Admin. plug Utilities Ü Punycode Convertor Enter text in the top window to convert to Punycode; enter Punycode in the bottom window to convert to text. Punycode is used in DNS to encode Unicode international domain names (IDN) into ASCII. Can be identified as it always starts ‘xn—’“. (.*) RegEx Tester Entera RegEx in the top barand an example string to test it in bottom bar. Ifthe string matches the RegEx the bottom box’s border turns green; otherwise it remains white/yellow. 64 Base64 Convertor Enter text to be decoded or encoded using Base64. js JS Beautifier Tool for ‘beautifying’ JavaScript to increase readability wrench Admin desktop Device Admin This page contains a list of basic information regarding every internal device Darktrace has ever observed. The list is exportable to Excel and some fields can be altered (e.g., type of device). Refer to Device Admin for more information. cubes Subnet Admin Similar functionality but applies to subnets. The DHCP slider shows whether Darktrace should be seeing DHCPfor that specific subnet. Refer to Subnet Admin for more information. id-card Audit Log This page shows recent interactions with the platform and physical appliance console completed by users (e.g., acknowledging breaches, logging in and out). tachometer-fast System Status The System Status page contains detailed information about the health and scope of your Darktrace deployment. Here, metrics on hardware utilization, throughput, software bundle versions, component health, and modeled devices can be monitored. cog System Config Provides all configuration settings for the Darktrace Threat Visualizer application including Darktrace RESPOND settings and authentication for DETECT modules and integrations. Alerting options can be configured here. Please note, access to the legacy config page via this interface has been removed as of Darktrace 6.1.
- 13. 13 random Intel check Trusted Domains Trusted domains are endpoints which Darktrace will consider as 0% rare; this feature ensures that models relying on domain rarity will not fire for activities involving common domains - a default, editable list is provided. See Trusted Domains for more details. eye Watched Domains Watched domains are endpoints which trigger automatic model breaches if observed in connectivity.The list is not populated bydefault but maybe added to byTAXII feeds, Darktrace Inoculation, via the Threat Visualizer API or by manual edits. See Watched Domains for more details. cog TAXII Config Permits the ingestion of internal or third-party TAXII feeds and STIX files. The last 10,000 observables ingested can be reviewed, whether derived from stand-alone files, subscribed TAXII collections or Darktrace Inoculation. See TAXII Config for more details. bolt Dynamic Threat Dashboard (legacy) The Dynamic Threat Dashboard provides an left-to-right dashboard to investigate an incident down to the connections that caused the alert to fire. Refer to Dynamic Threat Dashboard for more information. Please note, this page is now deprecated in 6.1 and will no longer be available by default on deployments created on or after this release. clock Epoch Converter Converts epoch time in seconds since 1st Jan 1970 (as seen in advanced search) to normal time. map Explore cube Explore Subnets Explore Mode for subnets gives an overview of all connection events between subnets at a given time interval, filterable by connection size and transfer ratio. Drill-down to a device- to-device level is also possible. A master layout can be defined to reflect existing network topology diagrams. tag Explore Tags Explore Mode fortags gives an overviewof all connection events between Tags at a given time interval, filterable by connection size and transfer ratio. Drill-down to a device-to-device level is also possible. A master layout can be defined to reflect existing network topology diagrams. question Help mobile-button Mobile App Setup Help This option displays the steps needed to authorize the Darktrace Mobile App from the Threat Visualizer. It will only appearto users with permission to registerthe app, and is also accessible from the app registration pop-up within Account Settings.
- 14. 14 dts-user-question Ask the Expert Ask the Expert allows for the creation of incidents which can be submitted to Darktrace analysts for feedback. Refer to Ask the Expert for more information. question-circle View Questions Aftera request has been generated,youwill be able toviewyouropen and closed questions by clicking View Questions; this window will show the conversation and any relevant information, as well as the ability to reopen or delete an historic request. file-code API Help Provides a link to the Threat Visualizer API documentation hosted on the Darktrace Customer Portal. cogs Account Settings Change settingsforyourown account including default color-coding inthe event log, enabling accessibility mode, selecting the AI Analyst language, changing the default landing page and threat tray behavior category filters. dt-icon-template Customer Portal Opens the Darktrace Customer Portal in a new browser window or tab. The Customer Portal provides access to all product documentation, support tickets, analyst insights and Darktrace Education materials. sign-out-alt Logout Log out the current user account.
- 15. 15 MITRE ATTCK Tactics Processed The MITREATTCKFrameworkis used bySOCanalysts, threat intel experts and enterprise security teams to classifythe“what”,“why”and“how”ofcyberthreats;the framework is integral to many organizational playbooks on vulnerability mitigation and incident response. MITRE tactics are used to model the “why” - what a potential malicious actor intends to achieve through their behavior. The Darktrace DETECT platform supports the integration of this framework through the categorization of Darktrace AI Analyst events and Darktrace models. MITRE ATTCK Tactics Processed visualizes how raw activity connected to each tactic has passed through Darktrace AI-powered analysis over the last 28 days, distilling thousands of events into just key behavioral alerts. Every second, Darktrace observes thousands of raw datapoints - whether passive network traffic processed by Darktrace Deep Packet Inspection, metadata from Darktrace/Endpoint agents and virtual sensors, streams and signals from telemetry modules and contextual threat intelligence integrations, or user activity data observed Darktrace/Apps, Darktrace/ Cloud and Darktrace/Zero Trust modules. Each pattern is analyzed; is this unusual? Does this fit the pattern of life for the device or its peers? Is this behavior of interest? “Events” represents a subset of all these patterns - the total number of raw events that were passed to Darktrace modeling for further investigation over the last 28 days. The Darktrace model engine is an evaluation layer; the models framework leverages the underlying ‘pattern of life’ detection, combining intelligent outputs from Darktrace Self Learning AI with the expertise of the specialized Darktrace analyst team. From the raw events it receives, a small fraction reach the criteria to trigger a “model breach”. The total number of these model breaches generated over the last 28 days is displayed. The Darktrace AI Analyst investigates, analyzes and triages threats seen within your Darktrace environment. Bylearning from the millions of interactions between Darktrace’s expert analysts and Darktrace DETECT components, the AI Analyst combines human expertise with the consistency, speed, and scalability of AI. Every time the conditions for a model are met and a model breach is created, the Darktrace AI Analyst investigates the activity and concludes whether it needs to be surfaced for human analysts to review. “Incidents” represents the total created from this AI-powered investigations into anomalies across your digital environment in the last 28 days. Finally, behavior categories are high level filters that allow an operator to focus in on specific levels of severity or behavior. There are four categories: Critical, Suspicious, Compliance and Informational. Categories are used across both AI Analyst and Darktrace models. “Critical Incidents” therefore, are incidents created by AI Analyst analysis that have been allocated the highest prioritybehaviorcategory. Clickthis element to open anAIAnalyst incident log filtered on all AI Analyst incidents rated Critical. Referto CyberAI Analyst Incident Logs for more information on howto understand AI Analyst incident logs launched from this panel. Key statistics about your Darktrace environment can be accessed from the summary panel on the left of the Threat Visualizerworkspace. By default it is collapsed. Each icon can be hovered for basic statistics or the whole panel can be expanded for detailed information. Darktrace Analysis UNDERSTANDING THE SUMMARY PANEL
- 16. 16 As above, these AI-powered incidents can be further distilled down to just those ofthe highest priority - “Critical Incidents”. Click to open an AI Analyst incident log filtered on AI Analyst incidents with events relevant to the chosen tactic. Refer to Opening the Model Breach Log and Cyber AI Analyst Incident Logs respectively for more information on how to understand the Model Breach logs and AI Analyst incident logs launched from this panel. Incidents vs Model Breaches Sometimes there may no relevant model breaches, but AI Analyst incident has still identified activity of interest that is linked to the tactic. Although a model breach may be the trigger for an investigation, that does not mean the activity AI Analyst surfaces is directly related to the original model breach. Like a human, the Cyber AI Analyst uses a model breach as a starting point to investigate the device. The behavioral analysis it performs may discover anomalies or patterns of activity that were not the original trigger point for the model breach but are worthy of investigation. Therefore, AI Analyst may sometimes uncover and report events relevant to a tactic from an investigation triggered from an unrelated model breach, ora model associatedwith a different tactic. For each tactic, the number of events that were relevant to the type of activity the tactic encompasses - and therefore were evaluated by the Darktrace model engine - are displayed. Tactics are not mutually exclusive; the same activity may be relevant to, and been evaluated for, multiple tactics. From these evaluated events, some reach the criteria necessary to trigger a model breach. The Threat Visualizer platform provides a curated set of default models as standard, designed and constantly tuned in parallel with the evolving threat landscape; default models are mapped to relevant MITRE ATTCK Framework techniques and tactics. For each tactic, the number of model breaches triggered for mapped models is shown. Click to open a breach log filtered on model breaches for the chosen tactic. For Darktrace Threat Visualizer 6, all AI Analyst incident event types have also been mapped to one or more MITRE ATTCK Framework tactics. Each incident is comprised of events which detail a specific anomalous activity - or chain of activities - investigated by AI Analyst. Where an incident comprises one or more events with activity relevant to the tactic, it is counted here. Click to open an AI Analyst incident log filtered on these relevant incidents for the chosen tactic.
- 17. 17 This overview summarizes across all possible factors, configurations,andsettingstogiveatruerepresentation of how autonomously Darktrace RESPOND can act at each point of the day. Most Darktrace operators will settle on a Partially Autonomous configuration, tailored to their needs. When collapsed, the element will indicate the overall autonomylevel - forexample, dt-partially-auto PartiallyAutonomous - and how long this state is applicable for. The next state - and when it will be applicable - is shown below. This element can be expanded further for more detailed understanding of the contributing factors to the current RESPOND state. These factors, and how to understand each element of the expanded summary, is discussed in more detail in the specific guide - Understanding the RESPOND State using the Threat Visualizer Summary Pane. There are four states that Darktrace RESPOND can be in: • Human Confirmation - all Darktrace RESPOND actionswill require human approval, regardless of the type of activity detected. • Partially Autonomous - some Darktrace RESPOND actions will require human approval, others will proceed automatically. • Fully Autonomous - all Darktrace RESPOND actions will be taken autonomously. • No Actions Scheduled - Darktrace RESPOND is disabled and will not take any action. As Darktrace RESPOND allows fora significant amount of granularity in configuration, there are a number of factors that can govern how autonomous Darktrace RESPOND is. Many organizations proceed with the Darktrace-recommended configuration during first deployment of a Darktrace RESPOND component, then introduce more customization as they become more familiar with Darktrace RESPOND, aligning it to their organizational policies and risk appetite. ADVANCED SUMMARY PANEL INFO Summary Pane Additional sections display information about the number of patterns of life and modeled entities in your environment. Darktrace RESPOND Where Darktrace RESPOND is enabled in the environment, the summary pane will contain a high-level overviewof howautonomouslyDarktrace RESPOND can act at the current moment. Statistics on the number of actions taken and devices actioned will also be displayed.
- 18. 18 AI Analyst Investigations AI Analyst investigates anomalies detected by the Darktrace system at machine speed and surfaces only those that need human attention. The summary displays the equivalent number of hours it would take a human analyst to perform the same investigations. Darktrace DETECT Darktrace creates an overall pattern of life for every entity it sees - whether endpoint devices, users interacting with resources in external platforms, or servers within the internal network. Networks are alive with constant activity and repeated patterns; Darktrace’s self learning AI observes these patterns and derives a sense of “normal” behavior for devices, users and peer groups. Each pattern of life for a device or a peer group is itself built from of thousands of fragmentary patterns of life - a unique connection, event or activity that contributes totheoverallunderstandingofyourdigitalenvironment. The number of patterns of life is not expected to match the number of modelled entities such as devices or users. Device counts display the number of entities - users detected in external platforms (SaaS users), devices, credentials - that Darktrace has observed and is actively modelling a pattern of life for. These counts will change as new devices appear and inactive devices are no longerseen. Statistics are calculated over7days, 28 days or12 weeks. Other Summary Elements Total Bandwidth Processed Thetotalbandwidthprocessedoverthelast28daysisdisplayedforbothnetworkandendpoint data; each bar can be hovered for a breakdown between the two input sources. Processed bandwidth is not equivalent to ingested bandwidth - some ingested connections may not be processed due to configuration settings such as exclusion rules.
- 19. 19 Individual Subnets The main workspace is used to visualizer connections and devices in 3D in real time. The default view is a simplified subnet view. VIEWING THE NETWORK Workspace TheThreatVisualizerhomepagedisplaysanoverviewofyournetwork.Eachsubnetisdisplayed as a “cube” icon. Hovering over a subnet icon will show the label or equivalent subnet range, if no label has been provided. Where many subnets are located in close geographic proximity, these are collapsed into a single cube. The list of collapsed ranges is shown on hover. For devices monitored by Darktrace DETECT RESPOND/Endpoint agents, subnets are automatically created and grouped by the country that the devices are located in. Subnets created directly from network traffic can be relocated geographically by providing a latitude and longitude on the Subnet Admin page. Across the top of the workspace are special- purpose subnets for internal (unmodeled) traffic, internal multicast and broadcast traffic. These subnets cannot be moved. The color of the subnet cube can be used to quickly gauge the level of anomaly: • A green icon indicates at least one device in the subnet has been subject to a Darktrace RESPOND action. • An icon from yellow to red indicates at least one device in the subnet has been subject to a model breach, with the color representing severity. Where many subnets are collapsed into one icon, the icon will show the highest anomaly level of the underlying subnets. Clicking once on an icon will center the workspace; when centered, hovering over the icon will give more detailed information on device membership. Clicking again will open a detailed view of the subnet.
- 20. 20 If the device was subject to a Darktrace RESPOND action during the visualization, a green line will appear around it for the duration of the action. If the device currently has pending Darktrace RESPOND actions, an orange line will appear around the visualization. Hover over a node to display a summary tooltip. The summary includes device details like the device’s IPorhostname, devicetype, current subnet, anyappliedtags oranyrecentlyobserved credentials. Hovering over devices will also show whether they are currently controlled or pending control by Darktrace RESPOND actions, and provide the option to trigger a manual Darktrace RESPOND action against the device. See Manual Darktrace RESPOND Actions for more information on triggering these actions. Click the device to change the focus to the device. Focusing on a Subnet Click on any cube on the main workspace to focus on a specific subnet. The visualization will switch to subnet mode. To return to the full network visualization, click the small cube at the top left of all connecting cubes, or click the home-lg home button. Visualization The main workspace now shows a visualization of network devices in the subnet connecting to internal and to external locations in real time. SaaS devices are not visualized by subnet view. Devices Glowing nodes are devices with active connections at the time chosen in the top right. When the visualization is unpaused, nodes will appear and disappear as connections start and finish. Nodes which are colored from yellow to red are devices displaying anomalous behavior. EXPANDING A SUBNET
- 21. 21 Connectivity Blue lines represent active connections transferring data. Devices may connect to internal locations, to external locations or connect to one anotherwithin the subnet. Internal subnets are represented by cubes on the left of the visualization. Hover over these cubes to see the subnet they represent or click to change the focus to the alternate subnet. Pseudo-subnets are created for devices monitored by Darktrace DETECT RESPOND/ Endpoint agents, grouped by the devices’ geographic location. As agents monitor devices in remote networks, inter-subnet connectivity will not be displayed. Nodes for these devices will always be displayed connecting to external locations. Aboundaryontherightofthevisualizationrepresentstheborderbetweeninternalandexternal locations. External connections from devices in the subnet are shown passing through this boundary.
- 22. 22 Subnet Statistics On the right of the workspace is a panel with statistics about the subnets’ connectivity over the time window chosen in the selector. The time window - default 5 minutes - is shown below the timezone. The panel includes the most-used protocols and the largest data flows to other internal subnets and the wider internet. Each section of the panel can be collapsed by clicking the heading. The network statistics panel is useful, for example, to quickly identify devices causing the highest inbound data transferin the subnet orto checkforthe presence of prohibited protocols. Filters applied to the panel also impact the mainworkspace, allowingvisualization to be restricted to certain protocols (e.g. UDP) or to certain external endpoints. Click a key on the left of the panel to apply it as a filter. The free-text search can also be applied to any key, allowing specific protocols or endpoints to be located for filtering. Multiple filters can be applied and will appear above the panel. Filters applied on this panel will impact other windows and event logs. OTHER SUBNET VIEW FEATURES Subnet Options The network range that represents the subnet is populated in the omnisearch bar. Beside the subnet range are a selection of icons. ICON DESCRIPTION link Explore subnet connectivity Explore is an alternative interface for investigating subnet-subnet connectivity. Th Explore interface focused on the chosen subnet. Explore subnets is covered in mo Mode. chart-line Open subnet graph The graph allows metrics of device behavior to be plotted over time. In subnet mo for all devices in the subnet. The graph is described in more detail in Other Device the context of individual devices but is also applicable to subnet mode. exclamation-triangle View Breaches This icon opens the model breach log - a list of model breaches triggered by all de The default timeframe is 7 days but can be altered. Breach logs in general are cove Opening the Model Breach Log. pencil Edit Subnet Info Edit provides quick access to change the subnet label, geographic location and tr information can also be changed in bulk in the Subnet Admin interface. search Devices on this subnet Clicking this icon will trigger an omnisearch query for all devices in the subnet, not visualized on the workspace. Scroll to browse or click to change the focus to a spe information about omnisearch queries is also available in Using the Omnisearch B
- 23. 23 The omnisearch bar is another way to focus on subnets, devices, models and specific connections or events. The search autocompletes and suggests the most relevant search results. USING THE OMNISEARCH BAR For devices, it is possible to search by label, mac address, IP and hostname. When searching for devices, a list of suggested devices will be displayed along with their derived device type and simple information such as IP, hostname, MAC address (where available). If network devices are subject to a Darktrace RESPOND action at the current time, the omnisearch entry will appear shaded green. Users - credentials Darktrace has observed being used by a device - can also be returned. The devices currently associated with the userwill appear as an indented list underneath their entry. To focus on a device, subnet or connection - click the entry. The options for each result can be clicked without changing the workspace focus. This means event logs and summaries can be opened within focusing the view completely on the device. There are many types of information that can be returned by an omnisearch query: EXAMPLE RESULT TYPE ACTIONS laptop ws183.holdingsinc.com · 10.15.15.2 Device For device results, the device options described in Device Investigation Options are also accessible from the omnisearch bar. cubes 10.15.15.0/24 Subnet Change the focus to a specific subnet. The same subnet options described in Other Subnet View Features are also accessible from the omnisearch bar. globe-americas view event log for google.com… External location For external IPs and hostnames, the globe-americas external sites summary can be opened from the omnisearch. The summary covers interaction between internal devices and the external host over time. The summary is covered in more detail in External Sites Summary. exclamation-triangle Compliance / Telnet Model Models can also be searched for from the omnisearch. If the model is inactive (disabled), this is indicated. Click the exclamation-triangle triangle icon to open the model editor for the model, or click the page icon to open a breach log for the model. chart-network S3a9BRg6DoFtrbpu2e UUID Unique uuids are assigned to every event, connection or group of connections observed by Darktrace. Click the align-justify lines icon to open an event log for the UUID. The UUID will also be populated in omnisearch if a pivot from Advanced Search was performed. Advanced searches can also be performed with prefixes. For example, using subnet:10.0.0.0/24 will return devices within this subnet, tag:Test will return devices tagged with the “Test” tag.
- 24. 24 • Clickthe time in the top right to select a specific time and date. To move relatively, use the 1 day, 1 hour, 1 minute buttons at the bottom. Those on the left of the play play icon move the time backwards, those on the right move forwards. • Click the timezone to change the current location-based timezone. By default, the browser timezone is used. Any open event logs will not show the new timezone until closed and reopened. • Click the redo return icon to reset the time to the current time. • Click the angle-down dropdown arrowto change the time window. The window is discussed in further detail below. • Click the play play button to play the 3D visualization currently on the workspace real time from the time chosen. The time selector in the top right controls the connection visualization and the starting point for event logs in the main workspace. Focusing on an alert will change the time in the selector to the time of the alert so events can be replayed. Some elements, such as the threat tray, show alerts over a large time window. These elements have their own time selector and this will be clearly indicated. Changing the Time Time Window Some elements use a window of time to display information over. When focusing on a device or subnet, a panel with statistics appears on the right of the workspace. This element uses the time window to show statistics on data transfer volumes and connections - changing the windowwill alter this panel. The size of the time window is shown above the bar. The start and end times are displayed on either side. • Values on the left of the window arrow-to-left make the window smallerwhen clicked. • Values on the right of the window arrow-to-right make the window largerwhen clicked. Hoverwithin the window at a specific time and click to set the main time selector to that time. CHANGING THE TIME
- 25. 25 AI Analyst only reports upon the most important or interesting activity - it performs the heavy lifting and should be the starting point for any Darktrace operator. exclamation-triangle Model Breaches Darktrace models are a logic framework that allows operators to interact with the output from ‘pattern of life’ and anomaly classifiers. Models are primarily used to identify and alert on anomalous and potentially malicious behavior. The Threat Visualizer platform provides a curated set of default models as standard, designed and constantly tuned by the specialized Darktrace analyst team. When conditions for a model are met, this creates a model breach and can trigger an alert or action. AI Analyst investigates every model breach that occurs on the system and reports only the most interesting activity as incidents. Threat Tray The panel at the bottom ofthe main threat visualizerworkspace contains alerts from Darktrace anomaly detection. For any investigation workflow, the tray is the first place to start. By default, it will show incidents created byAI Analyst on first access. Afterwards, it will remember the last mode used. The tray has four options: c AI Analyst, exclamation-triangle Model Breaches, thumbtack Pinned Alerts, chart-area Model Breach Cluster View. c AI Analyst Incidents are created from AI-powered investigations into anomalies across your digital environment. Every time the conditions for a model are met and a model breach is created, AI Analyst investigates the activity and concludes whether it needs to be surfaced for human analysts to review. The results of this analysis is then grouped in incidents. THE THREAT TRAY
- 26. 26 Filtering the Tray For c AI Analyst and exclamation-triangle Model Breaches, the total number of alerts present in the threat tray after filters are applied will appear on the left. Filtering the tray to just alerts relevant to your workflow will now be covered in Filtering Alerts with Behavior Categories, Filtering Alerts with Basic Filters and Filtering Alerts with Advanced Filters. thumbtack Pinned Alerts Model breaches can be pinned for quick access. Pinning is specific to each user and persists between logins (requires local storage). A list of pinned model breaches is retrievable by clicking this icon. Clicking on a model breach from the pin listwill open the model breach log. Model breach logs are covered in further detail in Opening the Model Breach Log. Globally pinned AI Analyst incidents will also be returned here for reference. chart-area Model Breach Cluster View In cluster view, model breach events are plotted onto a graph of severity score against time, allowing patterns and clusters of model breaches to be quickly identified. A key of what each point represents is shown on the right. Model breaches are aggregated into single dots by the model breached, by the device, or by the credential that triggered the model breach. Aggregation is dependent on the “Sort By” chosen. Clicking on a point on the graph will open the model breach log. Model breach logs are covered in further detail in Opening the Model Breach Log.
- 27. 27 Categories can be applied to AI Analyst and Model Breaches separately. To see the currently applied categories, open the filter Filters tab and click the ellipsis-h three dots icon. When new users are created, the behavior categories they see as default when they first log in can be customized. For existing users, the default behavior categories they see can be customized in two ways: • In Account Settings, by altering the settings “Default Threat Tray AI Analyst Behavior Visibility” and “Default Threat Tray Model BehaviorVisibility”. • By creating a saved filter with the desired behavior categories and setting it as default. This saved filter takes priority over account settings, if set. The alerts in the threat tray can be filtered in many different ways to support different priorities and investigation workflows. The most important filter to be aware of is behavior categories. Behavior categories are high level filters that allow an operator to focus in on specific levels of severity or behavior. There are four categories: Critical, Suspicious, Compliance and Informational. Categories are used across both AI Analyst and Darktrace models. • Critical alerts represent events with the highest anomaly and are where an analyst should focus their attention in the first instance. • Suspicious alerts are those which suggest moderate levels of anomaly but do not warrant prioritization over critical. • Compliance alerts are raised for behaviors that may be counter to organizational policies and best operating practices. • Informational alerts cover low level indicators and notable events which do not indicator malicious activity in isolation. The informational category is not applicable to AI Analyst alerts as only events worth analyst attention are surfaced. FILTERING ALERTS WITH BEHAVIOR CATEGORIES
- 28. 28 More granular filters are also available for both AI Analyst incidents and model breaches so that specific types of activity or parts of the network can be focused on. These filters are entirely optional and are in addition to the key filters already discussed. Filter sets can be saved for AI Analyst incidents and model breaches and set as the default view. Time AIAnalyst incidents and model breaches can be filtered bya time range to control the quantity of alerts. The range is controlled separatelyforthe two alert types. If a custom range is chosen, the two date fields will become interactable so a range can be chosen. AI Analyst incidents are made up of multiple alerts that may occur over a longertime frame. An incident will be returned if any of its underlying events happened within the range, ensuring that active, developing incidents are not excluded. Thistimerangemayalsoimpactotherinvestigationelements-thiswillbenotedwhererelevant. Score Both AI Analyst incidents and model breaches can be filtered by a severity score using a slider. By default, the minimum is set at 20% forAI Analyst incidents and 60% for model breach alerts. This can be altered manually or overwritten by a saved filter. AI Analyst incidents are given an overall score from 0-100%, represented by a gradient from dark (lowest severity) to light blue (highest severity). The score is calculated from the number of devices, the type of activity and the level of anomaly across all events that make up the incident. High scores indicate incidents that AI Analyst believes to be high priority for human attention. When the criteria for a Darktrace model are met, a model breach is created with a score from 0-100%, represented by a gradient from yellow (lowest severity) to red (highest severity). The score is calculated from the type of activity, the priority of the devices involved and the rarity of the model breach for the device. Score can be a useful metric to use when prioritizing within a category - for example, starting with category “critical” and addressing alerts in order of score. The two scores should not be seen as comparable. AI Analyst only surfaces the most important and interesting activity for users, whereas model breaches cover the full range of activity from low level, informational activity to high priority alerts. Filters For many operators, there are two more key filters they will use when investigating alerts: time and by score. The time range and score range over which alerts are returned can be customized. FILTERING ALERTS WITH BASIC FILTERS
- 29. 29 AI Analyst incidents can be further filtered by network subnet and acknowledgement status. There are no sort orgrouping configuration options forAIAnalyst alerts as incidents are always sorted by severity and grouped by high-level analysis. The current alerts in the tray can be exported as a PDF. To do so, enter a filename under the “Export” header and click Download Incidents. Filters For many operators, there are only two more key filters they will use when investigating alerts: time and by score. The time range and score range over which alerts are returned can be customized. More granular filters are also available for both AI Analyst incidents and model breaches so that specific types of activity or parts of the network can be focused on. These filters are entirely optional and are in addition to the key filters already discussed. Changing the Default View The current set offilters can be saved forAIAnalyst Incidents and Model Breaches and applied as the default for subsequent sessions. Saved filters for both alert types include the behavior category visibility, the score range, the time range and subnet filters. Model breach saved filters also include model folder filters, modeltagfilters,thesorttypeandwhetherresultsshouldincludeacknowledgedorexclusively Darktrace RESPOND model breaches. Turning on “Default Filter” when a filter is saved or edited (and saved) will mean the filter set is applied in subsequent sessions. Saved filters take priority over account settings, if set. Custom time ranges - those specifying exact dates - are not valid for saved filtersets. AI Analyst Threat Tray Options and Filters FILTERING ALERTS WITH ADVANCED FILTERS FILTER DESCRIPTION Subnets This filter allows devices from specific subnets to be removed from the returned results. Subnets can be selected from a list or a custom range (such as 10.0.0.0/8) can be defined. When at least one subnet is selected, the filter can be set to “Include Subnets” (only show devices from these subnets) or “Exclude Subnets” (remove all devices from these subnets). Subnet filters are not applicable to geographic subnets created for Darktrace DETECT RESPOND/Endpoint agent devices. MITRE Tactics As of Threat Visualizer 6, all AI Analyst incident event types have been mapped to one or more MITRE ATTCK Framework tactics. This filter allows the returned incidents to be filtered down to only those that contain an event mapped to the specific tactic. Events can be mapped to multiple tactics and incidents may contain multiple events, each with distinct tactics assigned. Include Acknowledged Model breach and AI Analyst alerts can be acknowledged as part of an investigation workflow. By default, acknowledged alerts are removed from the returned results. Turn this setting on to include these results. Show all pinned incidents AI Analyst incidents can be globally pinned - this means theywill be returned as part of the results, regardless of whether they are within the timeframe. Turn this setting off to only include pinned incidents that are within the chosen timeframe. Legacy Incidents Darktrace Threat Visualizer 5.2 introduces a significant development in the wayAI Analyst incidents are grouped. Events are now linked persistently through meta-analysis, creating incidents with a wider scope that previously possible. Turn this setting on to see incidents created using (pre-Darktrace Threat Visualizer 5.2), or compatible with, the legacy method. This setting is not compatible with all filter options - some filters may be ignored when enabled.
- 30. 30 FILTER DESCRIPTION Search A free text filterwhich will filter results by device or model name. The value of this field is not saved in saved filters and does not persist if the page is refreshed. Model Folders Darktrace models are sorted into folders that categorize the type of behavior they are designed to detect. When a folder is unticked, model breaches of models within that folderwill disappear from the tray. Subnets This filter allows devices from specific subnets to be removed from the returned results. Subnets can be selected from a list or a custom range (such as 10.0.0.0/8) can be defined. When at least one subnet is selected, the filter can be set to “Include Subnets” (only show devices from these subnets) or “Exclude Subnets” (remove all devices from these subnets). Master This filter restricts model breaches by originating submaster in a Unified View environment. FILTER DESCRIPTION MITRE Tactics Models curated and maintained by the Darktrace analyst team are mapped to the MITRE ATTCK Framework. This filter allows the returned model alerts to be filtered down to only those models mapped to the specific tactic. Models can be mapped to multiple tactics but will not appear multiple times. Include Acknowledged Model breach and AI Analyst alerts can be acknowledged as part of an investigation workflow. By default, acknowledged alerts are removed from the returned results. Turn this setting on to include these results. Darktrace RESPOND Only If turned on, only model breaches for Darktrace RESPOND (Antigena) models will be included. Darktrace RESPOND Controlled Devices Only Restricts the results returned to just model breaches for devices that experienced a Darktrace RESPOND Action within the timeframe selected. Sort By The sort controls how model breaches are grouped into tiles. There are three modes: device, model, and user. The impact of the sort is covered in more detail in Model Breach Alerts in the Threat Tray. Model Tags In addition to being sorted into folders, models can also be tagged to group them together. Common examples are the “AP” tags which map models to attack phases. If a model tag filter is added, model breaches will only be returned if the model has at least one of the chosen tags applied. Device Tags Devices can be tagged manually, or automatically by a Darktrace component or integration, to create logical groups, add context, or to control eligibility for Darktrace RESPOND/Networ. Common examples are the “CVE” tags applied automatically by Darktrace Security Integrations. If a device tag filter is added, model breaches will only be returned for devices that have at least one of the chosen tags applied. Model Breach Threat Tray Options and Filters Model breach alerts have a large number of additional, optional filters. These filters allow an operator to focus in on very specific activity and return to frequent queries using saved filter sets.
- 31. CHAPTER 2 - CYBER AI ANALYST 32 CYBER AI ANALYST INCIDENTS 34 CYBER AI ANALYST INCIDENT LOGS 35 INVESTIGATING AN AI ANALYST INCIDENT 36 DETAILS OF CYBER AI ANALYST INCIDENT EVENT 37 UNDERSTANDING HOWAI ANALYST INVESTIGATED 38 LINKING AI ANALYST EVENTS TOGETHER 39 AI ANALYST INCIDENT OPTIONS AND ACTIONS 40 AI ANALYST INCIDENTS AI ANALYST INVESTIGATIONS CYBER AI ANALYST
- 32. 32 What is AI Analyst? The Darktrace AI Analyst investigates, analyzes and triages threats seen within your Darktrace environment. Bylearning from the millions of interactions between Darktrace’s expert analysts and Darktrace DETECT components, the AI Analyst combines human expertise with the consistency, speed, and scalability of AI. Darktrace models - a logic framework that allows operators to interact with the output from ‘pattern of life’ and anomaly classifiers - are used as a trigger to invoke AI Analyst. When the conditions for a model are met, a model breach is created; AI Analyst reviews and investigate all model breaches that occur on the system as a starting point for its analysis process. The output from this analysis process are AI Analyst Incidents - a collection of one or more related events of anomalous activity. Incidents (Darktrace Threat Visualizer 5.2+) are formed through a meta-analysis of activity type, devices, and endpoints involved in each event. Each incident can encompass multiple stages of activity as it develops. The layer of abstraction means only high priority activity is surfaced. AI Analyst AI Analyst incidents are an excellent place to start when investigating alerts for the first time in the Threat Visualizer. Incidents are only created for the most interesting and high priority activity observed by Darktrace. Incidents are created from AI-powered investigations into anomalies across your digital environment. Every time the conditions for a model are met and a model breach is created, AI Analyst investigates the activity and concludes whether it needs to be surfaced for human analysts to review. The results of this analysis is then grouped in incidents. CYBER AI ANALYST
- 33. 33 Cross-Platform Investigation The Darktrace AI Analyst investigates across the wider digital environment, tying together unusual activity as it spreads across the enterprise, cloud, OT and into SaaS services. As of Darktrace 6.1, collaboration and communication between Darktrace AI Analyst and Darktrace/ Email has been deepened further. Incident to Model Breach Relationship Although a model breach may be the trigger for an investigation, that does not mean the activity AI Analyst surfaces is directly related to the original model breach. Like a human, the Cyber AI Analyst uses a model breach as a starting point to investigate the device. The behavioral analysis it performs may discover anomalies or patterns of activity that were not the original trigger point for the model breach but are worthy of investigation. Similarly, not all model breaches that are investigated will result in an incident - only activity the AI Analyst considers high priority. A model breach will indicate if an AI Analyst incident was created as a result. Users who wish to review all alerts raised by Darktrace should also consult the model breach view. Please note, the Cyber AI Analyst will only investigate model breaches of default Darktrace models. Custom models are not currently supported. From Darktrace Threat Visualizer 5 and above, AI Analyst investigations can be triggered bythird-party alerts using a dedicated meta-model. Where AI Analyst identifies highly anomalous activity related to hostnames or IPs, it then queries Darktrace/Email to identify any related email communications around the time of the behavior(1 hour).Anyindividual communications orevidence ofmalicious campaigns linked to the activity are then presented by Darktrace AI Analyst as a new incident event, alongside the initial activity detected, giving operators a whole-incident view across the wider digital estate.
- 34. 34 pending Darktrace RESPOND action at the current time, a Darktrace RESPOND icon - a - will appear beside the device name on the tile. The device name is highlighted green if the action is currently active or orange if currently pending. Hovering over a tile will show more details of the devices and events. Users can triggerAI Analyst investigations manually if theywish to look into a device’s behavior in greaterdetail. Ifan event orincidentwas createdfrom an investigationtriggered bya manual investigation or a third-party alert, this will be indicated on the tile. Cyber AI Analyst Incidents An incident is composed of one or more events; events are a group of anomalies or activity investigated by Cyber AI Analyst that it considers high priority enough to raise to a human operatorforattention.Fornewusers,startwiththefirstincidentinthetraywith“critical”severity. Investigating an AI Analyst Incident AI Analyst is accessible from the c AI Analyst icon in the bottom left of the threat tray. For new users, it will be the default view when they first access the Threat Visualizer. The number of AI Analyst alerts in the tray (after filters) is displayed on the left. CYBER AI ANALYST INCIDENTS Incidents have a behavior category and an overall score from 0-100%. Behavior categories are high level filters that allow an operator to focus in on specific levels of severity or behavior. TherearethreecategoriesforAIAnalystincidents:Critical,Suspicious,Compliance.Categories are assigned to incident events and the incident is then given the most severe of all underlying categories. The score can be used to filter on a sliding scale; incidents are categorized from dark to light blue, where light blue indicates a high score and darker blue a lower score. The score can be a useful way to prioritize within a behavior category - for example, starting with “critical” alerts and investigating from highest to lowest score before moving on to “suspicious”. Formore information about the filteroptions available, please see FilteringAlertswith Behavior Categories, Filtering Alerts with Basic Filters and Filtering Alerts with Advanced Filters. Each alert in the tray lists the initial device (the device that triggered the first activityAI Analyst detected), the number of events the incident comprises, the number of devices involved in the incident, and the behavior category. If the initial device or user is subject to an active or
- 35. 35 In addition to the Threat Tray, AI Analyst incidents can also be viewed in an AI Analyst incident log; the incident log is opened by interacting with the “Critical Incidents” or “MITRE ATTCK Tactics Processed” statistics on the Threat Visualizer homepage summary. These elements displaya count ofevents and alertsthat are ofCritical priorityorare relevantto “tactics” from the MITRE ATTCK Framework (refer to Understanding the Summary Panel for more information). For Darktrace Threat Visualizer 6, all types of activityAI Analyst investigates (event types) have been mapped to at least one MITRE ATTCK Framework tactic. As AI Analyst incidents can comprise multiple events or types of activity, created incidents may therefore be associated with multiple tactics. To open the AI Analyst incident log, click the first “Critical Incidents” element, or an “Incidents” or “Critical Incidents” count for a specific MITRE tactic. AI Analyst Incident Log UnderneathisthetimerangeforAIAnalystincidentstobeincludedinthelog.Thedefaultrange is taken from the 28 daysummarypanel range but can be altered using the time selectors.The log can also be filtered to showonlyunacknowledgedAIAnalyst incidents, onlyacknowledged AI Analyst incidents, or both states ofAI Analyst incidents. By default, acknowledged alerts are removed from the returned results. Incident Entries Each incident appears as a separate entryand lists the initial device - the device that triggered the first activityAI Analyst detected - at the top ofthe entry. The time that the incident was first created appears on the left. The entry also contains important information about the incident priority, involved devices, types of activity detected and the associated MITRE tactics. EXAMPLE INCIDENT INFORMATION MEANING exclamation-circle Critical The incident behavior category - in this case, “Critical”. network-wired Exfiltration A MITRE tactic associated with the incident. c Unusual External Data Transfer The title of an event that is part of the AI Analyst incident. desktop ws192 A device that was involved in the incident. CYBER AI ANALYST INCIDENT LOGS The AI Analyst incident log opens a new window. The window title will reflect whether the log was opened from “Critical Incidents” or “Incidents”. If chosen from a specific MITRE tactic, the tactic filtered upon is displayed in the top left of the window. Clickanywhereonthelogentrytoopentheincidentinformation,orclickonthetitleofaspecific event to open the window focused on that event. Incidents opened from the incident log are no different than those opened from the Threat Tray and can be investigated as described in Investigating an AI Analyst Incident and Details of CyberAI Analyst Incident Event onward.
- 36. 36 An incident is composed of one or more events; events are a group of anomalies or activity investigated by Cyber AI Analyst that it considers high priority enough to raise to a human operatorforattention.Fornewusers,startwiththefirstincidentinthetraywith“critical”severity. Investigating an AI Analyst Incident Returning to our previous example, the first incident in the tray is a critical incident with 8 underlying events and 8 devices involved. The incident has been initially triggered by the behavior of a desktop device (“10.15.0.1”). Hovering over the tile, we can see that the incident is mostly unusual data transfer after potential port scanning activity. The devices involved are a mixture of desktop devices and servers. Model breaches which may be associated with each event will appear as dots, where color indicates severity. The activity associated with the event selected right nowwill be highlighted in blue; long-lived events such as large data transfers may cover a large chronological period. Like a human, the Cyber AI Analyst uses a model breach as a starting point to investigate the activity. The behavioral analysis it performs may discover anomalies or patterns of activity that were not the original trigger point for the model breach but are worthy of investigation. Consequently, the event period may not correspond with the model breach time. Additionally,somemodelbreachesrequiresustainedbehaviorssuchasrepeatedconnections, so the final model breach trigger may be later than the connection of interest. For this port scanning activity, the “Unusual Activity / Multiple Failed Internal Connections” model was triggered after repeated activity. The activityAI Analyst has identified therefore stretches back before the model breach. Events The next step is to understand the activity AI Analyst has surfaced and understand why it has been highlighted to a human operator. Each incident is comprised of events which detail a specific anomalous activity - or chain of activities - investigated by AI Analyst. Each event will appear as a tab and can be investigated and acknowledged separately. INVESTIGATING AN AI ANALYST INCIDENT For users investigating from an AI Analyst incident log, the same information is instead displayed on the log entry itself as described in CyberAI Analyst Incident Logs. Once clicked, the incident launches a CyberAIAnalyst panewith the results ofthe analysis and triage. It will open on the first event to occur as part of that incident. In our example, the first event is port scanning activity. At the top of the panel is a representation of the incident time period. We can see that the first three events AI Analyst has highlighted occurred at around the exact same time. The device “10.15.0.1” was observed performing potential port scanning, making unusual large uploads internally and externally at 4:30am. An alternative view is also available from the list-ul incident timeline option on the left.
- 37. 37 The key details of the activity AI Analyst detected are provided in a series of panels on the right. The type of information is specific to each event type and can differ significantly. For our example port scanning activity, the right panels include details of the scanned IP addresses, port ranges scanned via TCP and port ranges scanned by UDP. In other examples, the panels may include detailed information on the location of external endpoints or rare user agents detected performing SaaS administration. The summary can be localized into any of the current 12 options: English (US), English (UK), Chinese (Simplified), Chinese (Traditional), French, German, Italian, Japanese, Korean, Portuguese (BR), Spanish (ES) and Spanish (LATAM). This setting can be changed from Account Settings. Event Details Incident Events Each incident is comprised of events which detail a specific anomalous activity - or chain of activities - investigated by AI Analyst. When starting to investigate an AI Analyst incident, one approach is to work through each incident event chronologically. Each event will appear as a tab and can be investigated and acknowledged separately. Other approaches which prioritize investigating the most high priority activity first may be more suitable, depending on your organizational priorities and workflow. DETAILS OF CYBER AI ANALYST INCIDENT EVENT Continuing the example incident started in Investigating an AI Analyst Incident, the first event is potential port scanning activity. Event Summary Thefirstpanelgivesasummaryoftheeventoutline.Thesummarydescribesthetypeofactivity AI Analyst detected, the device involved, any endpoints connected to and an explanation of why the activity is anomalous. The summary is the best way to quickly understand the activity AI Analyst has flagged for human review. Here, the summary explains why port scanning activity should be of concern to the security team. All AI Analyst event types are mapped to one or more MITRE ATTCK Framework tactics - the relevant tactic appears below the sumamry text. AI Analyst will also utilize intelligence from Darktrace Attack Surface Management (ASM) through the Darktrace PREVENT/ASM Integration; if a malicious asset detected by ASM such as a domain is observed as part of anAIAnalyst event, a pivot to that asset in theASM interface will appear in the event details. Where devices observed by Darktrace are involved in the event, detailed information about the device hostname, IPaddress and anytags will be included. These details will vary between device. If the device or user is subject to an active Darktrace RESPOND action at the current time, the device name will appear highlighted green. If clicked, this section will center the Threat Visualizerworkspace on the device. It can now be helpful to understand how AI Analyst detected the activity and how it links togetherwith the other devices detected behaving anomalously.
- 38. 38 However, unlike a human analyst, the Cyber AI Analyst can analyze vast quantities of data at machine speed and investigate potential hypotheses concurrently. It can perform complex data interrogation on a scale and a complexity not possible without AI. The investigation process panel displays a summary of this intelligent analysis process followed by AI Analyst to reach the conclusions displayed in the event. Investigation Process The investigation process panel is located below the related model breaches and explains howAI Analyst went from the initial triggerto the final activity presented to the user. Reviewing the process can be a useful way to understand the steps performed. The Cyber AI Analyst, when triggered by a model breach, by telemetry data or by a human operator, initiates an investigation just like a human analyst. It retrieves and analyzes data to identify related behaviors and activity from the device or user under investigation, and from thewidernetwork environment - just as a cyberanalystwould seekto gain context and identify similar patterns of anomalous behavior elsewhere. How did AI Analyst reach the conclusions it did? Incidents are created from AI-powered investigations into anomalies across your digital environment. Every time the conditions for a model are met and a model breach is created, AI Analyst investigates the activity and concludes whether it needs to be surfaced for human analysts to review. For each event, AI Analyst explains the activity that initially triggered the investigation and the investigation process it followed to come to the conclusions surfaced in the Threat Visualizer. Related Model Breaches Underneath the event summary for an AI Analyst incident event are the model breaches that triggered the initial investigation. AI Analyst is not reliant on model breaches, they primarily provide a starting point for its deeper analysis of the device activity around the anomaly time. A comment-lines comment icon indicates if any related model breaches have been commented on by a user. These can be reviewed in the incident discussion. Further investigation prioritize the anomalous activity signposted by CyberAI Analyst first and the model breach conditions second if the two do not directly align. For each model breach, a series of actions can be performed. ICON DESCRIPTION exclamation-triangle This icon opens the model breach log for the related model breach. The Model breach log is covered in great detail in a series of articles, starting with Opening the Model Breach Log. align-justify Opens the model breach event log. Model breach logs are covered in more detail in Exploring the Model Breach Event Log. search Center the Threat Visualizer on the device that triggered the model breach at the time the model breach occurred. UNDERSTANDING HOW AI ANALYST INVESTIGATED As the investigation process proceeds, AI Analyst narrows down the activity from a wider analysis to a targeted anomaly. Each investigation blends AI, supervised machine learning and intensive data analysis. These smart steps are identified in blue - “head-side-brain Carrying out intelligent data analysis”. As noted before, the behavioral analysis AI Analyst performs may discover anomalies or patterns of activity that were not the original trigger point for the model breach but are worthy of investigation.
- 39. 39 Returning to the example incident from Investigating an AI Analyst Incident and Details of CyberAI Analyst Incident Event, eight events have been connected together. Incidents within Incidents Incidents can also be subsumed into other incidents - what might appear as disparate behaviorinitiallycan be linked bysubsequent unusual activity. In this case, the laterbehavioris subsumed into the initial incident. Links to the later incident will redirect to the initial incident. In a simplified example, device A is seen beaconing to two external rare endpoints. Device B is separately seen performing a chain of administrative SSH connections that end at a key server. These activities trigger separate investigations and result in two separate incidents. Subsequently, the credential admin12 is observed on device A and triggers an investigation for unusual admin credential use. At the same time, the credential admin12 is also seen on the server connected to by device B, triggering an investigation for unusual admin credential use. The event for device A and device B are now linked by a shared admin credential - admin12 - and their previous activity is drawn into one overall incident. Where the beaconing and administrative connections were disparate events at first, the linking credential allows AI Analyst to present the full picture: device A and B are compromised by the same actor, and device Bs connectivity is lateral movement associated with that compromise. Switching to the final event - “Unusual External Data Transfer” - we can see from the linked incident events panel that it has been connected to the “Unusual External Data Transfer to Multiple Endpoints” due to a shared external destination. “Unusual External Data Transfer to Multiple Endpoints” was performed by “10.15.0.1”, the same device that was observed performing the port scanning. Therefore, the activity has been linked together indirectly through this shared endpoint. The final step is to understand how the activity detected by AI Analyst in the event fits in with the wider incident. Darktrace Threat Visualizer 5.2 introduces a significant development in the way AI Analyst incidents are constructed. New, ‘open’ incidents are created by a meta-analysis ofthe devices, endpoints and activity involved in each event. Events with linking factors are then joined together persistently to create incidents encompassing a much wider scope of time and activity. Linked Incident events The linked incident events panel displays the reasons why AI Analyst chose to link certain behaviors together. • The port scanning behavior has been connected to an “Unusual Internal Upload” and “Unusual External Data Transfer to Multiple Endpoints” because theywere all performed by the same device (“10.15.0.1”). • This “Unusual Internal Upload” was also to an IP address seen in the scanning activity (“10.10.5.213”), which was then observed receiving an “Unusual Internal Upload” and sending data which triggered two instances of “Unusual Internal Download”. • Finally, another IP observed in the scanning behavior was seen performing an unusual “Internal Download and External Upload” LINKING AI ANALYST EVENTS TOGETHER Seven events have therefore been directlylinked to the activityin this event. Some events may not have a direct link to others and are instead linked through a shared event that draws the behavior together.
- 40. 40 ICON DESCRIPTION c Breaches Processing A flashing CyberAI Analyst icon indicates that it is currently analyzing other model breaches that may be relevant. If this analysis deems the breaches related to the incident, CyberAI Analyst will create additional events. Click the icon to expand the list of processing breaches. list-ul Incident Timeline This option opens a timeline of all events and their trigger device - it is useful to quickly understand the chronology of the incident and find events that occurred around the same time. A device filter can be applied in this pop-out which also applies to events returned in the main panel. angle-double-down Attack Stages Open a visualization of the events alongside the stages of a cyber attack they may represent. comment View Incident Discussion Opens the comment pane where users can discuss the incident. Comments on related model breaches will also be displayed in the discussion. Users may comment from the Threat Visualizer interface as well as the mobile app. download Create a Report Opens a dialogue to create a downloadable PDF report from the incident. Any text entered into the “Report Name” field will be used as the filename and appear as a title in the generated PDF. thumbtack Pin the Incident Keeps the Incident at the left-hand-side of the threat tray regardless of the time range chosen. When the incident is pinned, the tab will appear lighter. Individual events may also be pinned - if one or more events are pinned, the entire incident will be pinned. Pinned incidents do not interact with the pinned model breaches functionality. check Acknowledge Incident This icon will acknowledge all underlying events for the incident at the time of click. If all events are acknowledged, the incident will be shown/hidden from the incident tray depending on the filter settings. Events can also be acknowledged individually as part of an incident investigation workflow - some individually acknowledged events do not prevent the overall incident being returned. copy Copy to Clipboard Copies a link to the incident to the clipboard. To investigate an AI Analyst event, the next step is to look more closely at the activity and devices involved. Before focusing on a device, it is necessary to understand the actions and investigation steps that can be taken in the AI Analyst incident pane itself. Incident Actions On the left of the incident panel are a series of actions and views. During initial investigation, the incident timeline can be used to understand the orderof events and filterdown byspecific devices. The attack phases also visualizes the events alongside the stages of a cyber attack they may represent. AI ANALYST INCIDENT OPTIONS AND ACTIONS Pinning the incident, commenting ordownloading a PDFreport can be useful forcollaboration with other analysts on event investigation.
- 41. 41 Investigating activity Once the outline of the event and incident as a whole is clear, focus on a device within the incident to better understand its normal activity patterns and gather context about its role in the digital environment. Investigating a device is introduced in Focusing on a Device. ICON DESCRIPTION check Acknowledge this event Events can be acknowledged individually, rather than as part of the whole incident - this is a common workflow as a threat analyst investigates each underlying event in turn. check-double Acknowledge this event and related model breaches In addition to acknowledging this event, this icon will also acknowledge the model breach alerts listed under the “Related Model Breaches” heading. A comment is automatically added to model breaches acknowledged this way in bulk. thumbtack Pin/Unpin incident event Click this icon to pin or unpin just this event. Incidents with at least one pinned underlying event will be returned regardless of whether they fall within the time range chosen. Actions for an Event On each event are a series of actions that can be taken. These actions only affect the chosen event or related alerts. Incidents and events can be acknowledged when they have been investigated. This removes them from the threat tray by default. A common workflow is to investigate each event and acknowledge individually.
- 42. CHAPTER 3 - FOCUSING ON A DEVICE 43 DEVICE INVESTIGATION OPTIONS 44 DEVICE SUMMARY 46 OTHER DEVICE SUMMARY SECTIONS 48 USING THE DEVICE EVENT LOG 50 TYPES OF EVENT IN THE DEVICE EVENT LOG 51 INVESTIGATING A CONNECTION IN THE DEVICE EVENT LOG 52 INVESTIGATING SAAS ACTIVITY IN THE DEVICE EVENT LOG 54 FILTERING THE DEVICE EVENT LOG 56 TRIGGERED AI ANALYST INVESTIGATIONS 57 OTHER DEVICE INVESTIGATION WINDOWS 58 FOCUS ON A DEVICE DEVICE EVENT LOGS OTHER INVESTIGATION METHODS INVESTIGATING A DEVICE
- 43. 43 Workspace The workspace will change. In the center is a visualization of the chosen device and any other devices it is connected to at the time chosen. The time in the selector at the top right controls the visualization. If the play play button is clicked on the time selector, time will progress and the re-enactment of connections will resume. Clicking on any other device will change the focus to it. Hover over the device to see a summary of information including device type, current subnet, any applied tags, any recently observed credentials and to trigger a manual Darktrace RESPOND action agains the device. See Manual Darktrace RESPOND Actions for more information on triggering these actions. The color of the device is decided by the highest severity of model breaches that it has triggered in oraroundthetime selected inthetop right. Ifthe devicewas subjectto a Darktrace RESPOND action during the visualization, a green line will appear around it for the duration of the action. If the device currently has pending Darktrace RESPOND actions, an orange line will appear around the visualization. Investigating a Device Focusing on a device is the next stage in anyinvestigationworkflow. To understandwhetheran anomalous activity might be malicious, it is important to understand the device and to acquire context about its historic behavior. There are many ways to focus the Threat Visualizer workspace on a device. Three common methods are: • From an AI Analyst incident event, click the device name in blue above the graph. Click the time in the same subheading to also set the Threat Visualizer to that exact time. • From a model breach log, click the search magnifying glass icon. This will center the Threat Visualizer on the device that triggered the model breach at the time of the model breach. • From the subnet view, click any glowing point that represents a device. FOCUSING ON A DEVICE
- 44. 44 DEVICE INVESTIGATION OPTIONS The icon for the device is decided by its device type. Device type is derived by Darktrace from observation of the device behavior - it can be overwritten in Device Admin (see Device Admin) or from the icons in the omnisearch bar (see below). Belowthe device options are anytags that have been applied to the device.Tags offera simple labelling system for network devices, credentials and users detected in external platforms (SaaS users)which can be used to identifyimportant resources, control eligibilityforDarktrace RESPOND responses and alter model logic. Tags with an hourglass-half hourglass icon indicate an expiry time is associated with the tag - click this icon to alter the expiry. More information can be found in Adding and Reviewing Tags. On the right oftheworkspace is a panelwith statistics about the device’s connections overthe time window chosen in the selector. The time window is shown belowthe timezone. By default, the time window is 5 minutes. On the left of the device name is an icon representing the device type. The device type is automatically derived and can be manually overwritten. To the right of the device name are a series of icons; these icons and options will differ depending on the type of device. Darktrace RESPOND If the device or user is subject to a Darktrace RESPOND action at the current time, the omnisearch will appear shaded green. If an action is currently pending confirmation for the device, the omnisearch will appear shaded orange. A Darktrace RESPOND icon - a - will also appear beside the device type. Device Options ICON APPLICABLE TO DESCRIPTION dt-asm-icon Open Device in ASM Network Where the Darktrace PREVENT/Attack Surface Management integration is present, matched devices will display this icon. Click to pivot to the matched asset in ASM. dt-e2e-icon Open Device in E2E All Where Darktrace PREVENT/End-to-End is configured, click to pivot to the device in the E2E interface. Device Options At the top of the workspace, in the omnisearch bar, the device focused upon is shown. The bar displays the device label, hostname and IP address, where available. For third-party platform user devices, the device name is displayed in the format [SaaS::][service] [username]. For devices monitored by Darktrace DETECT RESPOND/Endpoint agents, only the hostname and label are displayed as the device may have many concurrent IPs.
- 45. 45 ICON APPLICABLE TO DESCRIPTION c AI Analyst Investigation All AI Analyst investigates anomalous activity in your digital environment, surfacing only the most high priority findings. Users can trigger their own AI Analyst investigations into devices and users detected in external platforms (SaaS users). This icon opens a dialog to trigger an AI Analyst investigation into the focused device. a Darktrace RESPOND Actions All Darktrace RESPOND takes autonomous actions against devices to control and contain anomalous behavior. This option opens the Darktrace RESPOND Actions window, focused on the device. The default timeframe is 7 days but can be altered. This window can also be used to trigger manual Darktrace RESPOND actions against the user account for eligible modules. This option will not appear for users of modules which do not have Darktrace RESPOND available. laptop-mobile Device Summary All This icon opens the device summary, a keywindow for understanding statistics about a device and its historic behavior. Device summary is covered in more detail in Device Summary and Other Device Summary Sections. align-justify Device Event Log All The device event log is a detailed log of device connectivity, activity, changes, and anomaly notifications from Darktrace analysis. it is a key investigation tool. The device event log is covered separately in more detail, starting with Using the Device Event Log. exclamation-triangle Model Breach Log All This icon opens the device breach log for the device - a list of model breaches triggered by the device. The default timeframe is 7 days but can be altered. Breach logs in general are covered in more detail in Opening the Model Breach Log. pencil Edit Info Network, Endpoint For network and endpoint devices, this option allows a label (or nickname) to be set for the device. The device type and priority can also be altered. The priority impacts the score for models the device triggers. These settings can also be changed for multiple devices in Device Admin. ICON APPLICABLE TO DESCRIPTION chart-line Open Graph All The graph allows metrics of device behavior to be plotted over time. The default metric for network devices is connections and activity for user devices. The graph is described in more detail in Other Device Investigation Windows. id-badge Open Profile in Platform Accounts Console Users The Platform Accounts Console (formerly SaaS Console) is a purpose built interface for investigating SaaS and cloud user behavior. This icon opens the equivalent user profile in the Platform Accounts Console to continue investigation there. chart-pie View Connections Data Network, Endpoint The connections data windowvisualizes the connectivity of a chosen device against those Darktrace has derived as peers. This is described in more detail in Other Device Investigation Windows. dt-devices-map View Similar Device Map Network, Endpoint For every device, Darktrace identifies peer devices - those it derives as having a similar pattern of life. The similar device map is a 3D visualization of these similar devices, clustered by how similar they are. The list of peer devices is also available in device summary and by clicking the “view similar devices” option. desktop View Similar Devices Network, Endpoint As above, for every device, Darktrace identifies peer devices - those it derives as having a similar pattern of life. This option opens a clickable list of similar devices. cubes Go to device subnet Network, Endpoint Returns the focus to the subnet view for the subnet the device is in. Monitored by Darktrace Endpoint agent Endpoint This icon is not interactive - it indicates that the device is monitored by a Darktrace DETECT RESPOND/Endpoint cSensor agent. Monitored by Darktrace/Endpoint
- 46. 46 Darktrace will attempt to derive operating system information for a device from passive observation of its behavior and display it in the summary. For devices monitored by Darktrace DETECT RESPOND/Endpoint cSensor agents, this information will be populated directly by the agent. The Darktrace Defender Advanced Hunting integration also populates OS information for devices observed by both Darktrace and Microsoft Defender in the summary. Notes can also be added to network devices from Device Admin or from Device Summary - notes persist between sessions and can be reviewed by any other Darktrace userwith visibility over this device. Darktrace PREVENT/E2E Darktrace PREVENT/E2E will also populate key information about a device’s critical impact and potential damage if compromised. Understanding how these values are computed is described in the Darktrace PREVENT/E2E UserGuide article “Overall Organization Risk Score”. RESPOND Actions If Darktrace RESPOND is licensed for the type of device selected, the RESPOND Actions section will appear. DEVICE SUMMARY When investigating a device, it is important to understand the context of how it behaves and where it fits within the network. Device summary is a key tool for gathering this information quickly. It displays key information about devices, their historic behavior, any acknowledged or unacknowledged alerts and similar peer devices. The timeframe for connectivity data is 1 month and 7 days for credential history. For summary data and interface data, the information is the most up to date at the time the summary is opened. The timeframe for other elements can be altered on the section itself. Summary The summary section appears for all device types. It contains key information such as IP address, hostname, the time the device or user was first seen, the device priority and any tags applied to it. Tags which are due to expire display an hourglass-half hourglass icon in this interface which can be hovered for further details. The information that appears in the summary differs between network, endpoint and SaaS devices. For example, devices monitored by Darktrace DETECT RESPOND/Endpoint cSensor agents will include information about the software version of the agent itself.
- 47. 47 • Click “a Launch RESPOND Action” to trigger a manual Darktrace RESPOND action on the device. See Manual Darktrace RESPOND Actions for more information on triggering these actions. • Click “a View RESPOND Actions” to open the Darktrace RESPOND Actions window filtered on the chosen device. Refer to Reviewing Darktrace RESPOND Actions for more information on how to understand the entries in this window. IPs, Credentials and ASNs Device summary populates information about recent IP addresses, credentials, ASNs and interfacesassociatedwiththedevice.Credentialsassociatedwithnetworkorendpointdevices will be displayed first, if present. The historic information will differ between network, SaaS and endpoint devices and will only be returned where possible. For example, if no credentials have been associated with the device, this subsection will not appear. Historic IP information is displayed for network devices - the timeframe can be extended up to 6 months. For each IP change, the reason why a new IP was associated with the device is provided. Devices monitored by Darktrace DETECT RESPOND/Endpoint cSensor agents can have multiple concurrent IPs due to multiple network adapters - instead, details of all network interfaces observed by the cSensor agent (both IP and MAC Address) are listed. For SaaS user devices, ASN history - the ASNs for IP Addresses seen connecting to the SaaS account - is provided. An ASN is a group of IP addresses controlled by one Internet Service Provider or entity. As SaaS activities are often performed by users on mobile devices or tethering to mobile devices, their IP may change regularly but the ASN will stay consistent. Greater variation in IP address is therefore not as indicative of anomaly as large changes in ASN usage. Click the align-justify log icon to open a log of activities for the user from that ASN.
- 48. 48 To switch Threat Visualizer focus to one of these similar devices, click the search magnifying glass icon beside the device name. To view model breaches triggered by the peer device, click the exclamation-triangle model icon. Connectivity Fornetwork and endpoint devices, a breakdown ofthe top five endpoints and ports the device has connected to/from will be displayed. This data is calculated over the last month. Alerts Device summary lists all historic AI Analyst incidents and model breach alerts for the device, separated into acknowledged and unacknowledged. The default timeframe is one week but can be extended to 6 months, data dependent. OTHER DEVICE SUMMARY SECTIONS For model breaches, hover over the model name for a description tooltip. Click the exclamation-triangle model icon to view the model breach log for the model and the selected user. ForAI Analyst incidents, click the c AI Analyst icon to open the incident event. Other Sections Similar Devices A list of similar peer devices is returned for network and endpoint-monitored devices. Similar devices are devices Darktrace has derived as having a similar ‘pattern of life’ - the list is also accessible from “View Similar Device Map” and “View Similar Devices” in device omnisearch options.
- 49. 49 Vulnerability Data If the Darktrace Defender Advanced Hunting integration or integrations with Tenable and Rapid7vulnerabilityscanners are configured,CVE datafordevices observed byboth platforms will be populated in an additional device summary section. globe-americas Geolocation For SaaS user devices, an additional tab is displayed. The location tab displays a map of the approximate geolocation for all IP addresses that have performed SaaS or cloud activities for this user in the last month. IPAddresses are grouped by ASN and the ASN location is represented as a point on the map. Light blue locations indicate sustained activity and dark blue locations are those which are rare for the user.
- 50. 50 OPTION DESCRIPTION a Launch RESPOND Action For network and endpoint devices, trigger a RESPOND action populated with the details of the event log line. Particularly useful for the “Block Matching Connections” inhibitor type. See Manual Darktrace RESPOND Actions for more information on triggering these actions. Requires a relevant Darktrace RESPOND license to be present. search-plus View advanced search for this event This options opens the Darktrace Advanced Search interface to explore a more detailed version of the event or connection log for granular analysis For some events there may be more than one search result with additional contextual information. More information about Advanced Search can be found in Darktrace Advanced Search. arrow-to-bottom Create a packet capture file for this event Opens a dialog to create a packet capture device for the specific chosen connection (see Creating Packet Captures). This option is not available for SaaS user devices. info-circle Search Defender for Process Details If the Darktrace DefenderAdvanced Hunting integration is configured, users can request process data from Microsoft Defender for connection events. This option will only appear for connections older than 15 minutes for devices observed by both Darktrace and Microsoft Defender. For more information, please see Darktrace Microsoft DefenderAdvanced Hunting Integration. user Search Defender for User Logins If the Darktrace DefenderAdvanced Hunting integration is configured, users can request a list of users who logged into the device around the time of the activity from Microsoft Defender. This option will only appear for devices observed by both Darktrace and Microsoft Defender. For more information, please see Darktrace Microsoft DefenderAdvanced Hunting Integration. copy Copy to clipboard Copies the exact log line to the clipboard. history Visualize connection history This option opens a 3D visualization of historic similar connections such as those on the same port, those to the destination device and those for the connection pair. This option is not available for SaaS user devices. filter Filter Event Log by this [protocol/ port/IP] Multiple options to filter the log by specific aspects of the connection will appear. Granular filters can be applied to the event log to focus on specific behavior; these are discussed in more detail in Filtering the Device Event Log. This option is not available for SaaS user devices. The device event log is a detailed list of activity and connections in chronological order. When investigating an alert, reviewing the behavior of the device before and after the alert can be useful to acquire important context. Understanding the Device Event Log Each log entry is sorted in time order, working backwards from the time selected in the top right. The time window can be narrowed by adding a time filer using the filter option. Each log entry describes the device and the activity performed. For network devices, this might be a connection from the device IP to a specific host on a specific port. For SaaS user devices, the log is structured to show the action, the user and the location it was performed from. The event log also contains contextual information like changes to device information, USING THE DEVICE EVENT LOG commentary from Darktrace anomaly detection and model breaches triggered. More log lines can be loaded by scrolling to the end of the log and clicking “load more”. The number of lines loaded at a time can also be altered here. Log Entry Options Between the time stamp and log line is an caret-down arrow icon with extra options:
- 51. 51 Entry Types There are seven “types” of event that can appear in the logs - these events can be filtered on or excluded to focus on specific activity. TYPE DESCRIPTION Connections Connection entries are indicated by an arrow. A long-arrow-left left-facing arrow indicates the connection was outbound. A long-arrow-rightright-facing arrow indicates the connection is inbound. An arrowwith a cross indicates a failed connection. A flashing arrow means the connection is ongoing at the Threat Visualizer time selected. Unusual Connections Unusual connections are displayed in the same manner as connections but include commentary below the log line with the reason Darktrace has deemed the connection unusual. New connections New connections are displayed in the same manner as connections but include commentary below the log line describing why it has been identified as new. Unusual Activity Unusual activity entries are indicated by the dt-icon-template Darktrace logo. Darktrace monitors behavior metrics for each device as part of the pattern of life. If the value of one of these behavior metrics is anomalous, an unusual activity entry may be added to the device event log. The metric is clickable and will open the metric graph. Model Breaches Model breach entries are indicated the triangle icon. If a device triggers a model breach during the timeframe of the log, an entry is created. The model name can be clicked to open the model breach log for further investigation. Some models can be triggered without creating a model breach; these models will also be returned but with limited information. Notices Notices are indicated by the info-circle info icon. Notice entries can be events or contextual information - SaaS user activity and Darktrace/OT ICS action events fall under this category. Darktrace RESPOND actions in the event log will also appear in this way. Clicking the info icon will open a detailed tooltip. Notices can be “popped out” to refer back to. History History entries are indicated by purple text. History events are created when information about the device changes, such as IP, contextual information and credential usage. TYPES OF EVENT IN THE DEVICE EVENT LOG
- 52. 52 Investigating a Connection Entry A typical network or endpoint device will have a log made up mostly of connection events. Connections are indicated by an arrow pointing in the direction of the connection. Each connection entry is broken up into important parts. For example: INVESTIGATING A CONNECTION IN THE DEVICE EVENT LOG long-arrow-left ws123.holdingsinc.com was still connected to darktrace.com via proxy.holdingsinc.com [443] Afterthe device is a simple description ofthe connection status. Examples include “connected to”, “made a successful DNS request for”, “was blocked from connecting to”. The connection direction is part of this status: “was still connected to by” indicates our chosen device is the destination, “connected to” means it was the source. First isthe connection direction - a long-arrow-left left-facing arrowindicatesthe connectionwas outbound, a long-arrow-right right-facing arrow indicates the connection is inbound. An arrow with a cross indicates a failed connection. A flashing arrow means the connection is ongoing at the Threat Visualizer time selected. Click the direction arrow for detailed information about the connection such as source and destination IPs, data transferred and protocol. This info can be “popped out” in a separate window to refer back to. Next, hoveroverthe name ofthe device fora summarytooltipwith basic information about the device. The first device in the log line should be the device currently focused on. Following the status is the endpoint, device or host that was connected to (or the device was connected to by). • If the source or destination is an internal device, hover over the name of the device for a summary tooltip with basic information about the device. Click the device name to change the Threat Visualizer focus to this other device. • If the source or destination is an external hostname, multiple interactions are available: • Hover overthe endpoint or host for a summarytooltip with basic information about the rarity of the endpoint in the context of the network. • Clickthe external-link-alt link icon to open the external sites summary. Similarto device summary, this summary gives information devices that have connected to the external location. More information is available in External Sites Summaryand External Sites Summary for IPs and Hostnames. • Click the hostname or endpoint name to open an additional event log focused on that host. • If workflow integrations that allow lookups for external IPs and hostnames are enabled (such a VirusTotal), a exclamation-circle pivot icon will appear for these entries.
- 53. 53 Darktrace RESPOND Devices currently subject to Darktrace RESPOND actions will appear shaded green in pop out windows. Devices with pending actions will be shaded orange. Hovering over these devices will also show that they are either currently controlled or pending control. If a proxy is in use, it will appear here as a “via”. Finally, depending on the color coding chosen, extra information such as protocol, port or rarity may be displayed at the end of the log line. For network connections, color coding is available by protocol, application protocol, source/destination port, by notice and by endpoint rarity. The default color coding is controlled in user Account Settings or can be altered using one of the filter options. Ifyou wish to launch a RESPOND action against network entities in a connection, there are two ways to do so. • From the hover-over summary, click “Launch RESPOND Action” • From the caret-down down arrow, chose “Launch RESPOND Action” to create a “Block Matching Connections” action from the connection itself. See Manual Darktrace RESPOND Actions for more information on triggering these actions. Darktrace/Email Darktrace/Email shares information about the endpoints it sees in organizational email traffic with other Darktrace DETECT and RESPOND components. If a connection entry includes a hostname Darktrace/Email has detected in an email in the last 12 months, an envelope email icon will appear beside that connection entry. Clicking this icon will attempt to retrieve relevant emails from Darktrace/Email that feature the hostname over the last seven days. As information about observed hostnames is retained for 12 months, it is possible that the relevant email communications are no longer present in Darktrace/Email.
- 54. 54 After the event is the actor - the user who performed the action (“performed by”). In most cases, this user will be the same user the Threat Visualizer is focused on. However, users can also change things about other users such as an admin changing their permissions. In this case, the SaaS user device currentlyfocused on is the resource being changed. These events will appearwith the userwho performed the action as the actor, and the chosen device as the resource. Color coding the log by actor can be a useful way to identify these inbound events. Click the actor to change the focus of the Threat Visualizer. If the action impacts a resource such as a folder, a calendar invite, a user, a file - this will appear next. The resource can also be the user currently focused upon if another user does something to affect them. Color coding the log by resource will also add the resource type in square brackets at the end of the line. Investigating a SaaS Activity Entry (Notice) Log lines for SaaS and cloud users are structured slightlydifferentlyto connection events. The log lines take the format of event, actor, resource, source. For example: INVESTIGATING SAAS ACTIVITY IN THE DEVICE EVENT LOG info-circle Login performed by [email protected] - from 172.217.169.36 (ASN Example ASN) info-circle FileUploaded performed by [email protected] on Document.docx - from 172.217.169.36 (ASN Example ASN) [File] info-circle Update User performed by [email protected] on User isabella.west_admin@ holdingsinc.com - from 172.217.169.36 (ASN Example ASN) The info-circle info icon that appears first can be clicked to open a tooltip with detailed information about the event, the user and the resource that was changed. This info can be “popped out” in a separate window to refer back to. Users can perform a wide range of actions across different SaaS platforms; for ease, events are grouped into high level categories such as “SaaS Login” or“SaaS Resource Modified”. Click the event to open an event log of all actions in the same category across all users. The SaaS- specific “event” color coding allows rare events to be distinguished amongst frequent logins or file actions.
- 55. 55 The final interactive part of the log is the source IP. Both the IP and the ASN are listed. Users using mobile devices or private home networks may have natural variation in source IP but a stable ASN. ASN variation is therefore a better gauge of anomalous location than change in source IPfor users detected in external platforms (SaaS users). • Clickthe external-link-alt link icon to open the external sites summary. ForSaaS source locations, the external sites summary focuses on an ASN and user pair. More information is available in External Sites Summary and External Sites Summary for SaaS Activity. • Click the IP itself to open an additional event log focused on that IP.
- 56. 56 FILTERING THE DEVICE EVENT LOG Advanced Filters and Options ICON DESCRIPTION history Unsync from Threat Visualizer time The device event log displays activity logs going backwards chronologically from the time selected in the top right. If the time is changed, the log will change. Unsyncing the log allows the time to be changed whilst still preserving the logs. Unsync log from the Threat Visualizer filters The connection panel on the right of the workspace can be filtered to show specific ports or hostnames. These filters are also applied to the event log unless it is unsynced. bars Hide duplicate connections If a device repeatedly connects to an endpoint, this filter restricts the log to show only one entry per-endpoint and port. align-left Hide event descriptions Darktrace anomaly detection may add commentary to events that are deemed unusual. This filter hides those comments inline in the event log. greater-than Any Size Limit events in the log to those that transferred over a defined threshold of data. search View advanced search This icon opens the Darktrace Advanced Search interface to explore a more detailed version of the event log for granular analysis. By default, the search is limited to the device IP over a period of 1hr before the Visualizer time selected. More information about Advanced Search can be found in Darktrace Advanced Search. This option is not available for SaaS or endpoint devices. arrow-to-bottom View packet capture Opens a dialog to create a packet capture device for connections to/from the device IP over a chosen time window (see Creating Packet Captures). For devices monitored by Darktrace DETECT RESPOND/Endpoint agents, the interface IPforwhich the capture should be created must be selected first. This option is not available for SaaS user devices. Filtering the Log Information When you are familiarwith the parts of each log line, the next step is to filterthe log to focus on just the information and activity of interest. At the top of the event log several device-related options are available. The options that appear will vary depending on your environment and the makeup of network traffic or user activity returned by the log: ICON DESCRIPTION dts-filter-plus-circle This icon allows a text filter to match against fields such as hostname, application protocol and ASN in the log entries. It can also be used to change the current time window for logs. Only one filter of each type can be defined. dts-filter-slash Remove filters This icon will appear if filters are applied and can be used to remove the current filter set. filter Choose which type of events to show in the log The device event log includes many different types of event; the filter limits the log to just specific types of events, or filters out specific event types. The log can be filtered to show or exclude all network connections, new connections, unusual connections, connections blocked by Darktrace RESPOND, changes to device information (“history”), model breaches triggered by the device, and contextual information or activity (“notices”). SaaS user activity is always of the “notice” type. dts-filter-internal-external Choose whether to show internal or external events in the log. For connectivity, filter the log to show only events to/from internal endpoints, to/from external endpoints, or both. dts-filter-incoming Toggle incoming/outgoing events Filter the log to only incoming connections, outgoing connections or both. palette Color-code events by their properties Color-code the event log lines by the specific filter. Doing so will add additional details after the event line. For example, coloring by port will add the port in square brackets (e.g. [443]). Default color coding is controlled in each user’s account settings. Event logs for SaaS user devices will present different filtering options specific to SaaS activity. ellipsis-v Advanced options Provides access to advanced options and filters. Refer to the table below for more information.
- 57. 57 When an investigation is triggered, AI Analyst will perform a close analysis of the activity for the device or user for a period of roughly one hour, using the time provided as a central point. It will then contextualize this behavior against historic activity and connectivity for the entity and its peers. If a finished investigation has the result “No Incident Found”, AI Analyst did not locate any identifiable anomalous activity around the investigation time. If anomalous activity is detected, one or more incident events will be created. In the Threat Visualizer interface, click the eye Incident button to open the investigation result. Incidents created from triggered investigations follow the same format as AI Analyst incidents created automatically. For details on triggering AI Analyst investigations from third-party alerts, please see AI Analyst Third Party Investigations or the Darktrace System Administration Guide. An AI Analyst investigation can be triggered on a specific device from the omnisearch bar in the Threat Visualizer with the c AI Analyst icon. When an investigation is launched from a specific device or SaaS profile, the Device or Account field is already completed. Click Investigate to start the investigation. Investigations Investigations display the device or user under analysis, the analysis time, the user who triggered the analysis and the current investigation state. Investigations have three states - pending, processing, finished. A pending investigation waiting for AI Analyst to start the analysis. A processing investigation means analysis is underway and a finished investigation means the investigation has concluded. Current and completed investigations can be reviewed by navigating to AI Analyst Investigations View Investigations in the main menu. Investigating a User or Device To trigger an AI Analyst investigation, a device or SaaS user and a time are required. The device is the subject of the investigation and the time is the starting point for analysis. In the Threat Visualizer, the c AI Analyst Investigations item is available from the main menu. The c Launch Investigation item will open the investigation dialog without a device selected. Here, the field acts as a search barwhich can be used to locate the device for investigation. TRIGGERED AI ANALYST INVESTIGATIONS
- 58. 58 OTHER DEVICE INVESTIGATION WINDOWS Connections Data Visualization This option visualizes historic connectivity for the device. It is only available for network and endpoint devices. The primary graph displays the device behavior over the last week - number of connections or data transfervolume - in the context of peer devices. Device similarity decreases from front to back. Two additional graphs display port and device breakdown for the connectivity visualized. The main graph can be further filtered by clicking on ports or devices represented on the two donut charts. The time period, number of devices, and display mode of the graphs can be customized. Other Investigation Windows After consulting the device summary and event log, many users move on to close examination of activity using the Darktrace Advanced Search interface. However, there are additional investigation views for a device that can be useful for gathering further context of normal behavior. Metric Graph The graph can be used to plot device behavior over time for a number of metrics and against model breaches the device has triggered. The default metric for network and endpoint devices is “Connections”, for SaaS user devices it is “SaaS All” (all SaaS activity). Up to two metrics can be displayed on the graph. To add an additional metric, click the plus plus icon. For metrics with in/out values such as data transfer and connectivity, click the eye eye icon beside the direction to show or hide it. The time range defaults to center around the time selected in the top right of the Threat Visualizer. The window can be changed using the dropdown or by clicking and dragging across the graph. Clicking on the graph when a time tooltip is shown will change the time in the selector to the clicked time. If model breaches are shown on the graph, these points are clickable and will open a model breach log for the model breach chosen.
- 59. CHAPTER 4 - DARKTRACE MODEL BREACHES 60 MODEL BREACH ALERTS IN THE THREAT TRAY 61 OPENING THE MODEL BREACH LOG 62 MODEL BREACH LOG OPTIONS AND FILTERS 63 ENTRIES IN THE MODEL BREACH LOG 64 UNDERSTANDING WHYA MODEL BREACH WAS CREATED 66 UNDERSTANDING EXAMPLE MODEL BREACH LOG ENTRIES 67 ACTIONS FOR MODEL BREACH LOG ENTRIES 68 EXPLORING THE MODEL BREACH EVENT LOG 70 MODEL BREACH ALERTS MODEL BREACH LOGS DARKTRACE MODEL BREACHES
- 60. 60 Model breaches have a behavior category and an overall score from 0-100%. Behavior categories are high level filters that allow an operator to focus in on specific levels of severity or behavior. There are four categories for model breaches: Critical, Suspicious, Compliance and Informational. The score can be used to filter on a sliding scale; where a yellow line and icon indicate a low score and red a high score. The score can be a useful way to prioritize within a behavior category - for example, starting with “critical” alerts and investigating from highest to lowest score before moving on to “suspicious”. The information displayed on the tile will change depending on how model breaches are grouped. If model breaches are grouped by device or user, the highest category and highest score of the underlying model breaches for the device will be displayed. For more information about other filter options available, please see Filtering Alerts with Behavior Categories, Filtering Alerts with Basic Filters, and Filtering Alerts with Advanced Filters. What are Model Breaches Darktrace models are a logic framework that allows operators to interact with the output from ‘pattern of life’ and anomaly classifiers. Models are primarily used to identify and alert on anomalous and potentially malicious behavior. When conditions for a model are met, this creates a model breach and can trigger an alert or action. AI Analyst already investigates everymodel breach that occurs on the system and reports only the most interesting activity as incidents. Users who wish to dive down deeper and investigate specific behaviors after investigating AI Analyst incidents can move to the model breach view of the threat tray. Threat Tray When the threat tray is switched to model breach view, model breach alerts appear as tiles. Each tile will list the number of model breaches that have been grouped together. The total number of model breach alerts in the tray (after filters) is displayed on the left. DARKTRACE MODEL BREACHES
- 61. 61 Hover over a tile to open a tooltip with more information about the model breaches or devices that were grouped: • Ifsorting bydevice oruser,the hoverwill showthe names ofmodelsthatweretriggered and the time that the model breach occurred. • If sorting by model, the names of the network or SaaS user devices that triggered the model breaches are listed with the time that the model breach occurred. If the device or user is subject to an active or pending Darktrace RESPOND action at the current time, a Darktrace RESPOND icon - a - will appear beside the device name on the tile. The device name is highlighted green if the action is currently active or orange if currently pending. Each entry in the tooltip is clickable to open a model breach log focused on only that one occurrence. If the tile itself is clicked, a model breach log with all grouped model breaches is opened instead. The next step is to understand the model breaches and the log itself. Model breaches can be grouped in a number of different ways - this is controlled by the Sort By option in the filter panel. There are three options: • Devices groups model breaches by device. • Models groups model breaches by the model that was breached. • Users groups model breaches by the credential associated with the device (if applicable) at the time the model breached. It also restricts the results returned to just model breaches for devices that had a credential associated within the timeframe selected. Within each option the results can be ordered alphabetically, by score, time, quantity and number of user comments. When grouped, each tile will show the highest score and most severe behavior category for the underlying alerts. Individual Tiles The information displayed on the tile will change depending on how model breaches are grouped. Tiles will always display the highest underlying category, highest underlying score, number of grouped model breaches and the number of comments made by users on underlying model breaches. • If sorting by model is chosen - indicated by the exclamation-triangle icon - the name of the model that was triggered is shown on the tile. • If sorting by user (credential) is chosen - indicated by the user user icon - the credential that was associated with the device when it triggered the model breach is displayed. MODEL BREACH ALERTS IN THE THREAT TRAY
- 62. 62 In this example, the log has been opened from a threat tray tile for the device “SaaS::Dropbox: [email protected]”. The log has opened filtered on that specific device. If a model breach log is opened from a tile grouped by device, it will open focused on the device. If alerts are grouped by model, clicking a tile will open a model breach log focused on the individual model. • A model breach log filtered on a device will displaythe device name and type in the top left as a heading. Click the device to change the visualizer focus to the device. • A model breach log filtered on a model display the name of the model as a heading. If enabled in account settings, the model description will appear below. Collapse the description using the angle-up arrow icon. Underneath is the time range for model breaches to be included in the log. The default range is taken from the current threat tray filter but can be altered using the time selectors. Thelogcanalsobefilteredtoshowonlyunacknowledgedmodelbreaches,onlyacknowledged model breaches, orboth states ofmodel breach. Bydefault, acknowledged alerts are removed from the returned results. Most investigation workflows include acknowledging an alert after it has been investigated. For a device, it can be helpful to review anomalous behavior already investigated by other analysts when trying to understand the background to a more severe model breach. Model Breach Logs Models are primarily used to identify and alert on anomalous and potentially malicious behavior. Models can also be used to profile a device, assign tags, highlight misconfigurations or trigger autonomous responses from the Darktrace RESPOND framework. Model breach logs contain a list of model breaches for a model, a device or a subnet over a chosen time window. Each entry in the log is an instance where the criteria for a model were met by a entity in your digital environment. Reviewing the model breach log for a device can, for example, be valuable in understanding the low-level anomalies that it displayed before a significant incident. Similarly, reviewing the model breach log for a compliance model is a simple way to view all non-compliant devices. Breach Log Starting from the threat tray, click on one of the breaches to open the Breach Log. The breach log can be opened from any location - including from a Cyber AI Analyst incident - where the exclamation-triangle icon appears. OPENING THE MODEL BREACH LOG
- 63. 63 ICON DESCRIPTION filter Add/remove custom filters Focus the log on a specific device, model breach ID or metric with custom free text or Regex filters. ellipsis-v Additional actions Open a dropdown with additional actions. check-double Acknowledge All Clicking this icon will acknowledge all model breaches currently in the log. Acknowledging model breaches removes them from display by default - it is a good way to indicate that an alert has been successfully investigated. This option appears under ellipsis-v Additional actions. undo Unacknowledge All This icon will only appearwhen the log is filtered to show “Acknowledged” model breaches. On click, it will unacknowledge all model breaches currently in the log. This option appears under ellipsis-v Additional actions. comment-alt-check Acknowledge All and Comment Clicking this icon will acknowledge all model breaches currently in the log and add a comment to all those acknowledged. This can be helpful if, for example, a custom model developed by a user has over- triggered alerts. This option appears under ellipsis-v Additional actions. comment-alt Add Comment to All Add the same comment to all mode breaches currently returned in the breach log. One Click Defeats Defeats are a way to control model behavior without affecting automatic updates from Darktrace analysts. A detailed description of defeats and their purposes is covered in the guide to the Model Editor (Model Defeats). Users with appropriate permissions (Edit Models) will see a toggle at the top of the log to “Add model defeats”. When enabled, a remove minus-circle icon will appear beside every field in the model breach entry. To add a defeat, click the blue icon beside the desired value. A popup will appear describing the change to the model. Confirm to add the defeat. Log Options Above the log entries are a series of filters and actions. These options are particularly useful to filter the log when there are many model breach entries returned. MODEL BREACH LOG OPTIONS AND FILTERS Some options will only appear in a specific mode. ICON DESCRIPTION toggle-off Add Model Defeats Defeats are a way to control model behaviorwithout impacting automatic updates from Darktrace analysts. One click defeats allow users with the “Edit Models” permission to quickly exclude specific conditions from triggering a model breach. A detailed description of defeats is covered in the guide to the Model Editor (Model Defeats). This option only appears if the model breach log is filtered to a single model. chart-area View breaches graphically Clicking this icon will open a graph to the right of the log of model breach score against time. The timeframe will reflect that for the log. The device/model, score and time are displayed in hover. exclamation-triangle View model This icon opens the Model Editor interface focused on the model. The model editor interface is introduced in The Model Editor. This option only appears if the model breach log is filtered to a single model. comment-exclamation Only show discussed Users can comment on model breaches to provide context or indicate to other users they are working on the alert. Comments remain within the Threat Visualizer interface or any configured alert outputs - to discuss a model breach with Darktrace analysts, please use Ask the Expert or the Darktrace Customer Portal. This option will only be displayed if model breaches in the list have comments.
- 64. 64 Underneath the model breach ID is the time at which the model breach occurred. Entry headings The main part of the log entry includes key information about the device and model breach. • If the model breach log is filtered on a specific model, each log entry will display the device that triggered the model breach at the top. Hover over the name of the device for a summary tooltip with basic information about the device. Click the device name to change the visualizer focus to the device. • If the model breach log is filtered on a specific device, each log entry will display the name of the model that was triggered. Click the model name to open the model editor interface for the chosen model in a new tab. • If the model breach log is filtered on a subnet or a user, both the model name and the device that triggered the model breach are displayed. IfthedeviceoruserthattriggeredthemodelactionissubjecttoanactiveorpendingDarktrace RESPOND action at the current time, a Darktrace RESPOND icon - a - will appear beside the device name on the entry.The device name is highlighted green ifthe action is currentlyactive or orange if currently pending. Threat Behavior Category Behavior categories are high level filters that allow an operator to focus in on specific levels of severity or behavior. There are four categories: Critical, Suspicious, Compliance and Informational. Categories are used across both AI Analyst and Darktrace models. The model breach category appears under the model or device name. Please see Filtering Alerts with Behavior Categories for more info on categories. Log Entries Model breach logs contain a list of model breaches for a model, a device or a subnet over a chosen time window. Each entry in the log represents an instance where a device performed activity that met the criteria of a model and triggered a model breach. In this example, the log has been opened from a threat tray tile for the model “Anomalous Connection / New or Uncommon Service Control”. The log has therefore opened filtered on that specific model. ENTRIES IN THE MODEL BREACH LOG Entries are sorted chronologically with newest first. The colored bar on the left indicates the severity of the model breach on a gradient from yellow (low) to red (high). In this case, the model has a medium severity, Next to the bar is the model breach ID - this numeric ID is a unique reference to this model breach in this threat visualizer instance. Click the ID to copy a shareable link to the model breach to the clipboard. In Unified View environments, model breach IDs are prefixed with a number to indicate the source master.
- 65. 65 AI Analyst Incidents AI Analyst investigates every model breach that occurs on the system and reports only the most interesting activity as incidents. If a model breach has triggered an AI Analyst incident, this can be quickly accessed by clicking the “c Review AI Analyst Incident” text that appears on the entry. Darktrace RESPOND Actions Certain models can also trigger Darktrace RESPOND actions; if a model breach has triggered an action, “a Darktrace RESPOND triggered” will appear on the entry. • If this text is highlighted green, the triggered action is currently active. • If this text is highlighted orange, the triggered action is currently pending - click to access the pending actions and confirm. • If this text is shaded grey, the triggered action has expired. Click this text to open the Darktrace RESPOND Actions window filtered to only actions triggered by the chosen model breach.
- 66. 66 Not all SaaS Admin or DCE-RPC Requests will have met the model criteria - models have additional restrictions that the activity must meet. For example, the model may be looking for unusual connections from ports other than 443 or SaaS activity from an ASN that is 100% unusual. If there are criteria which were not included by the model creator in the main info section, a “Show More” box will appear. This box contains details of these extra criteria that were met by the activity. UNDERSTANDING WHY A MODEL BREACH WAS CREATED Each log entry gives context as to why the device activity met the model criteria. In bold is the activity (“metric”) that the device performed that caused the model breach to be triggered. Forexample,thiscouldbeaconnection,adatatransferoveracertainsize,aSaaSAdminaction, or any activitywhich is considered new or unusual in the context of the devices’ ‘pattern of life’. Continuing the example of “Anomalous Connection / New or Uncommon Service Control”, the device performed a DCE-RPC Request that met the requirements of the model. In this example, the SaaS user device performed a SaaS Admin action that met the criteria. Click the words in bold to open a graph of that metric for the device over time. Metrics and Filters Underneath the key metric is furtherinformation about the activityand criteria it met to trigger the model breach. This information is useful context for an analyst to understand the activity and potentially why the activitywas anomalous. For example, it is helpful to know the resource that was changed by the administrative action in the SaaS environment or the DCE-RPC operation that was performed. The information included is chosen when the model is created (“display fields”). Therefore, the amount of information can vary greatly between models. Some models may look for multiple types of activity so these elements may appear more than once on a single log entry. If workflow integrations that allow lookups for external IPs and hostnames are enabled (such a VirusTotal), a exclamation-circle pivot icon will appear for these entries.
- 67. 67 Taking all the sections discussed already together, we can see that the device “vem01. ad.holdingsinc.com” performed a DCE-RPC request containing a “CreateServiceW” function to port 49669 using the credential “administrator”. Using the additional model criteria, we can see this was 100% unusual for the device. This activity triggered the “informational” category model “Anomalous Connection / New or Uncommon Service Control”. AI Analyst subsequently investigated and raised an incident for “Suspicious DCE-RPC Activity”. This activity was linked with multiple new and unusual credential usage on the same device, suggesting a wider incident. Worked example - SaaS UNDERSTANDING EXAMPLE MODEL BREACH LOG ENTRIES Worked example - Network Performing the same process on the SaaS example, the device “SaaS::Dropbox: benjamin. [email protected]” performed a “MemberTransferAccountContents” action on another user “[email protected]” in Dropbox. Although the ASN and IP for the action are not unusual, it is outside the ‘pattern of life’ for the user to perform admin actions and this is the first time this user has performed this specific action at all. In conclusion, the behavior suggests they may be trying to elevate permissions or access resources they are restricted from and has triggered the “informational” category model “SaaS / Unusual Activity / Unusual SaaS Administration”. AI Analyst subsequently investigated and raised an incident for “Possible Hijack of Dropbox Account”.
- 68. 68 OPTION DESCRIPTION list View model breach event log The model breach event log is a filtered event log, similar to the device event log introduced in Understanding the Device Event Log. The log contains only the activity that met the model criteria and caused a model breach to trigger. eye Analyze this model breach One click analysis is a quick way to understand the events that triggered the model breach. Clicking the icon will open an event log with the events that triggered the model breach and a graph displaying relevant metrics that the model itself was looking for. check / times Acknowledge / Unacknowledge this model breach Acknowledging model breaches removes them from display by default - it is a key part of many investigation workflows. Click this icon to acknowledge a model breach. If the model breach has already been acknowledged, hover the icon to see the userwho acknowledged it and when, or click to unacknowledge. thumbtack Pin this model breach Pinning a model breach means it can be retrieved at a later date from the thumbtack pin icon in the bottom left of the threat tray. Click again to unpin the model breach. Pinned model breaches are specific to each user but will persist between sessions (requires local storage). filter Filter graph by this model breach When the model breaches in the log are displayed graphically, this filter allows just model breaches for the chosen model to be displayed. This option will only be shown if the graph is open. ellipsis-v Additional actions Open a dropdown with additional actions. These advanced options are described below. Once the reason for the model breach is understood, a number of actions and further investigation steps can be taken. • On the body of the entry, the “a Launch RESPOND Action” button appears for eligible device or user types. Click to launch a manual action against the device that triggered the model breach. See Manual Darktrace RESPOND Actions for more information on triggering these actions. ACTIONS FOR MODEL BREACH LOG ENTRIES Each entry also has a series of actions and options on the right: OPTION DESCRIPTION search View this model breach in visualizer This icon changes the focus of the main visualizerworkspace to the device that triggered the model breach at the time of the model breach. It is one of the ways to access the device investigation tools introduced in Focusing on a Device. comment Discuss this model breach Users can comment on model breaches to provide context or indicate to other users that they are working on the alert. Comments on a model breach that triggered an AI Analyst incident are also pulled through to the incident discussion. Comments remain within the Threat Visualizer interface or any configured alert outputs - to discuss a model breach with Darktrace analysts, please use Ask the Expert or the Darktrace Customer Portal.
- 69. 69 Advanced Options OPTION DESCRIPTION empty-set Ignore any future breaches… This option adds the device to a list, preventing it from ever triggering another model breach for the model. For more information, please see Other Model Tabs for more information. cloud View this model breach in the Platform Accounts Console The Darktrace Platform Accounts Console (formerly SaaS Console) is a purpose built interface for investigating SaaS and cloud user behavior. This icon opens the equivalent model breach in the Platform Accounts Console to continue investigation there. exclamation-triangle View Model in Model Editor This icon opens the Model Editor interface focused on the model. The model editor interface is introduced in The Model Editor. sitemap View MITRE ATTCK mappings for this model breach Models maintained by the Darktrace analyst team have been mapped to the MITRE ATTCK framework where applicable. This mapping is a valuable tool to understand coverage and for teams with internal playbooks for how to address each technique. Click to open a window listing the mapped techniques. info Explain metrics used in this model breach The metrics and filters of a model define the activity the model is looking for. When these criteria are met, the model breach is triggered and the criteria are displayed on the log entry in the format “Hostname google.com” or “Source has tag Antigena All”. To understand what these metrics and filters are looking for, click this icon to review definitions written by Darktrace analysts for metrics and filters relevant to the model breach. clipboard Copy to Clipboard Copies the breach details to the clipboard including the device, the model breach display fields and a link to the model breach.
- 70. 70 Investigate a Breach Log Entry The investigation process for model breaches is very similar to AI Analyst investigations: 1. Understand the activity that caused the alert 2. Focus on the device that triggered the alert 3. Gather context about the way it behaves 4. Deep dive into detailed metadata 5. Action the alert internally if necessary 6. Acknowledge the alert AI Analyst performs a significant amount of these actions for the user and presents the information as part of the AI Analyst incident. For model breaches, these steps must be performed by moving through logs and investigation dialogs in the Threat Visualizer interface. Many of these features such as the device event log and device summary have already been discussed in detail and should be familiar. To start, open the list model breach event log from the breach log entry. Model Breach Event Log The model breach event log is a filtered event log; the log contains only the activity that met the model criteria and caused a model breach to trigger. For example, for a model breach relating to unusual SSH connectivity, the model breach event log might display a single anomalous SSH connection (or possibly more than one). In contrast, fora model breach relating to excessive HTTPerrors orport scanning, the event logwill display far more events, because for these types of behavior it is a number of events in combination that all contribute to the detection of an anomaly. EXPLORING THE MODEL BREACH EVENT LOG For most models, the event log will contain a small number of entries that are relevant. The following actions are useful to understand this activity better: • For events or notices, click the info-circle info icon to open a detailed pop-up. • For connections, click the arrow to see details of the connection. Use the arrow-to-bottom packet capture functionality to create a replayable version of the connection at a packet level. • Use the caret-down arrow icon to pivot to the Advanced Search interface to see detailed metadata about the entry. The model breach event log is very similar to the device event log and is easy to navigate if the latter is already understood. The filter options used in the model breach event log are the same as the device event log (see Filtering the Device Event Log). The investigation workflow for model breach event logs also mirrors that of device event logs and is covered in detail in Using the Device Event Log, Types of Event in the Device Event Log, Investigating a Connection in the Device Event Log and Investigating SaaS Activity in the Device Event Log. The next step, as with AI Analyst investigations, is to nowfocus on one or more key devices that triggered the model breach. Click “search View this model breach in visualizer” from the breach log entry to focus the workspace on the device and investigate its behavior as described in Focusing on a Device.
- 71. EXPLORE MODE 82 FILTERING THE EXPLORE WORKSPACE 84 ADDING AND REVIEWING TAGS 79 COMMONLYAPPLIED TAGS 80 DYNAMIC THREAT DASHBOARD 75 ASK THE EXPERT 77 CREATING PACKET CAPTURES 78 EXTERNAL SITES SUMMARY 72 EXTERNAL SITES SUMMARY FOR IPS AND HOSTNAMES 73 EXTERNAL SITES SUMMARY FOR SAAS ACTIVITY 74 EXTERNAL SITES SUMMARY ALTERNATIVE APPROACHES APPLYING TAGS EXPLORE CHAPTER 5 - OTHER INVESTIGATION TOOLS CYBER AI INSIGHTS REPORTS 86 EXECUTIVE THREAT REPORTS 88 REPORTING
- 72. 72 The timeframe for alerts and lists of devices or users is taken from the current time range of the threat tray. Rarity Tab The rarity graph tab reports how common the external endpoint is in the context of network behavior or global SaaS activity over time. Endpoints on the “Trusted Domains” list will always be reported as 0% rare. Location Tab For IPs and hostnames, the locations tab displays the approximate location of the external host on a map usingASN geolocation data. ForSaaS activity, the locations tab instead displays the approximate geolocation for all IP addresses that have performed SaaS activities for this user. In both cases, the ASN for the IP under investigation will pulse to highlight its location. EXTERNAL SITES SUMMARY External Sites Summary External sites summaryprovides statistics on the historic interaction between internal devices and external endpoints. The summary can appear in two formats, depending on how it was launched. There are three tabs - information, rarity and location. To open the external sites summary, click the globe-americas globe icon from the omnisearch bar or the external-link-alt external link icon in event logs. Most frequently, external sites summary is launched from omnisearch or connection event logs. In this scenario, it will provide statistics on internal devices that have connected to the external location and the general rarity of the location in the network. If external sites summarywas instead launched from a SaaS or cloud action, it will visualize the relationship between the ASN / IP and the SaaS user from the event. Information Tab The external sites summarywill open on the information tab to displaystatistics on the external endpoint and interaction with internal devices. The contents of the information tab differs when the summary is opened from connectivity information or from SaaS activity. Click on anylocation markerto see the associated IPaddresses, theASN and - forSaaS activity - the frequency at which the activities were performed. Both the ASN or IP in the tooltip can be clicked to launch event logs. Locations for SaaS user activity are also colored in this mode to display rarity: light blue locations are observed frequently for the user, dark blue locations rarely.
- 73. 73 ICON DESCRIPTION chart-pie View graph This icon populates the panel to the right with a chart breaking down the ports that the device used to contact the external location. exclamation-triangle Open device model breach log Opens a model breach log focused on the device. Model breach logs are covered in more detail in Exploring the Model Breach Event Log. search View device in visualizer Switches the focus of the main workspace to this device. Focusing on a device is covered in more detail across a series of articles, introduced in Focusing on a Device. When the summary is focused on network connections to and from the external location, the hostname or IP appears as heading in the top left. The first time the location was seen in connections observed by Darktrace is also displayed. This will persist between tabs. EXTERNAL SITES SUMMARY FOR IPS AND HOSTNAMES If the summary is focused on an external IPs, a section will appear with related hostnames that have been associated with the IP in DNS queries observed by Darktrace. If the summary is focused on a hostname, the IPs seen in DNS will instead be displayed. New external sites summary windows can be opened for these related IPs and hostnames using the external-link-alt external link icon. On the right is a list of unacknowledged, potentially uninvestigated, alerts where the external location was involved in the activity that triggered the model breach. Click the exclamation-triangle triangle icon to open the model breach log. Underneath the related IPs or hostnames is a list of internal devices that have been observed connecting to the external location. The panel on the right will not populate until a device has been chosen using the chart-pie chart icon.
- 74. 74 ICON DESCRIPTION chart-pie View graph This icon populates the panel to the right with a chart breaking down the activities the user performed when they connected to a SaaS service from the IP orASN selected. exclamation-triangle Open device model breach log Opens a model breach log focused on the user device. Model breach logs are covered in more detail in Exploring the Model Breach Event Log. search View device in visualizer Switches the focus of the main workspace to this device. Focusing on a device is covered in more detail across a series of articles, introduced in Focusing on a Device. SaaS When the summary is opened from SaaS or Cloud activity, the information displayed is focused on the combination of user and external location. This user and IP/ASN pair appears as heading in the top left. EXTERNAL SITES SUMMARY FOR SAAS ACTIVITY The summary section on the left contains information about the external IP that was used to perform SaaS activity, including approximate geographic location and rarity in the context of the network. On the right is a list of unacknowledged, potentially uninvestigated, alerts where the external location was involved in the activity that triggered the model breach. Click the exclamation-triangle triangle icon to open the model breach log. The bottom right displays a summary of activity the user has performed from the same ASN overthe last month in chart-format.This activityis grouped into high-level categoriesforclarity. On the left are other users who have connected to a SaaS service using the same ASN or IP. The activity chart can be switched to one of these other users by clicking the chart-pie chart icon. Changing the filter between ASN and IPwill also change the chart.
- 75. 75 • Free text searches are converted to filter terms upon pressing return. • Typing additional text and pressing return constructs a second filterterm. This process can be continued to add additional filters to narrow results down. Each subsequent filter is AND-ed to the previous ones. • Filters can be removed by clicking the “x” in each “pill” in the search bar. The contents of the dashboard can be globally filtered by the search bar on the top right. Search Bar The search bar allows for powerful filtering by multiple search terms. Please note, the Dynamic Threat Dashboard is now deprecated in 6.1 and will no longer be available by default on deployments created on of after this Darktrace version. Existing environments will continue to have access to this page. Accessing the Dashboard The Dynamic Threat Dashboard view dashboard can be accessed from the main menu, or navigated to directly from the URL. It provides a full screen interface for viewing model breaches and key information for each breach. This screen is intended for extremely rapid triage with a minimum of interaction. Note that it will scroll through incidents if left unattended which can be useful on SOC TV display screens. This page allows for the quick sorting, viewing, and acknowledging of breaches for triage purposes. If a breach requires additional investigation, the user can pivot back to the 3D View to view further information. Selections flow from left to right across the dashboard, and keyboard arrow keys can be used for navigation. DYNAMIC THREAT DASHBOARD
- 76. 76 Breaches Panel The panel lists individual breaches for the selected device ormodel.The entries are sorted bybreach score, displayed in the radial icons. The entries will be labelled with either the name of the model that breached (in device view), or the name of the device that breached the model (in model view), and the number of other breaches for that model or device. Each breach entry has buttons to acknowledge or filter. Clicking the filter button will populate the search bar with a filter term to match the other breaches for that model or device. All model breaches returned by the filter can be acknowledged using the “acknowledge filtered breaches” button in the top right. Automatically produced filters can be combined like any other filter within the search bar. The filter can be removed by clicking the x beside the filter term in the search bar. Left-hand Panel This panel provides the top-level navigation for breach information. The selector icons in the title bar switches between model, device and user grouping. Selecting an entry populates the breaches panel with the breaches for that model, device or user. In model grouping the panel lists the models that have breached during the specified time frame, sorted by total score for that model. Each entry includes either the time of breach (for models with only one breach) and the count ofthe numberof breaches forthe model. In device grouping, the panel lists the devices that have breached models during the specified time frame, sorted by total score for that device. Each entry includes either the time of the breach (for devices with only one breach) and the count of the number of breaches for the device. In users grouping, the panel lists user credentials that were associated with model breaches within the specified time frame. Not all model breaches will have an associated user credential; this panel will not encompass all model breaches, only those where a credential can be associated. Each entry includes either the time of the breach (for users with only one breach) and the count of the number of breaches for the user.
- 77. 77 What is Ask the Expert Ask the Expert allows for the creation of incidents which can be submitted to Darktrace analysts for feedback. Creation of an incident is done within the Threat Visualizer by entering text and dragging relevant data into the creation window. Submitted incidents become open questionswhich can beviewed, and commentedwith updates both byDarktrace analysts and local user accounts. Questions have associated statuses and function as “tickets” that can be closed when resolved. Ask the Expert is available from the Main Menu, under Help – the “Ask the Expert” menu item allows for the creation of new questions, and the “View Questions” menu item allows for the viewing of existing questions and their statuses. Viewing Questions The “View Questions” pop up lists all previously submitted questions with their timestamp, owner, and status. Possible question statuses are: • New • Responded • Closed The toolbar in the popup allows forfiltering and highlighting of the incidents bytheir attributes, as well as searching by author or name. Clicking on a question opens a new popup that allows the viewing of Darktrace responses and the addition of new comments. Questions can be closed or deleted – closing will mark the status ofthe question as closed and resolved,without actuallyremoving from the question list. Details Panel The right-hand side panel displays summary information forthe selected breach. This information is designed to allow for quick decision making about the events in question. The top section displays overall threat score and information about the device in question. The sections below contain dynamically populated content showing connections and visualizations that contributed to the breach. The most relevant information will be automatically displayed. If the displayed information is inconclusive, clicking the “Investigate” button will navigate to the 3D View with the device, time, and breach event log for the current breach selected. ASK THE EXPERT
- 78. 78 Source: This shows the source IP address pre-populated with the value from the event which has been selected. Target: This shows the target IP address pre-populated with the value from the event which has been selected. From: The start time of the packet capture. This is pre-populated from the event which has been selected. The start time can be altered by clicking on the gray ‘From’ box. To: The end time of the packet capture. The end time can be altered by clicking on the gray ‘To’ box. The time range defaults to Darktrace’s best guess as to which range will capture the connection of interest (for example if it knows that the connection ended at a certain time). Create: This option starts the packet capture. Cancel: This option closes the window. Use Connection: This option is only available when creating a packet capture for an event. Clicking this will further filter the selected packets by the connection. The time fields default to the start and end second of the connection selected and the source and destination ports are as specified in the connection. Viewing the PCAP File The file can be viewed by clicking the PCAPoption from the main menu. PCAPs can be viewed in the Threat Visualizer interface or downloaded for use in external tools. CREATING PACKET CAPTURES Packet Captures Packet Captures can be generated from connections seen in the Darktrace Threat Visualizer for further investigation. There are two ways of viewing raw packets (in PCAPformat): firstly, by creatingthe PCAPfromthe dropdown nextto anyconnection inthe device event log, secondly by creating it from the device event log when a device is selected. If you have a distributed deployment, raw traffic is stored on the probes, which can cause a time delay in retrieving PCAPs. Any PCAPs created are then saved on the master appliance. Be aware that PCAPs are truncated due to storage requirements so you may not see the entirety of the data flow between the devices in question especially where large amounts of data (e.g., files) are transferred. However, the PCAP typically gives you enough information to get an idea of what is happening. Creating Packet Captures For advanced users who wish to access raw packets relating to device communications there are options within the device event log for creating a packet capture file. Tip: If creating a packet capture file for a single device fromthe device event log,the Source andTargetfields are not shown. The field shown instead is ‘IP’ (referring to the IP address of the device) – no destination is specified.
- 79. 79 ADDING AND REVIEWING TAGS Tags can be managed in the tags manager, accessible from both the Platform Accounts Console or the Threat Visualizer, or via the API (/tags). Select tags Tags from the Main Menu to open the manager. A list displaying all current tags will appear, optionally filterable with the search. In the top right, the link link icon pivots to Explore Mode in Explore Tags mode. To review a tag, click on it. A summary page will specify (where applicable) the devices tagged, models that apply the tag, models dependent on the tag for breach logic and models that have the tag applied to them. All models and devices or users can be clicked. To further refine the list, the filter filter icon can be used to add an additional tag, filtering only by models/devices that share both tags. To edit or delete a tag, click the pen edit icon beside the tag name. Tags offer a simple labelling system for network devices, credentials and users detected in external platforms (SaaS users) which can be used to identify important resources, control eligibility for Darktrace RESPOND and alter model logic. Tags can be automatically applied as a model action, used in model defeats to exclude devices, or factored into model logic. For users detected in external platforms (SaaS users), tags may be also be applied automatically by the module to identify the roles assigned to the user - these tags are identified by “(CG)”. A small number of tags are restricted for system use only and are used to indicate devices excluded from monitoring or behaving erratically. See Commonly Applied Tags for an explanation of commonly applied tags and their purpose. Viewing and Editing Tags Add a New Tag To add a new tag, click dts-tag-plus Add Tag from the Tags Manager. When creating a new tag, a description can be added to help identifythe purpose ofthe tag. Selecting a color assists identifying the tag when assigned to a device. Click Save. The new tag will appear on the tag manager. Tags can also be created via the API. Tag a Device In the Threat Visualizer, tags can be added when a device is focused upon from the global omnisearch or from an event log. The tags associated with the device are listed below the search. Tags with an hourglass-half hourglass icon indicate an expiry time is associated with the tag. Click the plus plus icon to open a dialog to add an additional tag. Optionallyturn on “Add tag with expiry” to include an expirytime when the tag is applied. In the pop-up window, locate the tag and click on it to add to the device.
- 80. 80 COMMONLY APPLIED TAGS The ThreatVisualizersupports a flexible label system called Tags to allowanalysts to be able to rapidly label and refer to groups of devices within the platform. One use case for this feature is to enable monitoring of high-risk users or devices such as departing employees or key assets. Tags can be applied manually, applied automatically by models as a breach action or applied as part of the Darktrace mathematical modeling. The following tags are commonly used within the Darktrace platform: TAG DESCRIPTION Admin Device will be excluded from common admin related models (for example, unusual admin session models). Security Device Device is a known security device which can affect the behavior of other devices by making thousands of inbound connections - excludes it from related models for such activity (for example, network scanning models). Exclude Data Transfer Device should not breach on unusual data transfer models (for example, backup servers). Model Excluded Device will not breach any models, but its connections are still recorded and visible as normal. High Risk Device has breached a network scan or attack tools model in the past 48 hours. Active Threat Device has breached a Darktrace RESPOND/Network (Antigena Network) model (excludes Compliance models) with a breach score greater than 25% in the past two hours. Key User Device has authenticated using a key user account (requires configuration of key users in the corresponding model). Conflicting User Agent Device has been detected using at least three different user agents in individual connections within the last 4 minutes (for example, Linux, Windows and iOS). DHCP Relay Device has been identified to relay local DHCP requests to a DHCP server. If addingwith an expirytime, select the desired timewindowfrom the dropdown and then click Save changes to add the tag. When the device has manytags, these are collapsed and can be shown in a popup, searchable dialog by clicking the “+[#] tags” Scoped Tags Scoping is a special syntax that can be used to create groups of tags (or “scopes”). Scoped tags are mutually exclusive; only one tag of a specific scope can be present on a device at once. Attempting to add another tag from the same scope will replace the existing tag. For example, a device has the tag Team::Finance (which has the scope Team). If a user or model attempts to add the tag Team::Marketing to the device, doing so will remove Team::Finance. This is because the two tags have the same scope - Team - and only one tag from the Team scope can be present on the device at once. This can be useful when tags are used to indicate a status or membership of a group where it would not make sense to have more than one entry. For example, a set of tags could be created to describe the employment status of users: EmployeeStatus::AwaitingStart, EmployeeStatus::Current,EmployeeStatus::LeaverEmployeeStatus::Left. A user can move between these states but would never occupy more than one state. To create a scoped tag, use the syntax [a]::[b] when creating the label for the tag, where a is the scope and b can be any text. A double colon - :: - must be used as part of the tag label or the tag will not be scoped.
- 81. 81 TAG DESCRIPTION WSUS / SCCM A device is operating as a Windows Server Update Service (WSUS) / System Centre Configuration Manager (SCCM). A device with this tag is excluded from breaching on some common activity patterns such as unusual internal data transfers to new devices. This tag should be added automatically by the WSUS or SCCM Tag model but in some circumstances, it may not be possible to automatically detect the service, and the tag can be added manually. Inoculated Device Devices that trigger an inoculation breach receive an Inoculation tag for1 week. TAG DESCRIPTION Unique Clients This tag is applied to client devices which are unable to be assigned to a cluster by mathematical modelling due to having a unique fingerprint of network behavior. It is allocated by Darktrace’s machine learning and is part in of the clustering of devices into ‘peer groups’ or ‘similar devices’. This tag is applied by the system and not controlled by models. Unique Servers This tag is applied to server devices which are unable to be assigned to a cluster by mathematical modelling due to having a unique fingerprint of network behavior. It is allocated by Darktrace’s machine learning and is part in of the clustering of devices into ‘peer groups’ or ‘similar devices’. This tag is applied by the system and not controlled by models. Unusual Connectivity Excluded A device has performed such an anomalous volume of connections that it is no longer tracked for unusual connectivity, as its pattern is so erratic / high volume. Domain Authenticated Device has authenticated with a domain controllerwithin the last 0.5 days. Internet Facing System Device has received incoming external connections but is not tagged as a server (i.e. internet exposed device). Re-Activated Device A device was inactive for at least the past 4weeks and has re- appeared on the network. External DNS Device has performed an external DNS connection. No Device Tracking Devices within IP ranges that have no tracking will be tagged (requires configuration of the corresponding model). Devices with this tag will be excluded on unusual activity breaches. DNS Server Devices performing the functionality of DNS servers - will be excluded from models which look for unusual DNS activities. Mail Server Device was seen sending or receiving lots of email. Devices with this tag will be excluded from models which look for unusual volumes of emails sent.
- 82. 82 represented visually as concurrent connections in both directions may be observed at the same moment between numerous devices in the particular Subnet or represented by the specific Tag. On the Explore Tags and Explore Subnets pages respectively, tags and subnets are clearly labelled and color coded to enhance the user experience. Zooming in and out is possible in order to improve visibility. On the right-hand side of both the tag Explore Tags and cube Explore Subnets pages, there is a panel with a list of Connections and Components, which can be accessed by clicking on the respective title. Connections The Connections subsection gives a list of the visible connections together with information aboutthe average rate oftransferin MiB/s orKiB/s.These connections can befurtherexplored by clicking on them. Components The Components subsection gives a list of the visible Subnets and Tags and further information about the average rate of transfer in MiB/s or KiB/s. These components can be further explored by clicking on them. Refer to Filtering the Explore Workspace section for further information about exploring Connections and Components. The Explore function utilizes the same time selector as the main Threat Visualizer to adjust the point in time represented, and the increase window feature allows for expansion of the time window itself. Explore presents a cross-section of the network at a specific point in time, therefore it does not display real-time connection information. Using Explore Communication between subnets or tags is indicated by a dashed line, where dash length correlateswith the amount ofdata transferred, i.e. the shorterthe length and more numerous the dashes present in a connection, the more data transferred and respectively, the longer the length and less numerous the dashes present in a connection, the less data transferred. Opening Explore The Explore feature can be accessed from the Main Menu item Explore, where the user may select from tag Explore Tags or cube Explore Subnets. Alternating between Tags and Subnets is also easily performed within Explore itself. The pivot icon is also available in the main Threat Visualizer when investigating a specific Subnet, or from the Tag Manager. EXPLORE MODE LINE KEY Less data transfer. More data transfer.
- 83. 83 To return to previous levels of connection, click on one of the available options that appear in the top left hand side corner of the screen after Explore . This submenu represents the route taken to reach the currently observed Event Log. From either Subnets or Tags View, clicking on a particular line of connection (i.e. clicking on a visual dash connecting subnets or tags) will reveal much more detailed information about the chosen connection. While in this Device View mode, hovering over any of the icons representing various components provides relevant information such as name, vendor, mac address, operating system, type, subnets and tags. From this Device view, clicking further on a specific line of connection between two devices will open the Event Log on the right hand side ofthe page. The log forconnectivityconnection between the two devices is represented within the specified timeframe. The log includes time, date and connection direction. By hovering over the arrow, further information is available, including start time, source, destination, and protocol. The severity of any alerts generated by devices in a Subnet during the time frame is indicated by the color of the icon, where white indicates no breaches and a gradient from light yellow to red indicating severity. The Subnet coloris determined based on the highest scoring device of all breaches for all devices in that Subnet taking account for the last seven days. Tags can be customized in the main Threat Visualizer Tag Manager. Investigating A Device • WheninSubnetsorTagsView,hoveringoverasubnetortagwilldisplaykeyinformation. • When in Subnets View, hovering over a subnet will display the subnet’s name, the number of devices it encompasses and the number of tags applied to devices within it. • When in Tags View, hovering over a tag will display the tag’s name, the number of devices within that tag and the number of subnets that devices with the tag are part of.
- 84. 84 Average rate (KiB/s)/ Total size (MiB or GiB) If the Transfer Rate box is ticked, the option to search for connections based on the average rate of transfer in Kibibyte per second (KiB/s) is available. By using the slider, the workspace can be customized based on the transfer rate. The Subnets, Tags or Devices (depending on where this search is being performed) that are applicable will stay in the workspace. Items which do not match the criteria will disappear from view. In the same way, by using the same slider, the workspace can be customized based on total size of data transferred, in MiB (Mebibytes) or GiB (Gibibytes), which is displayed underneath the sliding pointer. Transfer Ratio If the Transfer Ration box is ticked, the option to search for connections based on the transfer ratio is available. The transferratio filters Subnets orTags on theworkspace bythe ratio of data uploaded versus that of data downloaded during the time frame. The left slider controls the downloaded amount and the right slider controls the uploaded amount. At the highest level, this controls the total amount of uploaded:downloaded between the two subnets. At a lower level, this ratio is on a device to device level. Where Subnets or Tags that fall within the slider bounds have connected to/been connected to other elements that do not fulfil the filter conditions, these elements will remain but will be greyed out. Other elements which do not meet the criteria and have not connected to these nodes will disappear. Filtering the Explore page When in Subnets or Tags view, on the right hand side of the screen where the Connections and Components can be explored, clicking on the filter icon next to Investigate a Connection will open a filter pane. Filtering will focus the workspace by removing connections that do not match the given conditions. The available filters: Connections Involving If the Connections Involving box is ticked, the “Search device” field underneath it will allow free text input to search for a device. Once text is inserted, this will remove Subnets or Tags from the workspace that do not contain the search text nor are in connection with the devices that contain the search text. Elements which are in connection with the devices that contain the search text but do not match the search will appear slightly faded. Filteringwith a search term is a helpful function in narrowing down a specific device ordevices and clearly observing their connections. FILTERING THE EXPLORE WORKSPACE
- 85. 85 Exclusive Tags To use Exclusive Tags, activate the relevant toggle on the main workspace. When enabled, the Exclusive Tags toggle restricts the connections visualized between tags. If a device has more than one tag in common with the device it is connecting with, when tags are exclusive, Explore will not render a connection between the tags that are shared between the devices. For example, if two devices (a b) are tagged with iOS device and iPhone and Exclusive Tags was disabled, the behavior of Explore would draw a connection between iOS device and iPhone and iPhone to iOS device to represent this communication. With Exclusive Tags, no connection line would be drawn between these shared tags. If device b is also tagged with NewDevice, exclusivetagswould renderthe connection between iOS Device and NewDevice and the connection between iPhone and New Device, but not the connection between the shared tags. Explore Layout The distribution of Subnets and Tags in the Explore screen dynamically updates to position connection events in the clearest format; initial locations are derived only from the communications observed during the time window. At the top left of the workspace are view toggles. Fixed Positions The Fixed Positions toggle locks subnet and tag nodes in place, preserving their location on the workspace when deep-diving into particular connection events and returning to the main overview. Once the Fixed Positions toggle is enabled, another toggle appears next to it - Allow Editing. If the toggle Allow Editing is enabled, the nodes can be individually dragged and dropped to alter their persistent position. This function allows nodes to be places according to the user’s understanding of the network layout. Each user maintains their own local layout.
- 86. 86 Report Options To generate a report, navigate to Cyber AI Insights Report in the main menu (Reporting Cyber AI Insights Report). A new window will open. The following configuration options are available. OPTION DESCRIPTION Time Period Accepts a time range for the report period. The actual date period covered will be displayed in the two boxes beside the selector. Reports can generated for any period of less than 1 year, data- dependent. Timezone Alters the timezone of the report to that specified. Estimated Incident Response Cost To produce an estimate of the savings generated by Darktrace RESPOND, provide the expected cost in the chosen currency (default USD) of a successful cyber incident to your organization. Analyst Hourly Wage To produce an estimate of cost savings created byAI Analyst investigations, provide the expected hourlywage of a cyber analyst in the chosen currency (default USD). Currency Select a currency for monetary fields. Include Human Response Data Information about response times to model breaches (time to acknowledgment) can be optionally included if acknowledgment is part of your organizational workflow. BehaviorVisibility Behavior categories are high level filters that allow an operator to focus in on specific levels of severity or behavior. There are four categories: Critical, Suspicious, Compliance and Informational. Select the categories to restrict data on the optional “Mean Time to Acknowledgement” page. Requires “Include Human Response Data”: On. Human Response Minimum Breach Score For operator acknowledgment statistics on the optional “Mean Time to Acknowledgement” page, set a minimum model breach score for response time to be calculated against. This allows acknowledgement time to be focused on high-level events. Requires “Include Human Response Data”: On. CyberAIInsightsreportscanbegeneratedwithintheThreatVisualizerandpresentanoverview of coverage, user engagement and value provided by your Darktrace deployment. The report displays currently deployed components, integrations, probes and modules against those generally available. The data contained in each report is specific to your organization and includes trends in processed network traffic, the categories of threat that triggered Darktrace RESPOND response and a breakdown of events detected by AI Analyst by threat stage. To measure user engagement, the average time-to-acknowledge for human operators is calculated across the timeframe. Reports can cover a single day or up to 12 months (data-dependent) and can be customized to include estimate costs savings from AI-augmented incident response and triage. Where applicable, reports will also include data on threat trends and response from Darktrace/Email. Please note, this data is restricted to the last 4weeks, regardless of overall report timeframe. CYBER AI INSIGHTS REPORTS CyberAI Insights reports can also be automatically generated and sent to recipients by email; this is configured on the System Config page. For more information on scheduling reports, please refer to Scheduling Automatic Report Generation.
- 87. 87 Generate a Report Once all desired options have been selected, click the Generate Report button to create the report.The generated reportwill appearwithinthe popupwindow,where it can be downloaded as a PDF. Previously generated reports and those over a larger timeframe can be retrieved from the Download Reports page (Reporting Download Reports). Users with the “Download My Reports” permission can review reports they have generated there. Users with the “Download All Reports” permission can review reports generated automatically or by manually all users.
- 88. 88 OPTION DESCRIPTION Report Period Accepts a time range for the report period. The actual date period covered will be displayed in the two boxes beside the selector. Reports can generated for any period of less than 1 year, data- dependent. Timezone Alters the timezone of the report to that specified. Model Tags Alters the report to include only model breaches where the model has one of the chosen model tags. Subnets Reports can be generated for a single subnet, or for multiple subnets. By default, all subnets are included. Multiple entries can be selected from the dropdown. Please note, enabling SaaS Report will clear this field. Filter Breaches Alters the report to include only unacknowledged model breaches (default), only acknowledged breaches or both acknowledged and unacknowledged. BehaviorVisibility Behavior categories are high level filters that allow an operator to focus in on specific levels of severity or behavior. There are four categories: Critical, Suspicious, Compliance and Informational. Select the categories to restrict included Model Breaches to only those that match the category filter. Minimal Report Generates only high level summary pages, excluding the detailed appendix. SaaS Report Restricts the content of the report to only SaaS user devices and SaaS breaches. The Darktrace RESPOND page is also restricted to RESPOND actions from platform environments such as Darktrace RESPOND/Zero Trust and Darktrace RESPOND/Apps only. Include Comments Includes any comments made by users or analysts in the detailed appendix. Send Report Via Email Emails the report to the users specified in the “Executive Threat Report Recipients” field. This field is configured on the Modules section of the Darktrace System Config page (Workflow Integrations › Report Scheduler › Executive Threat Report) Executive Threat Reports can be generated within the Threat Visualizer and present a simple visual overview of model breaches and activity in the network environment. The report is separated into a graphical representations of network traffic, model breaches and Darktrace RESPOND response and an optional detailed breakdown more suitable for advanced audiences. EXECUTIVE THREAT REPORTS Reports can cover a single day or up to 12 months (data-dependent) and can be customized to include extra details or restricted to high level information. Executive Threat Reports can also be automatically generated and sent to recipients by email; this is configured on the System Config page. For more information on scheduling reports, please refer to Scheduling Automatic Report Generation. Report Options To generate a report, navigate to Executive Threat Report in the main menu (Reporting Executive Threat Report). A new window will open. The following configuration options are available.
- 89. 89 Generate a Report Once all desired options have been selected, click the Generate Report button to create the report.The generated reportwill appearwithinthe popupwindow,where it can be downloaded as a PDF. Previously generated reports and those over a larger timeframe can be retrieved from the Download Reports page (Reporting Download Reports). Users with the “Download My Reports” permission can review reports they have generated there. Users with the “Download All Reports” permission can review reports generated automatically or by manually all users.
- 90. THE DARKTRACE CYBER AI ANALYST 116 FILTERING AI ANALYST INCIDENTS 117 AI ANALYST INCIDENTS IN THE THREAT TRAY 119 AI ANALYST INCIDENT OVERLAY 120 AI ANALYST INCIDENT EVENT SUMMARY 121 AI ANALYST INCIDENT EVENT ACTIONS AND COMMENTS 122 UNDERSTANDING THE AI ANALYST INVESTIGATION PROCESS 123 DETAILS OFAN AI ANALYST INCIDENT EVENT 124 TRIGGERED AI ANALYST INVESTIGATIONS 125 FILTERING MODEL BREACHES IN THE PLATFORM ACCOUNTS CONSOLE 105 MODEL BREACHES IN THE THREAT TRAY 107 FOCUSING ON A SPECIFIC MODEL BREACH 108 MODEL BREACH LOCATIONS ELEMENT 110 MODEL BREACH INVESTIGATION TABS 111 MODEL BREACH ACTIVITY TIMELINE TAB 113 TYPES OF EVENT IN THE TIMELINE 114 THE PLATFORM ACCOUNTS CONSOLE DASHBOARD 99 THE DASHBOARD MAP 101 THE PLATFORM ACCOUNTS CONSOLE THREAT TRAY 103 THE PLATFORM ACCOUNTS CONSOLE GETTING STARTED THE DASHBOARD MODEL BREACHES PROFILES CHAPTER 6 - THE PLATFORM ACCOUNTS CONSOLE 91 GETTING STARTED WITH THE PLATFORM ACCOUNTS CONSOLE 93 PLATFORM ACCOUNTS CONSOLE MAIN MENU 95 UNIVERSAL ELEMENTS 97 WHAT ARE USER PROFILES? 126 USER PROFILES 128 USER PROFILE LOCATIONS AND TABS 129 PROFILE TIMELINE AND MODEL BREACH TABS 130 FILTERING THE USER PROFILE TIMELINE 131 OTHER PROFILE TABS 132 OTHER FEATURES CYBER AI ANALYST EXECUTIVE THREAT REPORTS IN THE PLATFORM ACCOUNTS CONSOLE 134 ASK THE EXPERT IN THE PLATFORM ACCOUNTS CONSOLE 136
- 91. 91 The Platform Accounts Console is a specialized user interface for investigating anomalous activity and user behavior in and across SaaS and Cloud environments, surfacing the events and analysis from Darktrace/Apps, Darktrace/Cloud and Darktrace/Zero Trust modules in one centralized location. The console is powered by the Cyber AI Analyst and Darktrace’s unique ‘pattern of life’ anomaly detection; the interface is purpose built for monitoring and analysis in these environments whilst also maintaining existing workflows for operators already familiar with the Darktrace Threat Visualizer. Please note, the Platform Accounts Console is focused on administrative activity within Cloud environments. If you wish to extend visibility over network traffic in your virtualized infrastructure, please discuss the deployment of Darktrace virtualized sensors with your Darktrace representative. Introduction Many organizations use SaaS (Software-as-a-Service) solutions as part of their everyday workflow for file storage, collaboration, and centralized access control, or Cloud solutions for their virtualized infrastructure and RD. In many of these solutions, user interactions take place and organizational data is hosted in a third-party managed environment with a separate audit log and security interface; keeping track of alerts and activity across multiple SaaS and Cloud environments can be a challenge for many security teams. THE PLATFORM ACCOUNTS CONSOLE
- 92. 92 Access Organizations that have Darktrace DETECT coverage over network devices - whether through Darktrace/Network, Darktrace/Endpoint or Darktrace/Cloud - and a relevant Darktrace/Apps, Cloud or Zero Trust module can access the Platform Accounts Console from the main menu. Although the console is a dedicated interface for investigating model breaches and incidents in these third-party user environments, it does not remove user devices and alerts from the main Threat Visualizer interface. Users can continue to investigate alerts within the main 3D Visualizer user interface if desired. If Darktrace/Email is monitoring your organizational email domains and a relevant Darktrace/ Apps, Cloud orZeroTrust module is deployed, the PlatformAccounts Console can be selected from the main menu of the Email Console. Pivot points to Darktrace/Email are also provided throughout the user interface and the Email Console is available from the SaaS console menu for easy movement between the interfaces. A full Darktrace DETECT/Apps, Cloud or Zero Trust module is required for this access; account protection coverage will not provide access to the Platform Accounts console.
- 93. 93 GETTING STARTED WITH THE PLATFORM ACCOUNTS CONSOLE 3. Review the summary created by CyberAI Analyst for each event to quickly understand what each incident may involve. Understandhowtheeventsrelatechronologically,andifnecessary,reviewthe“Incident Links” element to understand why events have been grouped together. 4. Now, review the detailed event information for each event in more detail to gauge the involved activity and actor. Optionally click on the account to review the user profile and historic locations for user activity. 5. Proceed to investigate further. Recommended next investigation steps include reviewing the user profiles of involved users to identify unusual behaviors, reviewing relevant advanced search information, and reviewing any related model breaches. 6. Acknowledge each event, or the entire incident, when the investigation is concluded. Optionallycomment onthe incident eventsto recordthe results offurtherinvestigation and resolution for other users. exclamation-triangle Model Breaches AI Analyst alreadyinvestigates everymodel breach that occurs on the system and reports only the most interesting activity as incidents. Users who wish to dive down deeper and investigate specific behaviors after investigating AI Analyst incidents can move to the model breach view of the threat tray. A model is used to define a set of conditions which, when met, will alert the system to the occurrence of a particular event: Darktrace model breaches are the most fundamental alert type. A model can be formed of specific triggers, specific thresholds for ‘pattern of life’ anomaly or multiple combinations of the two. The severity of a breach is calculated from the priorityofthe device, the level of anomalyassociatedwith the breach, the priorityofthe model and the frequency of similar breaches. There are multiple entry points in the Platform Accounts console dashboard to begin a threat investigation workflow. Most workflows begin with the threat tray, displayed on the left of the interface. The tray view can be switched between displaying AI Analyst Incidents or two alternate Model Breach views. c AI Analyst AI Analyst incidents are an excellent place to start when investigating alerts for the first time in the Threat Visualizer. Incidents are only created for the most interesting and high priority activity observed by Darktrace. Incidents are created from AI-powered investigations into anomalies across your digital environment. Every time the conditions for a model are met and a model breach is created, AI Analyst investigates the activity and concludes whether it needs to be surfaced for human analysts to review. The results of this analysis is then grouped in incidents, prioritizing only the most relevant information for operators to review. Darktrace AI Analyst will be covered in more detail in The Darktrace Cyber AI Analyst. Darktrace AI Analyst incidents are visible in the threat tray - to view, click the c AI Analyst icon above the threat tray or the Number of Incidents statistic above the global map in the dashboard. Suggested Workflow from a Cyber AI Analyst Incident 1. Access the Platform Accounts console dashboard and switch the threat tray view to Darktrace AI Analyst. To do so, click the c AI Analyst icon above the threat tray or the Number of Incidents statistic above the global map in the dashboard. 2. Click the first incident in the list - this is the incident Darktrace AI Analyst considers the most critical for human review.
- 94. 94 6. Proceed to investigate further. Recommended next investigation steps include reviewing whether the user has any anomalous locations for access and activity, reviewing relevant advanced search information, and reviewing any related anomalies at the time or previously. 7. Acknowledge the model breach when the investigation is concluded. Optionally comment on the model breach to record the results of further investigation and resolution for other users. id-badge Profiles The profiles page provides an overview of relevant user devices created from Darktrace monitoring, as well as real-time feeds of actions performed and source locations for activity. Accounts will only be added to the profiles when activity is observed by the relevant DETECT module. Profiles are also grouped cross-platform where possible to give the fullest picture of user activity. Operators are more likelyto interact with individual profiles as part of an investigation workflow or when seeking further information on a specific user or platform. Threat investigation workflows do not generally start from this interface. Operators have many different preferences as to how breaches are sorted and the order in whichtheyare investigated;we recommendthat newoperators beginwiththe highest severity (score and behavior category) and work downwards. More information on model scoring and behavior categories will be provided in The Platform Accounts Console Threat Tray. Model breaches can be accessed from the threat trayin two modes: exclamation-triangle modelviewand user user view. Clicking the Number of Model Breaches statistic will also alter the threat tray to display model breaches. Suggested Workflow from a Model Breach When investigating an alert, a typical workflow will involve starting with summary information. As an example: 1. Access the Platform Accounts Console and set the threat tray to display model breaches in model view. To do so, click the exclamation-triangle model view icon above the threat tray. 2. Model breaches have a behaviorcategoryand an overall scorefrom 0-100%. Darktrace recommends beginningwith critical model breaches, startingwith the highest scoring. This will be the first element in the list. 3. First, clickthe model breach to displaythe relevant locations forthe activityon the map. Considerwhether these locations are unusual for the user in question. 4. Now, click the angle-right right arrow on the model breach element to open a timeline of activity. This will display relevant activities that triggered the model breach. Optionally toggle the timeline to show all activity for the user around the time of the model breach. 5. Click the exclamation-triangle breach log icon above the timeline to review details of the model and the exact triggers.
- 95. 95 tags Tags Manager Tags offer a simple labelling system for users detected in external platforms (SaaS users) which can be used to identify important users, display relevant contextual data and alter model logic. Tags can be automatically applied as a model action, used in model defeats to exclude devices, or factored into model logic. Refer to Tags in the Platform Accounts Console for more information. download Download Reports Allows Threat Intelligence reports and Executive Threat Reports to be retrieved. newspaper Executive Threat Report Executive Threat reports are high level, visual overviews of activity and model breach events. Refer to SaaS Executive Threat Reports for more information. Threat Investigation Interfaces Home The dashboard provides an overview of current alerts, visualized on a map of global user activity. For most workflows, the dashboard is the entry point for investigation. globe-americas Threat Visualizer If Darktrace/Endpoint, Darktrace/Cloud orDarktrace/Network are also deployed, a pivot to the main 3D Threat Visualizer interface will appear here. For more information on this interface, please see Introducing the Threat VisualizerWorkspace. envelope Email Console Pivots to the Darktrace/Email interface for investigation and autonomous actions on your email domains. Please see the documentation on Darktrace/Email for more information. search Advanced Search Opens the Advanced Search interface, where advanced metrics about all activity and events canbereviewedfordeeperinvestigation.RefertotheDarktraceAdvancedSearchintroduction for more information. PLATFORM ACCOUNTS CONSOLE MAIN MENU Users, Actions and Reporting id-badge Profiles The profiles page provides an overview of all SaaS and Cloud users detected by Darktrace, as well as real-time feeds of actions performed and source locations for activity. a Darktrace RESPOND Actions Presents currently active and expired actions taken by Darktrace RESPOND against users detected in external platforms and allows the actions schedule to be configured. Current and historic actions can be exported as a CSV. Refer to Reviewing Darktrace RESPOND Actions for more information. Models exclamation-triangle Model Editor A Model is used to define a set of conditions which, when met, will alert the system to the occurrence of a particular event. Refer to The Model Editor for more information.
- 96. 96 User Settings cogs Account Settings Change settings for the current account including changing password, enabling Accessibility Mode or registering the Darktrace Mobile App. System Configuration and Administration id-card Audit Log This page shows recent modifications users have made to data within the Darktrace platform, including model breach acknowledgements, comments, and changes to RESPOND actions. Successful logins and failed logins to the platform are also recorded here. users Permissions Admin The Permissions Admin interface allows user permissions and data visibility to be controlled at an individual and group level. Group permissions for LDAP and SSO users can also be configured. For detailed information on users, groups, permissions and data visibility, please refer to Permissions Admin. This interface has replaced the legacy User Admin and User Groups interfaces. cog System Config Provides all configuration settings for the Darktrace Threat Visualizer application including Darktrace RESPOND settings and authentication for Darktrace/Apps, Cloud and Zero Trust modules. Alerting options can also be configured here. tachometer-fast System Status System metrics such as ingested traffic quality, master/probe reachability, and protocols observed can be reviewed. The visible statistics on the Status page will depend on your environment. Help dts-user-question Ask the Expert AsktheExpertallowsforthecreationofincidentswhichcanbesubmittedtoDarktraceanalysts for feedback. Refer to Ask the Expert in the Platform Accounts Console for more information.
- 97. 97 For example, searching for “Okta” and clicking the filter icon will filter the dashboard (including model breaches and the global map) and the profiles page by only users detected from Okta. A user filter can be applied at the user level (e.g., [email protected]) which will filter for their accounts across multiple platforms, or platform-specific (e.g., “benjamin.ash@ holdingsinc.com (Okta)”). Time Range Somepartsoftheplatformaccountsconsolewillconsistentlyappearonthescreen,regardless of which page is chosen. These elements will apply filters to multiple windows and dialogs. Main Menu Darktrace Logo The main menu will always be visible. Click dt-cloud-apps Home or the Darktrace logo to return to the dashboard. More information about the main menu options is available in Platform Accounts Console Main Menu. Omnisearch UNIVERSAL ELEMENTS The search function can be used to view user profiles or filter the dashboard by a specific service or user. The search will attempt to fuzzy match against all valid data types. • The AI Analyst icon c opens a dialog to launch an AI Analyst investigation on the user. AI Analyst investigations are discussed in greater detail in Triggered AI Analyst Investigations in the Platform Accounts Console. • The profiles icon id-badge will open the profile for the specified user. Profiles are discussed in greater detail in User Profiles. • The filter icon filter will filter all data by the platform or user specified. Filters can be cleared by clicking the times icon. Changing the time range will restrict the alerts returned in the threat tray to only those occurring within the set range. It will also restrict the model breach locations shown on the global map, change the interval for the main dashboard statistics, limit the returned profiles to onlythose active within the time frame, and alterthe range for locations and logs shown on profile pages. The available options are: “Today”, “Last 24 Hours”, “Yesterday”, “Last 3 Days”, “Last 7 Days”, “Last 30 Days”, “This Month” or “Custom”. The time range does not apply to RESPOND actions or login activity displayed on the global map. It is not carried over when pivoting to alternative investigation windows such as the Email Console, Advanced Search or the Threat Visualizer. The PlatformAccounts consolewill default to the current browsertime zone - clicking the user icon (user-clock) will provide options to set an alternate time zone.
- 98. 98 Data Retention User activity data is maintained on a rolling basis; on average, most environments can expect to retain around 28-30 days worth of data at any one time, but this will vary depending upon the quantityof activitydata received byDarktrace modules orotherinputs. Ifyourorganization wishes to retain data for longer periods, please discuss methods of data export with your Darktrace representative.
- 99. 99 The dashboard is the primary interface of the Platform Accounts console. The dashboard providesanoverviewofuseractivityandanentrypointintomostthreatinvestigationworkflows. For many operators, the dashboard will be the location where most investigation time is spent. There are two main areas of the dashboard - the threat tray where AI Analyst incidents and model breaches can be reviewed, and the main workspace. By default, the main workspace will display headline statistics about the environment and a global map of user login activity within the chosen time frame¹. Clicking an alert in the threat tray or an interactive node on the map will populate the workspace with an investigation interface, replacing the map. ¹ Login locations displayed on the map are not altered by the time range and will always cover 28 days. THE PLATFORM ACCOUNTS CONSOLE DASHBOARD
- 100. 100 Active Users As Darktrace analyzes activityretrieved bymodules from third-partyplatforms, it creates “user” devices. Each user is a distinct, unique actor that has performed an action in the environment. For each of these users, Darktrace models a ‘pattern of life’ - a unique behavioral profile - and will surface behaviorwhich deviates from this normal activity pattern. Active users are users with some detected activity within the time range selected. Click the statistic to open the Profiles page and review the users in more detail. Profiles will be covered in User Profiles. Active RESPOND Actions Requires a valid Darktrace RESPOND/Apps or Darktrace RESPOND/Zero Trust license. The Darktrace RESPOND framework leverages the power of the ‘pattern of life’ developed across the platform to respond, contain, and neutralize emerging threats across the entire digital estate. Darktrace RESPOND is available across a number of Darktrace/Apps and Darktrace/Zero Trust modules, including Microsoft 365, Google Workspace, Salesforce, Okta, and more. This statistic highlights whether Darktrace RESPOND is actively taking action against one or more user devices at the current time. Click the statistic to open the Darktrace RESPOND actions page, where pending, active and historic actions can be viewed and edited. Darktrace RESPOND actions are described in more detail in the main Darktrace RESPOND guide, from Reviewing Darktrace RESPOND Actions onward. Key Statistics At the top of the dashboard, above the global map, are four key statistics: Incidents, Model Breaches, Active Users and Active RESPOND Actions. The first three statistics - Incidents, Model Breaches and Active Users - will adjust to reflect the time range chosen in the top bar. The final statistic - Active RESPOND Actions - is only applicable to the current time and therefore will not change if the range is adjusted. Incidents Incidents are created from AI-powered investigations into anomalies across your digital environment. Every time the conditions for a model are met and a model breach is created, AI Analyst investigates the activity and concludes whether it needs to be surfaced for human analysts to review. The results of this analysis is then grouped in incidents. This statistic shows the number of AI Analyst incidents created during the time range - this included incidents created from manual investigations. Click the statistic to switch the threat tray view to AI Analyst incidents. How to understand and investigate incidents will be covered from The Darktrace CyberAI Analyst onwards. Model Breaches Darktrace models are a logic framework that allows operators to interact with the output from ‘pattern of life’ and anomaly classifiers. Models are primarily used to identify and alert on anomalous and potentially malicious behavior. When conditions for a model are met, this creates a model breach and can triggeran alert oraction. This statistic shows the numberofAI Analyst incidents created during the time range - this included incidents created from manual investigations. Click the statistic to switch the threat tray view to model breaches. Model breaches displayed in the Platform Accounts console will only be those relevant to Darktrace/Apps, Cloud and Zero Trust modules - even if other Darktrace components are deployed. How to understand and investigate model breaches will be covered in more detail in Filtering Model Breaches in the Platform Accounts Console and Model Breaches in the Threat Tray.
- 101. 101 Interacting With the Map Click on any location to open an overlay with more information about the node. If multiple ASNs or active IPs are located in the same area, these will be grouped by geographic location associated with the IP or ASNs. Where multiple locations are very close together, clicking in the general location will open the overlay for all grouped nodes, with different locations highlighted in contrasting colors. Click the ‘x’ icon to dismiss entries. The title of the overlay indicates the geolocation associated with the grouped login or model breach activity. Click the map-marker-alt location to centre the globe on the location. By default, the main Platform Accounts console workspace will display headline statistics about the environment and a global map of user login activity. The global map on displays both login activity (blue) and the model breach activity (yellow to red), geolocated by the ASN that the activity was performed from. Model breach locations show highlighted in the color corresponding to the scoring strength of the model breach. Where possible, activitywill also be mappedwith greaterprecision using available geolocation data for the IP address. THE DASHBOARD MAP If the map is loaded when the threat tray is in AI Analyst view, the map will only display login locations and will not display model breach locations until a model breach view (users or model breaches) is selected for the threat tray. If the map is loaded when the threat tray is in model breach view, the map will only display model breach locations until another view (users orAI Analyst) is selected for the threat tray. An ASN is a group of IP addresses controlled by one Internet Service Provider or entity. As user activity in SaaS platforms is often performed by users on mobile devices or tethering to mobile devices, their IP may change regularly but the ASN will stay consistent (usually the mobile provider). Greater variation in IP address is therefore not as indicative of anomaly as large changes in ASN usage. Within the overlay are individual entries. For login activity, each entry represents an ASN where logins were performed and will include the ASN, the last observed IP from that ASN for the activity, the time of the last activity, and the frequency of all activity seen from that ASN over the time range. As locations displayfor28 days - regardless of the timeframe - some locations may not have any activitywithin the range. For model breaches, each model breach will be separated out as an individual entry. The entry will instead display the name of the model that triggered, the user who caused the model breach (where applicable), the ASN, the time of the model breach, and the behavior category associated with the model. More information on model behavior categories will be provided in the article The Platform Accounts Console Threat Tray.
- 102. 102 For all entry types, click the ASN to open activity timeline logs focused on all activity observed by Darktrace from that ASN over the chosen time range, or click the IP address to see logs focused to that public IP. For model breach entries, click the name of the user who triggered the model breach to open their profile, or click the model name to open the investigation interface. Timeline logs are described in more detail in Model Breach Activity Timeline Tab and Profile Timeline and Model Breach Tabs, profiles in User Profiles, and investigating model breaches in Model Breaches in the Threat Tray. Filtering the Map Model breaches on the map are influenced by the filters applied to the threat tray. To view these, click the filter filter icon in either user or model view; for more information on these filters, please refer to Filtering Model Breaches in the Platform Accounts Console. Applying a user or module filter from the omnisearch will also influence the model breaches displayed on the map. Login locations are shown over a static 28 day time period and are not impacted by the time range or omnisearch filters.
- 103. 103 c AI Analyst Incidents are created from AI-powered investigations into anomalies across your digital environment. Every time the conditions for a model are met and a model breach is created, AI Analyst investigates the activity and concludes whether it needs to be surfaced for human analysts to review. The results of this analysis is then grouped in incidents. AI Analyst only reports upon the most important or interesting activity - it performs the heavy lifting and should be the starting point for any Darktrace operator. exclamation-triangle Model Breaches Darktrace models are a logic framework that allows operators to interact with the output from ‘pattern of life’ and anomaly classifiers. Models are primarily used to identify and alert on anomalous and potentially malicious behavior. The Threat Visualizer platform provides a curated set of default models as standard, designed and constantly tuned by the specialized Darktrace analyst team. When conditions for a model are met, this creates a model breach and can trigger an alert or action. AI Analyst investigates every model breach that occurs on the system and reports only the most interesting activity as incidents. THE PLATFORM ACCOUNTS CONSOLE THREAT TRAY The panel on the left of the workspace contains alerts from Darktrace anomaly detection; this element of the main dashboard is the threat tray, the starting point for most investigation workflows. By default, it will load in model breaches view. The tray has three options: exclamation-triangle Model Breaches, c AI Analyst and user Users. user Users The users view is an alternative model breaches view, where models are grouped by the user who triggered the model breach and not bythe individual model. This approach is particularlyvaluableforthreat investigation workflowswhichfocus on alertsfrom high priorityusers. Guidance on how to interact with the threat tray in this mode is incorporated into the main model breach view material.
- 104. 104 When new users are created, the behavior categories they see as default when they first log in can be customized. For existing users, the default behavior categories they see can be customized in their account settings. To do so, alter the settings “Default Threat Tray AI Analyst BehaviorVisibility” and “Default Threat Tray Model BehaviorVisibility”. Please note, this impacts both the Threat Visualizerworkspace and the Platform Accounts console. Behavior Categories The alerts in the threat tray can be filtered in many different ways to support different priorities and investigation workflows. The most important filter to be aware of is behavior categories. Behavior categories are universal, high level categories that allow an operator to focus in on specific levels of severity or behavior. There are four categories: Critical, Suspicious, Compliance and Informational. Categories are used across both AI Analyst and Darktrace models, and will display on entries across all views. Categories can be applied to AI Analyst and Model Breaches separately. • Critical alerts represent events with the highest anomaly and are where an analyst should focus their attention in the first instance. • Suspicious alerts are those which suggest moderate levels of anomaly but do not warrant prioritization over critical. • Compliance alerts are raised for behaviors that may be counter to organizational policies and best operating practices. • Informational alerts cover low level indicators and notable events which do not indicator malicious activity in isolation. The informational category is not applicable to AI Analyst alerts as only events worth analyst attention are surfaced.
- 105. 105 Behavior Categories There are four behavior categories that can be applied to Darktrace model breaches: Critical, Suspicious, Compliance and Informational. Categories are applied at the model level and are closelyrelatedto model priority. Behaviorcategorieswere described inThe PlatformAccounts Console Threat Tray. Time The time range ofthe threat trayis controlled bythe global time range. See Universal Elements for more information on this universal time selector. Score When the criteria for a Darktrace model are met, a model breach is created with a score from 0-100%, represented by a gradient from yellow (lowest severity) to red (highest severity). The score is calculated from the type of activity, the priority of the devices involved and the rarity of the model breach for the device. Model breaches returned by the threat tray can be filtered by a minimum and/or maximum score. Darktrace recommends a minimum threshold of 60 for initial triage of model breaches. The slider does not affect any underlying processing, only what is currently displayed in the dashboard. Score can be a useful metric to use when prioritizing within a category - for example, starting with category “critical” and addressing alerts in order of score. Changing the sliderwill also impact model breach entries on the main map. FILTERING MODEL BREACHES IN THE PLATFORM ACCOUNTS CONSOLE In the Platform Accounts console, the default threat tray mode is model breaches. Model breaches are the foundation of Darktrace DETECT alerting (which AI Analyst builds upon) - models capture both unusual activity detect by Darktrace pattern-of-life analysis and defined behaviors such as compliance policybreaches. Models can also be editedtotailorto a specific environment, or created entirely custom if there are specific events an operator wishes to be notified of. Model breaches have a behavior category and an overall score from 0-100%. Behavior categories are high level filters that allow an operator to focus in on specific levels of severity or behavior. There are four categories for model breaches: Critical, Suspicious, Compliance and Informational. The score is calculated from the type of activity, the priority of the devices involved and the rarity of the model breach for the device. The score can be a useful way to prioritizewithinabehaviorcategory-forexample,startingwith“critical”alertsandinvestigating from highest to lowest score before moving on to “suspicious”. The model breaches currently shown in the threat tray will also appear on the global map in this view, with the relevant node highlighted to match the color of the model breach score. Filtering the Threat Tray Model breaches can be filtered to show only those most relevant to your triage approach or workflow. There are three key filters - time, category and score - and manymore advancedfilters available.Although not a primary filter, applying a user or module query from the omnisearch will also restrict the model breaches returned, and subsequently displayed on the map. With the exception of time and omnisearch queries, all filters are applied from the filter filter dialog, opened from the top right of the tray.
- 106. 106 Other Filters FILTER DESCRIPTION Sort By The sort controls how model breaches are ordered. There are four options: by score, by priority (see Adding Actions to a New Model in the Model Editor guide), by count, and alphabetically. Behavior Categories These four toggles control the model breaches returned by the behavior categories each model is in. Behavior categories are described in The Platform Accounts Console Threat Tray. MITRE Tactics Models curated and maintained by the Darktrace analyst team are mapped to the MITRE ATTCK Framework. This filter allows the returned model alerts to be filtered down to only those models mapped to the specific tactic. Models can be mapped to multiple tactics, but will not be duplicated if multiple applicable tactics are chosen. Model Folders Darktrace models are sorted into folders that categorize the type of behavior they are designed to detect. When a folder is unticked, model breaches of models within that folderwill disappear from the tray. Only model folders relevant to Darktrace/Apps, Cloud and Zero Trust modules are included. Include Acknowledged Model breach and AI Analyst alerts can be acknowledged as part of an investigation workflow; this toggle controls whether model breaches which have been acknowledged by an operator are displayed in the threat tray. A check checkmark will appear next to the model name for acknowledged model breaches, or if in userview, alongside the username if all underlying model breaches for the user are acknowledged. Score Slider Model breaches returned by the threat tray can be filtered by a minimum and/or maximum score. Please see above for more information. Changes to these filters are retained when switching between the model breach and user threat tray views. Changes are not preserved if the AI Analyst view is chosen, or the page is closed or refreshed. Behavior categories will be reset to the defaults specified in the user’s account settings.
- 107. 107 Darktrace generally recommends focusing on “Critical” and “Suspicious” model breaches for new investigation workflows. The score can be a useful way to prioritize within a behavior category - for example, starting with “critical” alerts and investigating from highest to lowest score before moving on to “suspicious”. Interacting with an Entry Click once on a model breach entry to highlight the locations relevant to each model breach on the map. Multiple model breaches of the same model during the time frame are grouped together - each entry will list the number of model breaches that have been grouped together. If any entries are grey, this indicated the model has been edited since the model breach occurred. Model breaches have a behavior category and an overall score from 0-100%. At the top of the tile is the score.Eachentrywilllistthenumberofmodelbreaches that have been grouped together. The score can be used to filter on a sliding scale; where a yellow line and icon indicate a low score and red a high score. Models with a grey line and score have been subsequently edited since the model breach occurred. In model breach view, the Platform Accounts console threat tray will display model breach entries sorted from highest to lowest score. Each tile represents a different model, each targeting a different type of activity. How to filter these entries was described in Filtering Model Breaches in the Platform Accounts Console. Model Breach Entries MODEL BREACHES IN THE THREAT TRAY Hover over an entry to open a tooltip with individual entries for each grouped model breach. Each individual entry displays the model name, the user that triggered the model breach and the time that the model breach occurred. The next step is to focus the threat tray on just the chosen model and open the investigation overlay. • Choose an individual model breach from the hover tooltip. This will open the overlay already focused on that entry. • Click the caret-right right arrow on the model breach tile. This will open the overlay focused on the first model breach in the group. • Click the model name from a map entry. This will open the overlay already focused on that entry. Below the score is the model name. If one or more users who have triggered a model breach are currently undergoing a Darktrace RESPOND action, the model name is highlighted in green and the a RESPOND icon will appear on the left. If the model has been acknowledged (requires Include Acknowledged enabled in the filters), a check checkmarkwill appear next to the model name. Where the model has only one model breach in the time range, the time of the model breach is also displayed. If multiple, the time will instead display “Multiple Occurrences”. At the bottom of the tile is the behavior category applied. Behavior categories are high level filters that allow an operatorto focus in on specific levels of severity or behavior. There are four categories for model breaches: Critical, Suspicious, Compliance and Informational.
- 108. 108 Underneath the heading are model breaches for the specific user or model within the time range, ordered from newest to oldest. If a user has triggered a model breach for the same model multiple times within the range, these are furthergrouped into “multiple occurrences” forthat user.Aswith the main tray, hover the tile to see these entries listed. Acknowledged Alerts and Filters If the model has been acknowledged (requires Include Acknowledged enabled in the filters), a check checkmark will appear next to the model name. Most investigation workflows include acknowledging an alert after it has been investigated. For a device, it can be helpful to review anomalous behavior already investigated by other analysts when trying to understand the background to a more severe model breach. To include acknowledged model breaches, return to the main threat tray view and enable this option before focusing. Threat Tray Entries Models are primarily used to identify and alert on anomalous and potentially malicious behavior. Models can also be used to profile a device, assign tags, highlight misconfigurations or trigger autonomous responses from the Darktrace RESPOND framework. Focusing the threat trayon a specific a usercan, forexample, bevaluable in understanding the low-level anomalies that it displayed before a significant incident. Similarly, focusing the threat tray for a compliance model is a simple way to view all non-compliant devices. Focusing the Threat Tray To focus on specific model or user, select a model breach entry within the threat tray as described in Model Breaches in the Threat Tray. Doing so will change the main threat tray to only display model breaches for that given user or model, and populate the main workspace with further investigation tabs. FOCUSING ON A SPECIFIC MODEL BREACH In this example, the threat tray has been focused on the model “IaaS / Storage / S3 Bucket Delete”. • If the threat tray is focused from a tile grouped by user (user view), it will open focused on the user. • If alerts are grouped by model (model breach view), clicking a tile will focus the threat tray on the individual model. A threat tray focused on a model displays the name of the model as a heading in the top left. A threat tray focused from user view will display the user name as a heading. Click the id-card profile icon beside the user to open their profile. Entries are sorted chronologicallywith newestfirst.The colored bar on the left and percentage score indicates the severity of the model breach on a gradient from yellow (low) to red (high). In this case, the model has a high severity.
- 109. 109 The color of the node from yellow to red indicates the severity of the anomaly; the number within the circle indicates the number of model breach alerts grouped together. Ifthere is only one model breach, the circle will contain a exclamation-triangle model breach icon. Click on the circle to see the names of the model breach alerts and the time of occurrence: • If the threat traywas focused from a specific model, each node represents at least one model breach for that model. Click the node to see the users responsible for the grouped model breaches, and click on any entry to change the focus of the workspace to that model breach. • If the threat tray was focused from a specific user, each node represents at least one model breach triggered by that user. Click the node to see the model(s) triggered by the user, and click on any entry to change the focus of the workspace to that model breach. By default, the locations associated with model breaches is collapsed. The expanded format of this element will also be covered in more detail in Model Breach Locations Element. The main part of the log entry includes key information about the user or model breach. • If the threat tray was focused from a specific model, each entry will display the user that triggered the model breach, the time the model breach was triggered, and the behavior category associated with the model. Click the id-card profile icon in the top right of the entry to jump to their profile. • If the threat tray was focused from a specific user, each entry will display the name of the model that was triggered, the time the model breach was triggered, and the behavior category associated with the model. Behavior categories are high level filters that allow an operator to focus in on specific levels of severity or behavior. There are four categories: Critical, Suspicious, Compliance and Informational. Categories are used across both AI Analyst and Darktrace models. The model breach beavhior category appears under the model or device name. Please see The Platform Accounts Console Threat Tray for more info on categories. If one or more users who have triggered a model breach are currently undergoing a Darktrace RESPOND action, the model or user name is highlighted in green and the a RESPOND icon will appear on the left. The currently selected model breach will be highlighted with a blue outline. Changing the selected model will change the contents of the main workspace on the right. These investigation elements will now be covered in more detail in Model Breach Locations Element and subsequent articles. Locations By default, the locations element across the top of the workspace displays all the model breaches fom the current focused threat tray on a timeline.
- 110. 110 Reviewing the locations can be a quick way to establish whether the unusual activity came from a completely unusual location for the given user - perhaps they normally work from Toronto, but the anomalous activity is clustered around login activity in with Guatemala - and respond accordingly. Models are primarily used to identify and alert on anomalous and potentially malicious behavior. Models can also be used to profile a device, assign tags, highlight misconfigurations or trigger autonomous responses from the Darktrace RESPOND framework. When a model breach is selected from the focused threat tray, Darktrace will populate the main workspace with a series of key investigation interfaces, focused on the model breach. The body of the workspace contains a number of investigation tabs, focused on the user and the model breach. Selectingamodelbreachwillalsoupdatethetimelineelementacrossthetopoftheworkspace to reflect login locations for the chosen user. Locations By default, the locations element is collapsed. Click globe-asia Locations to expand the element. MODEL BREACH LOCATIONS ELEMENT If expanded, successful logins for the user around the time of the model breach are shown. These locations are focused on the chosen user- eitherthe userthat the threat trayis focused on, or the user who triggered the model breach the workspace is currently focused upon. Changing the model breach selected will change the locations to reflect the new selected user. Some users - particularly service accounts or automated systems - may have no login locations associated. Thederivedlocationwillappearontheright,andsuccessfulloginsassociatedwiththatlocation appear as lines on the timeline. Locations with no anomaly appear blue. These locations are derived from the ASN present in the login event. Where possible, activity will also be mapped with greater precision using available geolocation data for the IP address.
- 111. 111 Above the entries is the model description; the description covers the general activity the model detects and any action points recommended by Darktrace analysts. Entries are sorted chronologicallywith newest first. The percentage score and colored bar on the left indicates the severity of the model breach on a gradient from yellow (low) to red (high). In this case, the model has a medium severity. Next to the bar is the model breach ID - this numeric ID is a unique reference to this model breach in this threat visualizer instance. Click the ID to copy a shareable link to the model breach to the clipboard. In Unified View environments, model breach IDs are prefixed with a number to indicate the source master. The model breach categoryappears underthe model ordevice name. Please seeThe Platform Accounts Console Threat Tray for more info on categories. Model Breach Logic Each log entry gives context as to why the user activity met the model criteria. In bold is the activity (“metric”) that the device performed that caused the model breach to be triggered. For example, this could be an admin or login action, or any activity which is considered new or unusual in the context of the users’ ‘pattern of life’. Continuing with a similar example of “IaaS/ Storage/Unusual S3 Resource Modification”, the user performed a “Saas S3 Bucket Modified” action which satisfied the requirements of the model. Underneath the keymetric is furtherinformation about the activityand criteria it met to trigger the model breach. This information is useful context for an analyst to understand the activity and potentiallywhy the activitywas anomalous. For example, it is helpful to know the resource that was changed by the administrative action in the SaaS environment or the where a login location was performed from. The information included is chosen when the model is created (“display fields”). Therefore, the amount of information can vary greatly between models. Investigation Tabs The primary tabs are exclamation-triangle Breach Log, stream Timeline, map-marker-alt Location, circle-exclamation User Information, and a Darktrace RESPOND. The tabs displayed may vary between users according to the user’s permissions or licensed Darktrace components. The following article describes the Model Breach Log. The Timeline will then be covered in Model Breach Activity Timeline Tab and Types of Event in the Timeline. Locations, User Information and Darktrace RESPOND are described in the documentation on Profiles - Other Profile Tabs. exclamation-triangle Breach Log MODEL BREACH INVESTIGATION TABS The first tab is the model breach log. Model breach logs contain a list of model breaches for a userfora given model overa chosen timewindow. Each entryin the log represents an instance where a user performed activitythat met the criteria of a model and triggered a model breach. • When opened from a model breach entry, the log is focused on a specific model. • When opened from a user profile, the log is focused on user across multiple models. In this example, the log has been opened from a threat tray focused on the model “IaaS/ Storage/Unusual S3 Resource Modification”.
- 112. 112 AI Analyst Incidents AI Analyst investigates every model breach that occurs on the system and reports only the most interesting activity as incidents. If a model breach has triggered an AI Analyst incident, this can be quickly accessed by clicking the “c Review AI Analyst Incident” text that appears on the entry. This will open the AI Analyst Incident overlay, which is described in more detail in AI Analyst Incident Overlay. Model Breach Log Options Each entry also has a series of actions and options on the bottom right: ICON MEANING DESCRIPTION link View this model breach in visualizer This icon opens the Threat Visualizer interface, focused on the user that triggered the model breach at the time of the model breach. This option will only appear if a Darktrace DETECT component such as Darktrace/Network, Darktrace/Cloud or Darktrace/Endpoint is present. Please refer to Focusing on a Device in the main visualizer guide for more information. check / times Acknowledge / unacknowledge this model breach Acknowledging model breaches removes them from display by default - it is a key part of many investigation workflows. Click this icon to acknowledge a model breach. If the model breach has already been acknowledged, click to unacknowledge. a Trigger a RESPOND action Click to launch a manual action against the device that triggered the model breach. See Manual Darktrace/Apps, Darktrace/Cloud and Darktrace/Zero Trust RESPOND Actions or Manual Darktrace RESPOND Actions for more information on triggering these actions. Not all S3 Bucket Modification eventswill have met the model criteria - models have additional restrictions that the activity must meet. For example, the model may be looking for SaaS activity from an ASN that is 100% unusual. If workflow integrations that allow lookups for external IPs and hostnames are enabled (such a VirusTotal), a exclamation-circle pivot icon will appear for these entries. Some models may look for multiple types of activity so these elements may appear more than once on a single log entry.
- 113. 113 Timeline Options Across the top of the timeline are several options. ICON MEANING DESCRIPTION angle-up Expand time range by1 minute Shifts the window of time forwhich logs are returned forward one hour closer to the current time. angles-up Expand time range by1 hour Shifts the window of time forwhich logs are returned forward one minute closer to the current time. sensor-alert / sensor-cloud Show all events / model events only Toggle the timeline between all events around the time of the model breach, and only those that were relevant to the model breach itself. Events relevant to the model breach will continue to be highlighted even when toggled. triangle-exclamation Model Name Current model filter When a model breach filter is applied, the applicable model is shown at the top of the log. Click to remove the model filter, or click sensor-alert to restore it. caret-up Collapse all open event lines Collapse all events that have been expanded. filter Open timeline filters View and edit the currently applied timeline filters. These filters are distinct from the threat tray filters. Please note, the time window for events around the time of a model breach is very limited and therefore shifting the range may have little impact. Review the event from the main user timeline if a wider range is required. Timeline Event Types Most entries in the log will be activities performed by a user, received and analyzed by Darktrace DETECT. Some special types may also be added by other components such as Darktrace RESPOND. These event types will now be described in more detail in Types of Event in the Timeline. stream Timeline ThetimelineisalogofuseractivitydetectedbyDarktrace/Apps,CloudandZeroTrustmodules. Selecting a model breach adds a opens a filtered version of the timeline, where only events relevant to the model breach are displayed. MODEL BREACH ACTIVITY TIMELINE TAB The next stage in investigating a model breach is to reviewthe events that directly contributed to the model breach, reviewevents around the time ofthe model breach alert, and understand why Darktrace considered the activity anomalous.
- 114. 114 Finally, the event line also displays an icon representing the third-party service on which the activitywas performed and the time of activity. For example, Microsoft 365 events may display “grid-2”, AWS “aws”, or Google Workspace “google”. This is more applicable for timelines accessed from profiles, where a users’ multiple saas service identities have been centralized - but is still included in model breach timeline logs. Most entries in the log will be activities performed by a user, received and analyzed by Darktrace DETECT. Some special types may also be added by other components such as Darktrace RESPOND. TYPES OF EVENT IN THE TIMELINE When a timeline is opened from a model breach, it will be initially filtered to show only the activity that met the model criteria and caused a model breach to trigger. This filter can be disabled to show other event types around the time of the model breach. If an event was the trigger of a model breach, a line will appear on the left of the event entry in the same color as the relevant model breach. The entry is also slightly indented. This line will persist when switching between a model-focused and all events view of the timeline. User Activity All user activity types can appear in the timeline log; the type of action the user performed appears on the left of the entry, alongside a simple icon representing the wider category. Different action types are indicated by relevant icons such as right-to-bracket logins, ban failed logins, pen resource modifications, and user-shield admin activity. Next is the ASN from which the activity was performed, derived from the source IP of the action, and two buttons. The first button - ellipsis-vertical See more options - offers additional pivots to Darktrace Advanced Search and Darktrace/Email to investigate the event or user more closely. The second button caret-down shows or caret-up hides further details about the event itself. Clicking on the entry will also show these additional details. Click the event to expand it, and to open an advanced event details panel on the right of the interface. This gives additional information about the event, the user, and if applicable, the resource that was changed. triangle-exclamation Model Breaches Modelbreachentriesareshadedinthesameyellowtoredscale,indicatingseverity.Connected activity is highlighted in the same color as described above. When the timeline is initially opened from a model breach entry, it is filtered to display only activity relevant to that model breach alert. Therefore, the model breach alert shown is the model breach under investigation. When the view is toggled to show all activity around the timeframe, other model breach alerts may also appear. Click to open a smaller version of the breach log on the right of the window. This can also be used to access any comments made on the model breach entry, or to add new comments.
- 115. 115 a Darktrace RESPOND actions Darktrace RESPOND actions are highlighted in green. Each entry lists the relevant user and when the action was created. Beside the user is a button - ellipsis-vertical See more options - which can be used to pivot to the main RESPOND actions page, filtered on the user, to review more actions. Please referto Reviewing Darktrace RESPOND Actions for more info on this interface, and Darktrace RESPOND actions in general. The type of action taken is listed below . If an action was created that required human confirmation, but was not confirmed in time, this is also indicated on the entry. circle-exclamation Darktrace Analysis Darktrace monitors behavior metrics for each user as part of the pattern of life. If the value of one of these behavior metrics is anomalous, an unusual activity entry may be added to the event log.The most common analysis messageforuserdevices are unusual locationwarnings. If a model breach has comments, the timeline entry will also display a small message-lines speech icon. Users can comment on model breaches to provide context or indicate to other users that they areworking onthe alert.Comments on a model breachthattriggered anAIAnalyst incident are also pulled through to the incident discussion. Comments remain within the Threat Visualizer interface or any configured alert outputs - to discuss a model breach with Darktrace analysts, please use Ask the Expert or the Darktrace Customer Portal. triangle-exclamation Darktrace/Email Anomalies Darktrace/Email collaborates with equivalent Darktrace/Apps modules (Microsoft 365 and Gmail/Google Workspace) to share high severity model breaches from Darktrace/Email in the user activity logs for relevant users. These entries appear in the timeline with a link to open the Darktrace/Email console for further investigation. Some Darktrace models exist as triggers forothermodels that lookforcertain kinds ofunusual behavior; these indicator models generally do not create model breach alerts. Instead, they may add a single line to the event log of the device indicating that they were triggered. These caseswill also appearas analysis entries inthetimeline, and maybe linkedtothe model breach under investigation. Other Tabs The remaining tabs - Locations, User Information and Darktrace RESPOND - are described in the documentation on Profiles - Other Profile Tabs.
- 116. 116 The output from this analysis process are AI Analyst Incidents - a collection of one or more related events of anomalous activity. Incidents (Darktrace Threat Visualizer 5.2+) are formed through a meta-analysis of activity type, devices, and endpoints involved in each event. Each incident can encompass multiple stages of activity as it develops. AI Analyst AI Analyst incidents are an excellent place to start when investigating alerts for the first time in the Threat Visualizer. Incidents are only created for the most interesting and high priority activity observed by Darktrace. Incidents are created from AI-powered investigations into anomalies across your digital environment. Every time the conditions for a model are met and a model breach is created, AI Analyst investigates the activity and concludes whether it needs to be surfaced for human analysts to review. The results of this analysis is then grouped in incidents. THE DARKTRACE CYBER AI ANALYST What is AI Analyst? The Darktrace AI Analyst investigates, analyzes and triages threats seen within your Darktrace environment. Bylearning from the millions of interactions between Darktrace’s expert analysts and Darktrace DETECT components, the AI Analyst combines human expertise with the consistency, speed, and scalability of AI. Darktrace models - a logic framework that allows operators to interact with the output from ‘pattern of life’ and anomaly classifiers - are used as a trigger to invoke AI Analyst. When the conditions for a model are met, a model breach is created; AI Analyst reviews and investigate all model breaches that occur on the system as a starting point for its analysis process. The layer of abstraction means only high priority activity is surfaced.
- 117. 117 AI Analyst incidents can also be filtered. Again, there are three key filters - time, category, and score - and a more limited set of advanced filters available. With the exception of time, all filters are applied from the filter filter dialog, opened from the top right of the tray. Unlike model breaches, applying a user or module query from the omnisearch will not restrict the AI Analyst incidents returned. Behavior Categories Behavior categories are high level filters that allow an operator to focus in on specific levels of severity or behavior; categories were described in The Platform Accounts Console Threat Tray. Therearethreebehaviorcategoriesthatcanbeapplied to Darktrace AI Analyst incidents: Critical, Suspicious, and Compliance. The informational category is not applicable to AI Analyst alerts as only events worth analyst attention are surfaced. Categories are assigned to incident events and the incident itself is then given the most severe of all underlying categories. Score AI Analyst incidents are given an overall score from 0-100%, represented by a gradient from dark (lowest severity) to light blue (highest severity). The score is calculated from the number of devices, the type of activity and the level of anomaly across all events that make up the incident. High scores indicate incidents that AI Analyst believes to be high priority for human attention. By default, the minimum is set at 20% forAI Analyst incidents. Model and AI Analyst scores should not be seen as comparable. AI Analyst only surfaces the most important and interesting activityforusers,whereas model breaches coverthe full range of activity from low level, informational activity to high priority alerts. Other Filters FILTER DESCRIPTION View The AI Analyst tray can be toggled between AI Analyst Incidents and Investigations. Incidents are generated automatically in response to model breaches. Investigations are triggered manually and may result in an incident if anomalous behavior is found. Investigations are covered in more detail in Triggered AI Analyst Investigations in the Platform Accounts Console. Language AI Analyst Incident summaries can be localized into any of the current 12 options: English (US), English (UK), Chinese (Simplified), Chinese (Traditional), French, German, Italian, Japanese, Korean, Portuguese (BR), Spanish (ES) and Spanish (LATAM). Behavior Categories These three toggles control the AI Analyst Incidents returned by the behavior categories each model is in. Behavior categories were described in The Platform Accounts Console Threat Tray. MITRE Tactics As of Threat Visualizer 6, all AI Analyst incident event types have been mapped to one or more MITRE ATTCK Framework tactics. This filter allows the returned incidents to be filtered down to only those that contain an event mapped to the specific tactic. Events can be mapped to multiple tactics and incidents may contain multiple events, each with distinct tactics assigned. AI Analyst Incidents are accessible from the threat tray in c AI Analyst mode, or from the c Incidents statistics on the main dashboard. Filtering AI Analyst Incidents FILTERING AI ANALYST INCIDENTS Time The time range ofthe threat trayis controlled bythe global time range. See Universal Elements for more information on this universal time selector.
- 118. 118 FILTER DESCRIPTION Include Acknowledged Model breach and AI Analyst alerts can be acknowledged as part of an investigation workflow. By default, acknowledged alerts are removed from the returned results. Turn this setting on to include these results. Include pinned incidents AI Analyst incidents can be globally pinned - this means theywill be returned as part of the results, regardless of whether they are within the timeframe. Turn this setting off to only include pinned incidents that are within the chosen timeframe. Score Slider AI Analyst Incidents returned by the threat tray can be filtered by a minimum and/or maximum score. Please see above for more information. The current alerts in the tray can be exported as a PDF. To do so, click Download Incidents. Changes to these filters are not preserved upon switching to display Investigations, to a model breach view of the threat tray,or the page is closed or refreshed. Behavior categories will be reset to the defaults specified in the user’s account settings.
- 119. 119 AI Analyst incidents can be pinned, ensuring the remain at the top of the threat tray for all users, regardless ofwhethertheyocurredwithin the time range chosen (requires filterInclude Pinned enabled). These incidents are indicated with a thumbtack pin icon beside the name of the initial user profile. If the initial user is subject to an active Darktrace RESPOND action at the current time, a Darktrace RESPOND icon - a - will appear beside the user name on the tile and the name is highlighted green if the action is currently active. Interacting with an Entry The next step is to open the investigation overlay for a given incident. Click on an incident tile to open a detailed overview, focused on that incident. If you are not sure which incident to start with, chose the first incident in the list (i.e., highest severity) which has not been pinned by another user. Each alert in the AI Analyst Incident tray lists the initial user (the user that triggered the first activity AI Analyst detected), the number of events the incident comprises, the number of profiles involved in the incident. • Hovering over the count of incident events will display a list of the event titles and the time at which theywere detected. • Hovering over the count of involved profiles will show a list of the users involved in the AI Analyst incident. In AI Analyst view, the Platform Accounts console threat tray will display AI Analyst incidents sorted from highest to lowest severity. Each tile represents a different incident. An incident is composed of one or more events; events are a group of anomalies or activity investigated by Cyber AI Analyst that it considers high priority enough to raise to a human operatorforattention.Fornewusers,startwiththefirstincidentinthetraywith“critical”severity. How to filter these entries was described in Filtering AI Analyst Incidents. AI Analyst Incident Entries AI ANALYST INCIDENTS IN THE THREAT TRAY Incidents have an overall score from 0-100% - the score can be used to filter on a sliding scale. Incidents are categorized from dark to light blue, where light blue indicates a high score and darkerblue a lowerscore.The score can be a usefulwayto prioritizewithin a behaviorcategory - forexample, startingwith “critical” alerts and investigating from highest to lowest score before moving on to “suspicious”.
- 120. 120 Below, along the left of the workspace, are all the incident events that Darktrace AI Analyst has associated together to make up the wider incident itself. Each incident is comprised of events which detail a specific anomalous activity - or chain of activities - investigated by AI Analyst. When starting to investigate an AI Analyst incident, one approach is to work through each incident event chronologically. Incident events are sorted in time order, from newest to oldest activity. The entry includes the type of activity detected by AI Analyst, the time at which the activity was detected, and the name of the primary device associated with the activity reported. Users can triggerAI Analyst investigations manually if theywish to look into a device’s behavior in greaterdetail. Ifan event orincidentwas createdfrom an investigationtriggered bya manual investigation or a third-party alert, this will also be indicated on the tile. The currently selected incident event will be highlighted with a blue outline. Changing the selectedeventwillchangethecontentsofthemainworkspaceontheright.Theseinvestigation elements will now be covered in more detail in AI Analyst Incident Event Summary onward. In AI Analyst view, the Platform Accounts console threat tray will display AI Analyst incidents sorted from highest to lowest severity. Each tile represents a different incident. To investigate an AI Analyst incident, the next step is to look more closely at the activity and users involved. To focus on specific incident, take one of following routes: • Select the incident from the AI Analyst view of the threat tray, as described in AI Analyst Incidents in the Threat Tray. • Pivot from a successful AI Analyst investigation. Doing so will populate the main workspace with more detailed information about the incident and constituent events. Manual AI Analyst investigations are described in Triggered AI Analyst Investigations in the Platform Accounts Console. • Where a model breach has resulted in an AI Analyst incident, pivot from the “Review AI Analyst Incident” button in the breach log for that model breach. The breach log was described in Model Breach Investigation Tabs. Incident Events In this example, the workspace has been focused on the incident “Possible Hijack of HubSpot Account”. In the top left is the user who initially triggered the activity, and a arrow-left back arrow to return to the main incident tray. AI ANALYST INCIDENT OVERLAY
- 121. 121 Underneath the event summary for an AI Analyst incident event are the model breaches that triggered the initial investigation. AI Analyst is not reliant on model breaches, they primarily provide a starting point for its deeper analysis of the device activity around the anomaly time. Further investigation prioritize the anomalous activity signposted by CyberAI Analyst first and the model breach conditions second if the two do not directly align. The color of the line beside the model breach indicates the score severity- where a yellow line and icon indicate a low score and red a high score.A comment-lines comment icon beside the name of the model indicates if any related model breaches have been commented on by a user. These comments can be reviewed in the incident discussion. Click the search icon beside any associated model breach to switch the main workspace to focus on the model breach that initially triggered the investigation. The main details panel opens when an AI Analyst incident event is selected. Event Summary Thefirstpanelgivesasummaryoftheeventoutline.Thesummarydescribesthetypeofactivity AI Analyst detected, the device involved, any endpoints connected to and an explanation of why the activity is anomalous. The summary is the best way to quickly understand the activity AI Analyst has flagged for human review. Here, the summary explains why port scanning activity should be of concern to the security team. AI ANALYST INCIDENT EVENT SUMMARY Text in the summary which appears in blue is interactive - in most cases, this is the username of the primary device and the source IPfrom which activitywas performed. • Click the user to open their profile (covered in User Profiles). • Click the IPto open a timeline, focused on events from that IPwhich are closely related to the model breaches that triggered the AI Analyst investigation. This view is very similar to the model breach timelines described in Model Breach Activity Timeline Tab and Profile Timeline and Model Breach Tabs. The summary can be localized into any of the current 12 options: English (US), English (UK), Chinese (Simplified), Chinese (Traditional), French, German, Italian, Japanese, Korean, Portuguese (BR), Spanish (ES) and Spanish (LATAM). This setting can be changed from Account Settings, or from the filter settings described in Filtering AI Analyst Incidents. Related Model Breaches
- 122. 122 Incidents and events can be acknowledged when they have been investigated. This removes them from the threat tray by default. A common workflow is to investigate each event and acknowledge individually. Incident Discussion Opens the discussion, where users can discuss the incident. Comments on related model breaches will also be displayed in the discussion. Users may comment from the Platform Accounts console, the main Threat Visualizer interface, or from the mobile app. Actions Next is a series of actions; pinning the incident, commenting or downloading a PDF report can be useful for collaboration with other analysts on event investigation. AI ANALYST INCIDENT EVENT ACTIONS AND COMMENTS Incident Actions The following actions alter the entire incident. ICON DESCRIPTION download Create a Report Opens a dialogue to create a downloadable PDF report from the incident. Any text entered into the “Report Name” field will be used as the filename and appear as a title in the generated PDF. thumbtack Pin the Incident “Pins” the incident so it remains in the threat tray. Pinning was discussed in Filtering AI Analyst Incidents. Individual events may also be pinned - if one or more events are pinned, the entire incident will be pinned copy Copy to Clipboard Copies a link to the incident to the clipboard. Event Actions These actions only affect the chosen event or related alerts. ICON DESCRIPTION check Acknowledge this event Events can be acknowledged individually, rather than as part of the whole incident - this is a common workflow as a threat analyst investigates each underlying event in turn. check-double Acknowledge this event and related model breaches In addition to acknowledging this event, this icon will also acknowledge the model breach alerts listed under the “Related Model Breaches” heading. A comment is automatically added to model breaches acknowledged this way in bulk. Comments remain within the interface or any configured alert outputs - to discuss an AI Analyst finding with a Darktrace representative, please use Ask the Expert or the Darktrace Customer Portal.
- 123. 123 As the investigation process proceeds, AI Analyst narrows down the activity from a wider analysis to a targeted anomaly. Each investigation blends AI, supervised machine learning and intensive data analysis. These smart steps are identified in blue - “head-side-brain Carrying out intelligent data analysis”. As noted before, the behavioral analysis AI Analyst performs may discover anomalies or patterns of activity that were not the original trigger point for the model breach but are worthy of investigation. How did AI Analyst reach the Conclusions it did? Incidents are created from AI-powered investigations into anomalies across your digital environment. Every time the conditions for a model are met and a model breach is created, AI Analyst investigates the activity and concludes whether it needs to be surfaced for human analysts to review. For each event, AI Analyst explains the activity that initially triggered the investigation and the investigation process it followed to come to the conclusions surfaced in the Threat Visualizer. Investigation Process The investigation process panel is located below the incident discussion and explains how AI Analyst went from the initial trigger to the final activity presented to the user. Reviewing the process can be a useful way to understand the steps performed. UNDERSTANDING THE AI ANALYST INVESTIGATION PROCESS The Cyber AI Analyst, when triggered by a model breach, by telemetry data, or by a human operator, initiates an investigation just like a human analyst. It retrieves and analyzes data to identify related behaviors and activity from the device or user under investigation, and from thewidernetwork environment - just as a cyberanalystwould seekto gain context and identify similar patterns of anomalous behavior elsewhere. However, unlike a human analyst, the Cyber AI Analyst can analyze vast quantities of data at machine speed and investigate potential hypotheses concurrently. It can perform complex data interrogation on a scale and a complexity not possible without AI. The investigation process panel displays a summary of this intelligent analysis process followed byAI Analyst to reach the conclusions displayed in the event.
- 124. 124 Investigating activity Oncethe outline ofthe event and incident as awhole is clear,focus on a userwithinthe incident to better understand their normal activity patterns and gather context about the user’s role. Investigating a userfrom their profile will now be covered from What are User Profiles? onward. Event Details Finally, the key details of the activity AI Analyst detected are provided in a series of sections at the bottom of the workspace. The type of information is specific to each event type and can differ significantly. For our example account hijack alert, the panels include details of the user involved, the reason the activity was considered unusual, the time of activity, and the type of actions performed. In other examples, the panels may include detailed information on the location of external endpoints, emails from Darktrace/Email, or rare user agents detected performing SaaS administration. DETAILS OF AN AI ANALYST INCIDENT EVENT AI Analyst will also utilize intelligence from Darktrace Attack Surface Management (ASM) through the Darktrace PREVENT/ASM Integration; if a malicious asset detected by ASM such as a domain is observed as part of anAIAnalyst event, a pivot to that asset in theASM interface will appear in the event details. Detailed information about the user and any tags will also be included. These details will vary between user and service. If the device or user is subject to an active Darktrace RESPOND action at the current time, the device name will appear highlighted green. If clicked, this section will open the user’s profile (covered in User Profiles).
- 125. 125 Click the incident tile to open the investigation result. Incidents created from triggered investigations follow the same format as AI Analyst incidents created automatically, and were discussed in AI Analyst Incident Overlay and subsequent material. Triggering an Investigation To trigger an AI Analyst investigation, a user and investigation time are required. The device is the subject of the investigation and the time is the starting point for analysis. The AI Analyst tray can be toggled between AI Analyst Incidents and Investigations. Incidents are generated automatically in response to model breaches. Investigations are triggered manually and may result in an incident if anomalous behavior is found. When an investigation is triggered, AI Analyst will perform a close analysis of the activity for the user for a period of roughly one hour, using the time provided as a central point. It will then contextualize this behavioragainst historic activityand connectivityforthe entityand its peers. If a finished investigation has the result “No Incident Found”, AI Analyst did not locate any identifiable anomalous activityaround the investigation time. If anomalous activityis detected, one or more incident events will be created. Investigations TRIGGERED AI ANALYST INVESTIGATIONS IN THE CONSOLE Investigations have four states - pending, processing, circle-check no incident found and circle-exclamation incident report ready. A pending investigation waiting for AI Analyst to start the analysis. A processing investigation_ means analysis is underway and the remaining states indicate the investigation has concluded. Click the trash-can trash icon to delete the investigation permanently for all users. This will not delete any incidents created a result of the incident, only the investigation entry. The final element is investigation time; this is not the time the investigation was launched, but the time that AI Analyst is investigating activity around. The heading of each entry indicates the user under investigation - investigations are always centred around an initial profile. The investigations displayed in this interface are limited to those investigating user devices created by Darktrace/Apps, Cloud and Zero Trust modules. Investigations of other device types are not shown in this interface. Underneath is the username of the Darktrace user who triggered the investigation - users can see all investigations launched by other users from both the Platform Accounts console, Threat Visualizer interface and Darktrace Mobile App. An AI Analyst investigation can be triggered on a specific device from the omnisearch barwith the c AI Analyst icon, or from a specific Profile in from the “c Investigate” button. When an investigation is launched from a specific profile, the user field is already completed. Click Investigate to start the investigation. This will pivot back to the investigation view of the main dashboard where the progress of the investigation can be followed.
- 126. 126 What is a “User”? As part of the analysis process, Darktrace/Apps, Darktrace/Cloud and Darktrace/Zero Trust modules model individual behavioral profiles in the form of “user” device entities. Each “user” device represents a distinct, unique actor that has performed an action in the third-party platform Darktrace is monitoring. An action may be a successful login or the alteration of a resource in the third-party platform. A “resource” can be any modifiable element in the third-party platform and will differ by SaaS or IaaS service. Generally, this will be things like groups, files, virtualized computing resources, password policies, or even other users. Failed logins alone will not create user entities. The profiles page lists all the active user entities modeled and analyzed by Darktrace during the chosentime range. Here, useractivitycan be reviewed and investigated in more detail, and Darktrace AI Analyst investigations or manual Darktrace RESPOND actions can be launched. Onlyusers that have performed an actionwhilst Darktrace monitoringwas enabled and during the specified time window will be listed. Changing the global time range will update this page to show more or fewer profiles. If a user is covered by more than one Darktrace/Apps, Darktrace/Cloud or Darktrace/Zero Trust module, these entities are collapsed into a single profile. Events from across all platforms are combined in the user timeline, ensuring security analysts have a comprehensive view of the user’s activity across all monitored services. WHAT ARE USER PROFILES?
- 127. 127 Using the search functionalityto filterthe profiles by service can be a useful way of limiting the returned profiles to a specific subset of users or accounts. Service Accounts and System Entities Many third-party platforms permit external entities to influence resources. Similarly, many third-party platforms and systems operate “service” accounts or system-owned entities that mayalterinternalresources.Theactionsoftheseentitieswilloftenresultinusersbeingcreated for them, as they have direct impact on the third-party platform Darktrace is monitoring. Activity filtering can be used to ignore these entities, or to control Darktrace monitoring to only cover a subset of users. If you wish to implement this type of filtering, please discuss this with your Darktrace representative. A platform-specific guide for limiting the scope of the Darktrace/Apps Microsoft 365 module can be found on the Darktrace Customer Portal - Restricting the Users Covered by the Darktrace/Apps Microsoft 365 Module. Accessing the Profiles The profiles page can be accessed from the main menu id-badge Profiles icon orvia the Active Users stat on the dashboard. Individual profiles can also be reviewed by using the search bar or as part of an investigation workflow, for example, by clicking on an actor within an AI Analyst incident summary. Each entry lists the user and SaaS or Cloud platform(s) they have been detected on by the relevant Darktrace/Apps, Darktrace/Cloud or Darktrace/Zero Trust module. The first listed profile will open by default.
- 128. 128 Profile Actions OPTION DESCRIPTION c Investigate Launch an AI Analyst investigation into the user’s activity at a chosen time. When an investigation is triggered, AI Analyst will perform a close analysis of the activity for the user for a period of roughly one hour, using the time provided as a central point. Triggered investigations were covered in more detail in Triggered AI Analyst Investigations in the Platform Accounts Console. a Launch RESPOND Action” Darktrace RESPOND actions can be triggered manually for profiles which are covered by one or more modules that support Darktrace RESPOND. For users detected by multiple Darktrace RESPOND- enabled modules, selecting “All Eligible Modules” allows a “Disable User” RESPOND action to be triggered for the user against all modules at once. Darktrace RESPOND and RESPOND actions are covered in Manual Darktrace/Apps, Darktrace/Cloud and Darktrace/ Zero Trust RESPOND Actions, Manual Darktrace RESPOND Actions and the main guide - Reviewing Darktrace RESPOND Actions. Profiles are organized alphabetically; the first listed profile will open by default. Each entry also lists the Darktrace/Apps, Darktrace/Cloud and Darktrace/Zero Trust modules that the user is monitored by. In this example, the user profile is combining activity from Darktrace DETECT modules for Okta, Microsoft 365 and Azure. Profile The selected user is displayed in the top left of the profile - the Darktrace DETECT modules which have observed the user performing activity are listed below. USER PROFILES Tags Tags offer a simple labelling system which can be used to identify important devices, display relevant contextual data and alter model logic. Tags can be automatically applied as a model action, used in model defeats to exclude devices, or factored into model logic. Select DETECT modules will automatically tag users with relevant information such as their roles in the third-party platform. These tags are indicated by “(CG)”. Tags applied to the combined user accounts that make up the profile are displayed below the user name. As each module creates a separate user device, which are then combined for ease in the user’s profile, tags will indicate the combination of user and service they are applied to. New tags can also be manually added to the user with the dts-tag-plus tags icon. See Tags in the Platform Accounts Console for further information on adding and editing tags.
- 129. 129 will also be mapped with greater precision using available geolocation data for the IP address. • Click on a location to filter the timeline to just login activity from that location. • Click on a model breach to filter the main timeline to events relevant to the model breach. This filter is the same as that described in Model Breach Activity Timeline Tab. Reviewing the locations can be a quick way to establish whether any unusual activity initiated from a rare location for the given user and respond accordingly. Profile Tabs Profiles have five main investigation tabs. The Model Breach Log and Timeline will now be described in Profile Timeline and Model Breach Tabs and Filtering the User Profile Timeline, and the remaining Account Locations, User Information and Darktrace RESPOND tabs are described in Other Profile Tabs. Profiles contain the same elements as the model breach investigation overlay. Under the primary user information and tabs is a login locations element and five tabs: exclamation-triangle Model Breach Log, stream Timeline, map-marker-alt Location, circle-exclamation User Information, and a Darktrace RESPOND. Some elements will only appear when applicable, or when the relevant Darktrace product is licensed. For example, the user information tab will only appear if the user is covered by a Darktrace module which supports context gathering. Unlike the model breach overlay, information in these elements is displayed from the start of the specified time frame until the current time, and is updated in real time when new events are seen. Locations The locations element is essentially the same as that for model breaches, but is filtered to display location information for the given user over the whole time range. Anomalous locations always appear as circles, regardless of whether the location element is collapsed. The color of the circle from yellow to red indicates the severity of the anomaly; the number within the circle indicates the number of model breach alerts associated with that location. If there is only one model breach associated with the location, the circle will contain a exclamation-triangle model breach icon. Hover over the circle to see the names of the model breach alerts and the time of occurrence. By default, the locations element is collapsed. Click globe-asia Locations to expand the element. USER PROFILE LOCATIONS AND TABS If expanded, login locations both with and without anomalies associated will also be shown. The derived location will appear on the right, and periods of activity associated with that location appear as lines on the timeline. Locations with no anomaly appear blue. These locations are derived from the ASN present in the login event. Where possible, activity
- 130. 130 All user activity types can appear in the timeline log; the type of action the user performed appears on the left of the entry, alongside a simple icon representing the wider category. The bodyofthe entrylists the activitytype, theASN the activitywas performed for, some additional investigation options, and an icon to indicate the service the activity originated from. Darktrace will also insert model breach alerts, Darktrace RESPOND actions, commentaryfrom Darktrace analysis, and high severityalertsfrom Darktrace/Email.Clickon an eventto expand it, and to open an advanced event details panel on the right ofthe interface. This gives additional information about the event, the user, and if applicable, the resource that was changed. A more comprehensive guide to the types of event that can appear in the timeline log was provided in Types of Event in the Timeline. Timeline Options Across the top of the profiles timeline are several options. ICON MEANING DESCRIPTION angle-up Expand time range by1 minute Shifts the window of time forwhich logs are returned forward one hour closer to the current time. angles-up Expand time range by1 hour Shifts the window of time forwhich logs are returned forward one minute closer to the current time. pause Pause the log Pauses real-time updates of the timeline logs caret-up Collapse all open event lines Collapse all events that have been expanded. filter Open timeline filters View and edit the currently applied timeline filters. These filters are distinct from the threat tray filters. These will be covered in Filtering the User Profile Timeline. Profiles contain the same elements as the model breach investigation overlay; the first two tabs are the exclamation-triangle Model Breach Log and stream Timeline. exclamation-triangle Model Breach Log PROFILE TIMELINE AND MODEL BREACH TABS Model breach logs contain a list of model breaches for a user for a given model over a chosen timewindow. Each entryin the log represents an instancewhere a userperformed activitythat met the criteria of a model and triggered a model breach. Refer to Model Breach Investigation Tabs for more information on model breach logs. stream Timeline ThetimelineisalogofuseractivitydetectedbyDarktrace/Apps,CloudandZeroTrustmodules. Unlike the timeline when accessed from a model breach, this timeline is not filtered by default. It will also update in real time. Each entry in the timeline represents a user action or a notice from Darktrace analysis; activity from the multiple identities associated with the profile are combined into a singular timeline.
- 131. 131 Focusing the User Profile Timeline It is also possible to focus the main profile timeline down to only information surround specific model breach, in the same way as described in Model Breach Activity Timeline Tab. First, click on an anomalous node on the main locations element. In the resulting dialog, choose a model breach from the list and click on it - this will filter the timeline to the specific model breach. Focused Timeline Options If the timeline is focused on a specific model breach, additional options to those described in Profile Timeline and Model Breach Tabs will appear. ICON MEANING DESCRIPTION sensor-alert / sensor-cloud Show all events / model events only Toggle the timeline between all events around the time of the model breach, and only those that were relevant to the model breach itself. Events relevant to the model breach will continue to be highlighted even when toggled. triangle-exclamation Model Name Current model filter When a model breach filter is applied, the applicable model is shown at the top of the log. Click to remove the model filter, or click sensor-alert to restore it. As a single timeline can contain several types of activity and analysis across multiple SaaS or IaaS platforms, the timeline can be filtered to display only relevant information. Click the filter filter icon in the top right of the timeline to review these filters. FILTERING THE USER PROFILE TIMELINE The filters available are only those relevant to the events in the timeline - for example, if a user does not have a Google Workspace account, Google Workspace will not be offered as a filter option in their timeline. FILTER SECTION DESCRIPTION Time Selector Set an alternative time range for just the timeline logs, independent of the main time range set universally. Event Types Modify the type of events displayed in the logs. User activity events can be enabled/disabled by high level category (e.g. Resource Modified), and Darktrace created entries such as model breaches can also be filtered out using this option. Modules Limit the contents of the timeline to specific third-party services covered by Darktrace/Apps, Cloud and Zero Trust modules Locations Return only events associated with the enabled ASNs, or those with no geolocation information available. Applying a service filterfrom the main omnisearch does not alterthe data in the timeline log - a filter must be applied directly to the log to control the events returned in this way.
- 132. 132 The remaining profile tabs are map-marker-alt Acount Locations, circle-exclamation User Information, and a Darktrace RESPOND. Some elements will only appear when applicable, or when the relevant Darktrace product is licensed. For example, the user information tab will only appear if the user is covered by a Darktrace module which supports context gathering. map-marker-alt Account SaaS Locations Similar to the location timeline element at the top of the workspace, this tab visualizes the frequent locations that the user performs activity from. OTHER PROFILE TABS Click on any location marker on the map to see the associated IP addresses, the ASN and the frequency at which the activities were performed. Light blue locations indicate sustained activity and dark locations rare locations. Darktrace pattern of life analysis evaluates every login to determine whether the location is unusual in the context of the user and the user’s peer group. Any alerts from this unusual activity monitoring will appear as a exclamation-circle red circle icon on the tooltip. This icon can be hovered to display these warnings and the times they occurred. Each source location is also displayed as a percentage of all user activity. Locations shaded from yellow to red in this list are considered unusual for the user. circle-exclamation User Information The UserInformationtab displays contextual data aboutthe userincluding group membership, assigned roles and assigned licenses, retrieved from the third-party environment. This contextual data provides valuable insight when investigating user behavior and potentially anomalous access. Only some Darktrace DETECT modules (Microsoft 365, Google Workspace, Okta) support the retrieval and displayofcontextual information atthistime.Additional configuration mayalso be required to add this data - please refer to the appropriate module guide for more information.
- 133. 133 Tags offer a simple labelling system for users detected in external platforms which can be used to identify important users, display relevant contextual data and alter model logic. Tags can be automatically applied as a model action, used in model defeats to exclude devices, or factored into model logic. For SaaS users, tags may be also be applied automatically by the module to identify the roles assigned to the user - these tags are identified by “(CG)”. A small number of tags are restricted for system use only and are used to indicate devices excluded from monitoring or behaving erratically. Viewing and Editing Tags Tags can be managed in the tags manager, accessible from both the Platform Accounts Console or the Threat Visualizer, or via the API (/tags). Select tags Tags Manager from the Main Menu to open the manager. A list displaying all current tags will appear, optionally filterable with the search. From left to right, each entry contains the following: • A summary of the action taking place. • The start and expiration time of the action. • Whether the action was applied successfully. • The action status, if applicable. • The model or user that triggered the action. • Controls to extend, activate, reactive or clear the action. More detailed information about Darktrace RESPOND actions is provided in the main Darktrace RESPOND guide, from Reviewing Darktrace RESPOND Actions onward. a Darktrace RESPOND Actions The Darktrace RESPOND Actions window lists all current and expired Darktrace RESPOND Actions against the user. This tab will only be available if a licensed Darktrace RESPOND/Apps or Darktrace RESPOND/Zero Trust module is present. TAGS To review a tag, click on it. A summary page will specify (where applicable) the devices tagged, models that apply the tag, models dependent on the tag for breach logic and models that have the tag applied to them. All models and devices or users can be clicked. To further refine the list, the filter filter icon can be used to add an additional tag, filtering only by models/devices that share both tags. To edit or delete a tag, click the pen edit icon beside the tag name.
- 134. 134 Tag a SaaS User In the Platform Accounts Console, tags are added on the profiles page for the desired user. Tags are applied to and removed from users on a per-module basis. As Darktrace may observe a user on multiple SaaS platforms, tags on the user’s profile indicate which environment they are associated with. For example, “Office365 | Application Administrator (CG)”. Clickthe plus plus iconto open a dialogto add an additionaltag. Inthe pop-upwindow, locatethe tag and click on it to add to the device.Where the userhas multiple SaaS platforms associated, the account to be tagged can be altered with the dropdown in the bottom left. To add a new tag, click dts-tag-plus Add Tag from the Tags Manager. When creating a new tag, a description can be added to help identifythe purpose ofthe tag. Selecting a color assists identifying the tag when assigned to a device. Click Save. The new tag will appear on the tag manager. Add a New Tag ExecutiveThreat Reports can be generatedwithinthe PlatformAccountsConsole and present a simple visual overview of model breaches and activity in the SaaS environment. The report is separated into a graphical representations of network traffic (environments with network and SaaS only), model breaches and Darktrace RESPOND response and an optional detailed breakdown more suitable for advanced audiences. When the user has many tags, these are collapsed and can be shown in a popup, searchable dialog by clicking “View More” EXECUTIVE THREAT REPORTS Reports can cover a single day or up to 12 months (data-dependent) and can be customized to include extra details or restricted to high level information. In the Platform Accounts Console, the content of the report is restricted to only SaaS user devices and SaaS breaches. The Darktrace RESPOND page is also restricted to RESPOND actions from platform environments such as Darktrace RESPOND/Zero Trust and Darktrace RESPOND/Apps only. This is the equivalent of the “SaaS Report” option in the main Threat Visualizer.
- 135. 135 Generate a Report Once all desired options have been selected, click the Generate Report button to create the report. The generated report will appear within the window, where it can be downloaded as a PDF. Previously generated reports and those over a larger timeframe can be retrieved from the Download Reports page. Report Options To generate a report, navigate to Threat Report in the main menu - the following configuration options are available. OPTION DESCRIPTION Report Period Accepts a time range for the report period. The actual date period covered will be displayed in the two boxes beside the selector. Reports can generated for any period of less than 1 year, data- dependent. Timezone Alters the timezone of the report to that specified. Model Tags Alters the report to include only model breaches where the model has one of the chosen model tags. Filter Breaches Alters the report to include only unacknowledged model breaches (default), only acknowledged breaches or both acknowledged and unacknowledged. BehaviorVisibility Behavior categories are high level filters that allow an operator to focus in on specific levels of severity or behavior. There are four categories: Critical, Suspicious, Compliance and Informational. Select the categories to restrict included Model Breaches to only those that match the category filter. Minimal Report Generates only high level summary pages, excluding the detailed appendix. Include Comments Includes any comments made by users or analysts in the detailed appendix. Send Report Via Email Emails the report to the users specified in the “Executive Threat Report Recipients” field. This field is configured on the Modules section of the Darktrace System Config page (Workflow Integrations › Report Scheduler › Executive Threat Report)
- 136. 136 Open Tickets Within theAskthe Expert page, previouslysubmitted questions are listedwith theirtimestamp, owner, and status. Tickets can be filtered by status or sorted alphabetically or chronologically. Clicking on a question allows Darktrace responses to be reviewed and new comments or log elements to be added. Questions can be closed or deleted – closing will mark the status ofthe question as closed and resolved, without actually removing from the question list. What is Ask the Expert AsktheExpertallowsforthecreationofincidentswhichcanbesubmittedtoDarktraceanalysts for feedback. Submitted incidents can be reviewed and commented upon both by Darktrace analysts and local users. Questions have associated statuses and function as “tickets” that can be closed when resolved. In the Platform Accounts Console, Ask the Expert is available from the Main Menu. Incidents can be created with just textual input, or specific log lines and model breaches can be copied to a special clipboard for use in an incident. Where the clipboard clipboard-list icon appears, the element can be copied to the Ask the Expert clipboard. This element, with any other copied element, can then be inserted into a new or open Ask the Expert ticket using “Add from Clipboard”. ASK THE EXPERT IN THE PLATFORM ACCOUNTS CONSOLE
- 137. TAXII CONFIG 146 WATCHED DOMAINS 149 TRUSTED DOMAINS 150 DARKTRACE ADVANCED SEARCH 138 NAVIGATING ADVANCED SEARCH 139 SEARCHING ADVANCED SEARCH 140 CHANGING THE LAYOUT AND FILTERING ADVANCED SEARCH RESULTS 142 BUILDING A COMPLEX ADVANCED SEARCH QUERY 144 ADVANCED SEARCH AND INTEL CHAPTER 7 - ADVANCED SEARCH THREAT INTEL
- 138. 138 Main Menu Select “search-plus Advanced Search” from the main menu of the Threat Visualizer, or “search Advanced Search” from the Platform Accounts Console (formerly SaaS Console) sidebar. Event of Interest To review a Threat Visualizer event log entry in Advanced Search, click the caret-down triangle icon beside the entry and select the option “View advanced search for this event”. This applies to all log types, including the model breach log, device event log, and event log. This option may not be available for all connections or events. For the Platform Accounts Console, Advanced Search can be accessed from any event log line with the search search icon. Additionally, the caret-down triangle icon may appear beside detailed event properties such as actor or IP address. Selecting “Search Advanced Search for [this value]” from the options will open a simple search for that characteristic. What is Advanced Search? Darktrace analyzes network traffic through Deep Packet Inspection; each connection is processed and logs containing key metadata about the connection are produced. Similarly, Darktrace/Apps, Darktrace/Cloud and Darktrace/Zero Trust modules and other integrations analyze activity data from third-party platforms and create log entries for each event. The Threat Visualizer interface displays a relevant subset of this metadata in device event logs and breach logs, howeveras an investigation progresses,the need can ariseto reviewconnections and events in more detail. The Advanced Search interface provides searchable access to the detailed metadata logs produced by network traffic and event analysis. For advanced users, complex query syntax and data aggregation analysis are available. For those just getting started, simple queries can be built up slowly and saved for future use. Launching Advanced Search There are two ways to access Advanced Search: from an event of interest or from the main menu. DARKTRACE ADVANCED SEARCH
- 139. 139 The graph shows the results that match the search criteria across the timeframe selected, grouped bythe unit specified in the dropdown. The grouping defaults to largerunits like Dayor Hour when the search period is longer. Hovering over a bar of the graph will display how many events it contains. Clicking within the graph and dragging to create a window will zoom in on that timeframe and filter the log events accordingly. Each page displays 50 results, sorted by time from newest to oldest. The “backward Older” and “Newer forward” buttons can be used to move through the results, or the step-forward return button to return to the start. Matching results can also be exported as a CSV file or in JSON format. The notepad functionality can be used to note down interesting connections or analysis comments. Local storage must be enabled to use this feature, as well as saved layout and searches. Overview By default, all events from the last 15 minutes are displayed in order by time, with the most recent events at the top of the screen. If Advanced Search is accessed for specific event, the time will be focused on the event time and only relevant log lines will be shown. The Darktrace icon in the top left will reset the page to the current time with no search and the default timeframe selected. Searches can be manuallytyped out in the search bar or constructed from the building blocks available - how to perform a search will be explained in more detail later. Suggested searches created byDarktrace analysts are also provided on the left; click “Queries” toviewa list ofthese entries, then click an option to auto-populate the search barwith the chosen query. To the left of the search bar is the current search timeframe - this can be selected from one of the preset options or entered as a custom timeframe using the date selectors above the graph. The search period can also be moved forwards or backwards using the arrows below the graph. NAVIGATING ADVANCED SEARCH
- 140. 140 Saved searches are listed by the name given and indicated by the save save icon. Historic searches are indicated by the history history icon. Please note, these features require local storage to be enabled. If local storage is disabled, historic and saved searches will be lost. Set the timeframe to 15 minutes, enter @type:conn in the search bar and click Search. All connections processed by Darktrace in the last 15 minutes will be returned. For deployments with no network traffic, such as SaaS or Cloud only, substitute conn for a log type that can be seen in your environment such as @type:office365 or @type:amazon. Multiple fields and multiple values can be connected togetherwith comparators, for example: @type:dns AND @fields.source_ip=10.1.23.2. These additional conditions can be added manually, or by using the following buttons: • The equals equals button adds a newAND condition to the current search. • The not-equal does not equal button adds a newAND NOT condition to the current search. As a search term is entered, Advanced Search will attempt to match it to saved searches (name and query) and the last 10 historic searches. Matching searches will appear in a list below the bar. SEARCHING ADVANCED SEARCH Making a Basic Query A query consists of a field and a value, for example @type:dns where @type is the field and dns is the value. Simple searches for values like IP addresses or SaaS credentials, as well as wildcards (*) are also supported. Default Layout By default, the columns displayed are (from left to right): • Time: Date and time that the log entrywas created, in the time zone of the device used to access Advanced Search. Dates are shown in ISO format: YYYY-MM-DD hh:mm:ss. • @type: The log entry type - may be the protocol that was inspected, an event such as a connection or refer to the module that created the entry. For example: @type:conn indicates a connection, @type:kerberos indicates the protocol Kerberos was inspected and @type:Office365 indicates the entry was analyzed by the Darktrace/ Apps Microsoft 365 module. • @message: A tab-separated summary of the fields contained within the log entry. Some fields are included in the detailed log entry but not in the message field. For @ type:notice, a list of possible messages is available. Click on the entry to expand and display each of the fields in a table format.
- 141. 141 In the right column are the values that were derived for each fields during processing and analysis. Where a value has a external-link-alt link icon, the Threat Visualizer interface can be opened with a focus on that value. For example, focused on a specific connection (@fields.uid) or device (@fields.dest_ip) in the event log. Each rowofthe table can also be used to refine the current search orstart a newsearch based on the log entry. • The equals equals button adds the field and itsvalue as a newAND condition, narrowing the query to only those entries which match that value. For example, clicking this button in the @fields.proto row would add AND @fields.proto:udp to the query and limit the valid results to only those connections using UDP. • The not-equal does not equal button adds the field and its value as a newAND NOT condition to the current search, effectively results which have that value in the specific field. For example, clicking this button in the @fields.service row would add AND NOT @ fields.service:dns to the query and exclude any DNS queries from the results. • The sync circular arrows button does not modify the current search and instead starts a new search using the criteria in the entry. When this button is clicked in a row, a new search is created with the Source IP and Destination IP of the entry, as well as the field and value in the rowwhere it was selected. For example, the row @fields.dest_port would create a new query: @fields.source_ip:10.0.18.224 AND @fields. dest_ip:192.168.72.4 AND @fields.dest_port:53. In Darktrace/OT environments, the @fields.details field will also expand into a smaller subtable with all the capabilities of a normal row. Investigating an Entry From the search results, click an entry to expand the event and show a table with a list of fields and theirvalues. In the left column are fields - distinct pieces of data or metadata that are produced during analysis. Each log contains universal fields such as the time the entry was created (@ timestamp), a unique identifier (@fields.uid) and type specific fields which are only produced for that protocol or log type (@fields.saas_actor, @fields.query_class). Some fields, such as source and destination IPfields, are shared across connection log types and others are optional - appearing only where a value can be found in the processed traffic or event. Suggested searches created by Darktrace analysts are also a good place to start - click “Queries” on the left to view a list of these entries, then click an option to auto-populate the search bar with the chosen query.
- 142. 142 Some fields are optional and will not return for all log entries - optional fields can be added as a requirement or an exclusion from the current search query: • The equals equals button beside the name of the field will add a condition to the query that field must be present in each result. This takes the format AND _exists_:@fields. example. • The not-equal does not equal button beside the name of the field will add a condition that the field must not be present. This takes the format AND NOT _exists_:@fields. example. The number of results that include the field in question can also be highlighted by clicking “# events on this page”. Changing the Layout On the left of the page is a list of fields which appear in the results; the list can be collapsed with the chevron-left hide button. Each field listed can be added as a column in the results, making it easy to compare the value across all entries. This can be particularly useful to identify unusual log entries within a wide search criteria, orwhere the connection of interest is not yet known. Adding, as an example, @fields.dest_port as a column allows an operatorto quickly skim a list of connections for anomalously high ports orthose unusual forthe protocol under analysis. • The plus plus icon adds the field as a column in the results. The default @type and @ message columns are removed. • The minus minus icon removes a column from the results layout. Useful layouts can be saved by clicking the save save icon and providing a name for the layout template (Requires local storage). Existing templates can be loaded by clicking “Columns caret-down” and selecting from the dropdown. Field Summaries When the name of a field is clicked, a pop-up will appearwith a breakdown of values seen and options to perform data aggregation queries. Suggested Queries Below the Darktrace logo is the “Queries” header - this option provides a list of suggested searches created by Darktrace analysts. Click an option to auto-populate the search bar with the chosen query. The chosen query will also highlight green to indicate it is currently populated. CHANGING THE LAYOUT AND FILTERING ADVANCED SEARCH RESULTS
- 143. 143 • The Score action ranks values by frequency across the most recent 10,000 log entries that match the overall search query. Up to 100 values will be ranked in order of occurrence. In large instances, up to 100,000 results may be available for analysis. • The Trend action provides an estimation of the change in frequency for values across the time period. A segment of matching entries at the start and end of the time period are analyzed and the change in value occurrence calculated. • The Terms action also ranks values by frequency across log entries that match the query. This action is faster and performed against a larger number of results than the Score analysis, however it provides a less precise count. The number of entries analyzed where the field was missing will appear as a blank row above all othervalues. • The Stats action is only available for fields with numeric values. This analysis produces statistical information about the fieldvalue across the timeframe including the average value, the sum, the count and the min/max limits. In this mode, each bar of the graph displays the mean field value during that time interval on hover. The Field Description tab shows a brief description of the information the field contains. The same field may appear in multiple protocols but perform a different function - in this case, all possible type/description combinations are listed. The Values tab shows a summary of the values across the 50 results currently shown on the page, sorted by frequency of occurrence. The summary allows an operator to get a sense of the logs returned and spot outlier results which may be unusual. Beside each result is the percentage of log entries that include that value in the specified field - clicking a value highlights the log entries it appears in. • The equals equals button beside each value adds the field and its value as a new AND condition, narrowing the queryto onlythose entries which match that value. Where the value is ‘Blank’, a AND NOT _exists_:@fields.example condition will be added instead. • The not-equal does not equal button adds the field and its value as a new AND NOT condition to the current search, effectively results which have that value in the specific field. Where the value is ‘Blank’, a AND _exists_:@fields. example condition will be added instead. Data Queries At the bottom of each field summary are four buttons: “Score”, “Trend”, “Terms” and “Stats”. These buttons perform specific operations on the data returned by the search query and can be very useful to summarize large numbers of results. The Related Fields tab shows other fields that frequently appear in the same log entries as the selected field. Related fields are ordered by the percentage frequency that they occur alongside the selected field out of all currently displayed log entries where the selected field appears.
- 144. 144 The latterexample matches specifictop-level domain extensions - regardless ofthe hostname - that are indicative of encryption certificates used by TOR nodes. Searching by Field To search for (orwithin) the value of a field, use the name of the field followed by a colon: Examples: @fields.host:www.darktrace.com @fields.source_ip:10.10.* For numeric values, greater-than () and less-than () operators can be used to identifyvalues above or below a certain threshold. Example: @fields.orig_bytes:0 The notation TO within square brackets designates a range of numbers. Example: @fields.dest_port:[6881 TO 6999] The example above identifies a range of ports associated with the use of the BitTorrent file- sharing protocol. Constructing a Search Advanced Search allows forcomplex structured searches to be performed to retrieve detailed log information on connections. A wide starting search can be quickly focused using the buttons found across the interface to include and exclude values and fields. Searches over a longer period will take longer to complete. Searches that take too long will be aborted to prevent negative impacts on the performance of other parts of the Darktrace system. Narrowing the scope of the search by time or by making a more specific query will help the search to return results more quickly. Suggested searches created byDarktrace analysts are also provided on the left; click “Queries” to view a list of these entries, then click an option to auto-populate the search bar with the chosen query. Basic String Search Words can be entered freeform and will be looked for across all values in the database. Enclosing a value in quotation marks will search for an exact string match and treat spaces as part of the search term. Example: google Awildcard (*) can be used to represent any number of characters, Examples: *.darktrace.com @fields.certificate_issuer:*.com AND @fields.certificate_subject:*.net BUILDING A COMPLEX ADVANCED SEARCH QUERY
- 145. 145 Regular expressions can also be combined with the previous syntax examples. Complex Queries Advanced Search supports the Lucene 4 Query syntax Please note, this notation is not compatible with IP address ranges. Combining Search Conditions Conditions can be combined using the standard Boolean operators AND, NOT, OR. Most conditions added using the equals equals and not-equal does not equal buttons will take this format. Parentheses are also supported to group search conditions together The default operator (if no operator is specified) between space-separated values is AND. Examples: @type:conn AND @fields.proto:tcp @type:azuread AND (@fields.saas_metric:Saas::Login OR @fields.saas_ metric:Saas::FailedLogin) Boolean operators can also be used within parentheses to create shorter queries - the following two examples provide the same outcome. Examples: @fields.source_ip:10.10.4.3 OR @fields.source_ip:10.10.4.4 OR @fields. source_ip:10.10.4.7 @fields.source_ip:(10.10.4.3 OR 10.10.4.4 OR 10.10.4.7) Regular Expressions Basic Regular Expressions (regex) can also be used forvery specific searches. A regex must be preceded and followed by a forward-slash character (/) Example: @fields.host:/w{3}.darktrace.co.+/
- 146. 146 Sources The number of sources that have contributed IOCs - includes manual uploads and TAXII feeds. Accessing TAXII Config Darktrace can connect to TAXII servers and also import STIX XML files, these are used to provide threat intelligence. The Threat Indicator model will create model breaches when an observable derived from TAXII intelligence is seen. Darktrace supports the following indicators: Domains, Hostnames and IPv4 addresses. URIs are not supported. Each indicator will be searched for historically and added to the watchlist in case it appears in the near future. TAXII services with multiple polling endpoints are not currently supported. To access the TAXII Config page, navigate to the main menu and select Intel TAXII Config from the available options. The page is also accessible from the Modules section of the System Config page, or from the sidebar of another page in the Intel category. Summary The summary page gives an overview of the TAXII servers and feeds subscribed to and the IoCs derived all sources. TAXII CONFIG Servers Lists the hostnames of currently configured TAXII servers with details of the specific polled feed (collection). IOCs The “total” value corresponds to the number of IoCs that have been collected from the TAXII feed. Valid IoCsthat have been checked againstthe networkand successfullyaddedtothewatchlist are considered “processed” - this is displayed by the “% Processed” value. If the Valid Until field is a date before the Source Time (the time when the IoC was received by Darktrace) the IoC will not be processed. URIs and other unsupported types may also be processed by the service but will not be used. STIX Inbound Sources The STIX inbound sources page displays details of the last 10,000 observables received by Darktrace. Each entry will describe the time of the last seen observable, the confidence and the processed observables from the feed. Toviewall ingested IoCs from each source, clickthe expand project-diagram icon beside the source name.
- 147. 147 TAXII Services TAXII threat intelligence feeds can be added on the Configure TAXII Servers tab. Sources are derived from information contained within each STIX package - for STIX 1.2, this is typically the “Information Source” field. Information derived from STIX uploads and TAXII feeds can be viewed on the STIX Inbound Sources tab. For STIX packages uploaded without a defined “Information Source” field, the source will be ‘Ingested’. Where the STIX file originates from a defined feed and no source is provided, the source will default to the collection. STIX files produced by Darktrace Inoculation will have the source ‘Darktrace’, or rarely ‘Inoculation’ in the case of older IoCs. Confidence Each source will be assigned a default confidence of 50%. The source confidence can be modified by clicking the edit edit icon beside the source name. Expiry A default expiry of 2 weeks is applied to indicators, unless Valid Until is specified for the indicator in the information received by Darktrace. The default expiry can be modified to a value between 1 and 90 days, and set to override expiry information sent by the provider if desired. To do so, click the edit edit icon beside the source name. • When afeed is initiallyadded, Darktracewill request STIXpackagesthat are a maximum of 2 weeks old. Subsequent queries will ask for STIX packages which have arrived on the TAXII server since the last known threat indicator received from that service. • When polling is turned on, Darktrace will poll the TAXII server for new IoCs at the stated interval. • Indicators which are downloaded in a STIX package from a TAXII service are then checked against data within Darktrace. • Each IoC will be checked against historic connection data up to 2 weeks in the past (dependent on data stored). • Each IoC will be added to the Watched Domains/IPs list with a default expiry date of two weeks in the future. • If the STIX package includes a ‘valid until’ date this will be used as an expirytime forthe IoC in the Watched Domains/IPs list. ADDING TAXII FEEDS STIX FILES
- 148. 148 Adding a TAXII Feed Uploading a STIX file On the Upload tab, STIX files can be uploaded. Darktrace supports the following indicators: Domains, Hostnames and IPv4 addresses. URIs and other unsupported types may be processed by the service but will not be used. Each indicator will be searched for historically and added to the watchlist in case it appears in the near future. Navigate to the Upload tab and select the STIX-formatted XML or JSON file for upload. STIX versions 1.1.1, 1.2, 2.0 and 2.1 are supported. On successful upload, the number of observables and metadata fields derived from the file will be displayed. These can be reviewed on the Inbound Sources tab. 1. Navigate to the Configure TAXII Servers tab and click “Add New TAXII Service”. 2. Complete the required details of the TAXII feed Hostname, Collection, Discovery Path. Fields indicated with a * are mandatory. 3. Select a polling time in seconds to refresh the feed. There is a maximum setting of 86400 seconds (1 day) and a minimum of 60 seconds. This is the time between polling the individual TAXII services. 4. From the dropdown, select the STIX/TAXII version sent by the TAXII server. 5. Optionally configure a proxy and any authentication fields required by the third-party feed. Multiple methods are supported including Basic, Client Certificate and JWT authentication. 6. Finally, add the service by clicking Save Changes. Ensure that TAXII polling is enabled or the feed will not be refreshed.
- 149. 149 Domains can be added manually, through theAPI (/intelfeed), orvia configured STIX/TAXII intelligence feeds. No default list exists for watched domains. The Watched Domains page accepts the following formats when added manually: • IP addresses (192.168.0.1) • domains (example.com) and domainswith a single subdomain (example.example.com) • IP address ranges (maximum subnet range is /8, previously /16) An advanced configuration setting is available to allow a greater number of subdomains. Access the Watched Domains page from the Threat Visualizer main menu under Intel. In the Watched Domains workspace, all hosts, IPaddresses, IPaddress ranges and endpoints on the watch list are listed and searchable. At the top-left corner of the workspace, you can use a free text search bar to locate a specific entry, and results can be filtered by clicking the filter filter icon. The default option is to search by Domain/IP address, which can be altered to Description and Source from the drop-down menu. At the top-right corner of the Trusted Domains workspace, click Add to add new domains, hostname, IP addresses or IP address ranges to the Watched Domains list. If adding a range of IP addresses, the maximum subnet range is /8 (previously /16). Choose between Import CSV or Manual Input from the drop-down menu. • Choose Import CSV to upload an appropriately- formatted CSV format file. • Choose Manual Input to add an IP address, domain or IP address range. The endpoint entered will be automatically detected as a Domain, IP or Hostname. WATCHED DOMAINS Watched Domains Watched domains are endpoints of concern - whether due to known compromise, anomalous behavior or compliance - which will trigger a model breach and optional Darktrace RESPOND/ Network response if observed in ingested traffic. The Exact Hostnames flag indicates the value should be treated as an exact string only. Afree text Description, a selection of Sources, an Expiry Date, and a Strength from 1 to 100 can be set. Finally, Flag for RESPOND will trigger an automatic Darktrace RESPOND/Network action if the entry is seen. It is not possible to trigger a RESPOND action against IP ranges, only discrete entries. To add multiple endpoints concurrently, while at the Manual Input panel, click +Add another domain and a further free-text field will appear. This entry will share the parameters of the previous entry. When all the information has been input, click Add to Watched Domains. At the bottom of the screen, a notification will confirm the new addition. Adding New Entries
- 150. 150 TRUSTED DOMAINS Trusted Domains Trusted domains are domains which Darktrace considers as 0% rare. This feature ensures that models relying on domain raritywill not fire for activities involving common domains such as “google.com”. The list includes Domains, IP Addresses and IP Address Ranges. There is a default list, to which entries can be added on the Trusted Domains page. Access the Trusted Domains page from the Threat Visualizer main menu under Intel. Deleting and Exporting Endpoints Delete an Endpoint To delete a specific trusted endpoint from the list, click the square square icon on the left side of an entry. The icon will become ticked check-square and the Delete button on the top right will illuminate. Click Delete to remove the selected entry. To delete multiple entries, select all applicable entries and click Delete. To delete all entries, select the checkbox at the top of the list to select all entries, and then click Delete. Export an Endpoint To export a specific trusted endpoint, select the square square icon on the left side of an entry. The icon will become ticked check-square and the Export Selected button on the top right will illuminate. Click Export Selected to export the selected entry in CSV format. To export multiple entries, select all applicable entries and then click Export Selected. To export all entries, select the checkbox at the top ofthe list to select all entries, and then click Export Selected, or without selecting any entries click Export All. Both actions will exporting all trusted domains as a CSV file. In the Trusted Domains workspace, all endpoints that have been deemed as non-rare, or added by a user, are listed and searchable. At the top-left corner of the workspace, you can use a free text search bar to locate a specific entry.
- 151. 151 Delete an Endpoint To delete a specific trusted endpoint from the list, click the square square icon on the left side of an entry. The icon will become ticked check-square and the Delete button on the top right will illuminate. Click Delete to remove the selected entry. To delete multiple entries, select all applicable entries and click Delete. To delete all entries, select the checkbox at the top of the list to select all entries, and then click Delete. Export an Endpoint To export a specific trusted endpoint, select the square square icon on the left side of an entry. The icon will become ticked check-square and the Export Selected button on the top right will illuminate. Click Export Selected to export the selected entry in CSV format. To export multiple entries, select all applicable entries and then click Export Selected. To export all entries, select the checkbox at the top ofthe list to select all entries, and then click Export Selected, orwithout selecting any entries click Export All. Both actions will exporting all trusted domains as a CSV file. Deleting and Exporting Endpoints Trusted endpoints are excluded from raritycalculations and models which use domain rarity - be careful when selecting new endpoints to be added. At the top-right corner of the Trusted Domains workspace, click Add to add new domains or IP addresses. Choose between Import CSV or Manual Input from the drop-down menu. • Choose Import CSV to upload an appropriately-formatted CSV format file. • Choose Manual Input to add an IP address, domain or IP address range as free text. To add multiple endpoints concurrently, while at the Manual Input panel, click +Add another domain and a further free-text field will appear. When all the information has been input, click Add to Trusted Domains. At the bottom of the screen, a notification will confirm the new addition. Adding New Entries
- 152. CREATING A NEW MODEL 166 ADDING COMPONENTS TO A MODEL 167 ADDING FILTERS TO A MODEL COMPONENT 168 DEFINING MODEL COMPONENT BREACH CONDITIONS 170 TUNING MODEL SCORING 172 ADDING ACTIONS TO A NEW MODEL 172 TIPS FOR NEW MODEL MAKERS 174 LOOKING AT A MODEL 157 COMPONENTS AND FILTERS 158 MODEL BREACH LOGIC 159 MODEL CONDITIONS AND SCORING 160 MODELACTIONS 161 MODEL DEFEATS 163 MITRE ATTCK MAPPINGS IN THE MODEL EDITOR 164 OTHER MODEL TABS 165 THE MODEL EDITOR 153 MODEL EDITOR OVERVIEW 154 FILTERING THE MODEL LIST 155 BULK ACTIONS IN THE MODEL EDITOR 156 MODEL EDITOR CHAPTER 8 - USING THE MODEL EDITOR UNDERSTANDING A MODEL MAKING A NEW MODEL
- 153. 153 Model Updates Darktrace will periodically update the standard supplied models – either automatically for customers with Call-Home, or manually through software updates. If changes are made to a model logic outside of the defeats system, it will no longer be eligible for automatic updates. Please see Upgrading Darktrace Models or the System Administration guide for more information. Introduction to the Model Editor Darktrace models are a series of logical statements and conditions which, if met, trigger an alert or action; models are primarily used to identify and alert on anomalous and potentially malicious behavior. The Threat Visualizer platform provides a curated set of default models as standard, designed and constantlytuned bythe specialized Darktrace analystteam. Darktrace- maintained models are frequently updated in parallel with the evolving threat landscape. The models framework leverages both the underlying ‘pattern of life’ detection and outputs from Darktrace Deep Packet Inspection, telemetry inputs, Darktrace/Apps, Darktrace/Cloud and Darktrace/Zero Trust modules. Output from the complex anomaly framework is available in accessible, building block format and can be combined with simple conditions and logical expressions to create tailored activity detection. Models can also be used to profile a device, assign tags, highlight misconfigurations ortrigger autonomous responses from the Darktrace RESPOND framework. Creating custom models can be a straightforward and powerful way to integrate Darktrace into your existing security processes or replicate a SOC playbook. THE MODEL EDITOR
- 154. 154 Clicking the name of a folder or the line beside a folder will expand to show the models and subfolders it contains. Clicking again will collapse the folder. The folder-tree directory icon collapses all open folders. Deactivated models in the model list are indicated by darker text. Individual Models MODEL EDITOR OVERVIEW The Model Editor In the Threat Visualizer interface, the Model Editor is accessible from the main menu under Models Model Editor orfrom anybreach logwith the “ Clicktoviewmodel” button. From the Platform Accounts Console (formerly SaaS Console) interface, the Model Editor is available from the sidebar (“exclamation-triangle Model Editor”). The editor is comprised of a list of current models (left) and a main workspace where model logic can be reviewed and edited. If the editor is opened from an event log - such as a model breach log - the main workspace will be focused on the model. The home home button can be used to return to the main Threat Visualizer interface and the arrow-right-from-bracket log out button to exit the Threat Visualizer platform. The ellipsis-h more options button in the top right provides access to the legacy model editor, bulk model import and bulk model export functionality. The “Add” button opens a new, blank model for configuration. New models will be covered in more detail in Creating a New Model. Model List The default view is the “Folder” tab. Models are sorted into folders which describe the general purpose and detection area of the model. Models can also be tagged to identify the purpose or the potential attack phase for the activity it detects. Using tags can be particularly useful when categorizing custom models orwhen constructing filters to send email alerts to specific teams or users. Beside each model in the list is an question-circle info icon. Clicking this icon will open a summary tooltip containing: • The Folder(s) the model is in. • The model title. • Tags applied to the model, if applicable. • The model priority. • Actions in response to a breach. • A Model description, where available. • Last edited date. The tooltip can be useful to quickly review a list of models in a folder before selecting one to duplicate for editing purposes. Click on a model to open a detailed overview in the right-hand pane.
- 155. 155 Model Actions Tab Model actions are system actions which can be triggered in response to a model breaching. Models can also be sorted by the action(s) they perform. This can be a useful way to identify all Darktrace RESPOND models (“Antigena”), or all models which apply tags. When the view is set to action, all model actions are shown above the list of models. Clicking on an action will list all models that perform it. Additional actions can be added, or filters can be removed with the trash-alt trash icon. For Darktrace RESPOND actions, the state of the RESPOND action - e.g., “Force Human Confirmation” - can be further filtered by. This is a quick way to identify models which are permitted to take autonomous action at all times, or those forced to always require permission. Filtering the Model List There are multiple ways to filterthe model list to display only relevant models. The list of models can be sorted alphabetically, by priority, by creation date or by last edited date. Searching for a keyword or model title will filter the list of models and folders to only those with a title or description that includes the search terms. Use the “filter Filter” option to show/hide models based upon their active state (enabled/disabled), whether theyhave anymodel defeats applied, andwhetherthey are in the “Compliance” threat behavior category. Bulk actions can be performed on multiple models at once; this is covered in BulkActions in the Model Editor. FILTERING THE MODEL LIST The tag view is a way to filter the list of models to those with specific tags applied. When the view is set to tags, all tags applied to models are shown in the sidebar. Clicking on a tag will list all models it is applied to. Above the model list is a selection of suggested tags to filter by - clicking these suggested tags will add them to the filter. Tag filters can be removed with the trash-alt trash icon. Model Tags Tab
- 156. 156 Bulk Actions The following options are available for bulk edit: EDITABLE SETTINGS DESCRIPTION Model Priority Model priority is a modifier applied to the final score assigned to the model - higher priority models will have a high model breach score. It also controls which threat behavior category a model is applied to (0-3 Compliance, 4 Suspicious, 5 Critical) Active status Whether the model is turned on or not. De-activating a model can be a useful way of preserving the logic for future tuning without removing it entirely. Auto Updates Not applicable to custom models. Whether the model can be automatically updated (if permitted by other factors). Auto Suppression Controls whether the model should be automatically suppressed by the modeling engine if triggered an excessive amount of times in a short period. EDITABLE SETTINGS DESCRIPTION RESPOND State The models “RESPOND” state impacts whether autonomous RESPOND actions can be taken as a result of the model triggering. Please refer to Model Actions for more information. Model Tags Add one or more tags to the model(s). Tags can be used as a filter within the model editor or for external alerts. Compliance When “true”, includes the model in the “Compliance” threat behavior category. This category takes precedence over the priority setting. Refer to Filtering Alerts with Behavior Categories for more information. Certain settings can be changed across multiple models at the same time using bulk actions. When one or more model is selected, a dropdown will appear where the sort option was previously. BULK ACTIONS IN THE MODEL EDITOR • Clicking the check-circle tick icon that appears to the left of the model name will select that model. • Clicking the check-circle tick icon that appears to the left of a foldernamewill select all models contained within. • Clicking the circle circle icon at the top left of the list below ‘Folders’ will select all models.
- 157. 157 LOOKING AT A MODEL For this example, we will look at a version of the “Anomalous Connection / 1 GiB Outbound” model. Clicking on the name of any model will open the model overview on the right. Please note, as Darktrace models are tuned and updated with high frequency by a specialized analyst team, the versions of the model here may not correspond with the versions in your environment. These models are only used for example purposes and the concepts apply to any model - custom or default - which you may encounter. Main Overview At the top of the overview is the folder, the model name and any tags applied. Both the top- level folder and tags can be used as filters in the threat tray. Underneath is a description of the behavior the model is targeting and a potential action to take in response to a model breach. There are three toggles: • Active: Determines whether the model is active or not. Allows the user to turn a model off - rather than deleting it and having to recreate it at a later date - so it will not breach during that time. • Auto Update: Where models are set to update automatically in the global config setting, individual models can have auto-update disabled so that updates must still be manually approved. Breach Logic Tab The first tab of the model overview contains a summary of the model logic. Models are constructed from components - a series of logical statements evaluated against a connection, event or device. A model may have more than one component. The dropdown indicates the relationship between those components that is required to produce a model breach. There are two types of component relationship: “All Components Are True” and “A Target Score is Reached”. All Components Are True In this mode, all components in the model must evaluate as “true” for the model to breach. This is known as a ‘checklist’ model. A Target Score is Reached In this mode, components are assigned a positive or negative weighting and a target score is set for the whole model. This is known as a ‘weighted’ model. If a component evaluates as “true”, it then contributes the ‘points’ it has towards the target score. A negative weighting can be used as a control. If enough components evaluate as “true” to meet the target score in the timeframe specified, the model will breach regardless of the status of any remaining components. • Auto Suppress: Determines whether this model will be automatically suppressed if it breaches repeatedly in a short timeframe for the same device and with the same set of breach conditions. If a repeatedly breaching model is suppressed, from that point onward it will generate at most one breach perweek for any given device and the same breach conditions. Recommended for most models.
- 158. 158 COMPONENTS AND FILTERS Components Components are made up of metrics and filters. Each component looks at exactly one metric, filteredwithzeroormorefilters.Themetricisthemainbehavior,event,orconditionthatdefines the component, and filters are restrictions or stipulations that matching events or activity must meet for the whole component to be satisfied. The list of filters changes according to the selected metric - only filters that are relevant to a metric are available. Metrics can cover many different types of activity or event, for example: • Specific activity performed by a device, such as number of connections or volume of data transfer. • Distinct events, such as a failed login to a SaaS platform or the use of a new credential. • Activity deemed unusual in comparison to the ‘pattern of life’ and other outputs from Darktrace CyberAI. • A reference to components in another model or Darktrace RESPOND (formerly Antigena) actions that have taken place. In this example, the metric is “External Data Transfer (Client)” and the activity must meet the condition “ 1 GiB” within the timeframe of 1 hour. The component is therefore targeting large data transfers from standard, non-server devices to an external location. Each component is summarized in this wayto give a quick understanding of the type of activitythat it is looking for. Filters The number of filters applied to the metric is also listed - click the component line to expand the filters. Here, there are three filters applied to the External Data Transfer: the data transfer must be outbound, it must be to the same IP and it must not be to an address in the Multicast network range.
- 159. 159 Frequently a component will have many filters which cover different scenarios or act as controls, where the filters are not intended to all be used at once. In this case, multiple lines of logic will be defined in the Breach Conditions. Forexample,the“ActiveRemoteDesktopTunnel”modelhas“ActiveConnections”components where the filters correspond to a selection of ports. Each filter in this case reflects a slightly different connection scenario and consequently, multiple combinations of these filters can trigger a breach. Where a component has multiple lines in the breach conditions, these should be treated as an ‘OR’ relationship. In this example above, the logic looks like “A B E I OR B D E I OR B E H I”. For a component to evaluate as true overall, one ofthese lines of breach condition logic must be satisfied. Breach Conditions Each filter is assigned an alphabetical reference which is used to define the breach conditions. Breach conditions for a component are a list of possible filter combinations that should trigger a breach. In this example model, the relationship between the three filters is very simple - all three filter conditions must be met for the component to evaluate as true - and therefore the breach conditions are represented as “A D E”. MODEL BREACH LOGIC Display Fields Display fields are extra filters which do not have an impact on the component logic. Instead, they are used to include additional information in the model breach alert or breach log entry when a component breaches. For example, adding a display field of “Source Port” will result in the port number that the breaching connection originated from being included in the log. Display fields make it easier to triage model breaches in the threat tray, as you can quickly see the interesting features of the activity Darktrace has detected as anomalous.
- 160. 160 Target Score The total score that must be reached when adding the points assigned to triggered components to create a model breach. Delay Breach If the model has a negative component, this option will appear. If turned on, adds the “Delay Breach By(seconds)”fieldto specifya delayto allowactivityto happenthat meetsthe negative component’s criteria. Delay Breach By (seconds) Minimum delay in seconds after a positive-scoring component has fired before the overall model score is calculated. This option is useful to prevent a model breach where the negative component activity may occur shortly after. Target Score must be reached within the following seconds A limit on the time within which enough components must triggerto reach the target score, so that the model may breach overall. All components must be breached in the above order When true, components must be triggered in order from top to bottom. Components can be rearranged by clicking and dragging. All components must be breached within the following seconds A limit on the time within which all components must trigger for the model to breach overall. All components must share endpoints Requires components to be triggered by the same destination endpoint for the overall model to breach. This option will not be displayed if there is only one component in the model. Component Settings Where a model has more than one component, component settings can be defined which limit the timeframe and order in which components must be triggered for a model breach. Component settings available differ between the two model types: checklist and weighted models. Checklist Model MODEL CONDITIONS AND SCORING Weighted Model
- 161. 161 For other behavior types repetition makes the activity potentially more serious. Selecting a modulation curve will determine how the scoring of repeated breaches for a given device should be adjusted. MODEL ACTIONS All components must share endpoints Requires components to be triggered by the same destination endpoint for the overall model to breach. This option will not be displayed if there is only one component in the model. Score Modulation Determines the modulation curve forthis model –when the same device repeatedlybreaches a model, the score of subsequent breaches will be adjusted. For some behavior types, repetition indicates that the activity is likely less worthy of attention from the security team. Generate Model Breach (+ Breach) The most basic response is breach, which triggers the system to generate a model breach alert in the Threat Visualizer threat tray. In the majority of cases, triggering a threat tray entry is desirable to alert Threat Visualizer users to the activity detected. Where a model is used for identification purposes - for example to tag a device that exhibits specific, non-malicious behavior- producing a threat trayentryis not desirable and the breach action can be removed. The model’s prioritywill affect the strength with which it breaches, so that if particular types of behaviors are of greater interest to you, these behaviors will register as more strongly relevant andwill be more obvious in the threat traythan ifthe prioritywas lower. Breach prioritycan also be used to control alerts to external systems where a model is also set to alert. Alert External Systems (+ Alert) The next step from generating a threat tray entry is the alert action. A model with this action will triggerthe system to send an alert to all configured alerting outputs. Only models with this action will trigger external alerts. Model actions are system actions which can be triggered in response to a model breaching.
- 162. 162 Tag Device (+ Tag Device) A model can add a tag to a device on breach. This can be particularly useful where models are used to profile a device or to mark a device as high risk due to its behavior. Tags can be given an optional expirydate; a device can therefore be added to a ‘risk pool’ fora set amount oftime in response to a model breach, and automatically leave it after a set period such as two weeks. Device Type (+ Device Type) Darktrace detects device types automatically and assigns a most likely type based upon device activity and traffic analysis. Device types can be overridden on the Device Admin page or via the API. Models can also reassign device types as an action. Instead of setting device types manually to match asset registers, a model can be configured to match a hostname convention and assign device types accordingly. The additional benefit of a model is that new devices will be assigned automatically as they appear and trigger a breach, reducing the amount of repeated manual configuration required. As of Darktrace 6.1, models can only override device types set by passive analysis or by hostname expressions, and types set by models can only be overridden by other models, or by manual human override (UI or API). Model The Model action is a default action applied to all models. Darktrace RESPOND (+ Darktrace RESPOND) Darktrace RESPOND (formerly “Antigena”) is the framework that takes autonomous actions in response to potentially malicious activity. Default Darktrace RESPOND/Network actions are triggered with meta-models which look for the presence of one or more Darktrace RESPOND (Antigena) tags on a model breaching device. Darktrace RESPOND capability can also be added directly to a model by adding this ‘Antigena’ action section. Inhibitors - response actions - can be selected for each Darktrace RESPOND type enabled on the deployment. Inhibitors can be automatic, where Darktrace RESPOND selects the most appropriate action at the time, or pre-defined from the list of options. By default, inhibitors will be active for one hour (3600 seconds). RESPOND State controls when the action is taken without human confirmation. If set to “Force Human Confirmation”, the model will always ask for confirmation before taking an action - regardless of the global state. In “Permit Autonomous Action” (previously “take autonomous action”) mode, a response will be taken automatically unless confirmation for actions is required globally. If “Force Autonomous Action” is chosen, the model will override the global schedule and always take action without confirmation. Optionally, a threshold can be defined which restricts Darktrace RESPOND response to breaches of the model that exceed the limit. For models where the threat score reduces over time, it can be desirable to permit autonomous actions against the first one or two model breaches but not after that point. The Darktrace RESPOND Threshold therefore sets the lowest breach score above which Darktrace RESPOND will take the specified response. Assign Priority Score (+ Priority Score) Device priority is a scoring system which marks device importance - higher priority devices will produce higher model breach scores. Device priority can be increased and decreased as a model breach action. For example, a model which profiles devices may increase the priority of a device if it displays activity consistent with a server. Similarly, a model breach can be used to raise the priority of a device so that future alerts - which may indicate a developing security event - are more prominent and higher scoring.
- 163. 163 MODEL DEFEATS In this example, the model is prevented from breaching if the device that sends data outbound has a hostname that matches the regular expression (u-infra-)[0-9]+.When the comparator is positive - e.g. “matches”, “is”, “contains” - the defeat essentially excludes a subset of devices or activity from triggering a breach. Conditional Defeats From Darktrace Threat Visualizer 6, defeats can be conditional - one defeat can contain multiple “AND” conditions that limit the scope. Where the model is a checklist, the overall logic can be thought of like: What Are Defeats? Defeats are different from negative filters. Filters in the model logic limit the connections, events or activity eligible to trigger a breach down to only those that are relevant. These are integral parts of the model logic. Defeats are specific conditions which prevent a model from breaching - they are distinct from the logic. Because of this distinction, defeats are specific to each environment and do not prevent the main model logic from being updated. Adding a defeat to a Darktrace-maintained model does not make it ineligible for model bundle updates. Defeat conditions offer more specificity than device-based exclusions or restrictions and can also target a large range of devices by characteristics like device type or hostname. Defeats can be a useful tool to tune existing models to suit your environment as your deployment develops, whilst also leveraging the expertise of the Darktrace analyst team as they update default models to match the ever-changing threat landscape. Defeat Logic In contrast to components, no defeats can evaluate as true for the model to breach - each defeat should be considered as a series of “AND NOT” logic lines against the whole model. Where the model is a checklist, the overall logic can be thought of like: [component 1] AND [component 2] AND NOT [defeat 1] AND NOT [defeat 2] For example, an organization has an update infrastructure that regularly sends large files to external locations - all internal devices in that infrastructure use a hostname convention “u-infra-##”. These devices can be excluded from the scope of the model with the defeat: [Internal source device hostname] [matches regular expression] [(u-infra-)[0-9]+] [component 1 must be true] AND [component 2 must be true] AND NOT [IF ([A]) is true] AND NOT [IF ([A] AND [B]) is true] Continuingthe example above,we can restrictthe defeatto justthosewhich matchthe regular expression and are detected as server device types. IF ([Internal source device hostname] [matches regular expression] [(u-infra-)[0-9]+]) AND ([Internal source device type] [is] [Server - Any]) To add a condition, click the horizontal-rule line icon on the right of the defeat line.
- 164. 164 Negative Defeats Defeats can also be used to limit the scope of a model - this is a very powerful tool to tailor modelstoyourenvironmentbutmustbecarefullyexecutedtoavoidover-limiting.Forexample, adding the following defeat would restrict the model to only breach when the device has the File Server tag: [Tagged internal source] [does not have tag] [File Server] If a defeat condition evaluates as true, it prevents the model from breaching entirely. In the above case, the defeat will evaluate as true for all devices not tagged with “File Server” - essentially limiting the model to only breach when the device is tagged. Defeats with negative comparators can therefore constrain a model to very specific breach criteria. Bulk Editing Defeats Defeats can be downloaded and edited as a .csv file, then re-uploaded to the model. This can be a quick way to add the same defeat conditions across multiple models. Models curated and maintained by the Darktrace analyst team are mapped to the MITRE ATTCK Framework, where applicable. This applies to both standard Darktrace DETECT models mapped to MITREATTCKEnterprise techniques, and Darktrace/OT models mapped to MITRE ATTCK ICS techniques. This mapping is a valuable tool to understand coverage and for teams with internal playbooks for howto address each technique. For each model, the MITRE ATTCK Mapping tab displays MITRE ATTCK MAPPINGS the tactics and techniques the model covers are displayed on this tab. For each technique, click ” View in MITRE” to open detailed information about the technique on the MITRE website. AJSONfile ofall mappings can be downloadedfrom anymodel. In Darktrace/OTenvironments, this option will download both the standard Darktrace DETECT mapping file and the specialized Darktrace/OT ICS mapping file. This mapping file can be uploaded to the MITRE ATTCK navigator to browse the mapped techniques. If you are unsure how to use this file, refer to the instructions provided in “JSON Usage Instructions external-link”
- 165. 165 Model Breaches The Model Breaches tab displays a graph of breaches for the selected model over the given timeframe - by default, two weeks are displayed. The time window covered by the graph can be adjusted in the bottom right and can return up one year of model breach data (where available).Acknowledgedbreachescanbedisplayedorhiddenwiththe“ShowAcknowledged Breaches” toggle. OTHER MODEL TABS The graph displays each model breach as a node. A tooltip with the device, breach score and exact time of breach appears when hovering over a node. The average breach score across the timeframe is displayed as a red line. Grey,vertical lines indicate a that the modelwas edited, and the logic potentially altered. Under the graph is a list of devices that breached the model in the given timeframe, where each row corresponds to a specific device. The type of devices breaching the model are also summarized in the top left. Each device is identified by the hostname, IP and/or MAC address where available. On the right, the number of breaches and the time of the last breach are displayed. Clicking the number of breaches opens a new window or tab with a Breach Log for each event. • In the first mode, ignoring any device will place it on a list of devices ineligible for breaches. This is an “Exclude” list. • In the second mode, all devices apart from those explicitly listed will be treated as ignored. This is an “Include” list. Only one mode can be selected. When the model is edited, devices can be added via the search bar and remove with the “Remove” button. The user-minus ignore device button is located beside the number of breaches - ignoring a device is in addition to the defeats system. When a device is ignored, it will never trigger a model breach forthe model in question, even ifit performs behaviorthat matches the model criteria in future. If the icon is greyed-out, the device is already ignored and must be added to or removed from the device list, depending on mode, to become eligible to create breaches again. To download the list of devices that have triggered the model overthe time period, click the “arrow-to-bottom Export Model” button beside the time range. Device List The device list displays the devices current eligible or ineligible to generate model breaches. A model can either be applied to all relevant devices - those not already removed by defeats or model logic conditions - or a select subset of devices.
- 166. 166 Basic Information Model Name First, select a name for the model. The model name can also be used to control alerts to external outputs so should be clear and concise. Description Adding a description will help other users of the Threat Visualizer understand the purpose of the model when they observe it in the main Threat Tray. A description is optional but highly recommended. Active Now set whether the model should be active when it is created - only active models can breach. Toggling a model to inactive allows the user to turn a model off for a time (rather than deleting it and having to recreate it at a later date). Auto update This setting determines whether a model will be automatically updated or not when a new version is available from Darktrace. This is not applicable for custom models. Creating a Custom Model To create a new model, click the “Add” button beside the search bar. Models are sorted into folders to categorize their purpose or by the type of activity they are looking for. If a model contained within a folder is open when the “Add” button is clicked, the new model will be automatically placed within that folder. Models can also be dragged-and- dropped into folders using the model list after creation. CREATING A NEW MODEL
- 167. 167 Filters It is not desirable to alert on every connection that occurs, just some interesting connections; filters therefore limit the number of events that can trigger the component. Some metrics are very precise and do not need qualifying with filters. We will now proceed to add filters to the new model. Building Components Components are created from metrics - discrete events or activities that are observed by the Threat Visualizer. To start building the model, click “+ Add Component” to add the first component. Select the Metric the Model should include. The available Metrics are listed in Model Editor Metrics but may differ depending on your environment and any additional Darktrace modules and integrations providing data. At the right of the ‘’ symbol, enter the number of times the filtered metric should be seen before the component will trigger. A zero in this field means any number of times. The default component identifies at least one connection in 60 minutes. The frequency and the time period can be altered to identify activity over a shorter or longer period. Othermetrics can be selected forevaluation - click “Connections” to open a dropdown of metrics categorized by their type or by the models they are relevant to. Either select a new metric from the dropdown or proceed with the default “Connections”. The relationship between components and metrics is covered in more detail in Components and Filters. Breach Logic The breach logic is the most important part of the model. The components and filters that make up the breach logic define the activity the model is looking for. Each model has one or more components - types of activity to detect - which are controlled with filters to limit the eligible connections or activity that could trigger a model breach. There are two types of model: checklist and weighted. These were discussed in more detail in Looking at a Model. Simply, the type of model defines the relationship between those components that is required to produce a model breach: • Checklist = “All Components Are True” • Weighted = “A Target Score is Reached”. Select the type of model before proceeding. ADDING COMPONENTS TO A MODEL
- 168. 168 Example Match: mail.google.co.uk google.co.uk Example Breach Condition [Connection Hostname] [matches] [?oogle.co.uk] Example Match: google.co.uk Contains / does not contain Tries to locate the exact string provided anywhere within the filtered field. Example Breach Condition [Connection Hostname] [contains] [`darktrace`] Example Match: darktrace.com Matches regular expression / does not match regular expression Attempts to match a value in the field against a regular expression. Does not support lookups. The comparator is case-sensitive but can be made insensitive by surrounding the expression with forward-slash and appending an ‘i’. Filters are combined with comparators and values to create breach conditions. Filter Comparators Matches / does not match Attempts to match the string provided against the value in the field. If * is used, performs a simple wildcard match of any length. If ? is used, performs a wildcard match against a single character. Example Breach Condition [Connection Hostname] [matches] [*oogle.co.uk] Model Filters Each metric has a list of applicable filters that can be used to limit its scope. For example, connection metrics can be filtered by hostname rarity, ports and connection details such as length and data transfer. SaaS activity, representing discrete events, can be filtered by the user involved, the SaaS platform, the geographic location of the action, etc. ADDING FILTERS TO A MODEL COMPONENT
- 169. 169 Example Breach Conditions [Tagged Internal Source] [does not have tag] [Admin] Numeric Comparators Thefollowingnumericcomparatorsaresupported.Dependingonthefilter,notallcomparators may be available. • (Less than) • = (Less than or equal to) • = (Equal to) • != (Not equal to) • = (Greater than or equal to) • (Greater than) Example Breach Conditions [Rare external IP] [=] [90] Other Filters Some very specific filters do not have comparators orvalues. For example, the “Direction” filter offers the values “Incoming only” and “Outgoing only” instead of defining a comparator. The “Same IP” and “Unique IPs” filters do not have any comparators or values at all. The majority of filters behave exactly as described above. Where filters differ, the logic should still be clear. Example Breach Condition [Message] [matches regular expression] [(Anomalous|Compromise|Device|Unusual Activity|User|Infrastructure).*] Example Match: Device / New Failed External Connections Is longer than / is shorter than This comparator accepts a number, representing the number of bytes. Example Breach Condition [DNS Hostname Lookup] [is longer than] [0] Is / Is not Allows for values to be selected from a list of predefined values. Also includes booleans. Example Breach Conditions [Day of the Week] [is] [Sunday] [Proxied Connection] [is] [False] Has tag / does not have tag For tagged internal sources or destinations, allows the tag to be selected from a list.
- 170. 170 Metric: [External Data Transfer] [] [100 MB] in [60 Minutes] Filters: A - [Day of the Week] [is] [Sunday] B - [Proxied Connection] [is] [False] C - [Tagged Internal Source] [does not have tag] [Admin] Breach Conditions: A B C This limits the component to only breach when all filters - A and B and C are satisfied. In this case, the component would only breach when a non-admin device transfer more than 100mb externallywithin an hour on a Sundaywithout using a proxy. There is often more than one set of criteria we wish to apply to a component, for example when an event can be identified differently over UDP or TCP. Components are therefore not limited to one set of breach conditions - multiple sets can be built in an OR relationship with one another. Breach conditions connectfilterstogetherin logical sequences. Eachfilterhas an alphabetical reference which corresponds to a ‘bubble’ in the conditions. When a bubble is clicked on, it becomes highlighted and is now a required condition for the component to breach. Multiple required components should be thought of in an ‘AND’ relationship. Worked Example Filter Logic When more than one filter is defined for a component, the Breach Conditions section will appear - this is where the relationship between filters is defined. DEFINING MODEL COMPONENT BREACH CONDITIONS
- 171. 171 Metric: [External Data Transfer] [] [100 MB] in [60 Minutes] Filters: A - [Day of the Week] [is] [Sunday] B - [Proxied Connection] [is] [False] C - [Tagged Internal Source] [does not have tag] [Admin] Breach Conditions: A B B C Here, the same filters are in use, but component can breach in two different scenarios - either A and B are satisfied, or B and C are satisfied. In this case, the component would breach when any device transfers more than 100mb externally within an hour on a Sunday without using a proxy, OR if a non-admin device transfers more than 100mb externally within an hour on any daywithout using a proxy. At the end of each breach condition, the logic is summarized for review. These conditions can be chained together to create complex and carefully targeted model components. “Always Required” Some filters are very restrictive, such as connection direction or restrictions on IPs, and therefore must be applied across all breach condition lines regardless. These filters have blue ‘bubbles’ and will display “Always Required” in the tooltip on hover. Adding Display Fields The final step of defining a component is selecting display fields. Display fields control the at- a-glance information displayed to the userwhen a breach is triggered bythe component, they do not impact the logic of the model itself. Display fields should include the most important information an analyst would need to triage a model breach. For example, in a connection-based model an analyst would need to knowthe IP, protocol and port involved in the breach event. In a SaaS model, it would be useful to know the resource (like file or cloud infrastructure element) involved in the activity or the ASN of the source IP to identify the geographic location. In the componentyou areworking on, expand the Display Fields headerand click ‘+ Add Field’. The default display field for the main component metric will be added. For example, for the “Connections” metric, the default displayfield is “Connection Hostname”. To choose a different field, click on the name and a selection of relevant filters will appear in the dropdown. Worked Example
- 172. 172 The Model action is default for all models. This creates an event in the device’s event log without creating an alert or model breach in the threat tray. The Generate Model Breach action causes the system to generate a model breach that will appear in the threat tray. Within this action, a priority can be set for the overall model breach: Breach priority Assign this model a priority score of 0-5. The model’s priority will affect the strength with which it breaches, so that if particular types of behaviors are of greater interest to you, these behaviors will register as more strongly relevant and will be more obvious in the threat tray than if the prioritywas lower. ADDING ACTIONS TO A Model Actions The purpose of each model action was covered in further detail in Model Actions. A model can triggermore than one action in response to a breach. Here, it is important to considerthe most relevant set of actions for the behavior targeted by the model. If the model is looking for malicious activity that requires analyst intervention - triggering an alert output is a reasonable response. However, for a model identifying all Office 365 admin users, it is not the most appropriate action to trigger. Instead, an increase in device priority is a logical response to ensure any potential compromise of an admin account has a suitably high threat score. Score Modulation Score modulation controls how the model score should change as the model breaches over time for a given device. There are four configuration options. • Decreasing: As a device keeps triggering the same model, the threat score of the breach will lower over time. • Increasing: The more a model fires, the higher the threat score for the device. • Stable: The Threat score will remain the same no matter how often a device triggers a breach of this model. • Increase then Decrease: Initiallythe threat scorewill increase butwill reduce overtime if the model keeps firing. Some activity becomes less anomalous over time. For example, connections to a new internal server become less concerning as they become part of the ‘pattern of life’. Contrastingly, some activity becomes more anomalous over time. For example, the more failed connections a device makes to internal devices in a short space of time, the higher the likelihood of a malicious network scanning incident. Other activity remains concerning regardless of frequency. This is particularly true of compliance issues where an activity is always in contravention of a policy regardless of how often it occurs. Finally, some activity is potentially malicious when it happens frequently in quick succession but can be less concerning if remains frequent over a long period. For example, the scanning activity above is concerning at first but if repeatedly occurring may indicate a network configuration error or a DNS issue rather than a malicious incident. Selecting a score modulation is important for controlling how your new model behaves over a longer period and ensures the alerts it produces stay relevant and useful to other Threat Visualizer users. TUNING MODEL SCORING MODEL
- 173. 173 Defeats List The final element to configure before saving the new model is the defeats list. Defeats are conditions which prevent the model from breaching but are separated from the model logic. How defeats can help tune the models in your environment was covered in Model Defeats. • 0 System Event • 1 Low Impact • 2 Interesting Behavior • 3 Medium Impact • 4 Significant Behavior • 5 High Impact Other Actions The other available actions are: • Alert External Systems: models with alert turned on will be pushed out to external systems if conditions for such alerting are met. • Darktrace RESPOND: take a Darktrace RESPOND action. See Darktrace RESPOND in the Model Editor for more information. • Tag Device: automatically tag the device or user that meets the conditions. • Assign Priority Score: assign a priority score to this device or user to increase or decrease the scoring of model breaches associated with it. • Device Type: change the device type to one ofthe presetvalues (e.g., server, IPphone). Only valid for network devices, not users. Select the most appropriate actions for the model purpose and proceed. For new models, there may not be any defeats you wish to add at this time. Once the model is live, exclusions may become obvious as specific devices trigger false-positive breaches or you wish to exclude certain subnets from the criteria due to the devices within them. Tuning a model with defeats keeps it relevant and producing valuable alerts without requiring changes to the underlying logic. Finalizing the Model Once all the above steps are completed - save the model using the save save icon in the top right of the workspace. Entera commit message that describes the purpose ofthe model creation, orof anychanges made to the model, and click Save once again.
- 174. 174 TIPS FOR NEW MODEL MAKERS The Darktrace model development team create and maintain the extensive Darktrace model deck to detect a wide range of potentially malicious indicators, unusual activity and unwanted network behavior. These experts have provided some top tips and points to consider for new model makers. Top Tips from Darktrace Experts • Think about the connection direction for the model you are creating. Are you only interested in inbound or outbound data transfer? • When creating a tagging model - a model that adds a tag to a device based on given behavior - make sure to add a condition to exclude devices that already have the tag you want to apply. This will keep your model breaches controlled and relevant. • Don’t neglect low-level indicators - it can be useful to set your unusual activity thresholds lowerat first and tune them laterto catch all the eventsyou are interested in. • If you are worried that a model may fire too often, check in on it after 15 minutes, then an hour- areyou happywith howoften it is breaching? If it seems too busy, increase the minimum seconds between model breaches or increase thresholds in your anomaly scores.
- 175. CHAPTER 9 - DEVICE ADMIN 176 MODIFYING DEVICES IN DEVICE ADMIN 178 SUBNET ADMIN 180 PERMISSIONS ADMIN 180 GROUPS IN PERMISSIONS ADMIN 182 THE SYSTEM STATUS PAGE 184 ALERTS ON THE STATUS PAGE 185 SYSTEM TOPOLOGY 186 DEVICE SUBNET ADMIN PERMISSIONS ADMIN SYSTEM STATUS ADMIN INTERFACES
- 176. 176 The devices displayed can be filtered using a simple search. This can be helpful to narrow down the entries when making bulk modifications - for example, adding the tag “Microsoft Windows” to anydevice that meets certain conditions, orchanging all deviceswith hostnames starting with SEPto IP Phones. 1. In the top left, select a device field to search against from the dropdown or use “All” to search all fields. Fields can only be used once per query. 2. Then, select the type of search: “IS” or “NOT”. Search terms are treated as wildcards, so “IS” can be though of as contains and “NOT” as does not contain. The “Type” field is the exception - type values must be entered in full valid form. 3. Enter the text to search. Wildcards in the form of “*” are supported for all fields except for “Type” (e.g. *.holdingsinc.com). 4. Click the plus plus icon to add the filter and update the results. All filters are combined (“AND”) when performing a search. To remove a filter, click the “x” icon beside the entry. For Darktrace environments with Darktrace PREVENT/ASM, the additional filter “Only Show ASM Identified Devices” will appear at the top of the page. If enabled, this will limit the device entries to those matched with Darktrace PREVENT/ASM assets by the Darktrace PREVENT/ ASM integration, or those matched manually using the Link Device to ASM Asset button on individual entries. Entries Device Admin is generally utilized to make bulk modifications such as tags or device labelling, to review the entries created by Darktrace for a certain type of device, and for data quality checking. The entries returned reflect the visibility restrictions applied to the user viewing the page - the number of devices may therefore differ between users due to these restrictions. Filtering Device Admin Device Admin lists all “devices” actively observed and modeled for pattern of life by Darktrace DETECT in the last six months. Devices in this context includes network devices observed through traffic monitoring (both on premises and cloud), entities created by a Darktrace integration such as the TSA, devices monitored by a Darktrace/Endpoint cSensor agent, and users created by a Darktrace/Apps, Cloud or Zero Trust module. DEVICE ADMIN The number of devices matching the current filter conditions are shown in the top right; the number of entries currently displayed can also be altered from the “Results Per Page” dropdown.
- 177. 177 Each entry is displayed as a row, with values in each corresponding column. Some fields may not be valid for every device type - for example, MAC Address for user devices or OT columns for IT devices - or may not be possible to populate passively due to the data observed by Darktrace. Device entities are sorted by last seen time by default. The current sort can be altered by clicking the caret-up ascending and caret-down descending arrows beside supported column headings. All column headings are shown by default including device label, hostname, last seen date and anytags applied. Thevisible columns can be altered from the “Toggle ColumnVisibility” option in the top bar; this choice will persist between sessions. As of Darktrace 6.1, column headings, filters and settings will also remain at the top of the page when scrolling. Darktrace/OT environments will see additional columns such as “Industrial Model”, “Industrial Firmware” and any additional contextual information gathered for the device. If the Darktrace/ OT PAS integration is configured, further columns will also appearwith data retrieved from the PAS CyberIntegrity platform. The current entries can be exported in CSV or XLSX (Microsoft Excel)format using the Export to CSV and Export to Excel options in the top right. Individual Entries Fields can therefore be set manually from this page, either individually or as part of a bulk edit. More information about making bulk modifications is described below. To edit an individual field, click anyvalue highlighted with a grey box. Clicking awayfrom the field or pressing “Enter” will save any changes. Red text indicates a value that is invalid forthe field type, such as a MAC Address entry that does not meet the required syntax. Invalid entries are not saved. If the field is invalid for that device type, or cannot be altered, it will not be possible to click into the field. Some edits to the tags applied to a device can also be made - altering the expiryand removing individual tags. To remove a tag, click the “x” icon beside the tag name. For tags with a pre- existing expiry, click the hourglass-half hourglass icon to alter the expiry time remaining. Tags cannot be added this way and must be added using the bulk modification option covered below. Finally, entries will display a set of icons on the far right which can be used to add notes or pivot to the Threat Visualizer. OPTION DESCRIPTION search Open Device in Threat Visualizer Opens the Threat Visualizer, focused on the chosen device. For more information on devices in the Threat Visualizer interface, please refer to Focusing on a Device. comment-alt-lines Device Notes Notes can be added to valid device types from Device Admin or from Device Summary - notes persist between sessions and can be reviewed by any other Darktrace userwith visibility over this device. dt-asm-icon Link Device to ASM Asset Where the Darktrace PREVENT/Attack Surface Management integration is present, manually match this device to an asset detected by Darktrace PREVENT/ASM. Matched assets are populated with contextual data from ASM and will display a pivot from the Device Investigation Options.
- 178. 178 Device types changed by manual modification - whether from Device Admin, the “Edit Device” omnisearch option, orvia the API - will always take priority overthose set passively, by hostname regex, or by model actions. Changing Device Types Darktrace will attempt to automatically derive the “type” of device for each entity it sees from communication patterns, contextual information, and traffic analysis. In some cases, this passive analysis may not be precise enough and an operator may wish to modify multiple device types in bulk. MODIFYING DEVICES IN DEVICE ADMIN The “Type” for individual devices can be set by changing the value in the “type” column for entry; this method is not necessary, but can be used for individual devices if desired. It is also optional but recommended to filter Device Admin to just those entries you wish to modify before proceeding, as changes can be at most applied on a “per-page” basis. 1. To change a large number of device types at once, select the desired “type” from the “Apply Device Type” dropdown on the right of the top bar. 2. Once selected, empty square checkbox fields will appear beside each row which does not have this type currently applied. Entrieswhich currentlyhave this type appliedwill have a check-square checked square and appear in blue. 3. Click the checkbox beside each entryyou wish to alter until it is check-square checked, or click the checkbox on the top left of the column headings to select all current entries on the page. On click, observe the entry change to the desired device type. Altered rows which now possess the chosen device type will also be highlighted in blue. Import/Export as CSV If a large number of modifications are to be made, one option is to use the Import CSV functionality. This method is performed by exporting the matching entries as a CSV, making the desired changes to a copy of the file Microsoft Excel or another CSV editing tool, then use Import CSV to apply them. Only the Label, Type, MacAddress, and Priority fields may be edited in this way. It is not possible to bulk-modify tags using CSV. It is strongly recommended to save a copy of the original CSV before making changes in case anyerrorsaremadeduringthebulkmodification.PleasecontactyourDarktracerepresentative if you require assistance in making these modifications. Adding and Removing Tags Tags offer a simple labelling system which can be used to identify important devices, display relevant contextual data and alter model logic. Tags can be automatically applied as a model action, used in model defeats to exclude devices, or factored into model logic. Tags can be added or removed from individual devices from the Tag Manager (see Adding and Reviewing Tags), or from the Threat Visualizer focused view.
- 179. 179 Remove a Tag from Multiple Devices 1. Click Apply Existing Tag from the top bar to locate the tag you wish to remove. This will open a search windowwhere any existing tag can be selected. Choose the desired tag from the options. Once a tag is created or selected, it will appear to the right of the options described above. This indicates the tag is active and ready to be removed in bulk. Only one tag can be active at once. 2. Entries which currently possess this tag will have a check-square checked square and appear highlighted in the tag color. Empty square checkbox fields will appear beside each device row which does not currently possess this tag. 3. Proceed to remove the tag using one of the following methods: • To remove the tag from individual entries, simply click the check-square checkbox beside each row. This will uncheck the box and remove the tag. • To remove the tag from all entries on the page - or all entries returned by the filter - it is necessaryto first applythe tag and then remove it. Clickthe square emptycheckbox on the top left of the column headings to select all current entries on the page and applythe tag to all. Once applied, immediately re-click the now check-square checked box and return it to square empty. This will remove it from all entries. Observe the tags have been removed from all desired rows.Altered rows should nowno longer be highlighted in the tag color. Tags can also be removed on an individual basis by the method described in Modifying Devices in Device Admin. Add a Tag to Multiple Devices 1. First, click either Add Tag or Apply Existing Tag from the top bar: • AddTagwill open atag creation dialog,where a newtag can be created.To proceed, fill in the fields (described in more detail in Adding and Reviewing Tags), and click Save Tag. • Apply Existing Tag will open a search window where any existing tag can be selected. Optionally set an expiry time for the tag application, and choose the desired tag from the options. Once a tag is created or selected, it will appear to the right of the options described above. This indicates the tag is active and ready to be applied in bulk. Only one tag can be active at once. 2. When the tag is active, empty square checkbox fields will appear beside each device row which does not currently possess this tag. Entries which do currently possess this tag will have a check-square checked square and the row will be highlighted in the tag color. 3. Click the checkbox beside each entryyou wish to alter until it is check-square checked, or click the checkbox on the top left of the column headings to select all current entries on the page. On click, observe the tags are added to every check-square checked row. Altered rows which now possess the chosen tag will also be highlighted in the tag color. To modify in bulk, the following workflows can be used; it is not possible to bulk-modify tags using CSV export/import. It is optional but recommended to filter Device Admin to just those entries you wish to modify before proceeding, as changes can be applied to the whole filter range at once if desired.
- 180. 180 PERMISSIONS ADMIN Permissions Admin is the primary location for managing user permissions and visibility for the Darktrace Threat Visualizer, Platform Accounts Console (formerly SaaS Console) and Darktrace/Email Console. it is accessible from the main menu of the Threat Visualizer (Admin Permissions Admin), from the sidebar of the Platform Accounts Console (users User Admin or users-cog User Groups), and from Darktrace/Email (users User Admin or users-cog User Groups). By default, the page will open on “My account” which summarizes the settings, group membership, permissions and visibility of the current user. This data is read-only. Created Accounts Permissions in the Darktrace Threat Visualizer, Platform Accounts Console and Darktrace/ Email interfaces are handled in a hierarchical structure. The “Created Accounts” tab lets the user review users they have created (and therefore “own”), or that have been created by users they have created. Viewing Subnet Admin Subnet Admin can be accessed from the main menu underAdmin. The subnet admin provides a catalog of the current subnets being modeled on your environment. Every field is customizable, which allows for enrichment of investigations and usage of the tool. Modifying Subnets • The label of a subnet can be used to provide a nickname to a device, this will show up throughout Darktrace’s Threat Visualizer. For more information about labelling subnets, please see Labelling Subnets and Devices or the System Administration guide. • The network is where a user can change the subnet size, for example from a /24 to a /25. This may change if DHCP traffic sees a more accurate subnet mask or if there is a successful TCP connection to the broadcast IP of the subnet. • The location of the subnet can be changed by providing the latitude and longitude, altering where the subnet is displayed on the home screen of the Threat Visualizer. • The DHCPfield is used to specify if the Darktrace system should expect to see DHCP. • Hostname and Credentials control the type of device tracking assigned to that subnet. Please see Hostname Tracking and Credentials Tracking or the System Administration guide for more details. SUBNET ADMIN
- 181. 181 As described above, users are technically “owned” by the user who created them, or in the case of SSO and LDAP users, by the primary admin user. As ofDarktrace 6.1, it is possible to transferownership of users to other users with equivalent or greater access. The user will no longer be visible to the original owner and will only be visible to the new owner. This also applies to any child users they have created. This must be performed by a user who has visibility over both the existing and the desired owner. To change the owner of a users, click the pen pen icon beside the name of the owning user in the “owners” column. Users are granted permissions directly, or through group membership. The Permissions column shows the effective permissions the user has. • If the user is a member of one or more groups, these are the permissions granted by group membership. • If the user is not a member of the group, these are the permissions directly applied to the user. Permissions can be added and removed from the column view. The state offlags - simple settings associatedwith the user- can be modified from the column view. Users can also be added to and removed from groups. For more complex edits, click the pen pen icon in the first column. This will open a step-by-step process to edit the users’ permissions, group membership and flags. Values in the Visibility and Restriction columns (forexample, “TopologyRestrictions”, “cSensor Visibility”) are controlled through group membership. By default, all users will have full visibility unless “Manual Data Visibility” is set on the “Groups” tab. For more information, please refer to Controlling Data Visibility and How Data Visibility is Defined. Some users may appear with a warning icon. This indicates the user has been modified by a higher-permission user and granted permissions the current user does not possess - whether through group membership or direct grant - and the current user is no longer able to modify it. LDAP SSO Users The admin user can also review the permissions of individual SSO and LDAP users on this tab; these users will display (LDAP) or (SSO) after the username. Permissions and visibility for these non-local users are configured in groups and cannot be edited. Only a limited selection of flags are available for LDAP SSO Users - user visibility, 2FA status and whether the user has accepted the terms of operation. Access to Darktrace for LDAP and SSO users is controlled by group membership in the AD server or ID Provider respectively, not by a local Darktrace account. If user access has been revoked in these environments, the eye visibility flag can be used to hide these archived users from the Permissions Admin page. Instead of the user edit pen pen icon, the edit column contains a button to revoke mobile app access for these users ban. This is a necessary step after the “Register Mobile App” permission has been removed from their corresponding groups. Transferring User “Ownership” Click on a row to expand and show more details about the user.
- 182. 182 Visibility Options The “Groups” tab has two additional options which are related to data visibility: “Manual data visibility / Full data visibility” and “Include networks / Exclude Networks”. These settings impact the visibility of all groups and therefore can only be modified by a Darktrace representative or the default admin user. The “Groups” tab of Permissions admin is used to manage groups of local, LDAP and SSO users. Threat Visualizer users can be added to groups to manage permissions in bulk. Once a user is added to at least one group, the permissions of that group take precedence. GROUPS IN PERMISSIONS ADMIN SAML SSO and LDAPusers are part of groups in external AD or IdPenvironments - information about these groups are sent as part of the authentication process. The permissions of these users is controlled by modifying the groups in Darktrace that correspond to those in the AD/ IDP environment. The Threat Visualizer also allows data visibility to controlled at a group level. To create manual data restrictions, users must be placed in groups. The data visibility setting chosen (“Manual data visibility” or “Full data visibility”) controls whether users are able to see all data, or whether restrictions should be placed at a group level. The default value is “Full data visibility”. For more information, please refer to Controlling Data Visibility. The networks setting chosen (“Include networks” or “Exclude Networks”) is only relevant if “Manual data visibility” is set above and is applicable to network visibility restrictions only. “Include Networks” is the default state. In this mode, users will only see data for network ranges they have been specifically granted access to by group membership. If set to “Exclude Networks”, users will see all network data except for those ranges specified for groups they are members of. Please refer to How Data Visibility is Defined for more information on controlling network visibility. Groups Users will only be shown groups in the “Groups” tab that have equivalent or lower permissions than they possess. Group members will also only be displayed if they are part of the user’s hierarchy. Click on a row to expand and show more details about the group. Groups can grant permissions to their members; the Permissions column shows the permissions the group grants. Group permissions are additive - if a user is a member of more than on group, the permissions of all groups are aggregated together. The permissions assigned to a group can be modified from the columnview. Users can also be added to and removed from the group from this view. For more complex edits, click the pen pen icon in the first column. This will open a step-by-step process to edit the group permissions, members and visibility.
- 183. 183 LDAP SSO Users LDAPand SSO users are nowincluded in the membership information butwill onlybevisible to theadminuser.Theseuserscannotbeaddedorremovedfromgroupsmanually;membership is controlled by the groups the user is part of in the AD or IdP environment. If user access has been revoked in these environments, the eye visibility flag can be used to hide these archived users from the Permissions Admin page. Visibility By default, visibility is set to “Full Data Visibility”. Users and groups are able to see all data monitored by Darktrace that their permission set allows. Users who are not part of a group are also able to see all data. When a deployment is moved from “Full Data Visibility” to “Manual Data Visibility”, the system applies the effective equivalent of full data visibility to all current groups in the form of visibility expressions. Users not within a group (excludes default users) will lose data visibility unless added to a group. New groups will also possess no visibility unless granted during creation. The visibility granted by each group is displayed in the Visibility and Restriction columns (for example, “Topology Restrictions”, “cSensorVisibility”). For more information on controlling data visibility, please referto Controlling Data Visibility and How Data Visibility is Defined.
- 184. 184 System Alerts System alerts keep operators informed of the health of the Darktrace instance and any changes in modeling, data or the health of connected integrations and modules. When changes or errors occur, a “System Alerts” notification will also appear in the bottom right of the Threat Visualizer workspace, above the Threat Tray. This notification will open the System Alerts tab directly. The System Status page contains detailed information about the health and scope of your Darktrace deployment. Here, metrics on hardware utilization, throughput, software bundle versions, component health, and modeled devices can be monitored. It is important to ensure every part of your deployment is running successfully and within specification, particularly when a deployment is new, or the scope has been increased significantly. Unhealthy deployments, such as those which are overloaded, observing far too many connections for their specification or with unreachable probes or components, will not experience the full benefits of network visibility and consistent monitoring. In the Threat Visualizer interface, the Status page is accessible from the main menu under Admin System Status. From the Platform Accounts Console (formerly SaaS Console) interface, the Status page is available from the sidebar (tachometer-fast “System Status”). THE SYSTEM STATUS PAGE
- 185. 185 System alerts are notifications about changes to the scope or health of the overall Darktrace deployment. For example, system alerts inform operators when new subnets are detected, when a probe or component loses traffic or becomes unreachable, or when a SaaS Module is experiencing issues. Historic system alerts were created from model breaches from the System model folder; previously these models would appear in the Threat Tray and generate repeated alerts whilst active. Darktrace Threat Visualizer 5.1 introduced high fidelity alerting with NOC-level capabilities. As of Darktrace 6.1, this coverage has been expanded to include Darktrace/Email instance health. Alerts will maintain an “active” state whilst relevant, becoming “resolved” once the issue is rectified. System status alerts are also available for issuing to external systems - alerts will only be issued when a system event becomes active or resolved. Each alert will also maintain a consistent unique identifier, allowing recurring issues to be identified. Active Alerts The Active Alerts tab contains current system alerts that are occurring on the Darktrace instance or any child instances and probes associated with it. Alerts are categorized into severity levels - low, medium, high and critical - and can be filtered by severity or by creation time. The level is indicated by the color of the left-hand bar and the exclamation-circle alert icon. ALERTS ON THE STATUS PAGE Active alerts can be acknowledged to hide them whilst they remain active, or suppressed for a specific duration. Both actions can be performed for the current user, or for all users. Alerts in this state are still viewable by enabling the Show Acknowledged/Suppressed toggle and can be unacknowledged or unsuppressed at any time. Notifications of the same kind or on the same instance are grouped together - to expand nested alerts, click the instance or alert name. For nested alerts, the highest severity level of all nested alerts will be shown by the exclamation-circle icon color . The details section contains information about the event such as the subnet detected, the errorexperiencedbythecomponentorthetimethatpacketlosswasdetected.Whererelevant, details will also include further investigation or remediation steps. Each event includes a link to the Customer Portal to raise a support ticket if further assistance is needed.
- 186. 186 SYSTEM TOPOLOGY Resolved Alerts The ResolvedAlerts tab contains system alerts that have been resolved, such aswhere a SaaS module is no longer experiencing errors, where a drop in traffic has been corrected, or an informational subnet alert has reached expiry. Alerts on this page can be dismissed forthe current userorforall users, removing the resolved alert permanently. To review dismissed alerts, enable the “Show Dismissed” toggle. If a resolved system event recurs, it will become active again. Legacy Alerts Legacy system model breaches can still be reviewed on the Legacy Alerts tab. Deployment Health This tab displays an overview of all masters, hardware probes and virtual probes connected to the deployment. Probe instances which have become recently unreachable are displayed by their last known details. There are two views - project-diagram topology view and list list view - which can be toggled in the top left of the workspace. By default, the workspace will open in topology view unless there are a large number of probes and master instances associated with the deployment. Topology View The master appliance accessed is always displayed at the head on the left with any subordinate masters or probes to the right. Where an instance such as a sub master has multiple probes, these can be hidden minus-circle or expanded again plus-circle with the relevant icon.
- 187. 187 The color of the instance label represents the overall health. For example, a vSensor with a green label is operating well within its scope, and a masterwith a red label may be overloaded on one or more key metrics. Hovering over the label will provide more information. Please note, this view may not be available in deployments with a substantial number of instances. List View • The Network Traffic tab includes last seen dates for major protocols, greater detail on modeled devices, processed bandwidth and network interface load. • The Advanced tab contains deploymentversion information, license expiry, and details of internal domains and servers observed by the appliance. In list view, instance health is shown by the colored line on the left of each row. Current utilization of keymetrics - CPU, Load, Memory, Disk and Darkflow Queue - are displayed on the right. Where an instance such as a sub master has multiple probes, these can be hidden minus-circle or expanded again plus-circle with the relevant icon. • The Probes tab lists all virtual and hardware probes associated with the instance under review. • The SaaS tab lists the current status of Darktrace/Apps, Darktrace/Cloud and Darktrace/Zero Trust Modules. • The Subnets tab lists all subnets currently modeled and their overall tracking quality. Where DHCPwarnings are displayed, a link to Subnet Admin is provided to modify the tracking settings. Health Metrics In eitherview, clicking the name of a master instance will open a “System Status” overviewwith detailed graphs covering deployment health. For probes, a simple deployment overview is displayed. The instance identifier, the IP and the type of instance are displayed in the top left. Below this, the time the information was retrieved at is shown. Each graph can show1, 7or30 days to identifytrends ora specific date/timewhere something changed significantly. Hovering over a point on the graph will give details on the specific values at that time. • The Summary tab contains graphs for all key metrics and details of the current Threat Visualizer and Model Bundle versions. • The Hardware tab covers disk utilization with greater granularity alongside other key metrics.
- 188. DARKTRACE RESPOND MODELS 199 DARKTRACE RESPOND IN THE MODEL EDITOR 200 WHAT IS DARKTRACE RESPOND? 189 REVIEWING DARKTRACE RESPOND ACTIONS 191 FILTERING DARKTRACE RESPOND ACTIONS 192 UNDERSTANDING THE DARKTRACE RESPOND ACTIONS PAGE 193 MANUAL DARKTRACE RESPOND ACTIONS 195 WHERE CAN I TRIGGER A MANUAL DARKTRACE RESPOND ACTION? 197 CHAPTER 10 - DARKTRACE RESPOND DARKTRACE RESPOND ACTIONS DARKTRACE RESPOND MODELS DARKTRACE RESPOND STATE ENABLING DARKTRACE RESPOND FOR DARKTRACE MODULES 212 DARKTRACE RESPOND INHIBITORS FOR THIRD-PARTY SAAS PLATFORMS 215 MAKING USERS IMMUNE TO DARKTRACE RESPOND SAAS ACTIONS 216 DARKTRACE RESPOND/NETWORK TAGS 217 DARKTRACE RESPOND/APPS, RESPOND/ CLOUD AND RESPOND/ZERO TRUST UNDERSTANDING THE RESPOND STATE USING THE SUMMARY PANE 201 HOW IS THE DARKTRACE RESPOND STATE DECIDED 204 THE DARKTRACE RESPOND SCHEDULE 206 USE THE DARKTRACE RESPOND SCHEDULE TO CONTROLACTIONS 207 CONTROLAUTONOMOUS RESPOND ACTIONS FOR MODELS 209 ADVANCED RESPOND MODE INFORMATION 211 DARKTRACE RESPOND/NETWORK DARKTRACE RESPOND/NETWORK MODELS 218 DARKTRACE RESPOND/NETWORK INHIBITORS 220 WORKFLOW FOR REVIEWING DARKTRACE RESPOND/NETWORK ACTIONS 221 DARKTRACE RESPOND/NETWORKAND SERVER DEVICES 223
- 189. 189 Darktrace RESPOND/Network Formerly Antigena Network The Darktrace RESPOND/Network component applies Darktrace RESPOND capabilities to physical and cloud network devices by controlling connectivity. This control ranges from interrupting communications between distinct endpoint/port combinations up to complete quarantine - actions are proportional to threat and may be escalated if granular blocks are not sufficient. Response can be performed through integration with a number of popular firewalls or by Darktrace virtual sensors such as vSensors and osSensors (both agent and dockerized), ensuring it extends to the farthest reaches of the cloud environment. Darktrace RESPOND/Apps Formerly Antigena SaaS Darktrace RESPOND/Apps extends autonomous response to enterprise software environments. Where anomalous behavior in a third-party SaaS platform begins to escalate, Darktrace RESPOND/Apps can step in and utilize access policies and administrative tools to control the account and sever the malicious actor’s access. Eligible modules and the range of SaaS actions available are continually expanded over future software updates. Darktrace RESPOND Framework The Darktrace RESPOND framework leverages the power of the ‘pattern of life’ developed across the platform to respond, contain, and neutralize emerging threats across the entire digital estate.With its unique understanding of “normal” foreach user, device, and component, each autonomous action istargeted and proportionate - disruptionto userworkflowis minimal. Darktrace RESPOND is available across multiple coverage areas including Network, Email, Endpoint, ZeroTrust and SaaS, extending autonomous response across the enterprise.Where Darktrace DETECT provides the ‘pattern of life’ to intelligently identify threats, the Darktrace RESPOND framework places the tools in your hands to action and remediate those threats - autonomously, or with human oversight. Each component offers a combination of autonomous, semi-autonomous, manual and triggered actions. The Darktrace RESPOND framework works with models – when a model breach occurs, the system can be configured to take a range of automatic actions in response or recommend actions for human confirmation or later review. A range of options exist within the platform to configure the operation of Darktrace RESPOND and tailor it to individual requirements. WHAT IS DARKTRACE RESPOND?
- 190. 190 Darktrace DETECT RESPOND/Endpoint (Darktrace/Endpoint) Formerly Darktrace for Endpoint and Antigena Endpoint Darktrace RESPOND/Endpoint brings award-winning autonomous response capability to the endpoint, enabling AI to take targeted, autonomous actions through Darktrace cSensor agents. Darktrace RESPOND can control network traffic to restrict anomalous connectivity at the system-level, even on remote devices. Devices monitored by cSensors are eligible for Darktrace RESPOND/Endpoint actions iftheyare licensed, in a Darktrace RESPOND/Endpoint- enabled group (5.2+), and possess one or more of the Darktrace RESPOND tags. AsDarktraceRESPOND/Endpointtakesactionatthenetworklevelonremoteendpointdevices, it shares many detection frameworks, inhibitors, settings and configuration processes with Darktrace RESPOND/Network. Advanced Integrations Darktrace RESPOND/Cloud for AWS Lambda (Custom) Where Darktrace RESPOND/Network and Darktrace RESPOND/Apps offer carefully curated inhibitors selected by Darktrace, Darktrace RESPOND/Cloud for AWS Lambda (Custom) instead opens the RESPOND framework to allow the creation of custom actions through invoked AWS Lambda functions. Through this powerful, flexible tool, Darktrace anomaly detection can be used to drive any action and response desired. Darktrace RESPOND/Zero Trust Formerly Antigena SaaS Darktrace RESPOND/Zero Trust offers two approaches to securing Zero Trust environments with Darktrace autonomous response; per-user SaaS actions at the ID-provider level and connection (traffic) actions for Zero Trust VPN solutions. By integrating with Zero Trust solutions including Okta, Duo and Zscaler, Darktrace can ensure machine-speed response at the critical pivot-point of many digital businesses. Eligible modules and the range of SaaS actions available are continually expanded over future software updates. Darktrace DETECT RESPOND/Email (Darktrace/Email) Formerly Antigena Email Darktrace/Email represents a powerful expansion of Darktrace DETECT and RESPOND autonomous, responsive capabilities into the email domain. Complex patterns of life for individual senders, recipients, groups and correspondents are developed and used to detect even the subtlest threats entering via the inbox. The Darktrace/Email component is available for Gmail, Microsoft 365, Hybrid and On-Premises Microsoft Exchange environments. It can be deployed standalone, with one or more Darktrace/Apps modules or integrated with an existing Darktrace DETECT deployment. A fully comprehensive user guide for the Darktrace/Email system is made available separately.
- 191. 191 The Darktrace RESPOND Actions Page The Darktrace RESPOND Actions window lists all current and expired Darktrace RESPOND Actions. Actions from Darktrace RESPOND components such as Darktrace RESPOND/ Network, Darktrace RESPOND/Apps and Darktrace RESPOND/Endpoint will appear in this window. Darktrace RESPOND/Network (including firewall integrations) and Darktrace RESPOND/Endpoint devices appear under the “Network” tab as they impact network devices. Actions against users or entities in third-party platforms will appear under the “Platform” tab. Accessing the actions page from a link in a Darktrace RESPOND alert will pivot to the appropriate tab and highlight the relevant action in the list. The types of action shown will differ depending on where the Darktrace RESPOND Actions page was accessed from and which Darktrace RESPOND components are enabled in the environment. Please note, Darktrace DETECT RESPOND/Email is displayed separately in the dedicated Darktrace/Email interface. Threat Visualizer In the Threat Visualizer interface, Darktrace RESPOND Actions are accessible from the main menu (Darktrace RESPOND Actions) or filtered on a specific device from the a Darktrace RESPOND Actions icon in the Omnisearch bar. REVIEWING DARKTRACE RESPOND ACTIONS A newwindowwill open on the dashboard. Platform Accounts Console (formerly SaaS Console) From the Platform Accounts Console interface, Darktrace RESPOND Actions is available from the sidebar (“a Darktrace RESPOND Actions icon”). In this interface, only platform actions will be visible. The Darktrace RESPOND Actions page will open in the main workspace. Overview Actions on the Network and Platform tabs are split into pending, active, cleared and expired. Active is the default view. Pending Actions Indicates Darktrace RESPOND Actions that have not yet been approved by a human operator. When there are pending Darktrace RESPOND actions, a notification will appear above the threat tray in the Threat Visualizer. A notification will also appear in the Platform Accounts Console threat tray for pending platform actions only. All currently pending actions can be cleared at once using the “minus-circle Clear Pending Actions” button in the top right. Active Actions Displays current Darktrace RESPOND Actions which are in place and have not yet expired. All currently active actions can be cleared at once using the “minus-circle Clear Active Actions” button in the top right. Cleared Actions ListsallDarktraceRESPONDactionsthatweremanuallyclearedbyanoperator.Clearwillinform Darktrace RESPOND to stop controlling the device or user and suppress the combination of Darktrace RESPOND Action and model breach conditions for 24 hours. Expired Actions Includes all previous Darktrace RESPOND activity for devices and users in your environment. Actions can be reactivated and manually extended if desired.
- 192. 192 Type-specific Filters Platform Actions Platform actions can be further filtered by whether the action was successfully applied in the third-party platform.Where “Applied” : “Yes”, this means Darktrace RESPOND successfully performed the action - such as a forced logout or an IP block. If the status is “No”, the Current Status column will give more information about why it was not possible to apply the action. Actions may be prevented for many reasons, such as insufficient permissions for the module orbecause the useris marked as immune at the configuration level. Setting the “Applied” filter to “Yes” will only display actions where Darktrace RESPOND successfully actioned the user. Network Actions For Darktrace RESPOND/Network actions (not applicable for firewall integrations or Darktrace RESPOND/Endpoint), the “blocked” status ofthe action can be optionallydisplayed. “Blocked” : “Yes”, indicates Darktrace RESPOND/Network blocked one or more connections that matched the criteria. Blocked can refer to the original connection that triggered the action if still active when Darktrace RESPOND responded, or it can refer to subsequent connections that matched the criteria for blocking. In some cases, Darktrace RESPOND/Network could identify a suspicious connection, block any future connections, but no subsequent connections actually occur - here, “Blocked” would be “No”. Filtering can be done by action type, by device, by model, or by status. Each tab can be filtered with a free text search against the model that triggered the Darktrace RESPOND action, orthe device or user impacted bythe Darktrace RESPOND action. This filter is applied across all action states (active, cleared, etc.) Filter Panel Click the filter filter icon on the left to open the filter panel. FILTERING DARKTRACE RESPOND ACTIONS For Network actions, expired actions can be filtered by their expiry time using the time selectors. By default, currently active actions, or those with an expiry in the last 7 days, are returned. Actions can also be filtered by the exact action Darktrace RESPOND applied, for example, “Block Outgoing Connections” or “Disable User”. By default, all actions are returned. Manual actions - actions triggered by Threat Visualizer users - are included by default. These actions can be filtered out by turning off the “Manual Actions” option.
- 193. 193 UNDERSTANDING THE DARKTRACE RESPOND ACTIONS PAGE Now, a single active Darktrace RESPOND action will be focused upon. Reviewing a Single Action From left to right, each entry on the Darktrace RESPOND Actions page contains the following: • A device/IP or user under Darktrace RESPOND control • A summary of the action taking place • An option to review the history of the action (creation/activation/expiry) • The start and expiration time of the action. • The action status, if applicable. • The model that triggered the action, if applicable. • Controls to extend, activate, reactive or clear the action. Device In the Threat Visualizer, hovering over the name of the device or userwill show a summary. Clicking the name will center the visualizer on the device. Clicking the name of a user from the Platform Accounts Console will open their profile. IP (Network actions only) For Network devices, the IP of the device is also listed as a separate column for context. This field is not interactive and is for information only. Action Summary The summary states the type of action and the conditions, such as the IP or port involved. For example, blocking outgoing connections to a specific external IPon port 443, invoking a block through a firewall or blocking a user from logging in from a specific IP. In the Threat Visualizer, clicking on the action summary for Darktrace RESPOND/Network actions will open an event log of blocked connections.
- 194. 194 Action Status (SaaS/Platform-type actions only) The status represents whether the action could be successfully applied in the third-party platform and its last known state. History NewforThreatVisualizer6, the “ViewHistory” button opens a newwindowwhich describes the history of the action state. Actions can be pending (created (requires confirmation)), active, cleared, extended, expired or reactivated; the history window allows changes to this status to be tracked overtime and linked back to users or system processes. For example, did an action expire before the security team activated it? Did a user manually clear an action? If configured, the mandatory “reason” users provide when changing the state are also displayed here. Duration (Start/End) The default action duration is set in the model that triggered the action. For manual actions, the duration can also be set when performing a manual action. Actions can be extended for the desired length of time with the Extend button. Where Darktrace RESPOND performs a one-off, discrete action such as revoking all current logins on a platform, the action will be repeated for the duration of the action. The interval at which it is repeated is defined in the configuration settings. Model In the Threat Visualizer, clicking the name of the model that triggered the breach will open a Breach log for the model. In the Platform Accounts Console, clicking the model will open the breach investigation overlay centered on the model breach. Actions triggered manuallywill be indicated as such in this column. Extend, Activate, Reactivate, Clear These buttons allowan operatorto change the state of current actions. These stateswere also covered in Reviewing Darktrace RESPOND Actions. Extend causes the block to last longer. Activate starts a pending action and Reactivate restores an expired one. To end the block, click the Clear button. Clear will inform Darktrace RESPONDtostopcontrollingthedeviceandsuppressthecombinationofDarktraceRESPOND Action and Breach Condition for 24hrs. Any changes to the action state - and the userwho triggered the change - are recorded in the action historywindow (see above).
- 195. 195 The Duration is the initial time the action should be applied for. Some actions may also have additional fields, such as defining an IP to be blocked, which are also required. To launch a “Block matching connections” action, the destination IP/hostname and optional port must be specified. Multiple entries to block as part of the action can be added (plus Add Row). Complete any additional fields, then click Apply to trigger the action. Security Integrations The reach of Darktrace RESPOND/Network can also be extended through Darktrace Threat Intelligence Security Integrations for Microsoft Graph SecurityAPI (via Microsoft Defender for Endpoint) and CrowdStrike. These integrations invoke capabilities on host-based Defender or CrowdStrike agents to quarantine, isolate or contain devices that may not be reachable by Darktrace RESPOND/Network at the time. These actions can only be taken manually and are not available as RESPOND inhibitors for Darktrace models. For these actions, a special inhibitor will appear when launched against a valid device. The inhibitor will reference the security integration platform as part of its name. Proceed to trigger these actions as above. MANUAL DARKTRACE RESPOND ACTIONS Darktrace RESPOND actions can be triggered manually for Darktrace RESPOND/Network, for eligible devices through the Darktrace Microsoft Graph Security API Integration and for valid modules that support Darktrace RESPOND/Apps, Darktrace RESPOND/Cloud or Darktrace RESPOND/Zero Trust. Manual actions let users take the power of autonomous response into their hands, building upon Darktrace AI-powered ‘pattern of life’ to control device behavior. This can be particularly valuable where external factors, or third-party systems not yet integrated with Darktrace, indicate a device or user may behave strangely or maliciously in the near future. Through Darktrace RESPOND, trigger a preemptive control for a departing employee’s device, or put a ‘pattern of life’ restriction on a device known to be vulnerable from an emerging zero day - buying your team time to mitigate with minimal user disruption. Manual actions are also a key part of testing your RESPOND configuration - whether to test Darktrace RESPOND/Network reachability after network changes or test upgraded permissions for a newly deployed Darktrace RESPOND/Apps module. Network Actions Manual Darktrace RESPOND actions against network devices can be triggered from a number of locations (described in Where Can I Trigger a Manual Darktrace RESPOND Action). For these actions, there are two settings that must be set at a minimum - the desired action and the duration for that action. Action is the type of response taken against the device. The list of actions available to launch for Darktrace RESPOND/Network is available in Darktrace RESPOND/Network Inhibitors. Most inhibitors (actions) are focused on the AI-powered ‘pattern of life’ for the device and do not require any connection or endpoint information to be populated. Depending on the location the action is launched from, some inhibitors may appear pre-populated. For example, a manual action launched from a connection event log (see Investigating a Connection in the Device Event Log will pre-populate with the “block matching connections” inhibitor and details of the connection. Platform Actions - Users Manual actions against users detected by Darktrace/Apps, Darktrace/Cloud and Darktrace/ Zero Trust modules can be manuallyperformed on a userfrom the PlatformAccounts Console (formerly SaaS Console) or the Threat Visualizer (refer to Where Can I Trigger a Manual Darktrace RESPOND Action for exact details). For these actions, there are three settings that must be set at a minimum - the module intended to take the action, the desired action and the duration for that action.
- 196. 196 Action Reason The Actions available to take will differ between different third-party platforms - a list is available in Darktrace RESPOND Platform Action Inhibitors. The Duration is the initial time the action should be applied for - one off actions will be repeated for the length of the duration. • If the user has been seen on multiple platforms where Darktrace RESPOND actions can be taken, the Module field can be used to search for the SaaS module intended to take the action. • If the user has been seen on only one platform where Darktrace RESPOND actions can be taken, the Module field will be pre-populated with the Darktrace/Apps, Darktrace/ Cloud and Darktrace/Zero Trust module that can take an action. From Darktrace Threat Visualizer 6, for users detected on more than one platform with Darktrace RESPOND capabilities, the “Disable User” action can be triggered on all modules at once. To do so, select “All Eligible Modules” rather than an individual module. This functionality is only supported for actions launched in the Platform Accounts Console interface. • If the user has not been seen on a platform where Darktrace RESPOND actions can be taken, the button will not appear and manual actions cannot be performed. Some actions may have additional fields, such as defining an IP to be blocked, which are also required. Complete any additional fields, then click Apply to trigger the action. From Darktrace Threat Visualizer 6, users can be required to provide a mandatory “reason” (text) when they create a manual action or change the state of an action (activate/extend/ clear). This is controlled by the System Config setting “Require Antigena Audit”. If enabled, the reason field will also appear in the dialogue for creating manual Darktrace RESPOND actions.
- 197. 197 The following locations describe where a manual action can be triggered from. Platform Accounts Console (Platform Actions Only) Darktrace RESPOND actions for supported Darktrace/Apps, Darktrace/Cloud and Darktrace/ Zero Trust modules can be manuallyperformed on a userfrom the PlatformAccounts Console (formerly SaaS Console). To perform an action on a user from the Platform Accounts Console, navigate to the user’s Profile page from the main menu, the omnisearch or from an event clickthrough. In the top right, the a Launch RESPOND action button should be available. Click on this button to open the manual action dialog. Users currently being actioned by Darktrace RESPOND have a green bar beside their profile tile. More information can be found in User Profiles as part of the Platform Accounts Console guide. Threat Visualizer There are multiple ways to launch a manual action against a user or device from the Threat Visualizer. Ifthe Darktrace DefenderAdvanced Hunting integration is present, this method can also be used to trigger “Isolate” actions against eligible devices. Model Breach Logs (Network Platform) Model breach logs contain a list of model breaches for a model, a device or a subnet over a chosen time window. Breach logs can be launched from AI Analyst incidents (related model breaches),fromthe homepage summary,fromthethreattray,fromthe omnisearchfordevices or subnets (“exclamation-triangle View Breaches”) and from many other locations in the Threat Visualizer. WHERE CAN I TRIGGER A MANUAL DARKTRACE RESPOND ACTION? Device Summary (Network Platform) Manual actions can be triggered from Device Summary. To open this window, click the laptop-mobile device icon from the Threat Visualizer omnisearch bar. If the user or device is eligible for Darktrace RESPOND actions, the RESPOND Actions section will appear. Click “a Launch RESPOND Action” to trigger a manual Darktrace RESPOND action on the device. For more information on Device Summary, see Device Summary. For other omnisearch options, refer to Device Investigation Options. On the body of the entry, the “a Launch RESPOND Action” button appears for eligible device or user types. Click to launch a manual action against the device that triggered the model breach. For more information on model breach logs, see Opening the Model Breach Log. Device Tooltips (Network Platform) In almost any location where a device appears in Threat Visualizer, hovering over the text or node displays a short summary tooltip. For example, this tooltip can be observed when hovering over: • Device nodes in the 3D Threat Visualizer subnet or device visualization • Device labels, hostnames and IPs that appear in event logs (network only) • Device details in AI Analyst incidents • Devices that have triggered models in the model breach log
- 198. 198 In event logs, manual Darktrace RESPOND actions can be triggered from specific connection entries or from general device tooltips. If you wish to launch a RESPOND action against network entities in a connection, there are two ways to do so: • From the hover-over summary, click “Launch RESPOND Action” (as above) • From the caret-down down arrow, chose “Launch RESPOND Action” to create a “Block Matching Connections” action from the connection itself. Formore information on device event logs, see Investigating a Connection in the Device Event Log. Darktrace RESPOND Actions Window (Platform Only) Actions against users from supported Darktrace/Apps, Darktrace/Cloud and Darktrace/Zero Trust modules can also be launched from a filteredversion ofthe Darktrace RESPONDActions Window. To open this window, click the a Darktrace RESPOND icon from the Threat Visualizer omnisearch barwhen the user is selected. If the user is eligible for Darktrace RESPOND actions, the a Trigger Action button will appear in the top right. From these tooltips, click “a Launch RESPOND Action” to trigger a manual Darktrace RESPOND action on the device. For more information on device visualization, see Focusing on a Device. To learn more about event logs, please refer to Using the Device Event Log. Device Event Logs (Network Only)
- 199. 199 ICON DESCRIPTION chart-network Permit Autonomous Action) a Force Autonomous Action Darktrace models are a series of logical statements and conditions which, if met, trigger an alert or action; models are primarily used to identify and alert on anomalous and potentially malicious behavior. The models framework leverages both the underlying ‘pattern of life’ detection and outputs from Darktrace Deep Packet Inspection, telemetry inputs, Darktrace/ Apps, Darktrace/Cloud and Darktrace/Zero Trust modules. Darktrace RESPOND takes action by monitoring model breaches and connectivity for indications of potentially malicious activity or significant anomalies that deviate from the ‘pattern of life’. When Darktrace RESPOND components (excludes Darktrace/Email) are enabled inyourenvironment, the models used byDarktrace RESPOND (Antigena)will become visible in the Model Editor. Finding Darktrace RESPOND Models in the Model Editor DARKTRACE RESPOND MODELS To look at all possible models that can take a RESPOND action, navigate to the Model Editor. Select the “Actions” tab, then add a filter for “RESPOND - All”. Models which can trigger an autonomous response are returned. The state - whether the model will act autonomously or ask for human confirmation - is depicted by one of three icons: Darktrace RESPOND Models are found in the Antigena folder of the Model Editor. When Darktrace RESPOND components (excludes Darktrace/Email) are enabled in your environment, this folder will become visible in the Model Editor. There are subfolders which correspond to different types of Darktrace RESPOND coverage - for example, Antigena Network for Darktrace RESPOND/Network. Each model detects a specific type of activity or looks for unusual activity above a certain threshold, then triggers an autonomous response if found/met. ICON DESCRIPTION user Force Human Confirmation More information about what these states mean is covered in Darktrace RESPOND in the Model Editor and How is the Darktrace RESPOND State Decided. Darktrace RESPOND (Antigena) Models Some Darktrace RESPOND models are what are known as meta-models - models which use other models breaching as part of their logic. For example, the model “Antigena Large Data Volume Outbound Block” (Antigena Network Insider Threat) looks for model breaches with a score over 20% that refer to large outbound data transfers. When one of these models breaches - such as the “Anomalous Connection / Data Sent to Rare Domain” model - Darktrace RESPOND/Network will observe the breach, trigger the “Antigena Large Data Volume Outbound Block” model and take an automatic action against the device transferring the data. Other Darktrace RESPOND models take action directly in response to specific criteria. For example, the model “Antigena FTP Block” (Antigena Network Compliance) looks for outbound FTP transfers over 1 MB. If a device is observed making these insecure transfers, Darktrace RESPOND/Network will block matching connections for1 hour. If the “Generate Model Breach” action is set on a Darktrace RESPOND (Antigena) model then, like a standard model, it will create model breaches that can be seen in the Threat Tray of the Threat Visualizer or the Platform Accounts Console (formerly SaaS Console).
- 200. 200 • If the model breaches when the Darktrace RESPOND schedule (See How is the Darktrace RESPOND State Decided) is in the “Use Model Setting” state and “Permit autonomous action” is selected, an autonomous action will be taken (as the schedule permits it). • If “Force human confirmation” is chosen, or the Darktrace RESPOND Schedule is in the “Require Confirmation” state, human approval will be required for the action to proceed. • The final option - “Force autonomous action” - will override the global schedule and always take action without confirmation. Darktrace RESPOND Score Threshold This field sets the model breach score that must be achieved to trigger the action. Darktrace RESPOND Action Duration This setting specifies how long in seconds the action should last for. The default is 3600 (1 hour). Full details ofDarktrace RESPONDinhibitorsforthird-partyplatforms are available in Darktrace RESPOND Inhibitors for Third-Party SaaS Platforms. RESPOND State This setting controls whether the model can take autonomous actions. Darktrace RESPOND in the Model Editor Models can take a series of actions in response to breaching such as triggering an alert, raising the priority of a device or adding a tag. When Darktrace RESPOND is enabled on a deployment, the additional Darktrace RESPOND action becomes available. This Darktrace RESPOND action is already used by the Darktrace RESPOND models described above but can also be added directly to custom models. Darktrace RESPOND responses are described as ‘inhibitors’ as they inhibit anomalous behavior. Full details of the inhibitors available are included in the documentation for each Darktrace RESPOND component. Open a model with Darktrace RESPOND capabilities or add the ‘Darktrace RESPOND’ action to an existing model to review the following settings. Some settings may not be visible if the Darktrace RESPOND component is not present in your environment. Network Inhibitors This dropdown selects the response that Darktrace RESPOND/Network or Darktrace RESPOND/Endpoint should take if this model breaches and the Darktrace RESPOND Threshold value is met. Full details of Darktrace RESPOND/Network inhibitors are available in Darktrace RESPOND/ Network Inhibitors. Platform Inhibitors Sets one or more responses that Darktrace RESPOND should take in third-party platforms if this model breaches and the Darktrace RESPOND Threshold value is met. Multiple dropdowns can be added. SaaS inhibitors cover Darktrace RESPOND/Apps, Darktrace RESPOND/Zero Trust and Darktrace RESPOND/Cloud modules. As each SaaS and enterprise platform is different; the same capabilities may not be available from one platform to the next. To ensure an action is taken on every applicable platform, more than one can be specified. Once selected, the inhibitor will display the platforms it is applicable to. DARKTRACE RESPOND IN THE MODEL EDITOR
- 201. 201 Click to expand the entry and see more information about why Darktrace RESPOND is in the current mode. The itinerarydisplays the RESPOND state at the current hour within the context of a twelve hour block; users can browse forward and backward to see howthe state may change overtime. Click on any block to see further details about why the block has been assigned the state it has. As Darktrace RESPOND allows for a significant amount of granularity in configuration, there are a number of factors that can govern how autonomous Darktrace RESPOND is. Many organizations proceed with the Darktrace-recommended configuration during first deployment of a Darktrace RESPOND component, then introduce more customization as they become more familiarwith Darktrace RESPOND, aligning it to their organizational policies and risk appetite. This overview summarizes across all possible factors, configurations, and settings to give a true representation of how autonomously Darktrace RESPOND can act at each point of the day. Most Darktrace operators will settle on a Partially Autonomous configuration, tailored to their needs. When collapsed, the elementwill indicate the overall autonomylevel - forexample, dt-partially-auto Partially Autonomous - and how long this state is applicable for. The next state - and when it will be applicable - is shown below. Detailed RESPOND State The main Threat Visualizer workspace appears on Darktrace environments with Darktrace/ Network, Darktrace/Cloud or Darktrace/Endpoint. It requires the “Visualizer” permission. The main workspace is used to visualize devices and connectivity, to open investigation windows and event logs, and to view alerts from Darktrace anomaly detection. On the left of the workspace is the summary. The summary provides key statistics and was described in Understanding the Summary Panel and Advanced Summary Panel Info. As of Darktrace 6.1, the summary also contains an overview of how autonomously Darktrace RESPOND can act at the current moment. Darktrace RESPOND UNDERSTANDING THE RESPOND STATE USING SUMMARY PANE Where Darktrace RESPOND is enabled in the environment, the main Threat Visualizer homepage summary pane will contain a high-level overview of how autonomously Darktrace RESPOND can act at the current moment. There are four states that Darktrace RESPOND can be in: • Human Confirmation - all Darktrace RESPOND actions will require human approval, regardless of the type of activity detected. • Partially Autonomous - some Darktrace RESPOND actions will require human approval, others will proceed automatically. • Fully Autonomous - all Darktrace RESPOND actions will be taken autonomously. • No Actions Scheduled - Darktrace RESPOND is disabled and will not take any action. The most relevantfactorsto howautonomouslyDarktrace RESPONDcan act arethe Darktrace RESPOND schedule and the state of individual models. The Darktrace RESPOND schedule is an hourly, configurable timetable that restricts Darktrace RESPOND autonomy based upon the time or day of the week. The second factor, model state, allows specific activity which DarktraceRESPONDisrespondingtotohavemoreautonomousorlessautonomousresponse than permitted by the timetable block. For example, Darktrace recommends that a series of key models focused on Ransomware responses are always permitted to act autonomously, regardless of all other factors.
- 202. 202 The interaction between the RESPOND schedule and model states is described fully over the series of articles starting with “Darktrace RESPOND State: Autonomous Actions vs Human Confirmation” and “How is the Darktrace RESPOND State Decided”. Darktrace RESPOND Model States In this example, the block displays dt-partially-auto Partially Autonomous, as the Darktrace RESPOND schedule is enforcing the requirement to ask for human confirmation before acting on the vast majority of Darktrace RESPOND models. Of the models with Darktrace RESPOND responses, 54 are acting in line with this requirement. However, two models - key Ransomware models - are operating in a state that allows them to act autonomously regardless of other factors. Conversely, 42 models are assigned “Permit Autonomous Action” - the standard state for RESPOND models.This state means thatwhen Darktrace RESPOND is triggered to take action by these models, it will act autonomously if permitted by the current timetabled state in the RESPOND schedule. As the schedule is currently enforcing the need for human confirmation, theyarenotpermittedtotakethisautonomousactionandareinsteadrequestingconfirmation before taking action. However, if the current schedule state was “Use model setting”, they would be permitted to take the autonomous actions theywish to takewithout human approval and would therefore fall under “autonomous”. The possible states a model may hold are described in Darktrace RESPOND in the Model Editor and related material. Subnet Localization This section will not appear if Local Subnet Time is disabled. Finally, many Darktrace deployments choose to restrict how autonomously Darktrace RESPOND can act during standard working hours versus overnight or at weekends. Therefore, for global organizations, Darktrace provides the ability to set a generic Darktrace RESPOND schedule which is then localized to the timezone of each specific office¹. The final section of the summary shows which subnets the current configuration is relevant for. ¹ Based upon the latitude and longitude information configured for each network subnet. MoreinformationaboutthislocalizationisavailableinAdvancedRESPONDModeInformation. Please note, operators may observe a slight delay between updates to model and schedule state and this being reflected on the summary panel. These sections can be expanded furtherto understand why the models are allowed to act autonomously or instead to require human approval. Continuing the example, twelve models are assigned the state “Force human confirmation”. This state means that when Darktrace RESPOND is triggered to take action by these models, it will always be forced to ask for human approval first.
- 203. 203 - and how many actions expired before approval - on the Darktrace RESPOND/Network Summary. Autonomous Mode / Active Mode In the second mode, Darktrace RESPOND will create and take actions automatically, without the need for human intervention. These actions can still be cleared or extended at any time by a human operator. This is the ideal end state for Darktrace RESPOND - actions can be taken at machine speed, without delays waiting for user approval. Partially Autonomous Mode Most Darktrace operators will settle on a Partially Autonomous configuration, tailored to their needs. This combines elements of human confirmation and autonomous activity. Darktrace RESPOND in the Threat Visualizer Summary Pane The main Threat Visualizer workspace appears on Darktrace environments with Darktrace/ Network, Darktrace/Cloud or Darktrace/Endpoint; on the left ofthe workspace is the summary. As of Darktrace 6.1, this summary also contains an overview of how autonomously Darktrace RESPOND can act at the current moment. This overview summarizes across all possible factors, configurations, and settings to give a true representation of how autonomously Darktrace RESPOND can act at each point of the day. The summary was described in more detail in the previous article, Understanding the RESPOND State using the Threat Visualizer Summary Pane. RESPOND STATE: AUTONOMOUS ACTIONS VS HUMAN CONFIRMATION Deployment Modes When the criteria for a Darktrace RESPOND action are met, Darktrace RESPOND can either take action autonomously orwait for human approval. These two states are referred to as: • Human Confirmation Mode • Autonomous Mode or Active Mode. In Human Confirmation Mode, Darktrace RESPOND will request approval from a human operator before taking any action. In Autonomous Mode, autonomous actions are taken without human intervention. For many organizations, the end goal of a Darktrace RESPOND deployment is some level of Autonomous Mode, whether applied to select models, select times of the day, or across all devices and use cases. Most Darktrace operators will settle on a Partially Autonomous configuration, tailored to their needs. Human Confirmation Mode InHumanConfirmationmode,DarktraceRESPONDwillcreaterecommendedactionsbutitwill not take them unless approved by a user. Actions created but waiting for human confirmation are sometimes referred to as “pending” actions, as they are pending human approval. New deployments of Darktrace RESPOND/Network, for example, are kept in human confirmation mode for a short period to allow Darktrace RESPOND to demonstrate the type of recommended actions it would take across your extended network. You can reviewthe average time it takes foryourteam to approve human confirmation actions
- 204. 204 When criteriafora Darktrace RESPONDmodel are met, Darktrace RESPONDcreates an action. The schedule state then controls the actions that result from these Darktrace RESPOND models; “Always Require Confirmation” will make models that would usually take autonomous action ask for human confirmation before proceeding.¹ Those configured to always request (force) human confirmation will continue to do so. Similarly, “Use Model Settings” will allow those that are configured to take autonomous when permitted to do so. If the model is set to always request (force) human confirmation, this is also respected. “Darktrace RESPOND Disabled” will prevent those models configured to take autonomous action when permitted, or request (force) human confirmation, from creating any actions during its allocated time period. ¹ Force autonomous action” excluded, please refer to Darktrace RESPOND in the Model Editor or further information below. Darktrace RESPOND Models There are two ways to control whether Darktrace RESPOND will action autonomously: the Darktrace RESPOND schedule, and the Darktrace RESPOND state on the model that triggers the RESPOND action. The Darktrace RESPOND schedule is the simplest, recommended way to control the mode that Darktrace RESPOND operates in. Modifying the model state is straightforward, but should only be attempted when you are familiarwith Darktrace models andthe Darktrace RESPONDsystem. Laterarticleswill describe how to change the state globally using the schedule, or on a per-model basis. Darktrace RESPOND Schedule The Darktrace RESPOND schedule is the simplest, recommended way to control the mode that Darktrace RESPOND operates in. The schedule allows periods of time to be allocated for autonomous actions and other periods of time allocated to human confirmation mode. A common configuration is that Darktrace RESPOND is permitted by the schedule to operate in autonomous outside working hours, where operators may not be available to approve pending actions. HOW IS THE DARKTRACE RESPOND STATE DECIDED There are three possible states: • Always Require Confirmation • Use Model Settings • Darktrace RESPOND Disabled Darktrace RESPOND models also carry an individual RESPOND state; there are three possible states: • Permit autonomous action (previously “take autonomous action”) • Force autonomous action • Force human confirmation By default, all models are in “Permit Autonomous Action” state - this means theywill take an autonomous action if permitted by the system schedule. This is the preferred state as it means activity can be controlled on a weekly schedule, rather than model-by-model. Models in “Permit Autonomous Action” state defer to this system schedule - they take autonomous action_when permitted_. Models in a “Force” RESPOND state will ignore this global schedule and follow their own setting. This is why it is highly recommended to leave all Darktrace RESPOND models in this “Permit Autonomous Action” state, at least during early deployment, so that they can be controlled centrally from the schedule.
- 205. 205 Darktrace RESPOND in the Threat Visualizer Summary Pane As of Darktrace 6.1, the main Threat Visualizer home page displays a summary of how autonomouslyDarktrace RESPONDcan act at the current moment.This overviewsummarizes across all possible factors, configurations, and settings described above to give a true representation of how autonomously Darktrace RESPOND can act at each point of the day. The summary was described in more detail in the previous article, Understanding the RESPOND State using the Threat Visualizer Summary Pane. Changing the State The following articles will explain how to change the global state and - for advanced configuration - individual model state. • Use the Darktrace RESPOND Schedule to Control Autonomous RESPOND Actions • Control Autonomous RESPOND Actions on Individual RESPOND Models. So is Darktrace RESPOND in Human Confirmation Mode or Autono- mous Mode? When deciding whether a created action should be autonomous or not, Darktrace RESPOND evaluates the model state and the schedule state. By default, all models are set to “Permit Autonomous Action”, therefore: • Setting the schedule to “Always Require Confirmation” will result in global Human Confirmation mode • Setting the schedule to “Use Model Settings” will result in global, fully autonomous mode. Changing the state ofindividual models can impact this mode, leaving the system in a partially autonomous state. This relationship can be illustrated in the following table of outcomes, where a “pending” action is one that requires human confirmation: (SCHEDULE STATE VS MODEL STATE) FORCE HUMAN CONFIRMATION PERMIT AUTONOMOUS ACTION FORCE AUTONOMOUS ACTION Always Require Confirmation Action created (pending) Action created (pending) Action created (autonomous) Use Model Settings Action created (pending) Action created (autonomous) Action created (autonomous) Darktrace RESPOND Disabled No Action No Action Action created (autonomous)
- 206. 206 The grid represents seven days, comprised of 24 hours. Each block defines when Darktrace RESPOND will seek operator approval for actions, when it will take them automatically (unless the individual model indicates otherwise) and when it will take no action at all. There are three settings: exclamation-triangle Use Model Setting, user Require Confirmation and RESPOND Actions Disabled. Configuration is set on one, shared master layout. The schedule replaces ‘Always Require Confirmation’, previously set on the System Config page. The default setting for new deployments is all hourly blocks in a mode which will permit autonomous actions (“Use Model Setting”). THE DARKTRACE RESPOND SCHEDULE Darktrace RESPOND Schedule Darktrace RESPOND actions can be configured to fit a weekly/hourly schedule. Human Confirmation Mode can be activated during business hours and deactivated when personnel are no longer in the office, ensuring autonomous actions can be taken when an operator is not available to approve them. Response mode can be tailored by hour and day so weekend periods are protected. Similarly, Darktrace RESPOND actions can be disabled entirely during business hours if desired. The Darktrace RESPOND Actions weekly schedule is located on the Darktrace RESPOND Actions page in the Settings tab. Configuring a Mode How to configure a mode - or a variation of the two modes - will now be covered in Use the Darktrace RESPOND Schedule to Control Autonomous RESPOND Actions and Control Autonomous RESPOND Actions on Individual RESPOND Models. For specific scenarios where Darktrace RESPOND may operate outside these configured modes, please refer to Advanced RESPOND Mode Information
- 207. 207 Human Confirmation Mode (Global) On initial deployment, it is recommended that Darktrace RESPOND be configured in Human Confirmation Mode. In this mode, Darktrace RESPOND will recommend actions but will not perform them unless a human operator gives confirmation. Reviewing the actions Darktrace RESPOND recommends in Human Confirmation Mode will build familiarity and confidence in the kind of autonomous responses Darktrace RESPOND will take and when they are appropriate. In this mode, Darktrace RESPONDwill require an operatorto confirm before taking anyactions, regardless of whether the individual model breaching has autonomous actions enabled. 1. To enable global Human Confirmation Mode, navigate to the Darktrace RESPOND Actions page. In the Settings tab, add periods of Require Human Confirmation to the Antigena (Darktrace RESPOND) weekly schedule. 2. Click in one ofthe hourlyblocks and select Human Confirmation. Repeat forall desired hours. Alternatively, select the Require Confirmation preset from the dropdown or click the icon beside each day to fill all boxes with the setting, then refine as desired. IfyouwishDarktraceRESPONDtobedisabledoutsideofthesehours,selectRESPOND Actions Disabled for these time periods. If Darktrace RESPOND is in passive mode, grid settings will have no impact on Darktrace RESPOND behavior. The Darktrace RESPOND schedule allows you to control when the system will request human confirmation for actions and when it will take them autonomously. The schedule works in 1 hour blocks over a 7 day period and can be localized to the timezone where your subnets are located. The simplest way to control Darktrace RESPOND is to utilize this schedule. For deployments which have never used Darktrace RESPOND before, for example, setting the schedule entirely to “Require Human Confirmation” can be a quick away to allow Darktrace RESPOND to demonstrate the actions it would take. Actions created during a block of “Require Human Confirmation” will be left “pending” unless a human chooses to approve the recommendation. USE THE SCHEDULE TO CONTROL AUTONOMOUS RESPOND ACTIONS Over time, the schedule can be used to permit blocks of autonomous action (“Use model settings”) outside working hours. The final goal is to reach fully autonomous operation.
- 208. 208 1. To enable global autonomous mode, navigate to the Darktrace RESPONDActions page. IntheSettingstab,addperiodsof‘Use Model Setting’modetotheDarktraceRESPOND schedule. 2. Click in one of the hourly blocks and select ‘Use Model Setting’. Repeat for all desired hours. Alternatively select the Model Setting preset from the dropdown or click the icon beside each day to fill all boxes with the setting, then refine as desired. Ifyouwish Darktrace RESPONDto be disabled outside ofthese hours, select ‘RESPOND Actions Disabled’ for these time periods. If one or more models are set to “Force human confirmation”, Darktrace RESPOND will still ask for confirmation before taking the action. These models must be set to “Permit Autonomous Action (previously ”take autonomous action”)” to be in an autonomous mode. If Darktrace RESPOND is in passive mode, grid settings will have no impact on Darktrace RESPOND behavior. Darktrace RESPOND Models vs the Darktrace RESPOND Schedule Models in “Permit Autonomous Action” state defer to this system schedule - they take autonomous action when permitted. Models in a “Force” RESPOND state will ignore this global schedule and follow their own setting. This is why it is highly recommended to leave all Darktrace RESPOND models in the “Permit Autonomous Action” state, so that they can be controlled centrally from the schedule. How to create a hybrid deployment - where some models can ignore the schedule - is described in Control Autonomous RESPOND Actions on Individual RESPOND Models. Autonomous Mode (Global) The final goal of Darktrace RESPOND deployments is a fully autonomous deployment state. When you are happy with the actions that Darktrace RESPOND recommends, enabling autonomous mode for at least some periods of the week should be strongly considered.
- 209. 209 Models in “Permit Autonomous Action (previously ”take autonomous action”)” state defer to the system schedule - they take autonomous action when permitted. Models in a “Force” RESPOND state will ignore this global schedule and follow their own setting. Therefore, changing the “Darktrace RESPOND state” field on a select number of models can be a useful way to control individual responses without changing global behavior. The full interaction between the states is covered in more detail in How is the Darktrace RESPOND State Decided. Example 1: Mostly Autonomous, Some Models Require Human Con- firmation Human Confirmation can be configured on a model-by-model basis, where Darktrace RESPOND takes some actions autonomously but seeks operator confirmation for specific cases. Models intended for human oversight must be modified in the Model Editor to ensure confirmation will be requested. Set Specific Models to Human Confirmation Mode For a more granular approach to Darktrace RESPOND actions, whether Darktrace RESPOND is permitted to act autonomously can be controlled on a per-model basis. This means certain activitycan always be actionedwithout human approval,whilst otheractivityrequires a human to confirm the action Darktrace RESPOND recommends. Conversely, organizations who are moving towards a fully autonomous deployment may still wish to keep some models in human confirmation mode, or roll out autonomous mode slowly. This hybrid approach allows organizations to tailor Darktrace RESPOND to their daily schedule, compliance policies and risk appetite. How is Per-Model State Configured? Individual models have a setting - “Darktrace RESPOND state” (formerly Automatic Antigena) - which controls their individual autonomy. When deciding whether a created action should be autonomous or not, Darktrace RESPOND evaluates the model state and the schedule state. For example, consider the following scenarios: SCENARIO SCHEDULE MODEL RESULT 1 Always Require Confirmation Permit Autonomous Action Action created in human confirmation mode 2 Use Model Settings Permit Autonomous Action Action taken autonomously 3 Always Require Confirmation Force Autonomous Action Action taken autonomously despite schedule state 4 Use Model Settings Force Human Confirmation Action created in human confirmation mode CONTROL AUTONOMOUS RESPOND ACTIONS ON INDIVIDUAL MODELS 1. To enable Human Confirmation Mode on select models, access the model editorand locate the models you wish to edit. 2. Click on the left of the model name in the list to select it, or select all desired models within a folder. 3. At the top of the list, click the ‘# Selected’ dropdown and choose Darktrace RESPOND state Force human confirmation. This will place all selected models into confirmation mode.
- 210. 210 Put All Other Models in Autonomous Mode After editing the Darktrace RESPOND state setting for all required models, navigate to the Darktrace RESPOND Actions page. 1. In the Settings tab, add periods of ‘Use Model Setting’ mode to the Darktrace RESPOND schedule. 2. Click in one of the hourly blocks and select the Use Model Setting option. Repeat for all desired hours. Alternatively select the Model Setting preset from the dropdown or click the icon beside each day to fill all boxes with the setting, then refine as desired. IfyouwishDarktraceRESPONDtobedisabledoutsideofthesehours,selectRESPOND Actions Disabled for these time periods. If Darktrace RESPOND is in passive mode, grid settings will have no impact on Darktrace RESPOND behavior. Modelswhich are in RESPOND state “force human confirmation”will still require confirmation, regardless of this configuration. Example 2: Mostly Human Confirmation, Some Models Force Au- tonomous Action The following example demonstrates how to achieve a mostly human confirmation mode deployment but still permit certain models to take autonomous actions in highly anomalous scenarios. Recommendations for new Darktrace RESPOND/Network deployments, for example, strongly recommend that the model “Antigena Ransomware Block” (found in the Antigena Network External Threat folder) is permitted to act autonomously at all times. This is regardless of the general schedule state. Set Specific Models to Forced Autonomous Mode 1. To force specific models to always take autonomous actions, access the model editor and locate the models you wish to edit. 2. Click on the left of the model name in the list to select it, or select all desired models within a folder. 3. At the top of the list, click the ‘# Selected’ dropdown and choose Darktrace RESPOND state Force autonomous action. This will place all selected models into forced autonomous mode. The model will now ignore scheduled periods of “Require Human Confirmation” and periods of “RESPONDActions Disabled” inthe global schedule. For more information, please refer to How is the Darktrace RESPOND State Decided. Leave All Other Models in Human Confirmation After editing this setting for all required models, navigate to the Darktrace RESPOND Actions page to ensure human confirmation is still globally enabled for all other models. 1. IntheSettingstab,ensurethescheduleshowsperiodsof‘RequireHumanConfirmation’ mode to the Darktrace RESPOND schedule. 2. If not, click in one of the hourly blocks and select the Require Human Confirmation option. Repeat for all desired hours. Alternatively select the Require Human Confirmation preset from the dropdown or click the icon beside each day to fill all boxes with the setting, then refine as desired. IfyouwishDarktraceRESPONDtobedisabledoutsideofthesehours,selectRESPOND Actions Disabled for these time periods. This will only impact models which are in “Permit Autonomous Action” (previously “take autonomous action”) or “Force Human Confirmation”. If Darktrace RESPOND is in passive mode, grid settings will have no impact on Darktrace RESPOND behavior.
- 211. 211 Exceptions • Manually created actions, such as Darktrace RESPOND/Apps actions, are not subject to the schedule as they have been deliberately taken by a human operator. These actions will not require confirmation and will occur even during periods of ‘RESPOND Actions Disabled’. • Actions reactivated or extended manually will also not be subject to the schedule as they have been deliberately taken by a human operator. • Models which use the Automatic Darktrace RESPOND option “Force autonomous action” will override the global schedule and always take action without confirmation. • Actions created by Darktrace RESPOND-enabled endpoints on the Watched Domains will be automatically taken regardless of mode or device tags. Localizing the Schedule The setting Local Subnet Time can be useful for global networks. If enabled, for Darktrace RESPOND/Network actions, the setting applies schedule timings locally based upon the latitude and longitude information for the subnet. For example, a period of human confirmation mode is set between 9am and 5pm. From a UTC perspective, this is then applied as a period of human confirmation mode between 4pm and 12am for devices in the Los Angeles subnet (9am - 5pm localized) and between 7am and 3pm for devices in the Frankfurt subnet (9am - 5pm localized). For Darktrace RESPOND/Endpoint actions or Darktrace RESPOND for Apps, Cloud or Zero Trust module actions, the schedule is applied as UTC in this mode. ADVANCED RESPOND MODE INFORMATION
- 212. 212 Enable RESPOND capabilities for a Darktrace/Apps or Darktrace/ Zero Trust module The following steps are required to enable Darktrace RESPOND actions in Darktrace/Apps or Darktrace/Zero Trust modules: 1. Ensure that a Darktrace RESPOND license has been added to your Threat Visualizer environment for the relevant module. 2. Check the level of permissions granted to the Darktrace/Apps or Darktrace/Zero Trust module that has been licensed for actions. To do so, navigate to the System Config page and select the appropriate module. On the “settings” tab, for each account, check the state of the “Account Permissions” field (see below). This will show “Monitoring” (DETECT) or “Antigena” (RESPOND). To progress, the account must display “Antigena” in this field. The permissions level is granted when the app is authorized. Modules authorized before Darktrace Threat Visualizer 5 or authorized solely for monitoring may require reauthorization to begin taking actions. If you are not sure if reauthorization is necessary, consult the Darktrace RESPOND section of the documentation for the module. More information is also available below in “Account Permissions”. 3. Optionally configure immunity from actions for certain users and IP addresses. more information can be found in Making Users Immune to Darktrace RESPOND SaaS actions. 4. Finally, Darktrace recommends that new users of Darktrace RESPOND enable autonomous actions at a later date, when they are more comfortable with Darktrace RESPOND functionality. For this reason, we recommend navigating to the Darktrace RESPOND Actions page and configuring the Schedule. See Darktrace RESPOND State: Autonomous Actions vs Human Confirmation and The Darktrace RESPOND Schedule for more information. Darktrace RESPOND can take a range of proactive, measured, automated actions in the face of confirmed cyber-threats detected in real time. Where anomalous behavior in a third-party SaaS platform begins to escalate, Darktrace/Apps, Darktrace/Cloud and Darktrace/Zero Trust modules can step in and utilize access policies and administrative tools to control the account and sever the malicious actor’s access. In contrast to network actions - taken against connectivity between endpoint, cloud and network devices - Darktrace RESPOND SaaS actions are those taken in third-party environments, primarilyagainst useraccounts. The suite of actions differs between each SaaS, Zero Trust and Cloud platform - full details are available in Darktrace RESPOND Inhibitors for Third-Party SaaS Platforms. Platform-based autonomous response is currently available for the following modules: • Darktrace RESPOND/Apps for Microsoft 365 • Darktrace RESPOND/Apps for Zoom • Darktrace RESPOND/Apps for Google Workspace • Darktrace RESPOND/Apps for Salesforce • Darktrace RESPOND/Zero Trust for Okta • Darktrace RESPOND/Zero Trust forJumpCloud • Darktrace RESPOND/Zero Trust for Duo This provision will be continually expanded over future software updates. For Darktrace/Apps, Darktrace/Zero Trust and Darktrace/Cloud ENABLING DARKTRACE RESPOND
- 213. 213 Darktrace RESPOND SaaS actions for supported Darktrace/Apps, Darktrace/Cloud and Darktrace/Zero Trust modules can be manually performed on a user from the Platform Accounts Console or the Threat Visualizer. This is also covered in Where Can I Trigger a Manual Darktrace RESPOND Action?. Platform Accounts Console To perform an action on a user from the Platform Accounts Console, navigate to their Profile page from the main menu, the omnisearch or from an event clickthrough. In the top right, the a Darktrace RESPOND button should be available. Click on this button to open the manual action dialog. Users currently being actioned by Darktrace RESPOND have a green bar beside their profile tile. More information can be found in User Profiles as part of the Platform Accounts Console guide. Threat Visualizer To perform an action on a userfromthe ThreatVisualizer, searchforthe userinthe omnisearch bar and select them. From the device options in the omnisearch bar, click the a Darktrace RESPOND icon. The Darktrace RESPOND Actions page will open focused on the user. In the top right, click the a Trigger Action button to open the manual action dialog. Account Permissions Darktrace/Apps or Darktrace/Zero Trust modules can be authorized for monitoring (DETECT), or for monitoring and Darktrace RESPOND actions. For some modules, Darktrace RESPOND capabilities require more permissions than initially granted for DETECT coverage in order to take these actions. The type of authorization is listed for each account in the “Account Permissions” field. Where the module needs to be reauthorized to add Darktrace RESPOND permissions, the reauthorization process will include additional prompts for Darktrace RESPOND permissions or provide alternative authorization links. Modules operating with monitoring (DETECT) permissions may need to be reauthorized with Darktrace RESPOND permissions before actions can be taken. Whether this is applicable for a module will be described in the detailed documentation for each module. MANUAL RESPOND ACTIONS For Darktrace/Apps, Darktrace/Zero Trust and Darktrace/Cloud
- 214. 214 • If the user has been seen on multiple platforms where Darktrace RESPOND actions can be taken, the Module field can be used to search forthe SaaS module intendedtotakethe action. • If the user has been seen on only one platform where Darktrace RESPOND actions can be taken, the Module field will be pre-populated with the Darktrace/Apps, Darktrace/Cloud and Darktrace/Zero Trust module that can take an action. • If the user has not been seen on a platform where Darktrace RESPOND actions can be taken, the button will not appear and manual actions cannot be performed. Some actions may have additional fields, such as defining an IP to be blocked, which are also required. Complete any additional fields, then click Apply to trigger the action. Triggering an Action There are three settings that must be set at a minimum - the module intended to take the action, the desired action and the duration for that action. TheActionsavailabletotakewilldifferbetweendifferentthird-partyplatforms-alistisavailable in Darktrace RESPOND SaaS Inhibitors. The Duration is the initial time the action should be applied for - one off actions will be repeated for the length of the duration.
- 215. 215 SaaS Inhibitors Models cantake a series ofactions in responseto breaching such astriggering an alert, raising the priorityof a device oradding a tag.When Darktrace RESPOND is enabled on a deployment, the additional Antigena (Darktrace RESPOND) model action becomes available. If a Darktrace/Apps, Darktrace/Zero Trust or Darktrace/Cloud module with RESPOND capabilities is enabled within your Darktrace environment, it comes with a category of Darktrace RESPOND models already using the Darktrace RESPOND action to perform responses. This action allows an operator to set one or more ‘inhibitors’ - actions to inhibit the behavior that matches the model criteria. Darktrace RESPOND SaaS actions are those taken in third- partyenvironments, primarilyagainst useraccounts. The suite of actions differs between each SaaS, Zero Trust and Cloud platform - models can therefore have multiple inhibitors set to ensure they can take an action in every possible environment. Darktrace RESPOND SaaS inhibitors can also be triggered manually. Users and IPaddresses can be made ‘immune’ from specific inhibitors orfrom all inhibitors on a per-module basis. By default, all users known to a module licensed for Darktrace RESPOND are eligible for actions. Immunity from actions is controlled on the System Config page. Please see Making Users Immune to Darktrace RESPOND SaaS actions for more detail. DARKTRACE RESPOND INHIBITORS FOR THIRD-PARTY SAAS PLATFORMS detail in the module documentation: • Darktrace RESPOND/Apps for Microsoft 365 • Darktrace RESPOND/Apps for Zoom • Darktrace RESPOND/Apps for Google Workspace • Darktrace RESPOND/Apps for Salesforce INHIBITOR APPLICABLE MODULES DESCRIPTION Block IP(s) Microsoft 365 Prevents access to the account from an IP or IP range for the duration set. Disable User Microsoft 365, Zoom, Okta, Duo, Google Workspace, JumpCloud, Salesforce Disables a user account for the duration set. Freeze User Salesforce Freezes a user account for the duration set. Force Logout Microsoft 365, Zoom, Google Workspace Forces the user to log out from the platform. This action is a one-off action, so will be repeated at the configured interval for the duration set. The default interval is 15 seconds and can be altered by a member of Darktrace support if required. Disable Inbox Rule Microsoft 365 Disables an inbox rule in the Microsoft 365 exchange environment. For each module, any considerations for Darktrace RESPOND actions are covered in more • Darktrace RESPOND/Zero Trust for Okta • Darktrace RESPOND/Zero Trust forJumpCloud • Darktrace RESPOND/Zero Trust for Duo
- 216. 216 Example Configuration Immunity and Account Permissions are set for each account within a Darktrace/Apps, Darktrace/Cloud or Darktrace/Zero Trust module. For example, an organization may have two Office 365 tenancies - Business and Development. For the Darktrace/Apps Microsoft 365 module, they have two accounts which correspond to these two tenancies. These accounts have the Account Permissions level of Monitoring. For actions to be taken in both tenancies, both of these accounts need to be reauthorized to add Darktrace RESPOND Permissions and upgrade to the Account Permissions level to Antigena (Darktrace RESPOND). Once this is complete, immunity settings will appear against each account. The organization would like to ensure the IP35.176.59.98 is not actioned in either tenancy. To do this, it must be added to Immune IPAddresses for both accounts. All users are eligible for Darktrace RESPOND actions by default if the Darktrace/Apps, Darktrace/Cloud or Darktrace/Zero Trust module they were observed by has licensed RESPOND capabilities. Immunity from actions is controlled on the System Config page. To make changes, access the System Config page from the main menu and select Modules from the left-hand side. UnderCloud and SaaS Security, select the moduleyouwish to change and click on it to open the configuration window. Action Eligibility When a module has Account Permissions - Darktrace RESPOND, new settings will appear which control whether a user or an IP can be actioned by Darktrace RESPOND SaaS actions. These are Immune Users and Immune IPAddresses. • Immune Users are users which will not be actioned by Darktrace RESPOND, whether bymodels orbymanual actions.Actions blocked due to immunitywill report this status in the Darktrace RESPOND Actions page. The field takes a comma-separated list. To make a user immune, enter their username as it appears in the Darktrace Threat Visualizer or Platform Accounts Console. Do not include the prefix. For example, SaaS::Office365: [email protected] would be entered as just john. [email protected]. • Immune IPs Addresses are IP addresses that will not be blocked by actions that control access to the relevant third-partyplatform, such as “Block IP”. This fieldwill only appear if the module can take IP-based actions. The field takes a comma-separated list of IPs orvalid CIDR IP ranges. When “Per Inhibitor Antigena” is enabled, immunity can also be set for specific actions. For example, a user could be eligible for lower severity actions like “Force Logout”, but immune from more stringent actions like “Disable User”. These settings are in addition to the general Immune Users and Immune IPAddresses settings. Inhibitors will also differ between modules as capabilities and appropriate actions vary between different platforms. MAKING USERS IMMUNE TO DARKTRACE RESPOND SAAS ACTIONS
- 217. 217 Please refer to Darktrace RESPOND/Network Quick Setup Process - Deployment Options and Darktrace RESPOND/Network Deployment Scenarios for informationonhowtoapplyaDarktrace-recommended default for Darktrace RESPOND/Network tags. Eligibility in Custom Models Default Darktrace RESPOND/Network Models will only takeactionagainstondeviceswithoneoftheDarktrace RESPOND/Network tags applied. For custom models with Darktrace RESPOND responses enabled, it is recommended that the model excludes devices without the appropriate tags. This can be achieved with the following logic, modified as appropriate forthe model target: Tagged [Internal Source/Internal Destination] Has Tag [Antigena All/ Antigena Compliance/etc] By default, no devices are tagged and therefore no devices are eligible for Darktrace RESPOND/Network coverage. Tags can be applied manually, can be applied through the Device Admin page (see Modifying Devices in Device Admin), through an API integration (see /tags/entities), or through the recommended route - the Darktrace RESPOND/Network Quick Setup Process. Darktrace RESPOND/Network takes action against network-borne threats with connection- level blocks; there are four high-level categories of activity that Darktrace RESPOND/Network will target with these actions. Devices must be opted into Darktrace RESPOND/Network responses, either on a per-category or global basis. The types of activity Darktrace RESPOND/Network will take action against are grouped into four categories: “Compliance”, “External Threat”, “Insider Threat” and “Significant Anomaly”. Each category contains Darktrace RESPOND/Network models which target specific activity within that category. For example, the Compliance category contains a model which targets the use of generative AI tools, while the External Threat category contains models which detect ransomware and cryptomining activity. When a device performs activitywhich meets the criteria ofa model in one ofthese categories, Darktrace RESPONDwill check if it has a tagwhich corresponds to the activitycategorybefore proceeding to take an action. This is tag-based eligibility. Please note, Darktrace RESPOND was previously known as “Antigena”. This terminology is preserved in many places for the purposes of ensuring continuity. Darktrace RESPOND/Network tags There are five Darktrace RESPOND/Network tags, corresponding to the model categories: • Antigena Compliance • Antigena External Threat • Antigena Insider Threat • Antigena Significant Anomaly • Antigena All When a device is given the Antigena Compliance tag, for example, it becomes eligible to receive Darktrace RESPOND/Network responses triggered by models in the Compliance category. The final tag - Antigena All - makes the device eligible for responses from all categories. DARKTRACE RESPOND/NETWORK TAGS
- 218. 218 • Models inside the Insider Threat folder contain behavioral elements which suggest highly unusual internal or lateral behavior. • The SignificantAnomaly foldercontains modelswhich are independent ofattributable aspects, but are consider significantly anomalous. • Models inside the Compliance folder are linked to potential compliance breaches like unauthorized file storage and TOR usage. • Models inside the External Threat folder contain behavioral elements suggestive of an external threat. Darktrace RESPOND/Network and Darktrace RESPOND/Endpoint expand Cyber AI response to devices by severing network connections, restricting access and quarantining devices by limiting their outbound connectivity. Actions can be taken when a device exhibits significantly anomalous behavior, when it contravenes a compliance policy, when a device attempts to access a specific watched endpoint, or any other custom criteria defined in a model. Model Categories Darktrace RESPOND/Network and Endpoint responses are triggered by model breaches within the Threat Visualizer - Darktrace RESPOND models look for specific behavior or for indicators triggered by other model breaches. Darktrace models are a series of logical statements and conditions which, if met, trigger an alert or action; models are primarily used to identify and alert on anomalous and potentially malicious behavior. The models framework leverages both the underlying ‘pattern of life’ detection and outputs from Darktrace Deep Packet Inspection and security integrations and modules. When Darktrace RESPOND/NetworkorDarktrace RESPOND/Endpoint are enabledwithinyour Darktrace environment, a newcollection ofmodelswill become available: Antigena Network. This collection contains specific models for unusual device behavior which are set to trigger on specific types of connection or activity and perform different Darktrace RESPOND actions depending on the incident identified. Reviewing the Darktrace RESPOND/Network Models Open the Model Editor. In the Threat Visualizer interface, the Model Editor is accessible from the main menu under Models Model Editor or from any breach log with the “ Click to view model” button. From the left-hand model list, select the Antigena Network folder. In this folder, Darktrace RESPOND models for Network and Endpoint are grouped into four categories: Compliance, External Threat, Insider Threat and Significant Anomaly. DARKTRACE RESPOND/NETWORK MODELS
- 219. 219 Each model has an “inhibitor” - a specific response Darktrace RESPOND/Network should take against the device or devices that triggered the model. Many models use the automatic inhibitor, which lets Darktrace RESPOND/Network select the most appropriate response at the time it is invoked. The available inhibitors will now be described in Darktrace RESPOND/ Network Inhibitors. Model RESPOND State Models also have their own level of autonomy. By default, all Darktrace RESPOND actions triggered by models will obey the global schedule - essentially, take autonomous action if permitted by the current time block - but some models can be forced to always, or never, ask for confirmation. For example, all One Click Setup options (Darktrace RESPOND/Network Quick Setup Process) place a subset of models in a “force autonomous action” state which allows them to take autonomous action at all times. This state is covered in more detail in the following Darktrace Threat Visualizer User Guide articles: Darktrace RESPOND State: Autonomous Actions vs Human Confirmation, How is the Darktrace RESPOND State Decided and Control Autonomous RESPONDActions on Individual RESPOND Models. When a model breaches that would trigger a Darktrace RESPOND/Network action, the device is checked forthe relevant tag before the action is performed. Forexample, a device performs unauthorized file transfer activity which triggers a compliance breach. If the Antigena Compliance models are active, they will check that the device has either the Antigena Compliance or Antigena All tags before the action is performed.
- 220. 220 INHIBITOR DESCRIPTION Enforce group pattern of life Group ‘pattern of life’ allows a device to make any connections and data transfers that it or any of its peer group typically make. This action is less strict than the individual ‘pattern of life’ enforcement. Quarantine device All incoming and outgoing traffic from or to a device is blocked. Block all outgoing traffic All outgoing traffic from a device is blocked. Block all incoming traffic All incoming traffic to a device is blocked. Models can take a series of actions in response to breaching such as triggering an alert, raising the priority of a device or adding a tag. When Darktrace RESPOND is enabled on a deployment, the additional Darktrace RESPOND model action becomes available. When Darktrace RESPOND/Network or Darktrace RESPOND/Endpoint are enabled within your Darktrace environment, category of Darktrace RESPOND (Antigena) models already using the Darktrace RESPOND action are exposed. Thisactionallowsanoperatortosetan‘inhibitor’-anactiontoinhibitthebehaviorthatmatches the model criteria. Darktrace RESPOND/Network and Darktrace RESPOND/Endpoint share a set of inhibitors that can be selected. In some cases, Darktrace RESPOND may be unable to perform the specific inhibitor as set on the model - for example, where the target device is a server and the inhibitor is “quarantine”. Similarly, an inhibitor may be upgraded under specific circumstances. For example, the “block matching connections” inhibitor may be upgraded by Darktrace RESPOND if the quantity of outgoing matching connections to block becomes too large, indicating escalating malicious activity that would be better targeted with “block outgoing connections”. Inhibitors INHIBITOR DESCRIPTION Automatic This option allows Darktrace RESPOND/Network to automatically choose the best option using information gathered from the alert. For example, if the alert concerns suspicious behavior to an SMB share on port 445, it may block connections just to that port. If a range of suspicious connections to various external endpoints was seen, it may instead select to block all external connections. Block Matching connections Darktrace RESPOND/Network will block the specific connection and all future connections that match the same criteria. For example, the FTP block prevents all future outbound connections to port 21 from the target device. Enforce pattern of life Enforce ‘pattern of life’ allows a device to make the connections that it usually makes. Therefore, it only allows connections and data transfers which Darktrace considers normal for that device. Any unusual traffic (marked with an unusual message in Darktrace) is blocked. DARKTRACE RESPOND/NETWORK INHIBITORS
- 221. 221 Click the “History” button to review whether the action was created automatically (created) or was created pending approval (created (requires confirmation)) and was approved by a member of the team. Users can also be compelled to provide a reason for activation, which can assist in understanding why it was approved. IdentifyingwhethertheRESPONDactionwasautomaticorapprovedisusefulinunderstanding whether, if created in confirmation mode but correctly targeted, Darktrace RESPOND can be allowed to act more autonomously in future cases. Conversely, models that create automatic actions with unintended impact may be more suitable for a human-approval workflow going forward. 4. Review the event log for the action To open a log of connections targeted by Darktrace RESPOND as part of the action, click the action. If there are no entries in the log, this may indicate that Darktrace RESPOND has not observed any connections eligible for actions subsequent to the action, or it may indicate Darktrace RESPOND/Network is unable to route actions to the target device. If no successful blocks are observed against any devices, this may indicate a reachability issue - please refer to Darktrace RESPOND/Network Testing and Troubleshooting for more information on testing and troubleshooting. 5. Understand the conditions of the model that caused the Darktrace RESPOND action Hover over the name of the model for a description of the behavior identified and targeted by the model. Click the name of the model to open a model breach log for the model - the reason the model was triggered will be shown on the log entry. Most Darktrace RESPOND models are meta models, meaning that activity triggered a different Darktrace DETECT model, and when that alert was created, Darktrace RESPOND was then triggered. Click on the list log icon on the entryto see the events that triggered the original model breach. More information about model breach logs and howto interpret them is described in Opening the Model Breach Log onward. Reviewing Darktrace RESPOND/Network Actions When Darktrace RESPOND/Network is first enabled, reviewing each Darktrace RESPOND action can be a useful way of gaining confidence in the autonomous actions and locating any models which may require further tuning. To review actions, either visit the Darktrace RESPOND/Network Quick Setup “Action Summary” page - a 7 day summary of Darktrace RESPOND/Network actions - or use the Darktrace RESPOND actions page. Afterreviewing a Darktrace RESPONDAction orafterreviewing all Darktrace RESPONDActions, you maywish to adjust the parameters ofthe Darktrace RESPOND Models ortag membership. The following example workflow is for an active Darktrace RESPOND action. Suggested Workflow 1. Identify an action Open the Darktrace RESPOND Actions page and identify an action to investigate from the “Active” tab. 2. Understand the device under Darktrace RESPOND control Hover over the name of the device in the “Device” column to understand the type of device, whether it has anytags applied to provide context, and what the potential impact of the action may be. Click on the name of the device to focus the Threat Visualizer on the device. Optionally review the device summary or other investigation options to understand the context surrounding the target device further. These options are described in Device Investigation Options. 3. View the action history to understand how it was activated Whether Darktrace RESPOND can take action autonomously, ormustwait forhuman approval, is defined by the RESPOND State of the model and the overall Darktrace RESPOND schedule. The action may have been created automatically, or was approved by a Darktrace operator from the Threat Visualizer or Mobile App. WORKFLOW FOR REVIEWING DARKTRACE RESPOND/NETWORK ACTIONS
- 222. 222 Now, proceed to: • Leave the action to expire automatically. • Extend the block to last longer, providing time to investigate further. • Clear the action, informing Darktrace RESPOND to stop controlling the device and suppress the combination of Darktrace RESPOND Action and model breach trigger condition for the period the action was active for. 9.Considerwhetherthe level ofanomalyjustifiedthe specific Darktrace RESPOND Action placed on that device (optional) If the activity was not sufficient to trigger the Darktrace RESPOND/Network action and Darktrace RESPOND is in the early stages of deployment, action thresholds will increase over time as Darktrace RESPOND adjusts to your network. Ifyou do wish to alterthresholds, modifythe “Darktrace RESPOND Score Threshold” setting to increase the minimum model breach score before a Darktrace RESPOND action is triggered. Please refer to Darktrace RESPOND in the Model Editor for more information. Alternatively, if not currently the case, you may wish to place the model into a state where it is compelled to ask for human confirmation. This state is called “Force human confirmation” and is described in Darktrace RESPOND Models and Control Autonomous RESPOND Actions on Individual RESPOND Models. For high severity Darktrace RESPOND/Network models, this step is not recommended as Darktrace RESPOND/Network will be unable to take action until a user has provided approval, delaying its ability to shut down anomalous activity in severe cases. 6. Review the device event log for the device before and during the action Continuing with the model breach event log, click the search magnifying glass icon on the entry to focus the main Threat Visualizerworkspace on the device at the time Darktrace RESPOND/ Network was triggered. Click the list log icon from the main device omnisearch options to open the main device event log. Review events prior to the model breach, and play the real-time re-enactment of the events before and during the action to understand why Darktrace RESPOND was invoked. Refer to the guides from Using the Device Event Log onward if you are unfamiliar with this interface. 7. Understand the conditions of the model that caused the Darktrace Model Breaches (optional) If you are not familiar with the conditions of the Darktrace Model Breach, you can review the model logic by returning to the Model Editor from the main menu. Darktrace RESPOND models in the Model Editor are described in Darktrace RESPOND in the Model Editor and Darktrace RESPOND Models. 8. Consider the risk posed by removing the Darktrace RESPOND Action or by extending the Darktrace RESPOND Action Consider the following questions: • Is the block applied by Darktrace RESPOND specific and targeted, and unlikely to disrupt the device under control? • Are you satisfied that the anomalous behavior reported by Darktrace is unusual, but unlikely to indicate malicious activity? • Will the remaining action time be enough to investigate the activity sufficiently?
- 223. 223 How to Enable “Block Server Devices” 1. Access the Darktrace Threat Visualizer on the master instance and navigate to System Config page (Main menu › Admin). 2. Choose Settings from the left-side menu and locate the Darktrace RESPOND/ Network subsection. Ensure the Block Server Devices setting is turned on. If not, enable and save the changes. Autonomous Darktrace RESPOND/Network response controls unusual activity on devices by restricting connectivity, increasing severity from targeting specific endpoints up to full device quarantine. The business-critical nature of servers creates ideal opportunities for lateral movement, persistence, or for threats such as ransomware to spread rapidly from a single key asset to many client devices. Darktrace RESPOND autonomous response can provide AI-powered defense of these systems, halting unusual activity whilst ensuring normal operations are maintained. Many historically phased deployments of Darktrace RESPOND/Network capability have targeted autonomous response at client devices.Automatic eligibilitymayhave prioritized the tagging of device types such as laptops and desktop unless actively edited. This approach should be reconsidered to ensure full network coverage. How it Works Darktrace RESPOND will never fully quarantine server devices (unless manually overridden by configuration) and will only block targeted connections. Darktrace RESPOND will not block incoming connections from client devices that are deemed to be a normal part of the server’s pattern of life’ to ensure business continuitywhilst unusual activity is blocked. The necessary setting “Block Server Devices” was enabled by default on any deployment created on or after Darktrace 5.1 (June 2021). Darktrace environments created prior to this version must enable the setting on the Darktrace System Config page.Awarningwill be shown in the Threat Visualizer if server devices are tagged for Darktrace RESPOND actions but the setting is disabled. DARKTRACE RESPOND/NETWORK AND SERVER DEVICES Darktrace RESPOND/Network Inhibitors for Server Devices Server devices are eligible for existing Darktrace RESPOND/Network inhibitors with some minor modifications. These modifications will be clear in the final action displayed on the Darktrace RESPOND Actions page. • Inthe default configuration, quarantine actions applied bya modelwill be downgraded to block all outgoing traffic. Configuration options are available to upgrade quarantine actions to full quarantine, or prevent quarantine actions (including downgraded actions) entirely. • Darktrace RESPOND will only respond to incoming connectivity to a server device in specific circumstances:
- 224. 224 Darktrace RESPOND/Network Tags for Server Devices To experience Darktrace RESPOND/Network actions, server devices must be tagged with one of the Darktrace RESPOND/Network tags (Darktrace RESPOND/Network Tags). Darktrace recommends that server devices are eligible for Darktrace RESPOND/Network responses in the “External Threat” and “Significant Anomaly” categories. These categories encapsulate the highest priority activity Darktrace RESPOND/Network targets, including detections for activity such as ransomware and those which capture significant and sustained anomalous behavior from devices. The Darktrace RESPOND/Network Quick Setup Process introduced in Darktrace 6.1 provides this coverage as part of the “One Click Setup” options. Please see Darktrace RESPOND/ Network Quick Setup Process - Deployment Options for more information on these Darktrace- recommended presets. It is strongly recommended that these defaults are applied, or the existing tagging models are altered to include server devices. • When a model applying the specific Block matching connections inhibitortriggers on incoming traffic to the server device. • Where Darktrace RESPOND deems a specific connection from a client to a server is most effectively blocked by targeting the incoming connection on the server end. For example, if a client uses a proxy and the client is unreachable, Darktrace RESPOND will target the incoming connection from the client to the proxy. This case is highly specific and occurs infrequently.
- 225. DASHBOARD VIEW 257 SYSTEM STATUS ALERTS VIEW 257 SYSTEM STATUS DETAILS VIEW 259 APP SETTINGS 260 DARKTRACE/EMAIL OVERVIEWVIEW 248 DARKTRACE/EMAIL EMAIL LOGS VIEW 251 DARKTRACE/EMAIL EMAIL DETAILS VIEW 254 DARKTRACE RESPOND ACTIONS VIEW 245 ACTION DETAILS VIEW 246 CHAPTER 11 - REGISTERING THE APPAS A USER 226 DARKTRACE MOBILE APP 227 AI ANALYST VIEW 229 AI ANALYST INCIDENT OVERVIEW 230 AI ANALYST INVESTIGATIONS 233 ALERT VIEW 235 MODEL DETAILS VIEW 237 DEVICE DETAILS VIEW 239 BREACH DETAILS VIEW 242 GETTING STARTED CYBER AI ANALYST DEVICES AND MODELS THE MOBILE APP DARKTRACE RESPOND DARKTRACE/EMAIL OTHER VIEWS AND SETTINGS
- 226. 226 2. On your smartphone, open the appropriate app store and search for Darktrace. The Darktrace iOS app is available on the App Store and the Android app is available on the Google Play store. Download the Darktrace app. 1. Navigate to Account Settings from the main menu of the Threat Visualizer or Platform Accounts Console. The ‘Register Mobile App’ option should now be available. Click ‘Register Mobile App’ to reveal a QR code. For SSO users, this QR code dialogue will also display a passphrase section. 3. Open the Darktrace app. You will be prompted to authenticate with the Darktrace instance. Press ‘Next’ to proceed. The app will request permission to use your smartphone camera. Use the camera to scan the QR code in the Threat Visualizer generated above. The Darktrace mobile app, an increasingly popular option that our customers are utilizing in order to get alerts whilst away from the office, can be registered from the Account Settings page. A configured mobile app Service is presumed - if this is not configured, please see Configuring the Mobile App for the setup process. The following setup process requires access to the Threat Visualizer or Platform Accounts Console (formerly SaaS Console). For Darktrace/Email customers who do not have access to these interfaces, the relevant settings have been made available as of Darktrace 6.1. These steps are also accessible from the Threat Visualizer main menu (question Help mobile-button Mobile App Setup Help ) and from the app registration pop-up within Account Settings noted in step 1. How to Register REGISTERING THE APP AS A USER 4. After the QR has been scanned, you must provide a password to finalize authentication. For Threat Visualizer and LDAP users, enter the password used to log into the Threat Visualizer. For SAML SSO users, enter the passphrase displayed in the same pop-up as the QR code in the password field. This passphrase is only valid for 90 seconds. Ensure that all characters including hyphens are entered correctly. The app should now authenticate. Move between the screens for a guide overlay explaining the functionality. The guide can be re-enabled at any point from the settings page.
- 227. 227 dtr-ai-analyst AI Analyst AI Analyst investigates the activity and concludes whether it needs to be surfaced for human analysts to review; the results of this analysis is then grouped in incidents. The AI Analyst page displays recent AI Analyst incidents and user-triggered AI Analyst investigations for operator review. Further detail on AI Analyst and AI Analyst investigations is provided from AI Analyst View onward. triangle-exclamation Alerts The alerts page contains Darktrace model breaches, grouped by model or device. Users who wish to dive down deeper and investigate specific behaviors after investigating AI Analyst incidents can move to this view of the Mobile App. See Alert View for further information on this interface. a RESPOND Darktrace RESPOND can take a range of proactive, measured, automated actions in the face of confirmed cyber-threats detected in real time. The Darktrace RESPOND actions page lists all current and expired Darktrace RESPOND Actions. Actions from Darktrace RESPOND componentssuchasDarktraceRESPOND/Network,DarktraceRESPOND/AppsandDarktrace RESPOND/Endpoint will appear in this window. Refer to Darktrace RESPOND Actions View for further information on this view. envelope Emails The recent Darktrace/Email expansion extends the quick investigation and response capabilities of the Darktrace mobile app to the inbox. The Emails page is the landing page for interacting with Darktrace/Email functionality - investigate, hold or release emails on the go. The email interface includes an overviewdashboard, interactive actions, fullysearchable email logs, and the key parts of the Darktrace/Email narrative for each email entry. Pivot to the main Darktrace/Email OverviewView guide for more detail on this component. App Interface DARKTRACE MOBILE APP The Darktrace Mobile App provides a streamlined Threat Visualizer experience for on-the-go investigation and response. Investigate ongoing anomalous activity highlighted by Darktrace DETECT, approve autonomous RESPOND actions pending human confirmation, share alerts with colleagues and be notified when critical priority AI Analyst incidents are created - on the go, wherever you are. The app has eight main areas, with detailed investigation interfaces accessed from these pages. To view more pages, tap the ellipsis More icon to open a dialog with further options. The order of pages can also be reordered from this dialog. This guide presumes the full range of currently available Darktrace mobile app functionality is in place. The pages and options that appear are conditional upon the Darktrace products licensed and the authenticated user’s permissions and visibility, so some options or pages described here may not be available to all users.
- 228. 228 tachometer-fast Dashboard The Dashboard summary mirrors the high-level Darktrace DETECT and Darktrace RESPOND information available on the summary panel on the Threat Visualizerworkspace. More specific details are provided in Dashboard View. circle-exclamation System Status System Status alerts keep Darktrace operators informed of system health, changes in monitored traffic, and any errors experienced by Darktrace/Apps, Darktrace/Cloud, and Darktrace/Zero Trust modules, or virtual sensors. See System Status Alerts View for more information. gear Settings Change global, app-level settings such as the app pin code and notification thresholds and reset authentication and help overlays. See App Settings for further details. bell Notifications Review recent push notifications from the Darktrace mobile app. The next stepforDarktrace DETECTcustomers isto reviewtheAIAnalystView,where incidents are created for the most interesting and high priority activity observed by Darktrace. For Darktrace/Email deployments, the recommended workflow is to navigate to the Darktrace/ Email Overview View and begin with the high level Darktrace/Email statistics displayed there.
- 229. 229 AI ANALYST VIEW Incident Tiles The heading of each entry indicates the initial device - the device that triggered the first activity AI Analyst detected - and if applicable, the number of additional devices involved in the incident. Device details such as device type (indicated by icon), hostname and tags are also displayed for quick reference. Underneath the heading, the tile lists the title of each event the incident comprises. The time thefirst eventwas created is displayed inthe bottom left andthe behaviorcategoryassociated with the incident is indicated in the bottom right. Pinned incidents are always returned regardless of whether they fall within the time range chosen, unless explicitly filtered out. Pinned incidents are indicated by the thumbtack pin icon. Filtering options closely mirror those of the Threat Visualizer Threat Tray - please refer to Filtering Alerts with Behavior Categories, Filtering Alerts with Basic Filters and Filtering Alerts with Advanced Filters for more detailed explanations of each of these settings. Interactions The following interactions are available: • Swipe right to pin or unpin the incident. • Swipe left to acknowledge the incident and all underlying events. • Tap the ellipsis-v three dots to see actions for this incident. • Tap on an incident to review. Incident Overview If an AI Analyst incident is tapped from this view, the Incident Overview will open. Incident Overview and subsequent views will now be covered in AI Analyst Incident Overview. The AI Analyst page displays recent AI Analyst incidents and investigations. There are two tabs: Results and Investigations. Results contains recent AI Analyst incidents, both generated by Darktrace automatically or created as a result of an operator-initiated investigation. The second tab - Investigations - will be covered in AI Analyst Investigations. By default, incidents are sorted chronologically and filtered to show only critical incidents with a score over20% created in the last 24hours. Tap the filter filtericon to change the sorting, filters, orwhether pinned or acknowledged incidents should be included in the results. OPTION DESCRIPTION search Search Search the incidents. filter Filters Change the filters, order, time frame and type of incidents that appear. Incidents are created from AI-powered investigations into anomalies across your digital environment. Every time the conditions for a model are met and a model breach is created, AI Analyst investigates the activity and concludes whether it needs to be surfaced for human analysts to review. The results of this analysis is then grouped in incidents. Incidents
- 230. 230 Incident Overview AI ANALYST INCIDENT OVERVIEW Discussion Devices Incident Overview Tabs Now, tap on an individual incident tile to open the overview. Two icons are displayed in the top right. OPTION DESCRIPTION thumbtack / thumbtack Pin / Unpin Pin or unpin the incident. check-double Acknowledge All Acknowledge this incident and all underlying incident events. The top of the overview displays the overall incident score from 0-100%, the initial device and number of devices involved, and the date the first event was created. Underneath are three tabs: info-circle incident info, laptop-mobile devices and comment-alt discussion. Discussion The discussion tab can be used to post comments on the incident for other Threat Visualizer and Mobile App users to review. Comments remain within your Darktrace environment - to discuss a model breach with Darktrace analysts, please use Ask the Expert or the Darktrace Customer Portal. Devices The devicestab detailsthe devicesthattriggered each incident event intheAIAnalyst incident. The device type, hostname and any tags are displayed. Tap on an individual device to switch to the device details and reviewmodel breaches oractive RESPOND actions for the device. Device details is covered in Device Details View.
- 231. 231 Interactions The following interactions are available: • Swipe left to acknowledge the specific incident event. • Tap the ellipsis-v three dots to see actions for this incident. • Tap the chevron-up up arrow to review more actions: • Tap the share-alt share icon to create a short message with a link to the incident in the Mobile App and in the Darktrace Threat Visualizer. The share option can be used to make a note for later follow-up or to email a colleague with the request that they investigate further. • Tap on an event to review more details on the incident events page. Belowthe list of events, the Attack Phases Involved visualization associates those events with the stages of a cyber attack they likely represent. Incident Info An incident is composed of one or more events; events are a group of anomalies or activity investigated by Cyber AI Analyst that it considers high priority enough to raise to a human operator for attention. The incident info tab displays details of these incident events; each event describes the type of activity found and the time frame over which the activity was identified. Individual events can be pinned - pinned events are indicated by the thumbtack pin icon.
- 232. 232 Attack Phases Involved associates the event activity with the stages of a cyber attack it may likely represent. Below, the model breaches that triggered the initial investigation are listed. AI Analyst is not reliant on model breaches, they primarily provide a starting point for its deeper analysis of the device activity around the anomaly time. Each model breach can be tapped to see further details - these details are covered in Breach Details View. OPTION DESCRIPTION thumbtack / thumbtack Pin / Unpin Pin or unpin the incident. Incident Events The event title and the time period over which the activity was detected will appear at the top. Underneath, the summary describes the type of activity AI Analyst detected, the device involved, any endpoints connected to and an explanation ofwhythe activity is anomalous. The summary is the best way to quickly understand the activity AI Analyst has flagged for human review, and can be localized into any of the current twelve language options in the global settings. Depending on the event type, multiple sections containing contextual information will appear. These may include connection information, devices triggering connections, transferred file information. Tap on an individual event to review. Each incident is comprised of events which detail a specific anomalous activity - or chain of activities - investigated by AI Analyst. The “Incident Events” page gives a detailed overview of each of these events. Where there are multiple events, swipe left or right to move between the event screens.
- 233. 233 AI ANALYST INVESTIGATIONS Interactions The following interactions are available: • Swipe left or right to move between the event screens. • Tap a related model breach to see more details. • Tap the name of a device that appears in the summary or event details so see more detailed device info. • Tap the chevron-up up arrow to review more actions: • Tap the share-alt share icon to create a short message with a link to the incident in the Mobile App and in the Darktrace Threat Visualizer. • Tap the check check icon to acknowledge this specific event. Events can be acknowledged individually, rather than as part of the whole incident - this is a common workflow as a threat analyst investigates each underlying event in turn. • Tapthe pin iconto pinthe incidenttothetop oftheCyberAIAnalyst incident list; pinned events will display a filled icon thumbtack. Pinned incidents will always appear at the top of the list and will persist until unpinned. The Investigations tab shows manually triggered AI Analyst investigations into devices or users observed by the Darktrace platform. Investigations can be triggered from a specific alert in the app, orfrom the main Threat Visualizer interface. For more information on triggered investigations in the Threat Visualizer, please see Triggered AI Analyst Investigations. By default, investigations are sorted chronologically from the time theywere initially triggered. This is distinct from the investigation time - shown on the investigation tile - which is the time that the investigation was focused upon. OPTION DESCRIPTION search Search Search the investigations. Incident Tiles The heading of each entry indicates the investigated device and the icon on the left indicates the current state of the investigation. Investigations in the app have three states - spinner investigating, circle-check no incident found and circle-exclamation incident found.
- 234. 234 Interactions The following interactions are available: • Tap the eye View Incident button to open AI Analyst Incident Overview. Will only appear if an incident was created as a result of the investigation. • Tap the desktop Go to Device button to open Device Details. • Tap the exclamation-triangle Delete Investigation button to delete the investigation permanently for all users. This will not delete any incidents created a result of the incident, only the investigation entry. Below the device is the user who triggered the investigation - users can see all investigations launchedbyotherusers,fromboththeappandThreatVisualizerinterface.Thestateisrepeated underneath. The final element is investigation time; this is not the time the investigation was launched, but the time that AI Analyst is launching the investigation for. When an investigation is triggered, AI Analyst will perform a close analysis of the activity for the device or user for a period of roughly one hour, using the time provided as a central point. It will then contextualize this behavior against historic activity and connectivity for the entity and its peers. If a finished investigation has the result “No Incident Found”, AI Analyst did not locate any identifiable anomalous activity around the investigation time. If anomalous activity is detected, one or more incident events will be created. Investigation Details Tap an investigation to review further, or to delete it. The device subject to investigation is repeated at the top of the page. If an incident was found, the background of the investigation page will also reflect this with a red highlight. This view repeats the investigation time, the user who triggered the investigation and the final state. Depending on whether an incident was found, multiple buttons will appear below these details to allow interaction with the investigation.
- 235. 235 ALERT VIEW The alerts page contains Darktrace model breaches, grouped by model or device. AI Analyst already investigates every model breach that occurs on the system and reports only the most interesting activity as incidents. Users who wish to dive down deeper and investigate specific behaviors after investigating AI Analyst incidents can move to this view of the Mobile App. “Alerts” combines the “Models” and “Devices” screens from the previous Mobile App version. Alerts The alerts page displays recent Darktrace Model Breaches. By default, alerts are sorted by threat score and filtered to show only critical or suspicious model breaches with a score over 60% created in the last 24 hours. Tap the filter filter icon to change the sorting, filters, orwhether acknowledged model breaches should be included in the results. OPTION DESCRIPTION search Search Search the model breaches. filter Filters Change the filters, order, time frame and type of model breaches that appear. The alerts page has two tabs: exclamation-triangle models and desktop devices. For devices with current model breaches and AI Analyst incidents - the devices tab will display both from the same view. This is not applicable to the models view. Any defined filters are applied to both tabs. Filtering options closely mirror those of the Threat Visualizer Threat Tray - please refer to Filtering Alerts with Behavior Categories, Filtering Alerts with Basic Filters and Filtering Alerts with Advanced Filters for more detailed explanations of each of these settings. Models Tab The time ofthe most recent model breach forthat model is displayed in the bottom left. On the bottom left of the tile are the behavior category associated with the incident and the number of alerts for the model. In model view, the heading of each entry displays the name of the Darktrace model that was triggered. The color of the exclamation-triangle model breach icon and the left bar indicate severity - a yellow line and icon indicate a low score and red a high score. Models with unread model breaches are indicated by a blue dot.
- 236. 236 Pinned model breaches are always returned regardless of whether they fall within the time range chosen, unless explicitly filtered out. Pinned model breaches are indicated by the thumbtack pin icon. Interactions The following interactions are available: • Swipe right to mark the model breach as read or unread. The main alerts view can be filtered to prioritize (display first) or only display unread model breaches. • Tap the ellipsis-v three dots to see actions for this model. • Tap on a model tile to review the model breach(es) in more detail. Model Details If a model breach is tapped from the model view, the Model Details page will open. Model Details is covered in Model Details View. Devices Tab The time of the most recent model breach for that device is displayed in the bottom left and the number of model breaches on the right. If the device has triggered AI Analyst incidents during the timeframe, these are also included in the count. Pinned devices are always returned regardless of whether they fall within the time range chosen, unless explicitly filtered out. Pinned model breaches are indicated by the thumbtack pin icon. Indevicesview,theheadingofeachentrydisplaystheidentifierofthedevicethathastriggered the model breaches; the device may be identified by hostname, IP or label. The color of the device icon and the left bar indicate severity - a yellow line and icon indicate a low score and red a high score. The icon type also corresponds to the device type - for example, desktop indicates a desktop device. Devices with unread model breaches are indicated by a blue dot.
- 237. 237 Interactions The following interactions are available: • Swipe right to mark the device and underlying model breaches as read or unread. The main alerts view can be filtered to prioritize (display first) or only display unread model breaches. • Tap the ellipsis-v three dots to see actions for the device. • Tap on a device tile to review the model breach(es) for that device in more detail. Device Details If a model breach is tapped from the device view, the Device Details page will open. Unlike model details, device details includes both model breaches and AI Analyst incidents. Device Details is covered in Device Details View. The Model Detailsviewcan be opened from a numberoflocations in the mobile app including: • Tapping a model name from the Alerts page in model view • Tapping the “Go to model” button from a RESPOND action • Tapping the “Go to model” button from the Breach Details view The most common workflow to access this view is from the alerts page in model view. The alerts page was covered in more detail in Alert View. Model Details MODEL DETAILS VIEW Model details shows all the recent breaches for the selected model (depending on filter options) and a short description of the model itself.
- 238. 238 Interactions The following interactions are available: • Tap any of the three icons in the top right as described above - thumbtack / thumbtack Pin / Unpin, check-double Acknowledge All or envelope-open Mark as Unread. • Tap the filter filter icon to filter the results. • Filter the results with the search search. • Swipe left on a model breach entry to acknowledge or unacknowledge that entry. • Swipe right on a model breach entry to mark that entry as read or unread. • Tap the ellipsis-v three dots on a model breach entry to see actions for that entry. • Tap on a model breach entry to review more details on the breach details page for that entry. Breach Details The breach details view can be opened from multiple locations in the mobile app. Tapping on a model breach entry from model details will open this view. Breach Details is covered in Breach Details View. Three icons are displayed in the top right: OPTION DESCRIPTION thumbtack / thumbtack Pin / Unpin Pin or unpin all model breaches for this model. check-double Acknowledge All Acknowledge all model breaches for this model. envelope / envelope-open Mark as Read / Unread Mark all model breaches for this model as read or unread. The central exclamation-triangle model breach icon displays the highest threat score of all underlying model breaches for the model. Below this icon is the full model name and a short description of the type of activity detected by it. Each model breach for the model appears as a separate entry. Unread model breaches are indicated by a blue dot. Entries can be filtered or searched. Tap the filter filter icon to filter the results using the same filters as the main alerts page - this filter will not persist if the view is closed. The heading of each entry indicates the device that triggered the model breach. Device details such as device type (indicated by icon), hostname and tags are also displayed for quick reference. The color of the device icon and the left bar indicate severity - a yellow line and icon indicate a low score and red a high score. The time the model breach was triggered also appears in the bottom left of the tile.
- 239. 239 The Device Detailsviewcan be openedfrom a numberoflocations inthe mobile app including: • Tapping a device name from the Alerts page in devices view • Tapping a device name from an AI Analyst event • Tapping the “Go to device” button from the Breach Details view The most common workflow to access this view is from the alerts page in devices view. The alerts page was covered in more detail in Alert View. Device Details DEVICE DETAILS VIEW Device view shows all the recent model breaches - and, if applicable - AI Analyst incidents for the selected device (depending on filter options). Darktrace RESPOND actions are also displayed in a separate tab. OPTION DESCRIPTION thumbtack / thumbtack Pin / Unpin Pin or unpin this device device. check-double Acknowledge All Acknowledge all model breaches for this device. This will not impact anyAI Analyst incidents. envelope / envelope-open Mark as Read / Unread Mark all model breaches for this device as read or unread. This will not impact anyAI Analyst incidents. The central device icon displays the highest threat score of all underlying model breaches for the model - the icon itself corresponds to the device type. Beloware details ofthe device such as the type, IP address, hostname and any tags applied. There are two tabs: exclamation-triangle Alerts and a Darktrace RESPOND. Interactions The following interactions are available: • Tap any of the three icons in the top right as described above - thumbtack / thumbtack Pin / Unpin, check-double Acknowledge All or envelope-open Mark as Unread. Please note, these options will not impact any AI Analyst incidents associated with the device. • Tap any of the tabs to review different information about the device - exclamation-triangle Alerts or a Darktrace RESPOND • Tap the chevron-up up arrow to review more actions: • Tap the a Launch RESPONDAction button to create a Darktrace RESPOND action against the device. A dialog will open to select the type of action, the time period, and a free text “reason” field to describe the purpose of the action. • Tap the dtr-ai-analyst Launch Investigation icon to trigger an AI Analyst investigation on the device at the chosen time. Refer to AI Analyst Investigations for more information. Three icons are displayed in the top right:
- 240. 240 • Tap the chart-area View Device Activity button to open the Device Activityview (described below). • Tap the share-alt Share button to create a short message with a link to the device in the Mobile App and in the Darktrace Threat Visualizer. Device Activity The device activity graph displays all model breaches for the given device. The y axis and dot colorrepresentsthe severityscore ofeach model breach.Tap on a dotwill produce a summary pop-up - tap the summary to open the Breach Details View for the model breach. Drag with two fingers to zoom. Return to the original viewwith the undo-alt arrow. Darktrace RESPOND tab Foreach device, Darktrace RESPONDactions can be quicklyreviewedfromthistab. RESPOND actions can be filtered to show a longer time period or show only those associated with a model breach above a certain score. The sorting order - by default, oldest expiring action first - can also be altered. Each entry represents an individual action - the number of actions associated with the device over the timeframe appears in the top right. The color of the a RESPOND icon and left hand barindicatethe severityofthe model breachthattriggeredthe action. Inthis case,this severity will match that of the model breach under investigation. The entry details describe the device, action triggered, and the start and end time of the action itself. To see further details on the action or to interact with the action, tap on the entry to open Action Details. This page is covered in more detail in Action Details View.
- 241. 241 Alerts Tab The alerts tab combines both AI Analyst and Model Breach alerts for the device. Each model breach or AI Analyst incident for the device appears as a separate entry. Unread model breaches are indicated by a blue dot. Entries can be filtered or searched. Tap the filter filter icon to filter the results using the same filters as the main alerts page - this filter will not persist if the view is closed. Model Breaches The heading of each model breach entry indicates the model that was triggered. The color of the model icon and the left bar indicate severity - a yellow line and icon indicate a low score and red a high score. The time the model breach was triggered appears in the bottom left of the tile and the model threat category appears on the right. Tapping on a model breach will open the Breach Details page. This page contains detailed information about the model breach and is covered in Breach Details View. AI Analyst Incidents The heading of each entry indicates the initial device - the device that triggered the first activity AI Analyst detected - and if applicable, the number of additional devices involved in the incident. Device details such as device type (indicated by icon), hostname and tags are also displayed for quick reference. Underneath the heading, the tile lists the title of each event the incident comprises. The time thefirst eventwas created is displayed inthe bottom left andthe behaviorcategoryassociated with the incident is indicated in the bottom right. Tapping on an incident from this view will open the Incident Overview. Incident Overview and subsequent views will now be covered in AI Analyst Incident Overview. Interactions • Tap the filter filter icon to filter the results. • Filter the results with the search search. • Swipe left on a model breach entry or AI Analyst incident to acknowledge or unacknowledge that entry. • Swipe right on a model breach entry to mark that entry as read or unread. • Tap the ellipsis-v three dots on a model breach or AI Analyst incident entry to see actions for that entry. • Tap on a model breach entry orAI Analyst incident to review more details for that entry. Breach Details The breach details view can be opened from multiple locations in the mobile app. Tapping on a model breach entry from device details will open this view. Breach Details is now covered in Breach Details View.
- 242. 242 The Breach Detailsviewcan be openedfrom a numberoflocations inthe mobile app including: • Tapping a related model breach from an AI Analyst event • Tapping a model breach entry from the device details or model details view. • Tapping a related model breach from a Darktrace RESPOND action This is a key view for performing preliminary investigations into model breach activity and reviewing any associated Darktrace RESPOND actions. Breach Details BREACH DETAILS VIEW Tap on an individual model breach entry to open the breach details. Three icons are displayed in the top right. OPTION DESCRIPTION thumbtack / thumbtack Pin / Unpin Pin or unpin this model breach. envelope / envelope-open Mark as Read / Unread Mark this model breach as read or unread. comment-alt Comment Review the discussion for this model breach and add comments. The top of the overview displays the overall model breach score from 0-100%, the triggering device and device details, and the date the model breach was created. Underneath are three tabs: info-circle Model Breach info, list Model Breach Event Log and a Darktrace RESPOND. Interactions The following interactions are available: • If there are multiple model breaches, swipe left or right to move between the model breaches. This is only valid if the breach details view was accessed from device details or model details, where there may be multiple model breaches associated with the device or model. • Tap any of the three icons in the top right as described above - thumbtack / thumbtack Pin / Unpin, envelope / envelope-open Mark as Read / Unread or comment-alt Comment. • Tap the chevron-up up arrow to review more actions: • Tap the check check icon to acknowledge this model breach. • Tap a Launch Darktrace RESPOND to create a manual Darktrace RESPOND action. • Tap the share-alt share icon to create a short message with a link to the model breach in the Mobile App and in the Darktrace Threat Visualizer. • Tap any of the tabs to review different information about the model breach - info-circle Model Breach info, list Model Breach Event Log or a Darktrace RESPOND
- 243. 243 Model Breach Event Log The info-circle Model Breach info tab details the events and activity that triggered the model breach. Darktrace RESPOND actions associated with the model breach may also appear here. For example, for a model breach relating to unusual SSH connectivity, the model breach event log might display a single anomalous SSH connection (or possibly more than one). In contrast, fora model breach relating to excessive HTTPerrors orport scanning, the event logwill display far more events, because for these types of behavior it is a number of events in combination that all contribute to the detection of an anomaly. For most models, the event log will contain a small number of entries that are relevant. Tap on any of the breach details to produce a pop-up with further information about the connection or event. For external locations such as IP addresses or hostnames, Darktrace will attempt to derive a geolocation; the external-link icon indicates a geolocation is available. Tapping this icon will open a Maps application at the derived coordinates. Model Breach Info RESPOND Darktrace RESPOND Certain models can also trigger Darktrace RESPOND actions; if a model breach has triggered an action, this will appear in the Darktrace RESPOND tab. Each entry represents an individual action - one model may trigger multiple actions if, for example, both Darktrace RESPOND/Network and a Darktrace RESPOND firewall integration are in place. The number of actions triggered by the model appears in the top right. The color of the a RESPOND icon and left hand bar indicate the severity of the model breach that triggered the action. In this case, this severity will match that of the model breach under investigation. The entry details describe the device, action triggered, and the start and end time of the action itself. To see further details on the action, review the action state, or interact with the action, tap on the entry to open Action Details. This page is covered in more detail in Action Details View.
- 244. 244 Model Breach Info This tab displays more detailed information about the user or device that triggered the model breach and the model breach itself. Any tags applied to the triggering device are included alongside details of the device itself such as hostname and type. Interactions The following interactions are available: • Tap the desktop Go to Device button to open Device Details. • Tap the exclamation-triangle Go to Model button to open Model Details. Depending on where the breach details view is opened from, one or both of these buttons may appear.
- 245. 245 DARKTRACE RESPOND ACTIONS VIEW By default, actions are sorted to display earliest expiry first and filtered to show the last seven days;tapthe filterfiltericonto changethe sorting andfilters. Filters can be appliedto onlydisplay actions triggered by model breaches above a certain score or triggered by models within specific folders. No score filter applied by default as manual Darktrace RESPOND actions do not have an associated model breach score and would therefore be filtered out. Action Tabs Darktrace RESPOND can take a range of proactive, measured, automated actions in the face of confirmed cyber-threats detected in real time. Darktrace understands the ‘pattern of life’ of users, devices, and networks and so Darktrace RESPOND can take action in a highly targeted manner, mitigating threats while avoiding over-reactions. RESPOND Actions The Darktrace RESPOND actions page lists all current and expired Darktrace RESPOND Actions. Actions from Darktrace RESPOND components such as Darktrace RESPOND/ Network, Darktrace RESPOND/Apps and Darktrace RESPOND/Endpoint will appear in this window. Actions are split into four tabs: pending, active, cleared and expired. • Pending Actions are Darktrace RESPOND Actions that have not yet been approved by a human operator. Actions can be activated from this view. • Active Actions are current Darktrace RESPOND Actions which are in place and have not yet expired. • Cleared Actions are Darktrace RESPOND actions that were manually cleared by an operator. Clear will inform Darktrace RESPOND to stop controlling the device or user and suppress the combination of Darktrace RESPOND Action and model breach conditions for 24 hours. Two icons are displayed in the top right: OPTION DESCRIPTION search Search Search the actions. filter Filters Change the filters, order, or time frame of actions that appear.
- 246. 246 ACTION DETAILS VIEW Action Details • Expired Actions are previous Darktrace RESPOND actions for devices and users in your environment. Actions can be reactivated and manually extended if desired. The number of actions under each tab is listed in the top right. Each tab contains action entries; each entry details the action taken (inhibitor), the device or user affected, the model that triggered the action (if applicable) and the start and expiry time of the action. The color of the a RESPOND icon and left hand bar indicate the severity of the model breach that triggered the action. Interactions • Tap the filter filter icon to filter the results. • Filter the results with the search search. • Swipe left on a pending action to check-double activate it. • Swipe left on a cleared action to check-double reactivate it for the chosen time period. • Swipe left on an expired action to check-double reactivate it for the chosen time period. • Swipe left on an active action to show further options: • Tap on clock Extend to extend the action for the chosen time. • Tap times Clear or swipe fully to clear it. • Tap on an action entry from any tab to review more details on the action details page. Action Details The action details view can be opened from multiple locations in the mobile app. Tapping on an action from the RESPOND actions page will open this view. Action Details is covered in Action Details View. The action details page can be opened from a number of locations in the mobile app. There are two tabs: info-circle action info and exclamation-triangle model breach info. The top of the overview describes the inhibitor - the type of action RESPOND has taken - and if triggered by a model breach, the score of the associated model breach. Manual actions created by users do not have a score associated as they are not triggered by a model breach. Underneath the action are details of the device impacted (or potentially impacted in the case of pending actions), the start time of the action and the expiry of the action
- 247. 247 Interactions The following interactions are available: • Tap the chevron-up up arrow to review more actions: • Tap play Activate to reactivate an expired or cleared action. • Tap plus Extend to extend an active action. • Tap stop Clear to clear an active action. • Tap play Activate to activate a pending action. • Tap any of the tabs to review different information about the action - info-circle action info or exclamation-triangle model breach info. Model Breach Info Action Info Model Breach Info ThemodelbreachinfotabincludesdetailsofthemodelthattriggeredtheDarktraceRESPOND action. The model name, model behavior category and model description are listed. Tap the desktop Go to Model button to open the Model Details view for the model. Model details is covered in more detail in Model Details View. Action Info This tab displays more detailed information about the action and the user or device affected by the action. Tap the desktop Go to Device button to open Device Details for the affected device. If the action was triggered by a model breach, the related model breach will appear on the tab - tap this entry to open Breach Details for the model.
- 248. 248 • Total emails are all inbound emails observed by Darktrace/Email. • Actioned emails are inbound emails with some form of Darktrace/Email response. • Users targeted is the total count of internal email addresses targeted by the malicious communications Darktrace/Email identified. Outbound Emails “Detected emails” are those that Darktrace/Email has detected to have some anomalous or otherwise concerning properties. The percentage of detected emails contextualizes these against all observed outbound emails. • Total emails are all outbound emails observed by Darktrace/Email. • Detected emails are outbound emails with unusual properties. • Users responsible is the number of users to whom the anomalous communications Darktrace/Email detected can be attributed. The new Darktrace/Email expansion extends the quick investigation and response capabilities of the Darktrace mobile app to the inbox. The Emails page is the landing page for interacting with Darktrace/Email functionality - investigate, hold or release emails on the go. The email interface includes an overview dashboard, interactive actions, fully searchable email logs, and the key parts of the Darktrace/ Email narrative for each email entry. There are two main views - envelope Emails and chart-bar Overview. • The chart-bar Overview page displays key metrics from the Intent Dashboard of the main Email Console, such as mailflow volumes, most anomalous users, and the number of Darktrace/Email actions taken. • The envelope Emails page provides full filtered logs - hold emails, release emails, and review the email narrative to quickly understand and action individual emails. Overview DARKTRACE/EMAIL OVERVIEW VIEW The Darktrace/Email overview page displays an at a glance overview of the most at-risk users, currentthreats identified in organizational emailtraffic and anytrends in malicious mailflowover the last seven days. The elements on this page mirror the Dashboard and Intent Dashboard of the Email Console. The first element is a summary of actions applied to inbound emails and activity detected in outbound email over the last 7 days. Swipe to switch between views. Inbound Emails The percentage of actioned emails contextualizes the number altered in some way by Darktrace/Email against all inbound emails. “Actioned emails” are those that received some reaction by Darktrace/Email that has altered their appearance, content, final location in the inbox, or have triggered an alert to operators of some form.
- 249. 249 • Alternatively, swipe to the final blank tile with a plus plus icon and tap the icon to add a new graph tile. User Intent and Data Loss Overview Graphs Bydefault, the overviewgraphs displaytrends in inbound and outbound emails overtime - this can useful to identify spikes that may represent a targeted campaign against the organization. The overview graphs can also be customized to graph significant Darktrace/Email actions or the quantityofemails taggedwith Darktrace/Email tags overthe last seven days.Tags attempt to characterize the behavior or sender intent observed by Darktrace/Email in the message. Interactions The following interactions are available: • Swipe to move between graphs; the number of tiles is indicated by dots below the element. • Tap on a graph at any point to display the number of matching emails at that time. • Tap the ellipsis-v three dots to remove the graph, change the data displayed on the current graph tile, or to reset all tiles to default. These elements display key metrics from the Intent Dashboard of the Email Console. User Anomaly Tile (Inbound) An anomaly score is produced for all emails observed and indicates how unusual Darktrace/ Email considers this email to be in comparison to the normal pattern of life. Users who appear on the user anomalies tile are those who received the most anomalous mail overthe selected timeframe. The threshold for an email message to be considered for the intent dashboard graph is a Darktrace/Email anomaly score over 60%. For each user, the number of anomalous emails are displayed against the total number of emails received. The total number of links and attachments associated with the anomalous mailflow is also displayed.
- 250. 250 Data Loss Tile (Outbound) To qualify as a potential data loss incident, an outbound email must breach one of Darktrace’s carefully curated Data Loss models. These models detect when a user communicates with or sends files to their personal home email, to a new freemail, address or to entirely new correspondents which may have been created for the purpose of exfiltration. Foreachuser,thenumberofemailswhichmayinvolvesomemeasureofdatalossaredisplayed against the total number of emails sent. The total number of recipients and attachments associated with these emails is also displayed. Interactions The following interactions are available: • Swipe to move between senders or recipients on the user anomaly or data loss tiles. • Tap on an entry to open the email logs filtered for the anomalous behavior or data loss activity for the given user. The email logs are covered in more detail in Email Logs View. • Attachment Actions flatten or remove files attached to emails which exhibit a high level of anomaly. • Other Actions comprise other, non-significant actions such as those which alter the visual appearance of the email, like as adding banners or removing spoofed sender information, and those which may send a notification to the user regarding held content. Email Logs View Interactive elements described above can open the email logs view with a set of predefined filters applied, such as tags, anomaly level or sender/recipient. Filtering the email logs and interacting directlywith emails is covered in Email Logs View. Top Actions Here, the total actions taken across all email messages is separated into the type of action taken; each category of action can be tapped to filter the email logs by messages actioned in the specified way. • Hold Message and Move toJunk are deliveryactionswhich change the final location of the email, typically taken when an email presents a high level of anomaly. • Link Actions are those which alter visible and invisible links that appear in an email messages or store information about links that are seen. Links may be redirected, blocked or removed.
- 251. 251 Each filter displays the current value; applied filters are highlighted with an outline. Tap filter elements to add ormodifythe filterapplied. Some filterelements are free text andwill maintain a limited history of previous search terms. Interactions The following interactions are available: • Tap a filter entry to add or modify the current filter. • Tap the times x icon to remove the filter. • Tap “Show More” to display further filters. • Tap the search Find Emails button to begin searching the email logs. The Emails page is the landing page for interacting with Darktrace/Email functionality in the Darktrace mobile app. There are two main views - envelope Emails and chart-bar Overview. The chart-bar Overview page was covered previously in Email OverviewView. The envelope Emails tab of the page provides full filtered logs - hold emails, release emails, and review the email narrative to quickly understand and action individual emails. The landing view of the email logs page will differ depending on how it was accessed: • If accessed from the envelope Emails icon, a filterviewwill open. • If accessed from an overview tile, it will open on already filtered logs (section “Email Logs” below). Email Log Filters DARKTRACE/EMAIL EMAIL LOGS VIEW By default, the Darktrace/Email logs will open on a filter page. The functionality is similar to that of the main Email Console filters but the available options are streamlined for on-the-go workflows.
- 252. 252 Email Log Entries Email Logs After a filter is applied, the email logs will open to display matching email messages. This view will also open if the email logs are accessed from an overview element such as the Data Loss tile or Top Actions section. The currently applied filters are displayed across the top - swipe to view all filters. Matching emails are displayed as tiles below. Interactions The following interactions are available: • Swipe right or left on the filters element to review all filters • Tap plus-circle beside the filters to add an additional filter. • Tap the times x icon to remove a filter. At the top of each email log entry tile is the email sender. The subject is displayed below. The Darktrace/Email anomaly score is displayed on the left of the tile; the color of the vertical bar on the tile is tied to this anomaly score - a yellow line and icon indicating a low score and red a high score. The email direction is indicated by the colored arrow beside the recipient - a blue arrow indicates outbound, a tan brown arrow indicates inbound. Where there are multiple recipients, one recipient is listed alongside the number of additional recipients. The time the email was sent (outbound) or received (inbound) is displayed in the bottom left. On the bottom right of the tile are “Quick View Icons” - icons that describe the composition of the message and its final delivery status. These icons are described in depth in the Darktrace/ Email guide - Quick View Icons. Tap on an email entry to open the Email Details.
- 253. 253 Email Details If an email entry is tapped from the email logs view, the Email Details page will open. This contains detailed information about the email and further interactions. Email Details is covered in Email Details View. The following interactions are available: • Tap on an email entry to review more details on the email details page. • Swipe left on an inbound email to pause-circle hold it. If an email has multiple recipients, a dialog will open to select which recipient(s) to hold the email for. Held emails are removed from the user inbox until released by an operator. • Swipe right on an inbound email to envelope release it. Allows the operator to release an original, unactioned copy of the email to the chosen recipients. If an email has multiple recipients, a dialog will open to select which recipient(s) to release the email to. Interactions
- 254. 254 Status and Tags The Email Details view is opened from an email entry in the Email Logs View. It displays key information about the email and allows actions such as hold or release to be taken and for learning exceptions to be taken. Email Details DARKTRACE/EMAIL EMAIL DETAILS VIEW The email details opens when a specific email is selected from the logs. The top of the overview displays the time the email was received (inbound) or sent (outbound). In ths view, the recipient is always displayed first. The arrow beside the recipient indicates direction - a blue arrow indicates outbound direction, a tan brown arrow indicates inbound. Wheretherearemultiplerecipients,anadditionaldialogwillappeartoswapbetweenrecipients. The Darktrace/Email anomaly score is displayed on the left and the email subject is displayed below. Underneath this element is the recipient (outbound) or sender (inbound). The exclamation-circle anomaly indicators section expresses the most anomalous, suspicious or potentially threatening aspects of the email. The color of the section indicates the level of anomaly, with red the highest. It will appear for both inbound and outbound emails if there are highly anomalous properties detected by Darktrace/Email. Where an email contains a rare link, or the content indicates the sender is attempting some kind of manipulation, these indicators are displayed here. Belowthe anomalyindicators section is the current deliverystatus ofthe message. This status will change if the email is modified, or the final location altered. See the Status Icon under Quick View Icons above. Underneath are a list oftags. Tags are applied to emails byDarktrace/Email to characterize the possible content or intent of the message. Severity is indicated by the icon color: malicious intents are represented in red andthose requiring caution are indicated inyellow. Informational tags which give important contextual information (such as indicating a bulk mail or a known correspondent) will appear blue. Tap on a tag to view a short description. The actionstaken section describes anysignificant Darktrace/Email actionstaken onthe email. A red icon indicates an action was performed and grey icon indicates the action was not taken, whether due to global configuration settings or the user’s eligibility for automatic actions. Tap an action for a short description of the action and why it was prevented, if applicable.
- 255. 255 Validation Email messages must passvalidation in somewayto be delivered. Iftheydo not passvalidation, or are unable to be verified successfully, this may indicate a concern. The validation section describes the results of these conventional authentication checks on the email. For inbound emails only. Content The final section, content, describes any further characteristics of the email which may be interesting. This mayinclude information about the email type (e.g., bulk mailing), anylow-level anomaly in the message content, or the composition of links and attachments. Interactions Other Email Details Sections The email details tab breaks down Darktrace/Email’s analysis of the message into short, textual summaries that allow a user to understand the context and possible threat posed at a glance. Sections will only appearwhen relevant and are collapsed automatically. Tap to expand. History The historysection summarizes the sending historyofthe external partyin the correspondence. For inbound emails the external party is the sender of the email, for outbound emails it is the recipient. This section is useful to understand how the external user and the domain they are associated with have interacted with your organization. Association The association section summarizes the relationships that have been created with the external party by internal users. For inbound emails the external party is the sender of the mail, for outbound emails it is the recipient. Association is a reversal of the history section - it covers howyour organization has interacted with the external user and their domain. The following interactions are available: • If there are multiple recipients, swipe left or right to move between the recipients or use the recipient selector at the top of the page.
- 256. 256 • Tap the chevron-up up arrow to review more actions: • Tap the envelope Release Email option to release the email to one or more recipients. Release an original, unactioned copy of the email to the chosen recipients. If an email has multiple recipients, a dialog will open to select which recipient(s) to release the email to. • Tap the pause-circle Hold Email option to hold the email for one or more recipients. Held emails are removed from the user inbox until released by an operator. • If the email is released, the additional code Add Learning Exception option will appear. Tap this option to create a learning exception to influence Darktrace/Email response to emails from this sender in the future. This option will open a confirmation dialog describing the learning exception and any changes to lists made as a result. Please see the full Email Console guide “Learning Exceptions” for more information on learning exceptions.
- 257. 257 DASHBOARD VIEW The Dashboard summary mirrors the high-level Darktrace DETECT and Darktrace RESPOND information available on the summary panel on the Threat Visualizer workspace. The page will refresh periodically - pull down on the summary area to trigger a manual refresh. Device counts display the number of entities - users detected in external platforms (SaaS users), devices, credentials - that Darktrace has observed and is actively modelling a pattern of life for. Statistics are calculated over 7 days (IPs¹, Clients, Servers, Devices, and SaaS Accounts), 28 days (Credentials) or12 weeks (Patterns of Life²). The total bandwidth processed overthe last 28 days is displayed for both network devices and, if present, Darktrace/Endpoint. If Darktrace RESPOND/Network is enabled, statistics on the number of actions taken and devices actioned will also be displayed. AI Analyst investigates anomalies detected by the Darktrace system at machine speed and surfaces only those that need human attention. The summary displays the equivalent number of hours it would take a human analyst to perform the same investigations. Of those incidents surfaced, the type of activity they represent is also broken down by category. ¹ Peak unique values in any 24hr period over last 7 days. ² A detailed description of how the “Patterns of Life” value is calculated is available in Advanced Summary Panel Info from the main Threat Visualizer guide. System Status alerts keep Darktrace operators informed of system health, changes in monitored traffic, and any errors experienced by Darktrace/Apps, Darktrace/Cloud, and Darktrace/Zero Trust modules, or virtual sensors. As of Darktrace 6.1, this coverage has also been expanded to include Darktrace/Email instance health. System Status Alerts include details of the originating host, severity of the event and links which may be help to investigate or resolve the issue. Notifications are sent for active system events and (optionally) on event resolution. System Status Alerts SYSTEM STATUS ALERTS VIEW The System Status Alerts page displays both active and resolved alerts that are currently impacting the health of your Darktrace deployment. There are two tabs: Active and Resolved. By default, alerts are sorted by severity and filtered to show only unacknowledged alerts. Tap the filter filter icon to change the sort order and filters applied. OPTION DESCRIPTION search Search Search the alerts. filter Filters Change the filters, order, and time frame of System Status alerts that appear.
- 258. 258 Active System Status Alerts The default view is Active System Status alerts. Alerts are grouped under headings which describe the type of alert and number of applicable alerts nested below. The heading foreach section describes the overall alert type.Within that section are individual alerts, sorted and colored by severity from red to yellow. The title of each tile describes the alert - underneath is a short, textual description of the issue itself and the time the alert was last updated. All alerts also carry a simple severity - one of Informational, Low, Medium, High or Critical - which is displayed in the bottom right ofthe tile. Interactions The following interactions are available: • Swipe left to see two options • check Acknowledge the alert for the current user, or all users. This will remove it from returned results unless acknowledged alerts are explicitly included. • circle-pause Suppress the alert forthe current user, orall users. Thiswill mute the alert forthe chosentimeframe, atwhich point itwill return as an active alert unless subsequently resolved during the suppressed time. • Tap the ellipsis-v three dots to see actions for this alert. • Tap on an alert to review the System Status alert details. Resolved System Status Alerts Active System Status alerts, when mitigated or expired (informational only) become resolved alerts and will appear in the Resolved tab.
- 259. 259 This tab is essentially the same as that for active; alerts are grouped under headings which describe the type of alert and number of applicable alerts nested below. The two differences worth noting are that resolved alerts do not carry a color severity - all alerts are shaded green to indicate the resolved state - and the updated time is replaced with the time that the alert was designated resolved. Interactions The following interactions are available: • Swipe left to check Dismiss the alert for the current user, or all users. This will remove the resolved alert permanently from view. • Tap the ellipsis-v three dots to see actions for this alert. • Tap on an alert to review the System Status alert details. System Status Alert Details If a System Status alert details is tapped from this view, the System Alert Details will open. This viewwill now be covered in System Status Details View. SYSTEM STATUS DETAILS VIEW When a System Status alert is tapped from the main alerts view, this detailed view will open. It displays key information about the alert and provides a link to raise a ticket on the Darktrace Customer Portal if further assistance is needed. System Status Details The top of the overview displays the alert title, the time the alert was first created and the last time the statuswas updated.The icon and highlight colorindicate the severityofthe alert from Information to Critical. The appearance ofthe details page differs onlyslightlybetween active and resolved Darktrace System Status alerts: active alerts display a severity shading and a last update date, resolved alerts instead display a green shading and the time of resolution. All other elements are essentially the same between both alert states. Underneath is a textual description of the alert, providing further detail on the affected components orsystem function. Recommended resolution steps mayalso be providedwhere applicable. Below this description are a series of fields describing the impacted Darktrace instance, the current alert status, the severity, and the suppression expiry date if applicable.
- 260. 260 Interactions The following interactions are available: • Tap the eye-slash eye icon to mark the alert as read or unread. The main alerts view can be filtered to prioritize (display first) or only display unread System Status alerts. • Tap the hyperlink Create a Ticket to open a link to the Darktrace Customer Portal and raise a ticket for assistance from the Darktrace operations team to resolve the issue. • Tap the chevron-up up arrow to review more actions: • Tap the check check icon to acknowledge the alert for the current user, or all users. This will remove it from returned results unless acknowledged alerts are explicitly included. Active alerts only. • Tap the pause pause icon to suppress the alert for the current user, or all users. This will mute the alert for the chosen timeframe, at which point it will return as an active alert unless subsequently resolved during the suppressed time. Active alerts only. • Tap the check check icon to dismiss the alert for the current user, or all users. This will remove the resolved alert permanently from view. Resolved alerts only. The Settings screen offers multiple filtering options that allow you to customize how data is displayed and stored within the app. In 4.0, the number of settings has been reduced in favour of native filtering within the AI Analyst, Alerts and RESPOND pages. Settings APP SETTINGS Cyber AI Analyst Language Changes the default language for the AI Analyst view. Tap the language to move through all available languages or long press to select from a list. Stay Signed in For Set the time required between logins to 5 minutes (default), 15 minutes or1 hour. Store Data Controls how long data is stored within the application on the mobile device. App Theme Control whether the app should follow system theme or always operate in light or dark mode.
- 261. 261 Breach Notification Categories Controls the threat behavior categories that can create push app notifications for model breaches. Model breaches which are not part of these categories will not create notifications. Breach Score Notification Threshold Controls the minimum threat score that a model breach must reach before it creates an app notification. Applied in conjunction with the model breach category setting above. Breach Notification Models Controls the model categories that can create push app notifications for model breaches; model categories are derived from the folders the models are saved in. Model breacheswhich are not part of these folders will not create notifications. System Status Alert Notification Categories Controls the System Status Alert categories (Informational, Low, Medium, High or Critical) that can create push app notifications - visible in the Notification Centre (iOS) and on the lock screen. System Status alertswhich are not part ofthese categorieswill not create notifications. Enable Help Tips Enables the workflow descriptions that appearwhen the app is first opened. Reset Tips Resets all workflow descriptions to display as if the app is newly installed. Re-authenticate App Re-scan the QR code in the main Threat VisualizerAccount Admin page. Change Pin Code Alter the (minimum four digit) code created during authentication for an alternative log-in method. Log Out Ends the current session in the app and returns to the locked screen, forcing the user to login before continuing their investigation. Please note, this does not end authentication with the Darktrace instance. The user can continue operating the app once a successful login is performed. Notification Settings Incident Notification Categories Controls the threat behavior categories that can create push app notifications - visible in the Notification Centre (iOS) and on the lock screen. AI Analyst incidents which are not part of these categories will not create notifications. Incident Score Notification Threshold Controls the minimum score that an AI Analyst incident must reach before it creates an app notification. Applied in conjunction with the category setting above.
- 262. Darktrace (DARK.L), a global leader in cyber security AI, delivers complete AI-powered solutions in its mission to free the world of cyber disruption. We protect more than 7,400 customers from the world’s most complex threats, including ransomware, cloud, and SaaS attacks. Darktrace is delivering the first-ever CyberAI Loop, fueling a continuous security capability that can autonomously spot and respond to novel in- progress threats within seconds. Darktrace has 115+ patent applications filed. Darktrace was named one of TIME magazine’s “Most Influential Companies” in 2021. ABOUT DARKTRACE LAST UPDATED US:+14152299100 UK:+44(0)1223394100 LATAM:+551149497696 APAC:+6568045010 [email protected] darktrace.com September 26 2023