SlideShare a Scribd company logo
AMIT KUMAR SENAPATI PMP®
DASHBORAD REPORTING USING BI
ORACLE BUSINESS INTELLIGENCE: DASHBOARD REPORTING
2 | P a g e
AMIT KUMAR SENAPATI PMP®
INDEX
Serial
Number
Particulars Page
Number
1 Oracle BI : Introduction 3
2 Benefits of using BI for Dashboard
Reporting
3
3 Challenges of using BI 3
4 System Architecture 4
5 Current tabs in Consideration 4
6 Filters 4
7 Overview Tab 5
8 Schedule Tab 9
9 Milestone Tab 9
10 Earned Value Tab 10
11 CPI/SPI tab 11
12 Conclusion 11
ORACLE BUSINESS INTELLIGENCE: DASHBOARD REPORTING
3 | P a g e
AMIT KUMAR SENAPATI PMP®
1. What is Oracle Business Intelligence (BI)?
Oracle Business Intelligence (BI) is a portfolio of technology and applications that provides the
industry's first integrated, end-to-end Enterprise Performance Management System, including BI
foundation and tools - integrated array of query, reporting, analysis, alerting, mobile analytics,
data integration and management, and desktop integration - as well as category-leading
financial performance management applications, operational BI applications, and data
warehousing.
2. Benefits of using Business Intelligence(BI) for Dashboard Reporting
• Automating the dashboard reports will enable the planner to save time as there will be
no need for manual capturing and it will be easily accessible by authorized users.
• Efficient resource utilization by managing resource overloading and addressing resource
constraint for critical projects.
• Verified and reliable information since there would be less human interface.
• Having the dashboard report stored on the central repository will enable the
department to decrease the progress review time as the report is readily accessible to
the team.
• Standardization – The dashboard will be standardized throughout plant engineering.
3. Challenges of using BI
• Lot of entry needs to be done onto the Planning Tool.
• Every individual using the system , should have a good understanding on its working.
• Allocation of complex formulas is difficult.
• Dependent on client server for producing reports.
• Any changes to the reporting require IT support.
• Some of the resources that are not available on the system needs to be added.
• The Project ID needs to be aligned with the SAP name.
• Remote Connectivity.
ORACLE BUSINESS INTELLIGENCE: DASHBOARD REPORTING
4 | P a g e
AMIT KUMAR SENAPATI PMP®
4. System Architecture
5. Current Tabs in consideration for project Engineering Dashboard Reporting
• Overview
• Schedule
• Milestone
• Resource
• Earned Value
• CPI/SPI
• Risk
6. The filter selections taken into consideration is
ORACLE BUSINESS INTELLIGENCE: DASHBOARD REPORTING
5 | P a g e
AMIT KUMAR SENAPATI PMP®
7. Overview Tab
7.1 Views by Project Phase
7.2 Views by Business Unit
7.3 Views by Operating Unit
ORACLE BUSINESS INTELLIGENCE: DASHBOARD REPORTING
6 | P a g e
AMIT KUMAR SENAPATI PMP®
7.4 The selection of various views is based upon allotment of Project and activity codes to the
Project.
In the above figure we see the various Project Codes assigned to the projects.
Project Phase AA_Eskom_Project_Phase
Project Status AA_Project_Status
Eskom Business Unit AA_EskomBusUnit
Project Priority AA_ProjPriority
Project Engineering Manager AA_PEM
Client Operating Unit AA_Client_Operating_Unit(OU)
Client Division AA_Client_Division
Client Business Unit AA_Client_Business_Unit(BU)
Planner AA_Planner_Names
7.4.1 Assignment of Project Engineering Manager and Planner to the Project
ORACLE BUSINESS INTELLIGENCE: DASHBOARD REPORTING
7 | P a g e
AMIT KUMAR SENAPATI PMP®
7.5 Portfolio to Project Level
The Portfolio level dashboard can be checked from the below table. To check on the
performance of the individual projects, team needs to select the option.
ORACLE BUSINESS INTELLIGENCE: DASHBOARD REPORTING
8 | P a g e
AMIT KUMAR SENAPATI PMP®
The columns mentioned above have been extracted from the following:
Status, Project Phase & Priority is assigned from the Project Codes.
The selection of Quarter can be done from the following drop down menu:
Some understanding on the various Durations -
These important values are described below:
1. Original Duration: This column or field shows the originally planned duration of activities, while these
are planned. When we enter new activities in Primavera P6, we also enter their duration and that
duration is called Original Duration. This value may be changed (if needed) before execution starts.
2. Remaining Duration: This column/field shows duration of the activity yet to be completed. For
example Original Duration of the activity was 10 days. Now, 5 day work is completed. So, the remaining
duration for work is 5 days.
3. At Complete: This column/field shows how much duration will have been completed when the
activity will finish. Ideally, the duration you have planned for the activity should also be At Complete
duration. This will be possible if the work is managed properly so as to complete it in the same duration
which was planned. However, this is not always the case and activity duration is prolonged due to slow
work or non work, hence Original Duration doesn't remain valid in such a case, so we look at At
Complete value to know in how many days the activity will complete with current pace. At Complete
Duration is computed as Actual Duration + Remaining Duration. The At Complete Duration can be
viewed in the Status tab or in the column 'At Completion Duration'.
ORACLE BUSINESS INTELLIGENCE: DASHBOARD REPORTING
9 | P a g e
AMIT KUMAR SENAPATI PMP®
8. Schedule Tab
The schedule tab shows the details for every Portfolio:
9. Milestone Tab
The Milestone Tab indicates the performance of the milestone against the baseline date.
It also provides us an indication on the number of Milestones achieved and the targets missed.
ORACLE BUSINESS INTELLIGENCE: DASHBOARD REPORTING
10 | P a g e
AMIT KUMAR SENAPATI PMP®
10. Earned Value Tab
The Earned Value Tab provides us the details of performance at Portfolio level. To check the
performance of individual projects team needs to select the project for which he is interested to
see the Earned Value report.
The Project level Earned value report is displayed below:
ORACLE BUSINESS INTELLIGENCE: DASHBOARD REPORTING
11 | P a g e
AMIT KUMAR SENAPATI PMP®
11. CPI/SPI Tab
The CPI/SPI tab provides the CPI/SPI result of all the projects.
Here we can also check the Planned and Earned value cost.
12. Conclusion
If used Dashboard Reporting will tremendously reduce report development time and will
provide real time statistics of the health of the project.
It will also motivate the planners to streamline their deliverables on time and as per standards.

More Related Content

What's hot (20)

PPTX
Backlog Refinement 101 & 202
David Hanson
 
PPTX
Introduction to scaled agile framework
Srinath Ramakrishnan
 
PPTX
User Story Splitting.pptx
Paul Boos
 
PPSX
Introduction to Business Analysis
Shwetha-BA
 
PDF
All about Product Roadmaps
Intechnica
 
PDF
Prioritizing Your Product Backlog
Mike Cohn
 
PDF
Certified Scrum Product Owner: class desk, posters and photos
Alexey Krivitsky
 
PDF
Scrum - Product Owner
Márcio Oya
 
PPTX
SAFe SCRUMxp Overview
Rob Betcher
 
PPTX
How to Break the Requirements into User Stories
ShriKant Vashishtha
 
PPTX
Scrum role introduction – The Product Owner
Lê Trọng-Hiệp
 
PPTX
Epics and User Stories
Manish Agrawal, CSP®
 
PPT
User Story Mapping (2008)
Jeff Patton
 
PPTX
Agile Transformation: People, Process and Tools to Make Your Transformation S...
QASymphony
 
PDF
What Is A Product Manager? | The Quick Guide To Product Management
ProdPad
 
PDF
Agile Transformation at Scale
ITSM Academy, Inc.
 
PDF
Scrum: Scrum Guide Summary
Daniel Araujo dos Santos
 
PPTX
Agile (Scrum)
Dom Cushnan
 
PDF
SLSC Implement S4HANA Public Edition with SAP Cloud ALM - Best Practice V5.pdf
cspriyashah1
 
PDF
Workshop - Writing Good User Stories
Easy Agile
 
Backlog Refinement 101 & 202
David Hanson
 
Introduction to scaled agile framework
Srinath Ramakrishnan
 
User Story Splitting.pptx
Paul Boos
 
Introduction to Business Analysis
Shwetha-BA
 
All about Product Roadmaps
Intechnica
 
Prioritizing Your Product Backlog
Mike Cohn
 
Certified Scrum Product Owner: class desk, posters and photos
Alexey Krivitsky
 
Scrum - Product Owner
Márcio Oya
 
SAFe SCRUMxp Overview
Rob Betcher
 
How to Break the Requirements into User Stories
ShriKant Vashishtha
 
Scrum role introduction – The Product Owner
Lê Trọng-Hiệp
 
Epics and User Stories
Manish Agrawal, CSP®
 
User Story Mapping (2008)
Jeff Patton
 
Agile Transformation: People, Process and Tools to Make Your Transformation S...
QASymphony
 
What Is A Product Manager? | The Quick Guide To Product Management
ProdPad
 
Agile Transformation at Scale
ITSM Academy, Inc.
 
Scrum: Scrum Guide Summary
Daniel Araujo dos Santos
 
Agile (Scrum)
Dom Cushnan
 
SLSC Implement S4HANA Public Edition with SAP Cloud ALM - Best Practice V5.pdf
cspriyashah1
 
Workshop - Writing Good User Stories
Easy Agile
 

Similar to Dashboard reporting (20)

PDF
1NT Webinar_Simple Projects
SHIVA PRASAD
 
PDF
Reduce Oracle EBS Month End Accruals Process Time using Automated Dashboard
RapidValue
 
PDF
1. s fin overview
Renu Bhasin
 
PPTX
SAP’s innovations – Are you overlooking important functionality in SAP Contro...
John Jordan
 
PPTX
SAP Innovations:Are you overlooking important functionality in SAP Controlling
Alice Adams
 
PPTX
Softools - Partner Pack - 17-Aug-16
DADD (Design And Digital Development)
 
PDF
Pagerinkite užsakymų įvykdymą laiku naudodami šiuolaikinius gamybos planavimo...
Columbus Lietuva
 
PDF
Paranda ettevõtte tulemusi targa tootmise planeerimise ja operatiivjuhtimisega
Columbus Eesti AS
 
PPTX
Wake Up – It’s Time to Upgrade Your S/4HANA System!
panayaofficial
 
DOCX
J54_S4CLD2108_BPD_EN_US.docx
ssuser13b4e6
 
PDF
Process Flow and Narrative for Agile+PPM
Glen Alleman
 
PDF
Agile planning with rational team concert
Reedy Feggins Jr
 
PDF
Pratibha Chaudhary 6 years Exp SAP ABAP
pratibha44
 
PDF
sap fico implementation project phase pd
smanjunathreddy24
 
PDF
What's New in SAP Business One 10.0
Sundae Solutions Co., Ltd.
 
DOC
Bala murali sapui5 abapcv
Bala Murali Krishna chennamsetty
 
PDF
Creating a Single Global Finance Platform at DTCC with IBM Services
IBM
 
PPTX
Production Module & Report Completion Sub-Module. .pptx
Lamees EL- Ghazoly
 
DOC
Paresh_Pandit_Resume
Paresh Pandit
 
DOC
Paresh_Pandit_Resume
Paresh Pandit
 
1NT Webinar_Simple Projects
SHIVA PRASAD
 
Reduce Oracle EBS Month End Accruals Process Time using Automated Dashboard
RapidValue
 
1. s fin overview
Renu Bhasin
 
SAP’s innovations – Are you overlooking important functionality in SAP Contro...
John Jordan
 
SAP Innovations:Are you overlooking important functionality in SAP Controlling
Alice Adams
 
Softools - Partner Pack - 17-Aug-16
DADD (Design And Digital Development)
 
Pagerinkite užsakymų įvykdymą laiku naudodami šiuolaikinius gamybos planavimo...
Columbus Lietuva
 
Paranda ettevõtte tulemusi targa tootmise planeerimise ja operatiivjuhtimisega
Columbus Eesti AS
 
Wake Up – It’s Time to Upgrade Your S/4HANA System!
panayaofficial
 
J54_S4CLD2108_BPD_EN_US.docx
ssuser13b4e6
 
Process Flow and Narrative for Agile+PPM
Glen Alleman
 
Agile planning with rational team concert
Reedy Feggins Jr
 
Pratibha Chaudhary 6 years Exp SAP ABAP
pratibha44
 
sap fico implementation project phase pd
smanjunathreddy24
 
What's New in SAP Business One 10.0
Sundae Solutions Co., Ltd.
 
Bala murali sapui5 abapcv
Bala Murali Krishna chennamsetty
 
Creating a Single Global Finance Platform at DTCC with IBM Services
IBM
 
Production Module & Report Completion Sub-Module. .pptx
Lamees EL- Ghazoly
 
Paresh_Pandit_Resume
Paresh Pandit
 
Paresh_Pandit_Resume
Paresh Pandit
 
Ad

More from Amit Kumar Senapati, PMP® (17)

PPTX
Six Sigma implementation in Projects.pptx
Amit Kumar Senapati, PMP®
 
PPTX
Starting up a project. Things to do.pptx
Amit Kumar Senapati, PMP®
 
PPTX
Project Management - 5D without a ful fledged BIM.pptx
Amit Kumar Senapati, PMP®
 
DOCX
Agile project management
Amit Kumar Senapati, PMP®
 
DOCX
Productivity practioner
Amit Kumar Senapati, PMP®
 
PDF
Cost management basics for Construction Engineers
Amit Kumar Senapati, PMP®
 
PDF
Primavera p6 advanced project planning
Amit Kumar Senapati, PMP®
 
PDF
Electrical concepts
Amit Kumar Senapati, PMP®
 
PDF
Energy saving in electrical motors and speed control
Amit Kumar Senapati, PMP®
 
PDF
Compressed air system
Amit Kumar Senapati, PMP®
 
PDF
Introduction to energy auditing
Amit Kumar Senapati, PMP®
 
PDF
Use of forward pass and backward pass in primavera
Amit Kumar Senapati, PMP®
 
PDF
Methodologies of Project Progress Measurement
Amit Kumar Senapati, PMP®
 
PDF
Energy audit tata power solar
Amit Kumar Senapati, PMP®
 
PDF
Outage planning
Amit Kumar Senapati, PMP®
 
DOCX
Earned value understanding
Amit Kumar Senapati, PMP®
 
PDF
Cover letter amit
Amit Kumar Senapati, PMP®
 
Six Sigma implementation in Projects.pptx
Amit Kumar Senapati, PMP®
 
Starting up a project. Things to do.pptx
Amit Kumar Senapati, PMP®
 
Project Management - 5D without a ful fledged BIM.pptx
Amit Kumar Senapati, PMP®
 
Agile project management
Amit Kumar Senapati, PMP®
 
Productivity practioner
Amit Kumar Senapati, PMP®
 
Cost management basics for Construction Engineers
Amit Kumar Senapati, PMP®
 
Primavera p6 advanced project planning
Amit Kumar Senapati, PMP®
 
Electrical concepts
Amit Kumar Senapati, PMP®
 
Energy saving in electrical motors and speed control
Amit Kumar Senapati, PMP®
 
Compressed air system
Amit Kumar Senapati, PMP®
 
Introduction to energy auditing
Amit Kumar Senapati, PMP®
 
Use of forward pass and backward pass in primavera
Amit Kumar Senapati, PMP®
 
Methodologies of Project Progress Measurement
Amit Kumar Senapati, PMP®
 
Energy audit tata power solar
Amit Kumar Senapati, PMP®
 
Earned value understanding
Amit Kumar Senapati, PMP®
 
Cover letter amit
Amit Kumar Senapati, PMP®
 
Ad

Recently uploaded (20)

PDF
Natural Language processing and web deigning notes
AnithaSakthivel3
 
PDF
Natural Language processing and web deigning notes
AnithaSakthivel3
 
PDF
MRI Tool Kit E2I0500BC Plus Presentation
Ing. Ph. J. Daum GmbH & Co. KG
 
PPT
Hazard identification and risk assessment PPT
SUNILARORA51
 
PDF
A presentation on the Urban Heat Island Effect
studyfor7hrs
 
PPTX
ENG8 Q1, WEEK 4.pptxoooiioooooooooooooooooooooooooo
chubbychubz1
 
PPTX
UNIT III CONTROL OF PARTICULATE CONTAMINANTS
sundharamm
 
PDF
Geothermal Heat Pump ppt-SHRESTH S KOKNE
SHRESTHKOKNE
 
PPTX
GitHub_Copilot_Basics...........................pptx
ssusera13041
 
PPTX
Dolphin_Conservation_AI_txhasvssbxbanvgdghng
jeeaspirant2026fr
 
PDF
POWER PLANT ENGINEERING (R17A0326).pdf..
haneefachosa123
 
PPTX
00-ClimateChangeImpactCIAProcess_PPTon23.12.2024-ByDr.VijayanGurumurthyIyer1....
praz3
 
PPTX
Cyclic_Redundancy_Check_Presentation.pptx
alhjranyblalhmwdbdal
 
PDF
July 2025 - Top 10 Read Articles in Network Security & Its Applications.pdf
IJNSA Journal
 
PPTX
Presentation on Foundation Design for Civil Engineers.pptx
KamalKhan563106
 
PDF
LEARNING CROSS-LINGUAL WORD EMBEDDINGS WITH UNIVERSAL CONCEPTS
kjim477n
 
PPT
Oxygen Co2 Transport in the Lungs(Exchange og gases)
SUNDERLINSHIBUD
 
PPT
IISM Presentation.ppt Construction safety
lovingrkn
 
PDF
mosfet introduction engg topic for students.pdf
trsureshkumardata
 
PPTX
Sensor IC System Design Using COMSOL Multiphysics 2025-July.pptx
James D.B. Wang, PhD
 
Natural Language processing and web deigning notes
AnithaSakthivel3
 
Natural Language processing and web deigning notes
AnithaSakthivel3
 
MRI Tool Kit E2I0500BC Plus Presentation
Ing. Ph. J. Daum GmbH & Co. KG
 
Hazard identification and risk assessment PPT
SUNILARORA51
 
A presentation on the Urban Heat Island Effect
studyfor7hrs
 
ENG8 Q1, WEEK 4.pptxoooiioooooooooooooooooooooooooo
chubbychubz1
 
UNIT III CONTROL OF PARTICULATE CONTAMINANTS
sundharamm
 
Geothermal Heat Pump ppt-SHRESTH S KOKNE
SHRESTHKOKNE
 
GitHub_Copilot_Basics...........................pptx
ssusera13041
 
Dolphin_Conservation_AI_txhasvssbxbanvgdghng
jeeaspirant2026fr
 
POWER PLANT ENGINEERING (R17A0326).pdf..
haneefachosa123
 
00-ClimateChangeImpactCIAProcess_PPTon23.12.2024-ByDr.VijayanGurumurthyIyer1....
praz3
 
Cyclic_Redundancy_Check_Presentation.pptx
alhjranyblalhmwdbdal
 
July 2025 - Top 10 Read Articles in Network Security & Its Applications.pdf
IJNSA Journal
 
Presentation on Foundation Design for Civil Engineers.pptx
KamalKhan563106
 
LEARNING CROSS-LINGUAL WORD EMBEDDINGS WITH UNIVERSAL CONCEPTS
kjim477n
 
Oxygen Co2 Transport in the Lungs(Exchange og gases)
SUNDERLINSHIBUD
 
IISM Presentation.ppt Construction safety
lovingrkn
 
mosfet introduction engg topic for students.pdf
trsureshkumardata
 
Sensor IC System Design Using COMSOL Multiphysics 2025-July.pptx
James D.B. Wang, PhD
 

Dashboard reporting

  • 1. AMIT KUMAR SENAPATI PMP® DASHBORAD REPORTING USING BI
  • 2. ORACLE BUSINESS INTELLIGENCE: DASHBOARD REPORTING 2 | P a g e AMIT KUMAR SENAPATI PMP® INDEX Serial Number Particulars Page Number 1 Oracle BI : Introduction 3 2 Benefits of using BI for Dashboard Reporting 3 3 Challenges of using BI 3 4 System Architecture 4 5 Current tabs in Consideration 4 6 Filters 4 7 Overview Tab 5 8 Schedule Tab 9 9 Milestone Tab 9 10 Earned Value Tab 10 11 CPI/SPI tab 11 12 Conclusion 11
  • 3. ORACLE BUSINESS INTELLIGENCE: DASHBOARD REPORTING 3 | P a g e AMIT KUMAR SENAPATI PMP® 1. What is Oracle Business Intelligence (BI)? Oracle Business Intelligence (BI) is a portfolio of technology and applications that provides the industry's first integrated, end-to-end Enterprise Performance Management System, including BI foundation and tools - integrated array of query, reporting, analysis, alerting, mobile analytics, data integration and management, and desktop integration - as well as category-leading financial performance management applications, operational BI applications, and data warehousing. 2. Benefits of using Business Intelligence(BI) for Dashboard Reporting • Automating the dashboard reports will enable the planner to save time as there will be no need for manual capturing and it will be easily accessible by authorized users. • Efficient resource utilization by managing resource overloading and addressing resource constraint for critical projects. • Verified and reliable information since there would be less human interface. • Having the dashboard report stored on the central repository will enable the department to decrease the progress review time as the report is readily accessible to the team. • Standardization – The dashboard will be standardized throughout plant engineering. 3. Challenges of using BI • Lot of entry needs to be done onto the Planning Tool. • Every individual using the system , should have a good understanding on its working. • Allocation of complex formulas is difficult. • Dependent on client server for producing reports. • Any changes to the reporting require IT support. • Some of the resources that are not available on the system needs to be added. • The Project ID needs to be aligned with the SAP name. • Remote Connectivity.
  • 4. ORACLE BUSINESS INTELLIGENCE: DASHBOARD REPORTING 4 | P a g e AMIT KUMAR SENAPATI PMP® 4. System Architecture 5. Current Tabs in consideration for project Engineering Dashboard Reporting • Overview • Schedule • Milestone • Resource • Earned Value • CPI/SPI • Risk 6. The filter selections taken into consideration is
  • 5. ORACLE BUSINESS INTELLIGENCE: DASHBOARD REPORTING 5 | P a g e AMIT KUMAR SENAPATI PMP® 7. Overview Tab 7.1 Views by Project Phase 7.2 Views by Business Unit 7.3 Views by Operating Unit
  • 6. ORACLE BUSINESS INTELLIGENCE: DASHBOARD REPORTING 6 | P a g e AMIT KUMAR SENAPATI PMP® 7.4 The selection of various views is based upon allotment of Project and activity codes to the Project. In the above figure we see the various Project Codes assigned to the projects. Project Phase AA_Eskom_Project_Phase Project Status AA_Project_Status Eskom Business Unit AA_EskomBusUnit Project Priority AA_ProjPriority Project Engineering Manager AA_PEM Client Operating Unit AA_Client_Operating_Unit(OU) Client Division AA_Client_Division Client Business Unit AA_Client_Business_Unit(BU) Planner AA_Planner_Names 7.4.1 Assignment of Project Engineering Manager and Planner to the Project
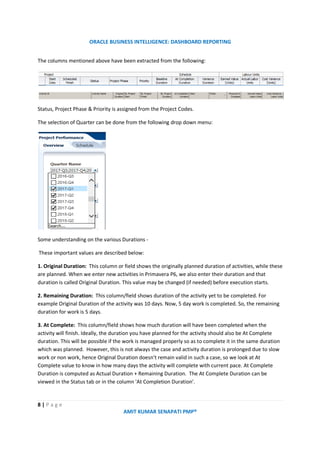
  • 7. ORACLE BUSINESS INTELLIGENCE: DASHBOARD REPORTING 7 | P a g e AMIT KUMAR SENAPATI PMP® 7.5 Portfolio to Project Level The Portfolio level dashboard can be checked from the below table. To check on the performance of the individual projects, team needs to select the option.
  • 8. ORACLE BUSINESS INTELLIGENCE: DASHBOARD REPORTING 8 | P a g e AMIT KUMAR SENAPATI PMP® The columns mentioned above have been extracted from the following: Status, Project Phase & Priority is assigned from the Project Codes. The selection of Quarter can be done from the following drop down menu: Some understanding on the various Durations - These important values are described below: 1. Original Duration: This column or field shows the originally planned duration of activities, while these are planned. When we enter new activities in Primavera P6, we also enter their duration and that duration is called Original Duration. This value may be changed (if needed) before execution starts. 2. Remaining Duration: This column/field shows duration of the activity yet to be completed. For example Original Duration of the activity was 10 days. Now, 5 day work is completed. So, the remaining duration for work is 5 days. 3. At Complete: This column/field shows how much duration will have been completed when the activity will finish. Ideally, the duration you have planned for the activity should also be At Complete duration. This will be possible if the work is managed properly so as to complete it in the same duration which was planned. However, this is not always the case and activity duration is prolonged due to slow work or non work, hence Original Duration doesn't remain valid in such a case, so we look at At Complete value to know in how many days the activity will complete with current pace. At Complete Duration is computed as Actual Duration + Remaining Duration. The At Complete Duration can be viewed in the Status tab or in the column 'At Completion Duration'.
  • 9. ORACLE BUSINESS INTELLIGENCE: DASHBOARD REPORTING 9 | P a g e AMIT KUMAR SENAPATI PMP® 8. Schedule Tab The schedule tab shows the details for every Portfolio: 9. Milestone Tab The Milestone Tab indicates the performance of the milestone against the baseline date. It also provides us an indication on the number of Milestones achieved and the targets missed.
  • 10. ORACLE BUSINESS INTELLIGENCE: DASHBOARD REPORTING 10 | P a g e AMIT KUMAR SENAPATI PMP® 10. Earned Value Tab The Earned Value Tab provides us the details of performance at Portfolio level. To check the performance of individual projects team needs to select the project for which he is interested to see the Earned Value report. The Project level Earned value report is displayed below:
  • 11. ORACLE BUSINESS INTELLIGENCE: DASHBOARD REPORTING 11 | P a g e AMIT KUMAR SENAPATI PMP® 11. CPI/SPI Tab The CPI/SPI tab provides the CPI/SPI result of all the projects. Here we can also check the Planned and Earned value cost. 12. Conclusion If used Dashboard Reporting will tremendously reduce report development time and will provide real time statistics of the health of the project. It will also motivate the planners to streamline their deliverables on time and as per standards.