Statistical Methods for Data Analysis (Only Theory), Meaning of Interpretation, Technique of Interpretation, Significance of Report Writing, Steps, Layout of Research Report, Types of Research Reports, Precautions while writing research reports
career development- definitions, characteristics, objectives, theories of career development, importance of career development, principles of career development, stages of career development, factors affecting career development,
The document discusses various statistical analysis methods and their purposes. It defines descriptive statistics as methods used to describe characteristics of a population or sample, such as measures of central tendency, dispersion, location, and distribution. Inferential statistics draw inferences from samples to make generalizations about populations. The document outlines specific descriptive and inferential statistical tests for both parametric and nonparametric data, and explains that the appropriate statistical method depends on the research problem and level of measurement used in a study.
A project report on consumer preference towards organized and unorganized ret...Projects Kart
This document provides an overview of a project report on consumer preferences toward organized and unorganized retail stores in India. It acknowledges those who helped with the project and provides an executive summary of the report's contents. The report will examine retail in India, profiles of major retail companies like Reliance and Raheja, research objectives and methodology, data analysis, findings and suggestions. It defines what retail is and the major forms it takes in commerce.
Emerging and reemerging infectious diseasesarijitkundu88
Various emerging and reemerging diseases. Factors contributing to the emergence of infectious diseases. Antibiotic resistance. The global response to control them. Laboratories network in surveillance.
SPSS is a popular statistical software package that allows users to perform complex data analysis with simple instructions. It requires variables, data, measurement scales, and a code book to be defined. The document then describes different variable types (independent, dependent), measurement scales (nominal, ordinal, interval, ratio), how to start and use SPSS, and basic functions for data entry, analysis including frequencies, descriptives, correlation, and reliability which can be measured using Cronbach's alpha.
This document discusses principles and methods of research data interpretation. It describes how data is organized, analyzed, and interpreted to draw meaningful inferences. Specifically, it outlines various methods of data interpretation including direct observation, tables, graphs, numerical/statistical methods, and mathematical modeling. It emphasizes that interpretation establishes relationships within data and relates results to existing knowledge to further research. Proper interpretation requires avoiding biases and false generalizations.
The document provides guidance on preparing and presenting a research report. It discusses that a research report communicates the purpose, scope, objectives, methodology, findings, limitations and recommendations of a research project. It should convince the client that the findings can benefit them. The document outlines the typical sections of a research report including the executive summary, introduction, methodology, results, conclusions and recommendations. It emphasizes that a report must be well-organized, easy to follow and written objectively to accurately present the research.
The document outlines the steps and format for preparing a research report. It discusses that a research report involves several steps like logical analysis of the subject matter, preparing outlines and drafts, and rewriting. The main sections of a research report include an introduction, literature review, methodology, results, discussion, and conclusion. A research report should be objective, concise, and written in simple language. It should disseminate findings, examine the validity of conclusions, and inspire further research. The goal is to effectively communicate the research work to others.
A research report is a condensed form of a brief description of research work done by the researcher. It involves several steps to present the report in the form of a thesis or dissertation. The purpose of a research report is to present at conferences, publish in journals or articles, and obtain grants or financial aid. It can also have implications or recommendations for clinical practice, education, and administration. A research report should be concise, clear, honest, and complete while maintaining accuracy. It must also show originality and provide ready availability of findings.
This document discusses computer assisted qualitative data analysis software (CAQDAS). It defines CAQDAS as software packages that help organize and archive qualitative text data for administration and archiving rather than analysis. Some examples of CAQDAS packages include Atlas-ti, Winmax, Nvivo, NUDIST, and Ethnograph. The document outlines the nature of qualitative data as largely unstructured and text-based, and lists ways that computers can be used to assist with statistical analysis and the qualitative research process, including transcription, coding, retrieval, linking, and reporting of data. It notes advantages like efficiency and supporting larger sample sizes or teams, but also limitations such as time constraints, potential to hinder creativity, and challenges of
This document discusses the process of formulating hypotheses. It begins by defining hypothesis formulation as creating possible tentative explanations for a given set of information or research. It then outlines the two contexts in which hypotheses are formulated - the context of discovery, where hypotheses emerge from prior research, and the context of justification, where researchers communicate their hypotheses. The document proceeds to list the six steps in formulating a hypothesis: 1) understanding the problem area, 2) considering the goal, 3) identifying variables, 4) identifying relationships between variables, 5) critically thinking about the hypothesis, and 6) expressing the idea as a hypothesis. Finally, it notes that properly formulating hypotheses can be difficult.
RESEARCH METHODOLOGY- PROCESSING OF DATAjeni jerry
This document discusses research methodology and the processing of data. It outlines important steps in preparing raw data for analysis, including questionnaire checking, editing, coding, classification, tabulation, and graphical representation. The document also covers data cleaning and adjusting to ensure consistency and handle missing values, improving the quality of analysis. Proper data preparation through these steps is necessary to obtain reliable results from the analysis.
Research Report is an oral presentation or written statement of research results, strategic recommendations, and/or other conclusions to a specific audience
The document outlines the key criteria for good research including:
1) Clearly stating the research aim and using common concepts
2) Adequately describing the research procedures to allow for replication
3) Carefully planning the research design to obtain objective results
It also describes the key qualities of good research as being systematic, following a specified sequence of steps; logical, guided by rules of reasoning; and empirical, dealing with concrete data to allow external validation of results.
Data processing involves 5 key steps: editing data, coding data, classifying data, tabulating data, and creating data diagrams. It transforms raw collected data into a usable format through these steps of cleaning, organizing, and analyzing the data. First, data is collected from sources and prepared by cleaning errors. It is then inputted and processed using algorithms before being output and interpreted in readable formats. Finally, the processed data is stored for future use and reports.
This document provides an overview of interpretation and report writing in research methodology. It discusses the meaning, objectives, importance, and process of interpretation. Key techniques of interpretation include explanations, consideration of extraneous information, guidance from experts, and focusing on relevant factors. The document also examines the meaning, objectives, structure, steps, and precautions of report writing. It outlines the typical sections of a report, including the title page, table of contents, methodology, results, discussion, conclusions, and references.
This document provides guidance on writing a research report. It discusses the significance of report writing, outlines the key steps in the process which include logical analysis, preparing an outline and rough draft, and rewriting. It also describes the typical layout of a research report, which includes preliminary pages, the main text with sections on introduction, findings, results, implications and summary, and end materials like appendices and bibliography. The main text aims to communicate research findings and solve problems by presenting details in a clear, objective and concise manner.
Anybody, who is reading the research report, must necessarily be conveyed enough about the study so that he can place it in its general scientific context, judge the adequacy of its methods and thus form an opinion of how seriously the findings are to be taken. For this purpose there is the need of proper layout of the report. The layout of the report means as to what the research report should contain. A comprehensive layout of the research report should comprise preliminary pages, the main text and the end matter.
This document discusses various aspects of data analysis. It outlines the basic steps in research and data analysis, including identifying the problem, collecting data, analyzing and interpreting results. Both qualitative and quantitative data analysis methods are covered. Descriptive statistics are used to summarize data through measures like frequencies and central tendency. Inferential statistics allow generalization to populations through hypothesis testing using techniques like t-tests and chi-square tests. The document provides an overview of common statistical analysis methods and selecting the appropriate tests.
1. The document discusses various steps involved in data processing such as editing, coding, tabulation and cross-tabulation.
2. Editing involves detecting and correcting errors in raw data to ensure accuracy, completeness, consistency and uniformity. Coding assigns numerical codes to questionnaire responses to simplify analysis.
3. Tabulation organizes data into tables or lists to facilitate analysis and comparison. It can be univariate, tabulating one variable, or bivariate/multivariate, tabulating relationships between two or more variables.
4. Cross-tabulation summarizes the relationship between two or more categorical variables by classifying data into a contingency table. It provides a basic understanding of how variables are interrelated.
This document discusses inferential statistics, which uses sample data to make inferences about populations. It explains that inferential statistics is based on probability and aims to determine if observed differences between groups are dependable or due to chance. The key purposes of inferential statistics are estimating population parameters from samples and testing hypotheses. It discusses important concepts like sampling distributions, confidence intervals, null hypotheses, levels of significance, type I and type II errors, and choosing appropriate statistical tests.
A research report outlines a systematic investigation by describing the processes, data, and findings. It serves as an objective first-hand account of the research process. A well-written research report should provide all the necessary information about the core areas of the research in a clear and concise manner, including findings, recommendations, and other important details. It summarizes the overall research process.
This document provides an outline and guidelines for writing a research report. It begins with an introduction to research and defining what constitutes a research report. It then discusses the purpose and importance of research reports, as well as characteristics of effective reports. The document outlines the typical structure of a research report, including sections such as the introduction, literature review, methodology, results, discussion, and conclusions. It provides tips for each section and guidelines on style, formatting, and referencing. The overall document serves as a comprehensive guide for writing research reports.
This document discusses the processes of data analysis and data processing. It defines data analysis as discovering useful information through inspecting, cleansing, transforming and modeling data, while data processing refers to rearranging data that has already been analyzed. The key steps in data processing are: 1) identifying data structures, 2) editing data for completeness and accuracy, 3) coding data numerically or alphabetically, 4) classifying data into groups, 5) transcribing data manually or via computer, 6) tabulating data into frequency distributions, contingency tables or other table types, and 7) summarizing data using manual or computerized data sheets, compilation sheets, matrices, figures or tables.
Ethical standards are important in research for several reasons. They promote truthful and accurate research by prohibiting falsification of data. They also promote collaboration through values like trust and accountability. Ethical standards ensure researchers are accountable to the public since they are often publicly funded. Following ethics helps build public support and trust in research. Areas of unethical conduct include plagiarism, fabrication, failing to publish results, faulty methods, and improper authorship. Researchers have a duty to protect subjects' rights, obtain informed consent, and conduct legal and responsible research.
This document discusses primary and secondary data sources. It defines primary data as original data collected directly for the research project, while secondary data is data collected previously for another purpose. The document outlines advantages and disadvantages of both primary and secondary data. Primary data is more accurate but costly and time-consuming to collect, while secondary data is quicker and cheaper to obtain but may not be suitable or accurate for the research purpose. The document also categorizes different types of secondary data sources such as internal company data, published materials, computer databases, and syndicated services that collect standardized data from consumers or institutions.
This document discusses quantitative and qualitative data analysis. It defines key terms like analysis, hypothesis, descriptive statistics, inferential statistics, and parametric and nonparametric tests. It explains the steps of quantitative data analysis which include data preparation, describing the data through summary statistics, drawing inferences through inferential statistics, and interpreting the results. Common parametric tests include t-tests, ANOVA, and correlation. Common nonparametric tests include chi-square, median, Mann-Whitney, and Wilcoxon tests. The document emphasizes accurate presentation of analyzed data through narratives and tables.
Data Presentation & Analysis Meaning, Stages of data analysis, Quantitative & Qualitative data analysis methods, Descriptive & inferential methods of data analysis
The document discusses various methods for analyzing and interpreting data. It describes descriptive analysis which helps summarize data patterns. Statistical analysis techniques like clustering, regression, and cohorts are explained. Inferential analysis makes judgments about differences between groups. Qualitative and quantitative methods are outlined for interpreting data through coding and establishing relationships. The purpose of data analysis and interpretation is to answer research questions and determine trends to support decision making.
The document discusses data analysis and interpretation. It describes the different scales of measurement used in data analysis including nominal, ordinal, interval, and ratio scales. It also discusses various methods used for interpreting qualitative and quantitative data, such as using statistical techniques like mean and standard deviation for quantitative data. Finally, it covers different visualization techniques used in data interpretation like bar graphs, pie charts, tables, and line graphs.
ANALYSIS ANDINTERPRETATION OF DATA Analysis and Interpr.docxcullenrjzsme
ANALYSIS AND
INTERPRETATION
OF DATA
Analysis and Interpretation of Data
https://my.visme.co/render/1454658672/www.erau.edu
Slide 1 Transcript
In a qualitative design, the information gathered and studied often is nominal or narrative in form. Finding trends, patterns, and relationships is discovered inductively and upon
reflection. Some describe this as an intuitive process. In Module 4, qualitative research designs were explained along with the process of how information gained shape the inquiry as it
progresses. For the most part, qualitative designs do not use numerical data, unless a mixed approach is adopted. So, in this module the focus is on how numerical data collected in either
a qualitative mixed design or a quantitative research design are evaluated. In quantitative studies, typically there is a hypothesis or particular research question. Measures used to assess
the value of the hypothesis involve numerical data, usually organized in sets and analyzed using various statistical approaches. Which statistical applications are appropriate for the data of
interest will be the focus for this module.
Data and Statistics
Match the data with an
appropriate statistic
Approaches based on data
characteristics
Collected for single or multiple
groups
Involve continuous or discrete
variables
Data are nominal, ordinal,
interval, or ratio
Normal or non-normal distribution
Statistics serve two
functions
Descriptive: Describe what
data look like
Inferential: Use samples
to estimate population
characteristics
Slide 3 Transcript
There are, of course, far too many statistical concepts to consider than time allows for us here. So, we will limit ourselves to just a few basic ones and a brief overview of the more
common applications in use. It is vitally important to select the proper statistical tool for analysis, otherwise, interpretation of the data is incomplete or inaccurate. Since different
statistics are suitable for different kinds of data, we can begin sorting out which approach to use by considering four characteristics:
1. Have data been collected for a single group or multiple groups
2. Do the data involve continuous or discrete variables
3. Are the data nominal, ordinal, interval, or ratio, and
4. Do the data represent a normal or non-normal distribution.
We will address each of these approaches in the slides that follow. Statistics can serve two main functions – one is to describe what the data look like, which is called descriptive statistics.
The other is known as inferential statistics which typically uses a small sample to estimate characteristics of the larger population. Let’s begin with descriptive statistics and the measures
of central tendency.
Descriptive Statistics and Central Measures
Descriptive statistics
organize and present data
Mode
The number occurring most
frequently; nominal data
Quickest or rough estimate
Most typical value
Measures of central
tendenc.
Data analysis is the process of systematically applying statistical and logical techniques to describe, illustrate, condense, recap, and evaluate data. It involves inspecting, cleaning, transforming, and modeling data with the goal of discovering useful information, drawing conclusions, and supporting decision-making.
Key steps in data analysis include:
Data Collection: Gathering raw data from various sources such as surveys, experiments, databases, or logs.
Data Cleaning: Identifying and correcting errors and inconsistencies in the data to ensure its accuracy and completeness. This may involve handling missing values, removing duplicates, and correcting data entry errors.
Data Exploration: Using descriptive statistics and visualization techniques to understand the basic features of the data. This step helps to identify patterns, trends, and outliers.
Data Transformation: Modifying the data into a suitable format for analysis. This can include normalization, aggregation, and creating new variables.
Data Modeling: Applying statistical models and algorithms to analyze the data. This step can involve regression analysis, classification, clustering, and other machine learning techniques.
Data Interpretation: Interpreting the results of the analysis to derive meaningful insights. This involves understanding the implications of the findings and how they relate to the original objectives.
Data Presentation: Communicating the results of the analysis through reports, dashboards, or visualizations to stakeholders. This helps in making informed decisions based on the data.
Data analysis is widely used in various fields such as business, science, engineering, and social sciences to inform decisions, predict outcomes, and optimize processes.
Type of Data Analysis
Data analysis can be classified into several types, each serving different purposes and employing various techniques. Here are the primary types of data analysis:
Descriptive Analysis:
1. Purpose: To summarize and describe the main features of a dataset.
2. Techniques: Measures of central tendency (mean, median, mode), measures of variability (range, variance, standard deviation), frequency distributions, and graphical representations (bar charts, histograms, pie charts).
Exploratory Analysis:
1. Purpose: To explore the data and find patterns, relationships, or anomalies without having a specific hypothesis in mind.
2. Techniques: Data visualization (scatter plots, box plots, heat maps), correlation analysis, principal component analysis (PCA).
Inferential Analysis:
1. Purpose: To make inferences about a population based on a sample of data, often involving hypothesis testing.
2. Techniques: Confidence intervals, hypothesis tests (t-tests, chi-square tests, ANOVA), regression analysis.
This document provides an introduction to statistics for data science. It discusses why statistics are important for processing and analyzing data to find meaningful trends and insights. Descriptive statistics are used to summarize data through measures like mean, median, and mode for central tendency, and range, variance, and standard deviation for variability. Inferential statistics make inferences about populations based on samples through hypothesis testing and other techniques like t-tests and regression. The document outlines the basic terminology, types, and steps of statistical analysis for data science.
The document discusses processing and analyzing data. It explains that data must be processed after collection by editing, coding, classifying, and tabulating it to prepare it for analysis. It then describes various methods of qualitative and quantitative data analysis, including content analysis, narrative analysis, and hypothesis testing. Finally, it discusses measures used to analyze data, such as central tendency (mean, median, mode), measures of dispersion (range, variance, standard deviation), and skewness.
Descriptive analysis and descriptive analytics involve examining and summarizing data using techniques like charts, graphs, and narratives to identify patterns. Common visualization tools include pie charts, bar charts, histograms, and more. Tableau, Excel, and Datawrapper are popular tools that allow users to import data and generate various visualizations. Queries allow users to sort, filter, and extract specific information from large datasets using clauses like ORDER BY and WHERE. Hypothesis testing uses the null and alternative hypotheses to determine if experimental results are statistically significant or due to chance. Analysis of variance (ANOVA) specifically tests hypotheses by comparing means across independent groups.
This document provides an overview of data analysis and graphical representation. It discusses data analytics, statistics, quantitative and qualitative data, different types of graphical representations including line graphs, bar graphs and histograms. It also covers sampling design, types of sampling including probability and non-probability sampling, and measures of central tendency such as mean, median and mode.
This document outlines the process of data analysis, which involves collecting, processing, cleaning, analyzing, and communicating data. The goal is to discover useful information and patterns in the data. Data analysis consists of several iterative phases: specifying data requirements, collecting data, processing and organizing data, cleaning data, analyzing data through various statistical techniques, and communicating the results. Findings are presented objectively using descriptive statistics and tables/figures. The findings, their meaning, how reliability/validity were maintained, and comparisons to previous studies are discussed. Conclusions address if the study problem/purpose were achieved. Implications and recommendations for further research are also provided.
There are two types of data: primary and secondary. Primary data is collected directly by the researcher through methods like questionnaires, observations, interviews, and surveys. Secondary data is previously collected data from sources like government publications, journals, and reports.
Data collection methods for primary data include questionnaires, observations made without controlling the situation, interviews between a researcher and participant, and surveys administered through enumerators. Secondary data comes from published sources like government documents and unpublished sources from individuals and organizations.
After collection, data must be processed which includes editing, coding, classification, and tabulation to organize it for analysis. Different types of analysis are then used like descriptive, correlation, multivariate, and inferential analysis. Hypotheses are
Meaning of Service; Characteristics of Services; Classification of Services; Marketing mix of services; Customer involvement in services; Building customer loyalty; GAP model; Balancing demand & capacity.
Meaning and Elements – Classification of products; product life cycle, new product development process; branding, packaging; Pricing: Objectives, factors influencing pricing policy; types of pricing methods, Distribution: definition; need; types of marketing channels, factors affecting channels;; Promotion: Nature and importance of promotion; promotion mix; advertising; sales promotion; public relation; direct selling and publicity.
Definition; Nature; Scope and Importance of marketing; Approaches to the study of marketing; Functions of marketing, Market Segmentation: Meaning; Importance; Bases of Segmentation; Market Targeting; Types of targeting; Market Positioning; Strategies for positioning, Recent trends in Marketing
This document provides an introduction and overview of spreadsheets and Microsoft Excel. It defines what a spreadsheet is, outlines key features and elements of Excel including cells, worksheets, formatting, formulas, functions, charts and pivot tables. It also describes various data analysis tools in Excel like sorting, filtering, conditional formatting, and how to perform tasks like what-if analysis using goal seek and scenario manager. The document is intended as a reference for using spreadsheets, especially Microsoft Excel, in a business context.
Introduction to Data and Information, database, types of database models, Introduction to DBMS, Difference between file management systems and DBMS, advantages & disadvantages of DBMS, Data warehousing, Data mining, Applications of DBMS, Introduction to MS Access, Create Database, Create Table, Adding Data, Forms in MS Access, Reports in MS Access.
Transaction Processing Systems (TPS), Management Information System (MIS), Decision Support Systems (DSS), Group Decision Support System (GDSS), Executive Information System (EIS), Expert System (ES) – features, process, advantages & disadvantages, role of these systems in decision making process.
The document discusses the importance of information systems in decision making and strategy building for organizations. It defines information and information technology, and describes the difference between information systems and information technology. An information system is comprised of various components including hardware, software, data, people, and processes. Information systems help management make informed decisions, improve communication and business processes, and develop effective strategies. Managers play an important role in overseeing information systems and ensuring they meet the needs of the organization.
This document provides an introduction to data mining concepts including definitions, tasks, challenges, and techniques. It discusses data mining definitions, the data mining process including data preprocessing steps like cleaning, integration, transformation and reduction. It also covers common data mining tasks like classification, clustering, association rule mining and the Apriori algorithm. Overall, the document serves as a high-level overview of key data mining concepts and methods.
Data Warehouse – Introduction, characteristics, architecture, scheme and modelling, Differences between operational database systems and data warehouse.
Nature and purpose of organization, principles of organization, types of organization, formal and informal organization, types of organization structure, departmentation, importance and bases of departmentaion, committees, meaning and types, centralization vs decentralization of authority and responsibility, span of control, MBO and MBE (meaning only), nature and importance of staffing, process of recruitment & selection (in brief)
Meaning and nature of directing, leadership styles, motivation, meaning and importance, Communication, meaning and importance, co-ordination, meaning and importance and techniques of co-ordination, control, meaning, features, importance and steps in control process, essentials of a sound control system, methods of establishing control (in brief).
General features of computer – Evolution of computers; Computer Applications – Data Processing – Information Processing – Commercial – Office Automation – Industry and Engineering – Healthcare – Education – Disruptive technologies.
Introduction, Meaning, Nature, Characteristics of Management, Scope and Functional areas of management, Management as a science or art or profession, management & administration, Henry Fayol’s Principles of Management.
As of Mid to April Ending, I am building a new Reiki-Yoga Series. No worries, they are free workshops. So far, I have 3 presentations so its a gradual process. If interested visit: https://www.slideshare.net/YogaPrincess
https://ldmchapels.weebly.com
Blessings and Happy Spring. We are hitting Mid Season.
CBSE - Grade 8 - Science - Chemistry - Metals and Non Metals - WorksheetSritoma Majumder
Introduction
All the materials around us are made up of elements. These elements can be broadly divided into two major groups:
Metals
Non-Metals
Each group has its own unique physical and chemical properties. Let's understand them one by one.
Physical Properties
1. Appearance
Metals: Shiny (lustrous). Example: gold, silver, copper.
Non-metals: Dull appearance (except iodine, which is shiny).
2. Hardness
Metals: Generally hard. Example: iron.
Non-metals: Usually soft (except diamond, a form of carbon, which is very hard).
3. State
Metals: Mostly solids at room temperature (except mercury, which is a liquid).
Non-metals: Can be solids, liquids, or gases. Example: oxygen (gas), bromine (liquid), sulphur (solid).
4. Malleability
Metals: Can be hammered into thin sheets (malleable).
Non-metals: Not malleable. They break when hammered (brittle).
5. Ductility
Metals: Can be drawn into wires (ductile).
Non-metals: Not ductile.
6. Conductivity
Metals: Good conductors of heat and electricity.
Non-metals: Poor conductors (except graphite, which is a good conductor).
7. Sonorous Nature
Metals: Produce a ringing sound when struck.
Non-metals: Do not produce sound.
Chemical Properties
1. Reaction with Oxygen
Metals react with oxygen to form metal oxides.
These metal oxides are usually basic.
Non-metals react with oxygen to form non-metallic oxides.
These oxides are usually acidic.
2. Reaction with Water
Metals:
Some react vigorously (e.g., sodium).
Some react slowly (e.g., iron).
Some do not react at all (e.g., gold, silver).
Non-metals: Generally do not react with water.
3. Reaction with Acids
Metals react with acids to produce salt and hydrogen gas.
Non-metals: Do not react with acids.
4. Reaction with Bases
Some non-metals react with bases to form salts, but this is rare.
Metals generally do not react with bases directly (except amphoteric metals like aluminum and zinc).
Displacement Reaction
More reactive metals can displace less reactive metals from their salt solutions.
Uses of Metals
Iron: Making machines, tools, and buildings.
Aluminum: Used in aircraft, utensils.
Copper: Electrical wires.
Gold and Silver: Jewelry.
Zinc: Coating iron to prevent rusting (galvanization).
Uses of Non-Metals
Oxygen: Breathing.
Nitrogen: Fertilizers.
Chlorine: Water purification.
Carbon: Fuel (coal), steel-making (coke).
Iodine: Medicines.
Alloys
An alloy is a mixture of metals or a metal with a non-metal.
Alloys have improved properties like strength, resistance to rusting.
The ever evoilving world of science /7th class science curiosity /samyans aca...Sandeep Swamy
The Ever-Evolving World of
Science
Welcome to Grade 7 Science4not just a textbook with facts, but an invitation to
question, experiment, and explore the beautiful world we live in. From tiny cells
inside a leaf to the movement of celestial bodies, from household materials to
underground water flows, this journey will challenge your thinking and expand
your knowledge.
Notice something special about this book? The page numbers follow the playful
flight of a butterfly and a soaring paper plane! Just as these objects take flight,
learning soars when curiosity leads the way. Simple observations, like paper
planes, have inspired scientific explorations throughout history.
Social Problem-Unemployment .pptx notes for Physiotherapy StudentsDrNidhiAgarwal
Unemployment is a major social problem, by which not only rural population have suffered but also urban population are suffered while they are literate having good qualification.The evil consequences like poverty, frustration, revolution
result in crimes and social disorganization. Therefore, it is
necessary that all efforts be made to have maximum.
employment facilities. The Government of India has already
announced that the question of payment of unemployment
allowance cannot be considered in India
A measles outbreak originating in West Texas has been linked to confirmed cases in New Mexico, with additional cases reported in Oklahoma and Kansas. The current case count is 817 from Texas, New Mexico, Oklahoma, and Kansas. 97 individuals have required hospitalization, and 3 deaths, 2 children in Texas and one adult in New Mexico. These fatalities mark the first measles-related deaths in the United States since 2015 and the first pediatric measles death since 2003.
The YSPH Virtual Medical Operations Center Briefs (VMOC) were created as a service-learning project by faculty and graduate students at the Yale School of Public Health in response to the 2010 Haiti Earthquake. Each year, the VMOC Briefs are produced by students enrolled in Environmental Health Science Course 581 - Public Health Emergencies: Disaster Planning and Response. These briefs compile diverse information sources – including status reports, maps, news articles, and web content– into a single, easily digestible document that can be widely shared and used interactively. Key features of this report include:
- Comprehensive Overview: Provides situation updates, maps, relevant news, and web resources.
- Accessibility: Designed for easy reading, wide distribution, and interactive use.
- Collaboration: The “unlocked" format enables other responders to share, copy, and adapt seamlessly. The students learn by doing, quickly discovering how and where to find critical information and presenting it in an easily understood manner.
CURRENT CASE COUNT: 817 (As of 05/3/2025)
• Texas: 688 (+20)(62% of these cases are in Gaines County).
• New Mexico: 67 (+1 )(92.4% of the cases are from Eddy County)
• Oklahoma: 16 (+1)
• Kansas: 46 (32% of the cases are from Gray County)
HOSPITALIZATIONS: 97 (+2)
• Texas: 89 (+2) - This is 13.02% of all TX cases.
• New Mexico: 7 - This is 10.6% of all NM cases.
• Kansas: 1 - This is 2.7% of all KS cases.
DEATHS: 3
• Texas: 2 – This is 0.31% of all cases
• New Mexico: 1 – This is 1.54% of all cases
US NATIONAL CASE COUNT: 967 (Confirmed and suspected):
INTERNATIONAL SPREAD (As of 4/2/2025)
• Mexico – 865 (+58)
‒Chihuahua, Mexico: 844 (+58) cases, 3 hospitalizations, 1 fatality
• Canada: 1531 (+270) (This reflects Ontario's Outbreak, which began 11/24)
‒Ontario, Canada – 1243 (+223) cases, 84 hospitalizations.
• Europe: 6,814
This chapter provides an in-depth overview of the viscosity of macromolecules, an essential concept in biophysics and medical sciences, especially in understanding fluid behavior like blood flow in the human body.
Key concepts covered include:
✅ Definition and Types of Viscosity: Dynamic vs. Kinematic viscosity, cohesion, and adhesion.
⚙️ Methods of Measuring Viscosity:
Rotary Viscometer
Vibrational Viscometer
Falling Object Method
Capillary Viscometer
🌡️ Factors Affecting Viscosity: Temperature, composition, flow rate.
🩺 Clinical Relevance: Impact of blood viscosity in cardiovascular health.
🌊 Fluid Dynamics: Laminar vs. turbulent flow, Reynolds number.
🔬 Extension Techniques:
Chromatography (adsorption, partition, TLC, etc.)
Electrophoresis (protein/DNA separation)
Sedimentation and Centrifugation methods.
INTRO TO STATISTICS
INTRO TO SPSS INTERFACE
CLEANING MULTIPLE CHOICE RESPONSE DATA WITH EXCEL
ANALYZING MULTIPLE CHOICE RESPONSE DATA
INTERPRETATION
Q & A SESSION
PRACTICAL HANDS-ON ACTIVITY
Geography Sem II Unit 1C Correlation of Geography with other school subjectsProfDrShaikhImran
The correlation of school subjects refers to the interconnectedness and mutual reinforcement between different academic disciplines. This concept highlights how knowledge and skills in one subject can support, enhance, or overlap with learning in another. Recognizing these correlations helps in creating a more holistic and meaningful educational experience.
Exploring Substances:
Acidic, Basic, and
Neutral
Welcome to the fascinating world of acids and bases! Join siblings Ashwin and
Keerthi as they explore the colorful world of substances at their school's
National Science Day fair. Their adventure begins with a mysterious white paper
that reveals hidden messages when sprayed with a special liquid.
In this presentation, we'll discover how different substances can be classified as
acidic, basic, or neutral. We'll explore natural indicators like litmus, red rose
extract, and turmeric that help us identify these substances through color
changes. We'll also learn about neutralization reactions and their applications in
our daily lives.
by sandeep swamy
A measles outbreak originating in West Texas has been linked to confirmed cases in New Mexico, with additional cases reported in Oklahoma and Kansas. The current case count is 795 from Texas, New Mexico, Oklahoma, and Kansas. 95 individuals have required hospitalization, and 3 deaths, 2 children in Texas and one adult in New Mexico. These fatalities mark the first measles-related deaths in the United States since 2015 and the first pediatric measles death since 2003.
The YSPH Virtual Medical Operations Center Briefs (VMOC) were created as a service-learning project by faculty and graduate students at the Yale School of Public Health in response to the 2010 Haiti Earthquake. Each year, the VMOC Briefs are produced by students enrolled in Environmental Health Science Course 581 - Public Health Emergencies: Disaster Planning and Response. These briefs compile diverse information sources – including status reports, maps, news articles, and web content– into a single, easily digestible document that can be widely shared and used interactively. Key features of this report include:
- Comprehensive Overview: Provides situation updates, maps, relevant news, and web resources.
- Accessibility: Designed for easy reading, wide distribution, and interactive use.
- Collaboration: The “unlocked" format enables other responders to share, copy, and adapt seamlessly. The students learn by doing, quickly discovering how and where to find critical information and presenting it in an easily understood manner.
K12 Tableau Tuesday - Algebra Equity and Access in Atlanta Public Schoolsdogden2
Algebra 1 is often described as a “gateway” class, a pivotal moment that can shape the rest of a student’s K–12 education. Early access is key: successfully completing Algebra 1 in middle school allows students to complete advanced math and science coursework in high school, which research shows lead to higher wages and lower rates of unemployment in adulthood.
Learn how The Atlanta Public Schools is using their data to create a more equitable enrollment in middle school Algebra classes.
2. UNIT 5: ANALYSIS AND
INTERPRETATION OF DATA AND
RESEARCH REPORTING
Statistical Methods for Data Analysis
(Only Theory), Meaning of
Interpretation, Technique of
Interpretation, Significance of
Report Writing, Steps, Layout of
Research Report, Types of Research
Reports, Precautions while writing
research reports
3. Data Analysis:
“Data Analysis is the process of ordering,
categorizing, manipulating and summarizing data to
obtain answers to research questions”.
It is usually the first step taken towards data
interpretation.
Interpretation of data is important and such needs to
be done properly.
Researchers have identified some data interpretation
methods to aid this process.
DATAANALYSIS
4. Statistical Methods:
The major statistical methods for data analysis
are –
1. Mean
2. Standard Deviation
3. Regression
4. Hypothesis testing
5. Sample Size determination
STATISTICAL METHODS FOR
DATAANALYSIS
5. 1. Mean:
The first method is used to perform the statistical analysis is
mean, which is more commonly referred to as the average.
To calculate the mean, you add up a list of numbers and then
divide that number by the items on the list.
It allows for determining the overall trend of a data set and
also benefit from the simplistic and quick calculation.
The statistical mean is coming up with the central point of
the data that’s being processed. The result is referred to as
the mean of the data provided.
Mean is used in research, academics, and sports, etc.
“An Mean or Average value is a single value within the
range of the data that is used to represent all the values in the
series”.
STATISTICAL METHODS FOR
DATAANALYSIS
6. How to find the Mean?
To find mean of your data, first add the numbers
together and divide the sum by how many numbers
are within the dataset.
(E.g.) Mean of 6, 18 and 24 would be –
i) First add the given three numbers 6 + 18 + 24 = 48.
ii) Divide the sum of three numbers by 3 = 48 / 3 = 16
Mean is 16
Note:
When your dealing with large number of data or
inaccurate distribution of data, mean doesn’t give
most accurate results in statistical analytics for a
specific decision.
7. 2. Standard Deviation (S.D):
Standard deviation is a method of statistical analysis
that measures the spread of data around the mean.
SD is used when researcher need to determine the
dispersion of data points.
• Standard deviation is extremely used in judging the
uniformity and consistency of the observations.
Lesser the S.D. more will be uniformity (less
variability) and greater the S.D. lesser the uniformity
(more variability).
“Standard deviation (SD) is the square root of the
arithmetic mean of the squared deviations of values
from their arithmetic mean. It is generally denoted by
symbol σ (read as sigma)”.
8. How to find the SD?
Formula:
σ2 = Σ(x − μ)2/n (or) σ = Sq.root [Σ(x − μ)2/n]
• σ is standard deviation
• Σ stands for the sum of the data
• x stands for the value of the dataset
• μ stands for the mean of the data
• σ2 stands for the variance
• n stands for the number of data points in the
population
(E.g.) SD for 6, 18 and 24 is 7.4833
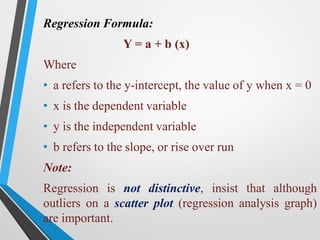
9. 3. Regression:
Regression is the relationship between a dependent variable
(the data you are looking to measure) and an independent
variable (the data used to predict the dependent variable).
It can also be explained by how one variable affects another
or changes in a variable that trigger changes in another,
basically cause and effect.
Line used in regression analysis graphs and charts signify
whether the relationships between the variables are strong or
weak.
This statistical analysis used to make predictions & forecast
trends.
“Regression analysis is defined as the technique for the
derivation of an equation by which one of the variables, the
dependent variable, may be estimate from the other variable,
the independent variable.”
10. Regression Formula:
Y = a + b (x)
Where
• a refers to the y-intercept, the value of y when x = 0
• x is the dependent variable
• y is the independent variable
• b refers to the slope, or rise over run
Note:
Regression is not distinctive, insist that although
outliers on a scatter plot (regression analysis graph)
are important.
11. 4. Hypothesis Testing:
Hypothesis testing is also known as ‘T Testing’,
which is a key to testing the two sets of random
variables within the data set.
This method is all about testing if a certain
argument or conclusion is true for the data set.
It allows for comparing the data against various
hypotheses and assumptions.
It determines some quantity under a given
assumption, which is called as null hypothesis or
hypothesis 0.
In hypothesis testing, results of test are significant to
statistics if results are proof that couldn’t happened
by random occurrence or chance.
12. Hypothesis Testing Formula:
Result of statistical hypothesis test need to be
interpreted to make specific claim, which is referred
to as p – value.
Testing of hypothesis to determine 50% chance of
being correct is –
H0: Null Hypothesis P = 0.5
H1: Alternate Hypothesis P ≠ 0.5
13. 5. Sample Size determination:
While analysing data for statistical analysis,
sometimes dataset is simple too large, making
difficult to collect accurate data for each element of
data set.
In this case, analysing a sample size or smaller size
of data, which is called sample size determination.
Right size of sample to be accurate to do correct
analysis.
To determine sample size, researcher examine
aspects like cost, time or convenience of collecting
data.
14. Some general tips when determining a Sample Size -
When considering a smaller sample size, conduct a
census.
Use sample size from a study similar to your own
study, where researcher have to look at academic
database to search for a similar study.
For generic study, there may be table that already
exists.
Use a sample size calculator.
Sometimes consider Slovin’s formula and
Cochran’s formula.
15. Simple Formula for Determination of Sample Size:
n = N / [1+N(α)2]
Where n – required no. of sample, N – total no. of
population.
α – significance level (i.e.) 0.01, 0.05 & 0.10 (99%,
95% & 90%)
(E.g.) If population size is N = 500, then sample size is
n = 500 / [1+500(0.05)2] = 222
Significance level is selected based on the accuracy of
data which is required by researcher (i.e.) 99%
means researcher needs accurate result.
16. Data Interpretation:
“Data interpretation is the process of reviewing data
through some predefined processes which will help
assign some meaning to the data and arrive at a
relevant conclusion”.
It involves taking result of data analysis, making
inferences on relations studied and using them to
conclude.
There are two methods for Data interpretation
methods –
1. Qualitative Data Interpretation Method.
2. Quantitative Data Interpretation Method.
DATA INTERPRETATION
17. 1. Qualitative Data Interpretation Method:
This method is used to analyse qualitative data,
which is also known as categorical data.
This method uses texts, rather than numbers or
patterns to describe data.
It is gathered using variety of person – to – person
techniques.
There are two main types of qualitative data, namely
nominal and ordinal data.
Both data types are interpreted using same method,
but ordinal data interpretation is easier than nominal
data.
18. 2. Quantitative Data Interpretation Method:
This method is used to analyse quantitative data, which
is also known as numerical data.
This method contains numbers and analysed with use of
numbers and not texts.
There are two main types of quantitative data, namely
discrete and continuous data.
Continuous data divided into interval data and ratio data.
The process of analysing quantitative data involves
statistical modelling techniques like mean, median &
SD.
The other interpretation processes of quantitative data are
Regression analysis, Predictive & Prescriptive analysis
and Cohort analysis.
19. Techniques of Interpretation:
Interpretation is an art that one learns through practice
and experience. The techniques of interpretation often
involves following steps:
(i) Researcher must give reasonable explanations of
the relations which he has found and he must interpret
the lines of relationship in terms of the underlying
processes and must try to find out the thread of
uniformity that lies under the surface layer of his
diversified research findings. In fact, this is the
technique of how generalization should be done and
concepts be formulated.
(ii) Extraneous information, if collected during the
study, must be considered while interpreting the final
results of research study, for it may prove to be a key
factor in understanding the problem under
consideration.
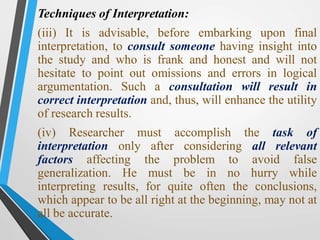
20. Techniques of Interpretation:
(iii) It is advisable, before embarking upon final
interpretation, to consult someone having insight into
the study and who is frank and honest and will not
hesitate to point out omissions and errors in logical
argumentation. Such a consultation will result in
correct interpretation and, thus, will enhance the utility
of research results.
(iv) Researcher must accomplish the task of
interpretation only after considering all relevant
factors affecting the problem to avoid false
generalization. He must be in no hurry while
interpreting results, for quite often the conclusions,
which appear to be all right at the beginning, may not at
all be accurate.
21. Precautions while writing Interpretation:
Researcher must invariably satisfy himself that -
•The data are appropriate.
•Trustworthy.
•Adequate for drawing inferences.
•The data reflect good homogeneity.
•Proper analysis has been done through
statistical methods.
•Remain cautious about the errors, which is
possible in process of interpreting results.
22. RESEARCH REPORT
Report:
“A report is a written document on a particular
topic, which conveys information and ideas and
may also make recommendations”.
“Research reporting is the oral or written
presentation of evidence and the findings in
such a way that it is readily understood and
assessed by the reader and enables him to verify
the validity of the conclusions”.
23. Characteristics (features) of good research report:
All points in report should be clear to read.
Report should be concise with necessary information
under proper headings and sub-headings.
All information should be correct & supported by
evidence.
All relevant material should be included.
Purpose of Research Report:
1. Transmission of knowledge.
2. Presentation of findings.
3. Examining the validity of the generalizations.
4. Inspiration for further research.
24. REPORTWRITING
Research Report Writing:
“Written Research Report is an
authoritative one – way communication, it imposes a special
obligation for maintaining objectivity”.
It is their degree of formality and design in proper format.
Significance of Report Writing:
It is major component of research study for research task
remains incomplete till it is presented.
It gives generalizations and findings of little value.
The purpose of research is not values until it is known to
others.
It is last part of research study & need set of skills for
writing.
It need assistance & guidance from experts. 24
25. Steps in Writing Report:
1. Logical Analysis of the subject matter:
It is the development of subject in two ways a) logically –
basis of mental connections and associations between one
thing and another by means of analysis and b)
chronologically – it is based on a connection or sequence in
time or occurrence.
2. Preparation of the final outline:
It is the framework upon which long written works are
constructed.
3. Preparation of the rough draft:
It follows logical analysis of subject and preparation of final
outline.
It include about what researcher done, procedure adopted,
methodology, analysis, limitations & suggestions regarding
the problem. 25
26. 4. Rewriting and Polishing of the rough draft:
It requires more time than writing of rough draft.
It is like careful revision and making good piece of writing.
It check the weakness of report for logical development or
presentation.
It check whether the material is required or not.
It exhibit definite pattern.
It check mechanics of writing – grammar, spelling & usage.
5. Preparation of the final bibliography:
It includes list of books in pertinent way, contains all those
research work.
It should arrange alphabetically and divide into two parts.
It includes first part (name of books and pamphlets), second
part (names of magazine and newspaper articles). 26
27. Format: (For books & pamphlets)
Name of author, last name first.
Title (in italic), place, publisher, date of publication, no.
of volumes.
(E.g.) Kothari, C.R., Quantitative Techniques, New Delhi,
Vikas Publishing House Pvt. Ltd., 1978.
For magazines & newspaper:
Name of author, last name first.
Title of article in quotation marks.
Name of periodical (underlined), volume no.
Date and page no.
(E.g.) Robert V. Roosa, “Coping with Short-term
International Money Flows”, The Banker, London,
September, 1971, p.995.
27
28. 6. Writing the final draft:
It should be in concise and objective style, simple
language.
Avoid vague expressions like “it seems”, “there may
be”.
Avoid abstract terminology and technical jargon.
Examples must be mentioned.
It should create enthusiastic among people and
maintain interest.
It should mention the attempt to solve problem and
contribution of solution for a problem.
28
29. WRITING STYLES
1. Conservative style:
It is best structural elements for essay writing.
It used to deliberate different sections of answer.
Space is utilized in paragraph (two blank line in between).
2. Key Point style:
Use of headings, underlining, margins, diagrams & tables.
It use indentation and dot points.
It include enormous amount of information.
3. Holistic style:
It aims to answer the question from thematic and
integrative perspective.
It needs strong understanding of course and to see
outcomes.
29
30. MECHANICS OF WRITING A RESEARCH
REPORT
1. Size and Physical Design:
Manuscript should be written on unruled paper 8 ½” x
11” in size.
It should be written by hand in blue or black ink.
Margin 1 or 1 ½ inches at left & right hand side, 1 inch
margin on top & bottom.
It should be neat, typed on double – spaced.
2. Procedure:
The various steps in writing report as mentioned in the
parts of a research.
3. Layout:
Proper layout should be adopted in the report. 30
31. 4. Treatment of quotations:
It should be placed in quotation marks and double spaced.
Single space at least ½ inch to right to normal text margin.
5. Footnotes:
It serve two purposes, i) identification of materials in reports,
ii) notice of materials but for supplemental value.
It is for cross references, citation of authorities & sources,
acknowledgement.
It is placed at bottom of page for identification.
It should numbered consecutively, beginning with 1 in each
chapter separately & no. should be above line.
Use asterisk (*) symbols to prevent confusion.
It is typed in single space & divided from one another by
double space.
31
32. 6. Documentation Style:
Proper style should be followed in completing the
documentation.
Some of the order followed in documentary footnotes are:
i) Regarding Single – volume reference:
Author’s name in normal order (not begin with last
name).
Title of work (italics), place & date of publication.
Pagination reference (page no).
(E.g.) John Gassner, Masters of the Drama, New York:
Dover Publications, Inc. 1954, p.315.
ii) Regarding multivolumed reference:
Author’s name in normal order.
Title of work (italics), Place & date of publication.
No. of volume & pagination references (page no).
32
33. iii) Regarding works arranged alphabetically:
This is for works arranged alphabetically such as
encyclopedias & dictionaries.
No pagination reference is needed.
(E.g.) “Salamanca”, Encyclopedia Britannica, 14th Edition.
“Mary Wollstonecraft Godwin”, Dictionary of national
biography.
iv) Regarding periodicals reference:
Name of author in normal order, title with quotation.
Name of periodical (italics), volume no., date & page no.
v) Regarding anthologies and collections reference:
It should acknowledged literary work not only by author
but also name of the collector. 33
34. vi) Regarding second – hand quotations reference:
Original author & title, quoted or cited in.
Second author work.
(E.g.) J.F. Jones, Life in Ploynesia, p.16, quoted in History
of the Pacific Ocean area, by R.B. Abel, p.191.
vii) Case of multiple authorship:
Documentation should mention with the first author
name and multiple authorship indicated by “et al.” or
“and others”.
Single page referred as p., more than one page referred
as pp.
Roman numerical is used to indicate the no. of volume.
Only for page no. 199 and following page should be
represented by ‘199f’.
34
35. 7. Punctuation and Abbreviations in footnotes:
Author’s name followed by comma.
Title of book with words, “A”, “An” should be
omitted.
Place of publication is stated in abbreviated form (i.e.)
Lond. for London, N.Y. for New York, N.D. for New
Delhi.
Name of the publisher along with copyright and date
enclosed in brackets [c 1978].
All the entry is followed by a comma.
The volume and page references separated by a
comma.
Some of the English and Latin abbreviations are
often used in bibliographies and footnotes to eliminate
tedious repetition. 35
38. 8. Use of Statistics, Charts and Graphs:
It contributes great deal of clarification & simplification of
research results.
It is presented in form of tables, charts, bars & line-graphs.
It should be neat & attractive.
9. The Final Draft:
Revising & rewriting should be done before final draft.
Sentences are clear, grammatically correct, various points fit
together.
10. Bibliography:
It should be prepared & appended to research.
11. Preparation of the Index:
It is prepared both as subject index & author index.
It gives name of subject topics or concepts along with page
no.
It should be arranged alphabetically.
38
39. WRITING REPORT CONSIDERATIONS
1. Prewriting concerns:
Before writing, it should ask –
* What is the purpose? * Who will read report?
* What are circumstances and limitations for writing?
* Do you need statistics? * How will report be used?
2. The Outline:
After completing analysis, statistical tests, it had to
develop outline.
(i.e.) I. Major Topic Heading
A. Major Subtopic heading
1. Subtopic
a. Minor subtopic and goes on…..
39
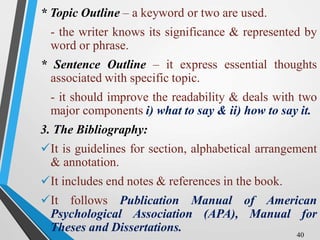
40. * Topic Outline – a keyword or two are used.
- the writer knows its significance & represented by
word or phrase.
* Sentence Outline – it express essential thoughts
associated with specific topic.
- it should improve the readability & deals with two
major components i) what to say & ii) how to say it.
3. The Bibliography:
It is guidelines for section, alphabetical arrangement
& annotation.
It includes end notes & references in the book.
It follows Publication Manual of American
Psychological Association (APA), Manual for
Theses and Dissertations. 40
41. 4. Writing the Draft:
Each writer uses different mechanisms for getting
thoughts into written form.
It translate their prose into word-processed format.
Use advanced computer packages for spelling errors,
avoiding confusion of common words, grammar,
punctuation, transported letters, style problem &
readability level.
5. Readability:
It topic is more interest, then it can obtain high
readership.
It can be measured through readability index.
(i.e.) Flesch Reading Ease score is measured between 0 &
100. If it is lower, then the material is harder to read. If
it is higher, then it is easily read & understandable.
41
42. 6. Comprehensibility:
Research writing is designed to convey information.
Choose right words to convey accurately, clearly &
efficiently.
Words & sentences should be organized & edited.
* Pace – it is the rate at which the printed page
presents information to the reader.
Some of the methods to adjust pace of writing are –
• Use ample white space, wide margins.
• Break large units of text into smaller units.
• Relieve difficult text with visual aids.
• Use exact words for the known concepts.
• Repeat and summarize critical & difficult ideas.42
43. 7. Tone:
Review the writing to ensure the tone is appropriate.
Report prepared for reader conveys sincerity,
warmth and involvement of part of author.
Remove negative phrasing & rewrite positively.
8. Final Proof:
It is helpful to draft the report before doing final
editing.
Writing flow is smoothly or not.
It is apparent to reader, findings & suggestions
adequately meet the problem and research objectives.
Tables & graphs display the proper information in
easy-to-read format.
43
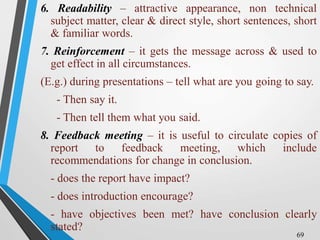
44. DOs AND DON’Ts OF REPORT
WRITING
1. Font size is not too small or too large. (11 or 12 is
good).
2. Acknowledgement is not be a separate page, it is
altogether for 1st and 2nd page.
3. Paragraphs should not be too large.
4. Figures, equations should taken from some
references.
5. Figure no should ne mentioned like Fig. 4 or Fig.
1.2 (similarly to section, equation also).
6. Cite reference (i.e.) “Threshold voltage is a strong
function of implant dose [1].” 44
45. 7. Follow standard format while writing references.
(IEEE, APA format).
8. Don’t type references entirely in capital letters.
9. Order of references must be cited one by one.
10. Each figure close to the part of text where it is referred.
11. Figures viewed together with caption.
12. Purpose of figure is to state what it is presented in
figure.
13. Resize a plot or figure to make good appearance in
report.
14. It need brief introductions and start sections, sub
sections.
15. Short report is acceptable, if it covers all the work.
45
46. 16. Don’t make one-line paragraphs.
17. Add space after full stop, comma, colon, etc.
18. Don’t use informal language, don’t use “&”.
19. Write ‘and’ instead, don’t write “there’re” for “there are”.
20. It use “list” option which gives clarity of report.
21. Don’t use bullets in report, they are acceptable in
presentation not in formal report.
22. Check grammar and punctuation are correct.
23. Do spell check before taking a print out of report.
24. Always write in simple language in order to may the
reader’s interest.
25. Report must have flow of work as per the report format.
26. Plagiarism is very serious offense. (copy of other material is
not allowed). 46
53. Prefatory parts
Title page
Letter of
transmittal
Letter of
authorization
Table of contents
Objectives
Results
Conclusions
Recommendations
Summary
53
54. Main body of the report
Introduction
Methodology
Area 1
Area 2
Final area
Results Limitations
Conclusions and
recommendations
54
56. CONTENTS (LAYOUT) OF RESEARCH
REPORT
Layout of the report should comprise –
A) Preliminary Pages
B) Main text
C) End matter.
A) Preliminary Pages:
The report should carry a title and date, followed by
acknowledgements in form of ‘Preface’ of
‘Foreword’.
It should have table of contents followed by lists of
tables and illustrations.
It should locate required information in the report.
56
57. B) Main text:
It is the complete outline of research report along with
all details.
It consists title as first page of main text and follows
other details.
It have following sections –
i) Introduction:
It is to introduce research projects to readers.
It should contain clear objectives, research background.
Brief summary, hypothesis of study.
The methodology adopted (i.e.) How study carried out?
What basic design?, Experimental manipulations?
Scope of study, statistical analysis adopted &
limitations of study. 57
58. ii) Statement of findings and recommendations:
It should contain statement of findings and
recommendations, which can be easily understood.
iii) Results:
Detailed presentation of findings of study with data in
form of tables and charts.
It should contain statistical summaries and reductions of
data.
Relevant results should place in report and presented in
logical sequence.
iv) Implications of the results:
State the implications that flow from results of study.
It is necessary to finish the report with short conclusions
with summaries.
58
59. Implications has three main aspects –
a) statement of inferences drawn from present study
may be expected to apply in similar situations.
b) conditions of present study may limit the
generalizations of inferences.
c) relevant questions which are unanswered can be
raised along with suggestions.
v) Summary:
To conclude the research report with brief summary,
research problem, methodology, major findings and
major conclusions drawn from research results.
C) End Matter:
Appendices, questionnaire, sample information,
mathematical derivations, bibliography, Index should
be given at the end of the report. 59
60. CHAPTERIZATION OF RESEARCH
REPORT PARTS
Cover Sheet:
• Full title of the report.
• Name of the researcher.
• Name of the unit of which project is a part.
• Name of the institution.
• Date / year.
Title page:
• Full title and your name.
Acknowledgement:
• Thanks giving to the people helped you.
Contents: chapter title and subheadings.
60
61. List of tables:
• Headings in report should given page numbers.
• Each chapter begin on new page.
• Subdivide the sections and sub-sections (i.e.) 1, 2, 3,
(3.1, 3.2), etc.
Abstract or Summary or Executive summary:
• Overview of whole report.
• What you set out to do, focus on literature review,
methodology based on objectives, summary of findings
and analysis of findings.
Body:
Aims and Purposes or Aims & Objectives:
• Why did you do this work? What problem identified?
• Mention specific research. 61
Mr.T.Somasundaram
62. Review of Literature:
• It help to put your research in background context and its
importance.
• It include articles & books relevant to topic.
Methodology:
• It deals with methods & principles used in research, sample
size.
• Methods used for research, method of data collection,
measurement used, sampling techniques.
Results or Findings:
• What did you find out the research?
• Presentation of results with calculations, tables, graphs and
charts or figures.
Analysis and Discussion:
• Interpret your results, compare with other research done in this
area.
• Accuracy of measurement is discussed.
62
63. Conclusions:
• Summarize briefly the main conclusion that discussed on
‘results’.
• Don’t give conclusions without evidence.
Recommendations:
• Suggestions for action or further research.
• Give recommendations, if necessary.
Appendix:
• It include blank copy of questionnaire in appendix.
• It include data calculations, drawings, plans, etc.
• Balance sheet (if research area is finance).
References:
• List of all sources referred for the report.
• Mention in American Psychological Association (APA)
format is recognized internationally. 63
64. TYPES OF REPORTS
* Research report may differ in length and form.
(E.g.) business firms prefer reports in form of letters.
Types of Reports:
1. Technical Report: It is used whenever a full written
report of the study is required whether for record-
keeping or for public dissemination.
It emphasis on three things –
i) methods employed.
ii) assumptions made in the course of study.
iii) detailed presentation of findings including their
limitations and supporting data.
65. Outline of a Technical Report:
a) Summary of results – brief review of main findings in 2
or 3 pages.
b) Nature of the study – description of objectives of study,
formulation of problem, working hypothesis, type of
analysis, data required, etc.
c) Methods employed – methods used in study and its
limitations. (E.g.) sample design, sample size, selection,
etc.
d) Data – discussion of data collected, their sources,
limitations.
e) Analysis of data & presentation of findings – data
analysis & its presentation of study with supporting data
in form of tables and charts.
f) Conclusions – detailed summary of findings & results.
65
66. g) Bibliography – various sources should be prepared &
attached.
i) Technical appendices – appendices given for technical
matters relating to questionnaires, mathematical
derivations, etc.
j) Index – it must be prepared & given in report at end.
2. Popular (General) Report: It is used if the research
results have policy implication. (E.g.) “Best B-Schools
survey in Business Magazines”.
• This report emphasis on simplicity and attractiveness.
• It has attractive layout, many subheadings, etc.
• It emphasis on practical aspects.
Outline of a Popular Report:
a) Findings & their implications – emphasis on findings
of practical interest and implication of these findings.
66
67. b) Recommendations for action – it is based on
findings of the study.
c) Objective of the study – general review of how
problem is presented along with objectives of study.
d) Methods employed – brief & non technical
description of methods & techniques used.
e) Results – it is the main body of report & it must be
presented in clear terms with liberal use such as
charts, diagrams.
f) Technical appendices – more detailed information
about method used.
3. Practical Reports: A report conveys an information
and recommendations from a researcher who has
investigated a topic in detail.
67
68. 4. Academic Reports: A report written for an academic
course can be thought of as a simulation.
- it deals with theoretical ideas and serve academic and
practical purposes.
Essentials of a Good Report:
1. Style – it is easy to read and understand, sentence are
good and language used is simple & avoid jargon.
2. Layout – good layout should be their, sections,
paragraphs, headings and subheadings, lettering and
bullet points.
3. Accuracy – everything the researcher writes is accurate.
If mislead, then it will destroy your work.
4. Clarity – use simple language to express your point of
view.
5. Revision – report should be read one time, check
spelling and grammatical errors.
68
69. 6. Readability – attractive appearance, non technical
subject matter, clear & direct style, short sentences, short
& familiar words.
7. Reinforcement – it gets the message across & used to
get effect in all circumstances.
(E.g.) during presentations – tell what are you going to say.
- Then say it.
- Then tell them what you said.
8. Feedback meeting – it is useful to circulate copies of
report to feedback meeting, which include
recommendations for change in conclusion.
- does the report have impact?
- does introduction encourage?
- have objectives been met? have conclusion clearly
stated?
69
70. PRECAUTIONS FOR WRITING
RESEARCH REPORT
1. Length of the report should be long enough to cover the
subject but short enough to maintain interest.
2. It shouldn’t be dull, it should be sustain reader’s interest.
3. Abstract terminology & technical jargon should be
avoided & convey matter as simply as possible. (avoid
‘there may be’, ‘it seems’).
4. It must provide availability of findings which make
readers interested in acquiring knowledge.
5. Layout of report should be well thought out &
appropriate.
6. It should free from grammatical mistakes and strictly
accordance with quotations, footnotes, punctuations &
use of abbreviations.
70
71. 7. It must present logical analysis of subject matter.
8. It should show originality & necessarily an attempt to
solve intellectual problem.
9. It must state policy implications relating to problem and
kinds of research needs in particular field.
10. Appendices should be enlisted in the report.
11. Bibliography of sources is must for good report.
12. Index is essential part of a good report and prepared and
attached at the end.
13. It must be attractive, neat and clean, typed or printed.
14. Calculated confidence limits must be mentioned in the
report.
15. Objectivity, nature, methods and analysis adopted must
be stated clearly in the report.
71