data analysis techniques and statistical softwares
Download as pptx, pdf7 likes3,944 views

this presentation is about common error that we conduct during our research work due to lack of knowledge about statistical techniques


More Related Content
What's hot (20)
Viewers also liked (20)


Similar to data analysis techniques and statistical softwares (20)


More from Dr.ammara khakwani (10)


Recently uploaded (20)


data analysis techniques and statistical softwares
- 2. Data Analysis Techniques & Statistical Software's By Dr.Ammara Khakwani In Numl Multan Campus
- 3. Estimation Prediction Forecasting For the purpose of Decision making about unknown parameters on the basics Estimates
- 6. Process data and report the overall trends. Process Systematically Apply Statistical Techniques to describe and evaluate data.
- 7. Not Having the necessary skills to analyze Not Following acceptable norms for data analysis Not Choosing the appropriate statistical software Not Providing honest and accurate analysis Lack of sense for data presentation Extended data analysis
- 8. Getting data ready for analysis Coded Transcribe data from Questionnaire Response No Response Keyed software first column for identification purposes method Edited check 10% of questionnaires systematic sampling
- 9. keyed To compare the data in the data file with the answers of the participants Enter this number in the first column of your data file Write this number on the first page of every questionnaire • Assign a number to every questionnaire
- 11. Solution for non-responses Assign a number give a code in questionnaire Give a mean value to all those who have responded Look at participants pattern of responses deduce a logical answer
- 12. Summary Figure Measures Measures of Central Tendency Measures of Dispersion Visual Reprsentation Graphs
- 13. Scale Examples Measures of Central Tendency… for a single Variable Measures of Dispersion …for a Single variable Visual Summary …for a single variable Measure of Relation … between variables Visual Summary of Relation … between variables Nominal Social security number gender Mode ____ Bar chart, pie chart Contingency table (cross-tab) Stacked bars, clustered bars Ordinal Satisfaction rating on a 5-point scale (1=not satisfied at all,5=extremely satisfied Median Semi-inter Quartile Range Bar chart pie chart Contingency table (cross-tab) Stacked bars, clustered bars Interval Age 15-20 Height 5-6 feet Arithmetic Mean Minimum, maximum, Standard Deviation, Variance, Co-efficient of variation Histogram, scatter plot, x-and-whisker plot Correlations Scatters plots Ratio sales Arithmetic or Geometric mean Same as above Histogram, Scatter plot, x-and-whisker plot Correlations Scatters plots
- 14. Relationship between Variables Significance of Bivariate Relationship Interval Scale Ordinal Scale Nominal Scale Nature Direction
- 15. Ordinal scale Spearman’s Rank correlation Kendall’s Rank correlation Nominal scale χ²-test Interval scale Spearman’s rank correlation Kendall’s rank correlation
- 16. 1. Reliable 2. Well documented 3. User-friendly 4. General 5. Flexible 6. Fast
- 18. 1. How Easy Is the Statistical Software to Use? 2. Depth of menued procedures. 3. Range and quality of use of procedures offered. 4. Modifiability of analytical output. 5. Ease of table output to formatting . 6. Range of Graphical output offered. 7. Speed of handling large data sets. 8. Ease of results & flexibility of data set manipulation.
- 19. Education researches, Government, Marketing Organizations Telecommunications, Banking, Finance, Insurance, Healthcare, Manufacturing, Retail, Consumer packaged goods,
- 21. Transform raw data into information. Provide a way of drawing inductive inferences from data. Distinguishing the signal from the statistical fluctuations present in the data. Statistical procedures are categorized according to Descriptive, and inferential Statistics .
- 22. For the Social Sciences (SPSS)) Statistical Analysis System (SAS) Econometric Views (EViews) MINITAB STATA R & MATLAB MS-EXCEL
- 23. MiniTab -- a powerful, full-featured MS Windows , with coverage of industrial quality control analyses. EasySample -- a tool for statistical sampling. SAS/STAT http://www.sas.com/ from descriptive statistics, t-tests, analysis of variance, and predictive modeling to exact methods
- 24. ATLAS.ti http://www.atlasti.com/ ATLAS.ti serves as a powerful utility for qualitative analysis, CDC EZ Text http:/www.cdc.gov/hiv/topics/surveillance/res ources/software/ez-text/index.htm CDC EZ- Text is developed to assist researchers create, manage, and analyze semi-structured qualitative databases. NVivohttp://www.qsrinternational.com/ is designed to support a wide range of research methods,
- 25. Statistical Package for the Social Science Statistical Product and Service Solutions Popular statistical packages Complex Data manipulation and analysis with Simple instructions
- 26. SPSS can take data from almost any type of file and use them to generate tabulated reports, charts, and plots of distributions and trends, descriptive statistics, and conduct complex statistical analyses.
- 27. Questions in the questionnaire are mapped into Variables in SPSS
- 28. How is your satisfaction with the customer service of the staff of Bata? O Excellent O Good O Bad O Very bad Missing value
- 29. 1 = Excellent 2 = Good 3 = Bad 4 = Very bad 5 = missing value
- 30. Please indicate your gender. O Female O Male Codes: 1 = Female 2 = Male 3 = missing value
- 31. What is your average expenditure in the restaurant on a weekly basis? ……… rupees per week . For how many years have you been registered as a student at B.Z University? ……… year(s)
- 32. I would like to have the assortment extended with the following products: ………………………………………… Processed by Coding manually afterwards
- 33. Description Order Distance Nominal Ordinal Scale Levels of Measurement
- 34. Nominal Smoker or non smoker (yes, no); Ordinal In your opinion, would you say the prices at Chen- one are O Higher than Cantt. Bazar O About the same as Cantt. O Lower than Cantt. Ordinal What is your age? O 15–<25 O 25–<40 O 40–<60 O 60–<90
- 35. Analyze Frequencies Cross tabs Tables Graphs Bar Pie Histogram Line Boxplot Don’t forget to save ◦ Data file ◦ Output file
- 36. Input data into the computer Organise data Compare data Manage data Summarise data (transform raw data into information) Generate tables and graphs Facilitate presentation of information and preparation of analytical reports
- 37. Start → All Programs → SPSS Inc→ SPSS 16.0 → SPSS 16.0
- 38. The default window will have the data editor There are two sheets in the window: 1. Data view 2. Variable view
- 40. Data View
- 41. Variable View
- 42. Variable view ◦ Name ◦ Type (Numeric) ◦ Label ◦ Values (= the codes of the answers) ◦ Measure (= Level of Measurement)
- 43. Data Editor Spreadsheet-like system for defining, entering, editing, and displaying data. Extension of the saved file will be “sav.”
- 44. Output Viewer Displays output and errors. Extension of the saved file will be “spv.”
- 45. Syntax Editor Text editor for syntax composition. Extension of the saved file will be “sps.”
- 46. Script Window Provides the opportunity to write full-blown programs, in a BASIC-like language.
- 47. This sheet is visible when you first open the Data Editor and this sheet contains the data -------------------Click on the tab labeled Variable View Click
- 48. This sheet contains information about the data set .The first character of the variable name must be alphabetic .Variable names must be unique, and have to be less than 64 characters. Spaces are NOT allowed.
- 49. ◦ Click on the ‘type’ box. The two basic types of variables that you will use are numeric and string. This column enables you to specify the type of variable.
- 50. Width allows you to determine the number of characters SPSS will allow to be entered for the variable
- 51. ◦ Number of decimals ◦ It has to be less than or equal to 16 3.14159265
- 52. _You can specify the details of the variable ◦ You can write characters with spaces up to 256 characters
- 53. This is used and to suggest which numbers represent which categories when the variable represents a category
- 54. Click the cell in the values column as shown below For the value, and the label, you can put up to 60 characters. After defining the values click add and then click OK. Click
- 55. How would you put the following information into SPSS? Value = 1 represents Male and Value = 2 represents Female Name Gender Height JAUNITA 2 5.4 SALLY 2 5.3 DONNA 2 5.6 SABRINA 2 5.7 JOHN 1 5.7 MARK 1 6 ERIC 1 6.4 BRUCE 1 5.9
- 56. Click
- 57. Click
- 58. To save the data file you created simply click ‘file’ and click ‘save as.’ You can save the file in different forms by clicking “Save as type.” Click
- 59. Click ‘Data’ and then click Sort Cases
- 60. Double Click ‘Name of the students.’ Then click ok. Click Click
- 61. How would you sort the data by the ‘Height’ of students in descending order? Answer ◦ Click data, sort cases, double click ‘height of students,’ click ‘descending,’ and finally click ok.
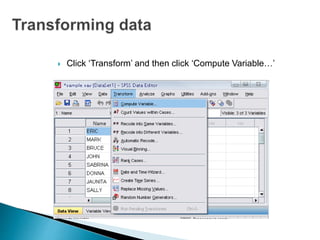
- 62. Click ‘Transform’ and then click ‘Compute Variable…’
- 63. Example: Adding a new variable named ‘lnheight’ which is the natural log of height ◦ Type in lnheight in the ‘Target Variable’ box. Then type in ‘ln(height)’ in the ‘Numeric Expression’ box. Click OK Click
- 64. A new variable ‘lnheight’ is added to the table
- 65. Create a new variable named “sqrtheight” which is the square root of height. Answer
- 66. Frequencies ◦ This analysis produces frequency tables showing frequency counts and percentages of the values of individual variables. Descriptives ◦ This analysis shows the maximum, minimum, mean, and standard deviation of the variables Linear regression analysis ◦ Linear Regression estimates the coefficients of the linear equation
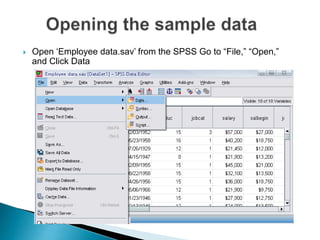
- 67. Open ‘Employee data.sav’ from the SPSS Go to “File,” “Open,” and Click Data
- 68. Go to Program Files,” “SPSSInc,” “SPSS16,” and “Samples” folder. Open “Employee Data.sav” file
- 69. Click ‘Analyze,’ ‘Descriptive statistics,’ then click ‘Frequencies’
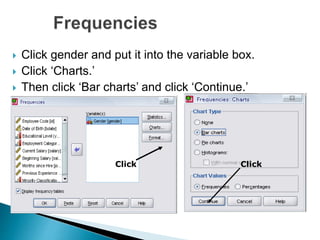
- 70. Click gender and put it into the variable box. Click ‘Charts.’ Then click ‘Bar charts’ and click ‘Continue.’ Click Click
- 71. Finally Click OK in the Frequencies box. Click
- 73. Click ‘Analyze,’ ‘Descriptive statistics,’ then click ‘Frequencies.’ Put ‘Gender’ in the Variable(s) box. Then click ‘Charts,’ ‘Bar charts,’ and click ‘Continue.’ Click ‘Paste.’ Click
- 74. Highlight the commands in the Syntax editor and then click the run icon. You can do the same thing by right clicking the highlighted area and then by clicking ‘Run Current’ Click Right Click!
- 75. Do a frequency analysis on the variable “minority” Create pie charts for it Do the same analysis using the syntax editor
- 77. Click
- 78. Click ‘Analyze,’ ‘Descriptive statistics,’ then click ‘Descriptives…’ Click ‘Educational level’ and ‘Beginning Salary,’ and put it into the variable box. Click Options Click
- 79. The options allows you to analyze other descriptive statistics besides the mean and Std. Click ‘variance’ and ‘kurtosis’ Finally click ‘Continue’ Click Click
- 80. Finally Click OK in the Descriptives box. You will be able to see the result of the analysis.
- 81. Click ‘Analyze,’ ‘Regression,’ then click ‘Linear’ from the main menu.
- 82. For example let’s analyze the model Put ‘Beginning Salary’ as Dependent and ‘Educational Level’ as Independent. edusalbegin 10 Click Click
- 83. Clicking OK gives the result
- 84. Click ‘Graphs,’ ‘Legacy Dialogs,’ ‘Interactive,’ and ‘Scatterplot’ from the main menu.
- 85. Drag ‘Current Salary’ into the vertical axis box and ‘Beginning Salary’ in the horizontal axis box. Click ‘Fit’ bar. Make sure the Method is regression in the Fit box. Then click ‘OK’. Click Set this to Regression!
- 88. Click on the “fit” tab to make sure the method is regression
- 90. Descriptive Statistics (Summarising Data) Frequency Distributions ◦ Frequency tables ◦ Histograms Central Tendency ◦ The mean ◦ The median ◦ The mode Variance (spread of data around the mean) The range Standard deviation
- 91. Skewness refers to the degree and direction of asymmetry in a distribution. No Skew Positively Skewed Negatively Skewed
- 92. The reliability of a scale indicates how free it is from random error. Two frequently used indicators of a scale’s reliability are test-retest reliability (also referred to as ‘temporal stability’) and internal consistency.
- 93. •Do not simply accept and report the format of SPSS computer printout. •Instead, reformat the data into tables. • •Take some care in reporting tables. •Provide informative titles. • Be sure to include the Ns