Data collection & Organization (Organizing Data: Frequency Distribution and Graphical Presentations).pptx
Download as PPTX, PDF0 likes10 views

Frequency Distribution and Graphical Presentation


Data collection & Organization (Organizing Data: Frequency Distribution and Graphical Presentations).pptx
- 1. DATA COLLECTION & ORGANIZATION (Organizing Data: Frequency Distribution and Graphical Presentations)
- 2. FREQUENCY DISTRIBUTION In most cases, the data collected from the different sources through various methods of data collection are generally raw, unorganized and haphazard. (Broto, 2nd Edition)
- 3. FREQUENCY DISTRIBUTION One method for simplifying and organizing data is to construct a frequency distribution.
- 4. FREQUENCY DISTRIBUTION Frequency –how many times it appears
- 5. FREQUENCY DISTRIBUTION It is the tabulation of data of measures grouped with class interval. A frequency distribution is an organized tabulation showing exactly how many individuals are located in each category on the scale of measurement. A frequency distribution presents an organized picture of the entire set of scores, and it shows where each individual is located relative to others in the distribution.
- 6. FREQUENCY DISTRIBUTION The frequency f of a class is the number of data entries in the class. Each class will have a “lower class limit” and an “upper class limit” which are the lowest and highest numbers in each class.The “class width” is the distance between the lower limits of consecutive classes.The range is the difference between the maximum and minimum data entries. When the data has a wide range, we can group it. (Grouped Frequency Distribution)
- 9. FREQUENCY DISTRIBUTION Table 2 Frequency Distribution of the Examination Results of Thirty Seven Students in Mathematics Table 3 Frequency Distribution of the Thirty Seven Students Grouped According to their Respective Courses Table 4 Frequency Distribution of Thirty Seven Students Grouped According to Sex
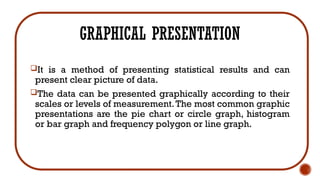
- 10. GRAPHICAL PRESENTATION It is a method of presenting statistical results and can present clear picture of data. The data can be presented graphically according to their scales or levels of measurement.The most common graphic presentations are the pie chart or circle graph, histogram or bar graph and frequency polygon or line graph.
- 11. Consider this table of enrollment by sex in the College of Arts and Communication. GRAPHICAL PRESENTATION Table 1 Frequency Distribution of Enrollment by Sex PIE CHART NOMINAL DATA The pie chart or circle graph can provide an easy presentation of nominal data or any categorical data. The whole circular graph equals 100%. Likewise, one complete revolution equals 360º . So in making the graph, multiply the 360º by the percentage in every category. Solutions: 25% of 360º =90º 75% of 360º =270º Using a protractor, measure the 90º and the 270º that will represent the graph for male and female enrollment. Male 25% Female 75% Fig.1 Distribution of Enrollment by Sex in the College of Arts and Communication
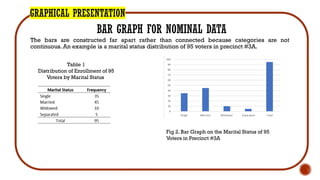
- 12. GRAPHICAL PRESENTATION BAR GRAPH FOR NOMINAL DATA The bars are constructed far apart rather than connected because categories are not continuous. An example is a marital status distribution of 95 voters in precinct #3A. Table 1 Distribution of Enrollment of 95 Voters by Marital Status Fig 2. Bar Graph on the Marital Status of 95 Voters in Precinct #3A
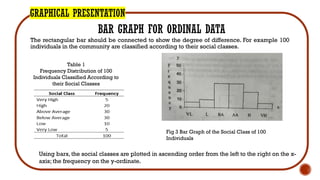
- 13. GRAPHICAL PRESENTATION BAR GRAPH FOR ORDINAL DATA The rectangular bar should be connected to show the degree of difference. For example 100 individuals in the community are classified according to their social classes. Table 1 Frequency Distribution of 100 Individuals Classified According to their Social Classes Fig 3 Bar Graph of the Social Class of 100 Individuals Using bars, the social classes are plotted in ascending order from the left to the right on the x- axis; the frequency on the y-ordinate.
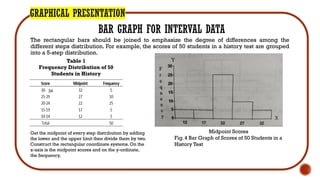
- 14. GRAPHICAL PRESENTATION BAR GRAPH FOR INTERVAL DATA The rectangular bars should be joined to emphasize the degree of differences among the different steps distribution. For example, the scores of 50 students in a history test are grouped into a 5-step distribution. Table 1 Frequency Distribution of 50 Students in History Midpoint Scores Fig. 4 Bar Graph of Scores of 50 Students in a History Test Get the midpoint of every step distribution by adding the lower and the upper limit then divide them by two. Construct the rectangular coordinate systems. On the x-axis is the midpoint scores and on the y-ordinate, the frequency. 34
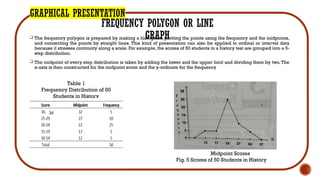
- 15. GRAPHICAL PRESENTATION FREQUENCY POLYGON OR LINE GRAPH The frequency polygon is prepared by making a histogram, plotting the points using the frequency and the midpoints, and connecting the points by straight lines. This kind of presentation can also be applied to ordinal or interval data because it stresses continuity along a scale. For example, the scores of 50 students in a history test are grouped into a 5- step distribution. The midpoint of every step distribution is taken by adding the lower and the upper limit and dividing them by two. The x-axis is then constructed for the midpoint score and the y-ordinate for the frequency Table 1 Frequency Distribution of 50 Students in History Midpoint Scores Fig. 5 Scores of 50 Students in History 34
- 16. “Frequency distribution is a vital technique for organizing data in research. By grouping data into intervals, researchers can make sense of large data set, identify trends and anomalies, and present their findings in an easily interpretable format. Whether you use tables, histograms, bar graphs, or pie chats, frequency distribution offers a powerful way to make complex data more accessible and meaningful” https://journalism.university/communication-research-methods/organizing-data-frequency-distribution/
- 17. Thank You So Much Thank You So Much
Editor's Notes
- #2: After collecting data, the first task for a researcher is to organize and simplify the data so that it is possible to get a general overview of the results. To give meaning to these raw data, appropriate tables and graphs are used.
- #4: From its simplest definition…
- #16: Mastering the art of frequency distribution will be an essential skill for making informed decisions based on your data.