SlideShare a Scribd company logo
User
Segmentation
(Real World)
Jaysen Gillespie
Head of Analytics &Data Science
2
Commercial Notes
• Over 1000 global employees
• Based in Warsaw, Poland
• Leader in using Deep Learning to solve online
advertising challenges
• A “DSP” for those of you in ad -tech/programmatic
Technical Notes
• Over 1B bid requests per day
• Billions of ads served each year
• Millions of clicks and site visits generated each year
How well do we really know our
users?
3
• Marketing, Operations, and other teams have
general ideas about the kind of people who use
the app
• Analytics had ideas about “best users” that
different from views held by other teams
Why would we care about this (as analysts)?
grow tribal knowledge; challenge existing thought; drive business impact
• Product Strategy
• What do we build? What do our key user segments need?
• Marketing Strategy
• Which types of users should we acquire?
• What’s the best way to find them?
• Finance
• Which user profiles lead to better financial performance for the business?
4
We started with one -dimensional knowledge
Let’s build some basic facts
• Everyone knows at least one tool for this job
• Excel
• SQL
• R / Python
• Other languages (C++, etc.)
5
Univariate review of users is a good start
And it can help give ideas for more complex analysis
• Your most common user is not necessarily your most valuable user!
6
34%
23%
13%
11%
8%
11%
18-24 25-34 35-44 45-54 55-64 65+
New Users by Age, Jan 2022
3%
8%
13%
20%
25%
31%
18-24 25-34 35-44 45-54 55-64 65+
User Activity by Age, Jan 2022
But it’s hard to get the full picture, when you are
looking at one color at a time
• Let’s move from ETL & EDA to modeling
7
We wanted an “unsupervised” learning approach so
that we don’t need the answers first
Cluster Analysis is a classic choice
• Linear and Logistic Regression
• Decision Trees
• Support Vector Machines
• Random Forests
8
Supervised
(Classification and Regression)
UN-Supervised
(Clustering)
• K-means clustering
• Hierarchical clustering
• Association Rules (buy X -> buy Y)
• Principal Component Analysis
Deep Learning
• Could be either
• We use supervised to predict which ads will “work”
Quick reminder: K-Means clustering creates groups
based on the centroid of group members
Credit: Wikipedia 9
• Randomly pick N points as initial cluster centroids
• Assign each point to closest proposed centroid (remember this!)
• Find new centroids based on group assignment
• Wash. Rinse. Repeat. (Until convergence)
K-means relies on a distance formula, so make sure to
normalize data in some way
Which features (raw data fields) will drive the analysis?
• Age in years (18, 29, 44, 68, etc.)
• Gender, encoded as 1/0
• Race, encoded as 1/0
• Household income in $ (50000, etc.)
• # of children (0, 1, 2, etc.)
• ZIP Code (90210, 10023, etc.)
• Years of eduation (16=Bachelors, etc.)
10
Raw Data
We transformed by z-score and/or by bucket number
Pythonistas: make sklearn.preprocessing.StandardScaler()your friend
• Age in years (18, 29, 44, 68, etc.)
• Gender, encoded as 1/0
• Race, encoded as 1/0 variables
• Household income in $ (20000, 50000,
etc)
• # of children (0, 1, 2, etc.)
• ZIP Code (90210, 10023, etc.)
• Years of eduation (12=HS, 16=Bachelors
Degree, etc.)
11
Raw Data
• Age [z-scored]
• Gender, encoded as 1/0 [OK]
• Race, encoded as 1/0 [OK]
• Household income in [z -scored]
• # of children/3 [0, 0.33, 0.66, 1.0]
• ZIP Code [dropped]
• Years of education [0, 1, 2, 3]
If “unsupervised” doesn’t require a training set, why
don’t we use it for everything
How will I know…
• Qualitiative evaluation measures
12
Supervised
(Classification and Regression)
UN-Supervised
(Clustering)
• “Looks good to me!”
Limited design decisions make k -means clustering
user friendly
Just tell me how many clusters you want please
13
Less is more
• How much gain in consistency by
adding another cluster?
• Ask the business: how many segments
do you think (want to) exist?
Elbow Method
• Where the curve flattens out
0
500
1,000
1,500
2,000
2,500
3,000
3,500
4,000
4,500
5,000
1 2 3 4 5 6
Sum Squared Distance vs # Clusters
Case Study 1 Case Study 2
Excellent – so we have a super awesome output
with 4 -clusters
Is this where we break out the $.drinks.favorite?
14
How do we know if this is of any use?
The real fun is just about to begin…
15
Full-stack analysts shine in the interpretation phase
Data acquisition,
cleaning and other
preparation
EDA Run
Mode
l Analytical
Interpretation
Business
Interpretation
Business Execution
(Not always
Analytics’ Job)
We can now find all sorts of averages or other
summary data points “by cluster number”
Let’s learn how the K -means algo made decisions
16
• Which input features differ most across segments?
• Are there features that don’t seem to matter?
• Did we validate that our choice of encoding didn’t fail us?
• Do we sense a primary feature or two that drove
segmentation?
• Should we re-run with N-1 or N+1 segments?
Analytical
Interpretation
Marketing and business leadership teams should love
the insights from cluster analysis
”Segment 2’s average income is 1.6 standard deviations below the mean!”
17
• Can we better align our
verbiage with our
audience?
• Let’s re-skin what we did
in terms of how our
audience thinks and
speaks
Instead of specific facts, we found that a holistic view
of each segment earned a warmer reception
Listing the dominant value of key attributes appealed to business users
Now we are starting to get the “look and feel” of each segment
(Actual table had 8 -10 key dimensions) 18
Segment Age Income Education Marital Status
1
Boomers (55%)
Some GenX/Mill.
Top 50% (75%) Some college Married (77%)
2
GenX (35%)
Mill (32%)
Top 50% (92%) College grads Married (63%)
3 GenX/Mill. (65%) Bottom 50% (88%) Little college Unmarried (59%)
4
Mill. (38%)
GenZ (22%)
Bottom 50% (68%) Some college Unmarried (82%)
Even a rudimentary attempt at working in our
audience’s discipline can work magic
Who came up with these names? The Data Science team?
19
• First-draft names often
stick
• Analytics can own
internal collateral
explaining the work done
• Projecting n-dimensions
into a 2D graph is a
crowd pleaser
AGE
INCOME
Senior Stables
Mid-Age
Thrivers
Mid-Age
Laggers
Young &
Struggling
Joining segmentation to average KPIs (in -app actions,
purchase behavior, etc.) rounds out the profiles
20
• Analytics created internal collateral with
segments and usage/purchase data
• Reasonable stopping point for hand -off
to Marketing
• Python code makes updating
segmentation on a regular basis (1x/year
or 4x/year) easy to do
At this point, we can hand off implementation to
other teams (or ourselves)
21
• Marketing to create personas; change
targeting for new customer acquisition;
brief ad agency
• Finance (or Analytics) to understand the
total lifetime value (LTV) for each user
segment
• Product to connect feedback with each
user segment
• Analytics to develop reporting based on
user segments
Jaysen Gillespie
Head of Analytics and Data Science
jaysen.gillespie@rtbhouse.com
THANK YOU
Ad

More Related Content

Similar to Data Con LA 2022 - Real world consumer segmentation (20)

AI Models For Fun and Profit by Walmart Director of Artificial Intelligence
AI Models For Fun and Profit by Walmart Director of Artificial IntelligenceAI Models For Fun and Profit by Walmart Director of Artificial Intelligence
AI Models For Fun and Profit by Walmart Director of Artificial Intelligence
Product School
 
Predicting user demographics in social networks - Invited Talk at University ...
Predicting user demographics in social networks - Invited Talk at University ...Predicting user demographics in social networks - Invited Talk at University ...
Predicting user demographics in social networks - Invited Talk at University ...
Nikolaos Aletras
 
WTI Framework Preso.pptx
WTI Framework Preso.pptxWTI Framework Preso.pptx
WTI Framework Preso.pptx
What's the Idea?
 
Value
ValueValue
Value
Andrea Provaglio
 
HR Tech and the Employee Experience
HR Tech and the Employee ExperienceHR Tech and the Employee Experience
HR Tech and the Employee Experience
Tom Haak
 
Presentation: Measuring campaign effectiveness (Metzner)
Presentation: Measuring campaign effectiveness (Metzner)Presentation: Measuring campaign effectiveness (Metzner)
Presentation: Measuring campaign effectiveness (Metzner)
Floris Metzner
 
WEBINAR: How to Use Control Charts
WEBINAR: How to Use Control ChartsWEBINAR: How to Use Control Charts
WEBINAR: How to Use Control Charts
GoLeanSixSigma.com
 
Great Survey Design
Great Survey DesignGreat Survey Design
Great Survey Design
SurveyGizmo
 
Ppt big data
Ppt big dataPpt big data
Ppt big data
shai123
 
لموعد الإثنين 03 يناير 2022 143 مبادرة #تواصل_تطوير المحاضرة ال 143 من المباد...
لموعد الإثنين 03 يناير 2022 143 مبادرة #تواصل_تطوير المحاضرة ال 143 من المباد...لموعد الإثنين 03 يناير 2022 143 مبادرة #تواصل_تطوير المحاضرة ال 143 من المباد...
لموعد الإثنين 03 يناير 2022 143 مبادرة #تواصل_تطوير المحاضرة ال 143 من المباد...
Egyptian Engineers Association
 
How to Use Artificial Intelligence by Microsoft Product Manager
 How to Use Artificial Intelligence by Microsoft Product Manager How to Use Artificial Intelligence by Microsoft Product Manager
How to Use Artificial Intelligence by Microsoft Product Manager
Product School
 
Learning Metrics: Building Your Training Scorecard
Learning Metrics: Building Your Training ScorecardLearning Metrics: Building Your Training Scorecard
Learning Metrics: Building Your Training Scorecard
Cornerstone OnDemand Foundation
 
Predict oscars (4:17)
Predict oscars (4:17)Predict oscars (4:17)
Predict oscars (4:17)
Thinkful
 
The Hive Think Tank: Machine Learning at Pinterest by Jure Leskovec
The Hive Think Tank: Machine Learning at Pinterest by Jure LeskovecThe Hive Think Tank: Machine Learning at Pinterest by Jure Leskovec
The Hive Think Tank: Machine Learning at Pinterest by Jure Leskovec
The Hive
 
What needs to be true? Patterns of engineering agility
What needs to be true? Patterns of engineering agilityWhat needs to be true? Patterns of engineering agility
What needs to be true? Patterns of engineering agility
Andy Norton
 
Search Engine Results: The Best Measure?
Search Engine Results: The Best Measure? Search Engine Results: The Best Measure?
Search Engine Results: The Best Measure?
Fan Foundry
 
6.6 Family and Youth Program Measurement Simplified
6.6 Family and Youth Program Measurement Simplified6.6 Family and Youth Program Measurement Simplified
6.6 Family and Youth Program Measurement Simplified
National Alliance to End Homelessness
 
Assessing Your Current DesignOps Practice: A Heuristic Model - Dave Malouf
Assessing Your Current DesignOps Practice: A Heuristic Model - Dave MaloufAssessing Your Current DesignOps Practice: A Heuristic Model - Dave Malouf
Assessing Your Current DesignOps Practice: A Heuristic Model - Dave Malouf
Web à Québec
 
Measuring & Evaluating Your DesignOps Practice
Measuring & Evaluating Your DesignOps PracticeMeasuring & Evaluating Your DesignOps Practice
Measuring & Evaluating Your DesignOps Practice
Dave Malouf
 
Search Accuracy Metrics and Predictive Analytics - A Big Data Use Case: Prese...
Search Accuracy Metrics and Predictive Analytics - A Big Data Use Case: Prese...Search Accuracy Metrics and Predictive Analytics - A Big Data Use Case: Prese...
Search Accuracy Metrics and Predictive Analytics - A Big Data Use Case: Prese...
Lucidworks
 
AI Models For Fun and Profit by Walmart Director of Artificial Intelligence
AI Models For Fun and Profit by Walmart Director of Artificial IntelligenceAI Models For Fun and Profit by Walmart Director of Artificial Intelligence
AI Models For Fun and Profit by Walmart Director of Artificial Intelligence
Product School
 
Predicting user demographics in social networks - Invited Talk at University ...
Predicting user demographics in social networks - Invited Talk at University ...Predicting user demographics in social networks - Invited Talk at University ...
Predicting user demographics in social networks - Invited Talk at University ...
Nikolaos Aletras
 
HR Tech and the Employee Experience
HR Tech and the Employee ExperienceHR Tech and the Employee Experience
HR Tech and the Employee Experience
Tom Haak
 
Presentation: Measuring campaign effectiveness (Metzner)
Presentation: Measuring campaign effectiveness (Metzner)Presentation: Measuring campaign effectiveness (Metzner)
Presentation: Measuring campaign effectiveness (Metzner)
Floris Metzner
 
WEBINAR: How to Use Control Charts
WEBINAR: How to Use Control ChartsWEBINAR: How to Use Control Charts
WEBINAR: How to Use Control Charts
GoLeanSixSigma.com
 
Great Survey Design
Great Survey DesignGreat Survey Design
Great Survey Design
SurveyGizmo
 
Ppt big data
Ppt big dataPpt big data
Ppt big data
shai123
 
لموعد الإثنين 03 يناير 2022 143 مبادرة #تواصل_تطوير المحاضرة ال 143 من المباد...
لموعد الإثنين 03 يناير 2022 143 مبادرة #تواصل_تطوير المحاضرة ال 143 من المباد...لموعد الإثنين 03 يناير 2022 143 مبادرة #تواصل_تطوير المحاضرة ال 143 من المباد...
لموعد الإثنين 03 يناير 2022 143 مبادرة #تواصل_تطوير المحاضرة ال 143 من المباد...
Egyptian Engineers Association
 
How to Use Artificial Intelligence by Microsoft Product Manager
 How to Use Artificial Intelligence by Microsoft Product Manager How to Use Artificial Intelligence by Microsoft Product Manager
How to Use Artificial Intelligence by Microsoft Product Manager
Product School
 
Predict oscars (4:17)
Predict oscars (4:17)Predict oscars (4:17)
Predict oscars (4:17)
Thinkful
 
The Hive Think Tank: Machine Learning at Pinterest by Jure Leskovec
The Hive Think Tank: Machine Learning at Pinterest by Jure LeskovecThe Hive Think Tank: Machine Learning at Pinterest by Jure Leskovec
The Hive Think Tank: Machine Learning at Pinterest by Jure Leskovec
The Hive
 
What needs to be true? Patterns of engineering agility
What needs to be true? Patterns of engineering agilityWhat needs to be true? Patterns of engineering agility
What needs to be true? Patterns of engineering agility
Andy Norton
 
Search Engine Results: The Best Measure?
Search Engine Results: The Best Measure? Search Engine Results: The Best Measure?
Search Engine Results: The Best Measure?
Fan Foundry
 
Assessing Your Current DesignOps Practice: A Heuristic Model - Dave Malouf
Assessing Your Current DesignOps Practice: A Heuristic Model - Dave MaloufAssessing Your Current DesignOps Practice: A Heuristic Model - Dave Malouf
Assessing Your Current DesignOps Practice: A Heuristic Model - Dave Malouf
Web à Québec
 
Measuring & Evaluating Your DesignOps Practice
Measuring & Evaluating Your DesignOps PracticeMeasuring & Evaluating Your DesignOps Practice
Measuring & Evaluating Your DesignOps Practice
Dave Malouf
 
Search Accuracy Metrics and Predictive Analytics - A Big Data Use Case: Prese...
Search Accuracy Metrics and Predictive Analytics - A Big Data Use Case: Prese...Search Accuracy Metrics and Predictive Analytics - A Big Data Use Case: Prese...
Search Accuracy Metrics and Predictive Analytics - A Big Data Use Case: Prese...
Lucidworks
 

More from Data Con LA (20)

Data Con LA 2022 Keynotes
Data Con LA 2022 KeynotesData Con LA 2022 Keynotes
Data Con LA 2022 Keynotes
Data Con LA
 
Data Con LA 2022 Keynotes
Data Con LA 2022 KeynotesData Con LA 2022 Keynotes
Data Con LA 2022 Keynotes
Data Con LA
 
Data Con LA 2022 Keynote
Data Con LA 2022 KeynoteData Con LA 2022 Keynote
Data Con LA 2022 Keynote
Data Con LA
 
Data Con LA 2022 - Startup Showcase
Data Con LA 2022 - Startup ShowcaseData Con LA 2022 - Startup Showcase
Data Con LA 2022 - Startup Showcase
Data Con LA
 
Data Con LA 2022 Keynote
Data Con LA 2022 KeynoteData Con LA 2022 Keynote
Data Con LA 2022 Keynote
Data Con LA
 
Data Con LA 2022 - Using Google trends data to build product recommendations
Data Con LA 2022 - Using Google trends data to build product recommendationsData Con LA 2022 - Using Google trends data to build product recommendations
Data Con LA 2022 - Using Google trends data to build product recommendations
Data Con LA
 
Data Con LA 2022 - AI Ethics
Data Con LA 2022 - AI EthicsData Con LA 2022 - AI Ethics
Data Con LA 2022 - AI Ethics
Data Con LA
 
Data Con LA 2022 - Improving disaster response with machine learning
Data Con LA 2022 - Improving disaster response with machine learningData Con LA 2022 - Improving disaster response with machine learning
Data Con LA 2022 - Improving disaster response with machine learning
Data Con LA
 
Data Con LA 2022 - What's new with MongoDB 6.0 and Atlas
Data Con LA 2022 - What's new with MongoDB 6.0 and AtlasData Con LA 2022 - What's new with MongoDB 6.0 and Atlas
Data Con LA 2022 - What's new with MongoDB 6.0 and Atlas
Data Con LA
 
Data Con LA 2022 - Modernizing Analytics & AI for today's needs: Intuit Turbo...
Data Con LA 2022 - Modernizing Analytics & AI for today's needs: Intuit Turbo...Data Con LA 2022 - Modernizing Analytics & AI for today's needs: Intuit Turbo...
Data Con LA 2022 - Modernizing Analytics & AI for today's needs: Intuit Turbo...
Data Con LA
 
Data Con LA 2022 - Moving Data at Scale to AWS
Data Con LA 2022 - Moving Data at Scale to AWSData Con LA 2022 - Moving Data at Scale to AWS
Data Con LA 2022 - Moving Data at Scale to AWS
Data Con LA
 
Data Con LA 2022 - Collaborative Data Exploration using Conversational AI
Data Con LA 2022 - Collaborative Data Exploration using Conversational AIData Con LA 2022 - Collaborative Data Exploration using Conversational AI
Data Con LA 2022 - Collaborative Data Exploration using Conversational AI
Data Con LA
 
Data Con LA 2022 - Why Database Modernization Makes Your Data Decisions More ...
Data Con LA 2022 - Why Database Modernization Makes Your Data Decisions More ...Data Con LA 2022 - Why Database Modernization Makes Your Data Decisions More ...
Data Con LA 2022 - Why Database Modernization Makes Your Data Decisions More ...
Data Con LA
 
Data Con LA 2022 - Intro to Data Science
Data Con LA 2022 - Intro to Data ScienceData Con LA 2022 - Intro to Data Science
Data Con LA 2022 - Intro to Data Science
Data Con LA
 
Data Con LA 2022 - How are NFTs and DeFi Changing Entertainment
Data Con LA 2022 - How are NFTs and DeFi Changing EntertainmentData Con LA 2022 - How are NFTs and DeFi Changing Entertainment
Data Con LA 2022 - How are NFTs and DeFi Changing Entertainment
Data Con LA
 
Data Con LA 2022 - Why Data Quality vigilance requires an End-to-End, Automat...
Data Con LA 2022 - Why Data Quality vigilance requires an End-to-End, Automat...Data Con LA 2022 - Why Data Quality vigilance requires an End-to-End, Automat...
Data Con LA 2022 - Why Data Quality vigilance requires an End-to-End, Automat...
Data Con LA
 
Data Con LA 2022-Perfect Viral Ad prediction of Superbowl 2022 using Tease, T...
Data Con LA 2022-Perfect Viral Ad prediction of Superbowl 2022 using Tease, T...Data Con LA 2022-Perfect Viral Ad prediction of Superbowl 2022 using Tease, T...
Data Con LA 2022-Perfect Viral Ad prediction of Superbowl 2022 using Tease, T...
Data Con LA
 
Data Con LA 2022- Embedding medical journeys with machine learning to improve...
Data Con LA 2022- Embedding medical journeys with machine learning to improve...Data Con LA 2022- Embedding medical journeys with machine learning to improve...
Data Con LA 2022- Embedding medical journeys with machine learning to improve...
Data Con LA
 
Data Con LA 2022 - Data Streaming with Kafka
Data Con LA 2022 - Data Streaming with KafkaData Con LA 2022 - Data Streaming with Kafka
Data Con LA 2022 - Data Streaming with Kafka
Data Con LA
 
Data Con LA 2022 - Building Field-level Lineage from Scratch for Modern Data ...
Data Con LA 2022 - Building Field-level Lineage from Scratch for Modern Data ...Data Con LA 2022 - Building Field-level Lineage from Scratch for Modern Data ...
Data Con LA 2022 - Building Field-level Lineage from Scratch for Modern Data ...
Data Con LA
 
Data Con LA 2022 Keynotes
Data Con LA 2022 KeynotesData Con LA 2022 Keynotes
Data Con LA 2022 Keynotes
Data Con LA
 
Data Con LA 2022 Keynotes
Data Con LA 2022 KeynotesData Con LA 2022 Keynotes
Data Con LA 2022 Keynotes
Data Con LA
 
Data Con LA 2022 Keynote
Data Con LA 2022 KeynoteData Con LA 2022 Keynote
Data Con LA 2022 Keynote
Data Con LA
 
Data Con LA 2022 - Startup Showcase
Data Con LA 2022 - Startup ShowcaseData Con LA 2022 - Startup Showcase
Data Con LA 2022 - Startup Showcase
Data Con LA
 
Data Con LA 2022 Keynote
Data Con LA 2022 KeynoteData Con LA 2022 Keynote
Data Con LA 2022 Keynote
Data Con LA
 
Data Con LA 2022 - Using Google trends data to build product recommendations
Data Con LA 2022 - Using Google trends data to build product recommendationsData Con LA 2022 - Using Google trends data to build product recommendations
Data Con LA 2022 - Using Google trends data to build product recommendations
Data Con LA
 
Data Con LA 2022 - AI Ethics
Data Con LA 2022 - AI EthicsData Con LA 2022 - AI Ethics
Data Con LA 2022 - AI Ethics
Data Con LA
 
Data Con LA 2022 - Improving disaster response with machine learning
Data Con LA 2022 - Improving disaster response with machine learningData Con LA 2022 - Improving disaster response with machine learning
Data Con LA 2022 - Improving disaster response with machine learning
Data Con LA
 
Data Con LA 2022 - What's new with MongoDB 6.0 and Atlas
Data Con LA 2022 - What's new with MongoDB 6.0 and AtlasData Con LA 2022 - What's new with MongoDB 6.0 and Atlas
Data Con LA 2022 - What's new with MongoDB 6.0 and Atlas
Data Con LA
 
Data Con LA 2022 - Modernizing Analytics & AI for today's needs: Intuit Turbo...
Data Con LA 2022 - Modernizing Analytics & AI for today's needs: Intuit Turbo...Data Con LA 2022 - Modernizing Analytics & AI for today's needs: Intuit Turbo...
Data Con LA 2022 - Modernizing Analytics & AI for today's needs: Intuit Turbo...
Data Con LA
 
Data Con LA 2022 - Moving Data at Scale to AWS
Data Con LA 2022 - Moving Data at Scale to AWSData Con LA 2022 - Moving Data at Scale to AWS
Data Con LA 2022 - Moving Data at Scale to AWS
Data Con LA
 
Data Con LA 2022 - Collaborative Data Exploration using Conversational AI
Data Con LA 2022 - Collaborative Data Exploration using Conversational AIData Con LA 2022 - Collaborative Data Exploration using Conversational AI
Data Con LA 2022 - Collaborative Data Exploration using Conversational AI
Data Con LA
 
Data Con LA 2022 - Why Database Modernization Makes Your Data Decisions More ...
Data Con LA 2022 - Why Database Modernization Makes Your Data Decisions More ...Data Con LA 2022 - Why Database Modernization Makes Your Data Decisions More ...
Data Con LA 2022 - Why Database Modernization Makes Your Data Decisions More ...
Data Con LA
 
Data Con LA 2022 - Intro to Data Science
Data Con LA 2022 - Intro to Data ScienceData Con LA 2022 - Intro to Data Science
Data Con LA 2022 - Intro to Data Science
Data Con LA
 
Data Con LA 2022 - How are NFTs and DeFi Changing Entertainment
Data Con LA 2022 - How are NFTs and DeFi Changing EntertainmentData Con LA 2022 - How are NFTs and DeFi Changing Entertainment
Data Con LA 2022 - How are NFTs and DeFi Changing Entertainment
Data Con LA
 
Data Con LA 2022 - Why Data Quality vigilance requires an End-to-End, Automat...
Data Con LA 2022 - Why Data Quality vigilance requires an End-to-End, Automat...Data Con LA 2022 - Why Data Quality vigilance requires an End-to-End, Automat...
Data Con LA 2022 - Why Data Quality vigilance requires an End-to-End, Automat...
Data Con LA
 
Data Con LA 2022-Perfect Viral Ad prediction of Superbowl 2022 using Tease, T...
Data Con LA 2022-Perfect Viral Ad prediction of Superbowl 2022 using Tease, T...Data Con LA 2022-Perfect Viral Ad prediction of Superbowl 2022 using Tease, T...
Data Con LA 2022-Perfect Viral Ad prediction of Superbowl 2022 using Tease, T...
Data Con LA
 
Data Con LA 2022- Embedding medical journeys with machine learning to improve...
Data Con LA 2022- Embedding medical journeys with machine learning to improve...Data Con LA 2022- Embedding medical journeys with machine learning to improve...
Data Con LA 2022- Embedding medical journeys with machine learning to improve...
Data Con LA
 
Data Con LA 2022 - Data Streaming with Kafka
Data Con LA 2022 - Data Streaming with KafkaData Con LA 2022 - Data Streaming with Kafka
Data Con LA 2022 - Data Streaming with Kafka
Data Con LA
 
Data Con LA 2022 - Building Field-level Lineage from Scratch for Modern Data ...
Data Con LA 2022 - Building Field-level Lineage from Scratch for Modern Data ...Data Con LA 2022 - Building Field-level Lineage from Scratch for Modern Data ...
Data Con LA 2022 - Building Field-level Lineage from Scratch for Modern Data ...
Data Con LA
 
Ad

Recently uploaded (20)

GenAI for Quant Analytics: survey-analytics.ai
GenAI for Quant Analytics: survey-analytics.aiGenAI for Quant Analytics: survey-analytics.ai
GenAI for Quant Analytics: survey-analytics.ai
Inspirient
 
Day 1 - Lab 1 Reconnaissance Scanning with NMAP, Vulnerability Assessment wit...
Day 1 - Lab 1 Reconnaissance Scanning with NMAP, Vulnerability Assessment wit...Day 1 - Lab 1 Reconnaissance Scanning with NMAP, Vulnerability Assessment wit...
Day 1 - Lab 1 Reconnaissance Scanning with NMAP, Vulnerability Assessment wit...
Abodahab
 
VKS-Python-FIe Handling text CSV Binary.pptx
VKS-Python-FIe Handling text CSV Binary.pptxVKS-Python-FIe Handling text CSV Binary.pptx
VKS-Python-FIe Handling text CSV Binary.pptx
Vinod Srivastava
 
Data Analytics Overview and its applications
Data Analytics Overview and its applicationsData Analytics Overview and its applications
Data Analytics Overview and its applications
JanmejayaMishra7
 
Cleaned_Lecture 6666666_Simulation_I.pdf
Cleaned_Lecture 6666666_Simulation_I.pdfCleaned_Lecture 6666666_Simulation_I.pdf
Cleaned_Lecture 6666666_Simulation_I.pdf
alcinialbob1234
 
Minions Want to eat presentacion muy linda
Minions Want to eat presentacion muy lindaMinions Want to eat presentacion muy linda
Minions Want to eat presentacion muy linda
CarlaAndradesSoler1
 
Classification_in_Machinee_Learning.pptx
Classification_in_Machinee_Learning.pptxClassification_in_Machinee_Learning.pptx
Classification_in_Machinee_Learning.pptx
wencyjorda88
 
Defense Against LLM Scheming 2025_04_28.pptx
Defense Against LLM Scheming 2025_04_28.pptxDefense Against LLM Scheming 2025_04_28.pptx
Defense Against LLM Scheming 2025_04_28.pptx
Greg Makowski
 
Secure_File_Storage_Hybrid_Cryptography.pptx..
Secure_File_Storage_Hybrid_Cryptography.pptx..Secure_File_Storage_Hybrid_Cryptography.pptx..
Secure_File_Storage_Hybrid_Cryptography.pptx..
yuvarajreddy2002
 
Perencanaan Pengendalian-Proyek-Konstruksi-MS-PROJECT.pptx
Perencanaan Pengendalian-Proyek-Konstruksi-MS-PROJECT.pptxPerencanaan Pengendalian-Proyek-Konstruksi-MS-PROJECT.pptx
Perencanaan Pengendalian-Proyek-Konstruksi-MS-PROJECT.pptx
PareaRusan
 
Flip flop presenation-Presented By Mubahir khan.pptx
Flip flop presenation-Presented By Mubahir khan.pptxFlip flop presenation-Presented By Mubahir khan.pptx
Flip flop presenation-Presented By Mubahir khan.pptx
mubashirkhan45461
 
Thingyan is now a global treasure! See how people around the world are search...
Thingyan is now a global treasure! See how people around the world are search...Thingyan is now a global treasure! See how people around the world are search...
Thingyan is now a global treasure! See how people around the world are search...
Pixellion
 
Conic Sectionfaggavahabaayhahahahahs.pptx
Conic Sectionfaggavahabaayhahahahahs.pptxConic Sectionfaggavahabaayhahahahahs.pptx
Conic Sectionfaggavahabaayhahahahahs.pptx
taiwanesechetan
 
chapter3 Central Tendency statistics.ppt
chapter3 Central Tendency statistics.pptchapter3 Central Tendency statistics.ppt
chapter3 Central Tendency statistics.ppt
justinebandajbn
 
183409-christina-rossetti.pdfdsfsdasggsag
183409-christina-rossetti.pdfdsfsdasggsag183409-christina-rossetti.pdfdsfsdasggsag
183409-christina-rossetti.pdfdsfsdasggsag
fardin123rahman07
 
How to join illuminati Agent in uganda call+256776963507/0741506136
How to join illuminati Agent in uganda call+256776963507/0741506136How to join illuminati Agent in uganda call+256776963507/0741506136
How to join illuminati Agent in uganda call+256776963507/0741506136
illuminati Agent uganda call+256776963507/0741506136
 
Data Science Courses in India iim skills
Data Science Courses in India iim skillsData Science Courses in India iim skills
Data Science Courses in India iim skills
dharnathakur29
 
Geometry maths presentation for begginers
Geometry maths presentation for begginersGeometry maths presentation for begginers
Geometry maths presentation for begginers
zrjacob283
 
Deloitte Analytics - Applying Process Mining in an audit context
Deloitte Analytics - Applying Process Mining in an audit contextDeloitte Analytics - Applying Process Mining in an audit context
Deloitte Analytics - Applying Process Mining in an audit context
Process mining Evangelist
 
Safety Innovation in Mt. Vernon A Westchester County Model for New Rochelle a...
Safety Innovation in Mt. Vernon A Westchester County Model for New Rochelle a...Safety Innovation in Mt. Vernon A Westchester County Model for New Rochelle a...
Safety Innovation in Mt. Vernon A Westchester County Model for New Rochelle a...
James Francis Paradigm Asset Management
 
GenAI for Quant Analytics: survey-analytics.ai
GenAI for Quant Analytics: survey-analytics.aiGenAI for Quant Analytics: survey-analytics.ai
GenAI for Quant Analytics: survey-analytics.ai
Inspirient
 
Day 1 - Lab 1 Reconnaissance Scanning with NMAP, Vulnerability Assessment wit...
Day 1 - Lab 1 Reconnaissance Scanning with NMAP, Vulnerability Assessment wit...Day 1 - Lab 1 Reconnaissance Scanning with NMAP, Vulnerability Assessment wit...
Day 1 - Lab 1 Reconnaissance Scanning with NMAP, Vulnerability Assessment wit...
Abodahab
 
VKS-Python-FIe Handling text CSV Binary.pptx
VKS-Python-FIe Handling text CSV Binary.pptxVKS-Python-FIe Handling text CSV Binary.pptx
VKS-Python-FIe Handling text CSV Binary.pptx
Vinod Srivastava
 
Data Analytics Overview and its applications
Data Analytics Overview and its applicationsData Analytics Overview and its applications
Data Analytics Overview and its applications
JanmejayaMishra7
 
Cleaned_Lecture 6666666_Simulation_I.pdf
Cleaned_Lecture 6666666_Simulation_I.pdfCleaned_Lecture 6666666_Simulation_I.pdf
Cleaned_Lecture 6666666_Simulation_I.pdf
alcinialbob1234
 
Minions Want to eat presentacion muy linda
Minions Want to eat presentacion muy lindaMinions Want to eat presentacion muy linda
Minions Want to eat presentacion muy linda
CarlaAndradesSoler1
 
Classification_in_Machinee_Learning.pptx
Classification_in_Machinee_Learning.pptxClassification_in_Machinee_Learning.pptx
Classification_in_Machinee_Learning.pptx
wencyjorda88
 
Defense Against LLM Scheming 2025_04_28.pptx
Defense Against LLM Scheming 2025_04_28.pptxDefense Against LLM Scheming 2025_04_28.pptx
Defense Against LLM Scheming 2025_04_28.pptx
Greg Makowski
 
Secure_File_Storage_Hybrid_Cryptography.pptx..
Secure_File_Storage_Hybrid_Cryptography.pptx..Secure_File_Storage_Hybrid_Cryptography.pptx..
Secure_File_Storage_Hybrid_Cryptography.pptx..
yuvarajreddy2002
 
Perencanaan Pengendalian-Proyek-Konstruksi-MS-PROJECT.pptx
Perencanaan Pengendalian-Proyek-Konstruksi-MS-PROJECT.pptxPerencanaan Pengendalian-Proyek-Konstruksi-MS-PROJECT.pptx
Perencanaan Pengendalian-Proyek-Konstruksi-MS-PROJECT.pptx
PareaRusan
 
Flip flop presenation-Presented By Mubahir khan.pptx
Flip flop presenation-Presented By Mubahir khan.pptxFlip flop presenation-Presented By Mubahir khan.pptx
Flip flop presenation-Presented By Mubahir khan.pptx
mubashirkhan45461
 
Thingyan is now a global treasure! See how people around the world are search...
Thingyan is now a global treasure! See how people around the world are search...Thingyan is now a global treasure! See how people around the world are search...
Thingyan is now a global treasure! See how people around the world are search...
Pixellion
 
Conic Sectionfaggavahabaayhahahahahs.pptx
Conic Sectionfaggavahabaayhahahahahs.pptxConic Sectionfaggavahabaayhahahahahs.pptx
Conic Sectionfaggavahabaayhahahahahs.pptx
taiwanesechetan
 
chapter3 Central Tendency statistics.ppt
chapter3 Central Tendency statistics.pptchapter3 Central Tendency statistics.ppt
chapter3 Central Tendency statistics.ppt
justinebandajbn
 
183409-christina-rossetti.pdfdsfsdasggsag
183409-christina-rossetti.pdfdsfsdasggsag183409-christina-rossetti.pdfdsfsdasggsag
183409-christina-rossetti.pdfdsfsdasggsag
fardin123rahman07
 
Data Science Courses in India iim skills
Data Science Courses in India iim skillsData Science Courses in India iim skills
Data Science Courses in India iim skills
dharnathakur29
 
Geometry maths presentation for begginers
Geometry maths presentation for begginersGeometry maths presentation for begginers
Geometry maths presentation for begginers
zrjacob283
 
Deloitte Analytics - Applying Process Mining in an audit context
Deloitte Analytics - Applying Process Mining in an audit contextDeloitte Analytics - Applying Process Mining in an audit context
Deloitte Analytics - Applying Process Mining in an audit context
Process mining Evangelist
 
Safety Innovation in Mt. Vernon A Westchester County Model for New Rochelle a...
Safety Innovation in Mt. Vernon A Westchester County Model for New Rochelle a...Safety Innovation in Mt. Vernon A Westchester County Model for New Rochelle a...
Safety Innovation in Mt. Vernon A Westchester County Model for New Rochelle a...
James Francis Paradigm Asset Management
 
Ad

Data Con LA 2022 - Real world consumer segmentation

  • 2. 2 Commercial Notes • Over 1000 global employees • Based in Warsaw, Poland • Leader in using Deep Learning to solve online advertising challenges • A “DSP” for those of you in ad -tech/programmatic Technical Notes • Over 1B bid requests per day • Billions of ads served each year • Millions of clicks and site visits generated each year
  • 3. How well do we really know our users? 3 • Marketing, Operations, and other teams have general ideas about the kind of people who use the app • Analytics had ideas about “best users” that different from views held by other teams
  • 4. Why would we care about this (as analysts)? grow tribal knowledge; challenge existing thought; drive business impact • Product Strategy • What do we build? What do our key user segments need? • Marketing Strategy • Which types of users should we acquire? • What’s the best way to find them? • Finance • Which user profiles lead to better financial performance for the business? 4
  • 5. We started with one -dimensional knowledge Let’s build some basic facts • Everyone knows at least one tool for this job • Excel • SQL • R / Python • Other languages (C++, etc.) 5
  • 6. Univariate review of users is a good start And it can help give ideas for more complex analysis • Your most common user is not necessarily your most valuable user! 6 34% 23% 13% 11% 8% 11% 18-24 25-34 35-44 45-54 55-64 65+ New Users by Age, Jan 2022 3% 8% 13% 20% 25% 31% 18-24 25-34 35-44 45-54 55-64 65+ User Activity by Age, Jan 2022
  • 7. But it’s hard to get the full picture, when you are looking at one color at a time • Let’s move from ETL & EDA to modeling 7
  • 8. We wanted an “unsupervised” learning approach so that we don’t need the answers first Cluster Analysis is a classic choice • Linear and Logistic Regression • Decision Trees • Support Vector Machines • Random Forests 8 Supervised (Classification and Regression) UN-Supervised (Clustering) • K-means clustering • Hierarchical clustering • Association Rules (buy X -> buy Y) • Principal Component Analysis Deep Learning • Could be either • We use supervised to predict which ads will “work”
  • 9. Quick reminder: K-Means clustering creates groups based on the centroid of group members Credit: Wikipedia 9 • Randomly pick N points as initial cluster centroids • Assign each point to closest proposed centroid (remember this!) • Find new centroids based on group assignment • Wash. Rinse. Repeat. (Until convergence)
  • 10. K-means relies on a distance formula, so make sure to normalize data in some way Which features (raw data fields) will drive the analysis? • Age in years (18, 29, 44, 68, etc.) • Gender, encoded as 1/0 • Race, encoded as 1/0 • Household income in $ (50000, etc.) • # of children (0, 1, 2, etc.) • ZIP Code (90210, 10023, etc.) • Years of eduation (16=Bachelors, etc.) 10 Raw Data
  • 11. We transformed by z-score and/or by bucket number Pythonistas: make sklearn.preprocessing.StandardScaler()your friend • Age in years (18, 29, 44, 68, etc.) • Gender, encoded as 1/0 • Race, encoded as 1/0 variables • Household income in $ (20000, 50000, etc) • # of children (0, 1, 2, etc.) • ZIP Code (90210, 10023, etc.) • Years of eduation (12=HS, 16=Bachelors Degree, etc.) 11 Raw Data • Age [z-scored] • Gender, encoded as 1/0 [OK] • Race, encoded as 1/0 [OK] • Household income in [z -scored] • # of children/3 [0, 0.33, 0.66, 1.0] • ZIP Code [dropped] • Years of education [0, 1, 2, 3]
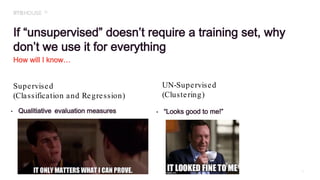
  • 12. If “unsupervised” doesn’t require a training set, why don’t we use it for everything How will I know… • Qualitiative evaluation measures 12 Supervised (Classification and Regression) UN-Supervised (Clustering) • “Looks good to me!”
  • 13. Limited design decisions make k -means clustering user friendly Just tell me how many clusters you want please 13 Less is more • How much gain in consistency by adding another cluster? • Ask the business: how many segments do you think (want to) exist? Elbow Method • Where the curve flattens out 0 500 1,000 1,500 2,000 2,500 3,000 3,500 4,000 4,500 5,000 1 2 3 4 5 6 Sum Squared Distance vs # Clusters Case Study 1 Case Study 2
  • 14. Excellent – so we have a super awesome output with 4 -clusters Is this where we break out the $.drinks.favorite? 14 How do we know if this is of any use?
  • 15. The real fun is just about to begin… 15 Full-stack analysts shine in the interpretation phase Data acquisition, cleaning and other preparation EDA Run Mode l Analytical Interpretation Business Interpretation Business Execution (Not always Analytics’ Job)
  • 16. We can now find all sorts of averages or other summary data points “by cluster number” Let’s learn how the K -means algo made decisions 16 • Which input features differ most across segments? • Are there features that don’t seem to matter? • Did we validate that our choice of encoding didn’t fail us? • Do we sense a primary feature or two that drove segmentation? • Should we re-run with N-1 or N+1 segments? Analytical Interpretation
  • 17. Marketing and business leadership teams should love the insights from cluster analysis ”Segment 2’s average income is 1.6 standard deviations below the mean!” 17 • Can we better align our verbiage with our audience? • Let’s re-skin what we did in terms of how our audience thinks and speaks
  • 18. Instead of specific facts, we found that a holistic view of each segment earned a warmer reception Listing the dominant value of key attributes appealed to business users Now we are starting to get the “look and feel” of each segment (Actual table had 8 -10 key dimensions) 18 Segment Age Income Education Marital Status 1 Boomers (55%) Some GenX/Mill. Top 50% (75%) Some college Married (77%) 2 GenX (35%) Mill (32%) Top 50% (92%) College grads Married (63%) 3 GenX/Mill. (65%) Bottom 50% (88%) Little college Unmarried (59%) 4 Mill. (38%) GenZ (22%) Bottom 50% (68%) Some college Unmarried (82%)
  • 19. Even a rudimentary attempt at working in our audience’s discipline can work magic Who came up with these names? The Data Science team? 19 • First-draft names often stick • Analytics can own internal collateral explaining the work done • Projecting n-dimensions into a 2D graph is a crowd pleaser AGE INCOME Senior Stables Mid-Age Thrivers Mid-Age Laggers Young & Struggling
  • 20. Joining segmentation to average KPIs (in -app actions, purchase behavior, etc.) rounds out the profiles 20 • Analytics created internal collateral with segments and usage/purchase data • Reasonable stopping point for hand -off to Marketing • Python code makes updating segmentation on a regular basis (1x/year or 4x/year) easy to do
  • 21. At this point, we can hand off implementation to other teams (or ourselves) 21 • Marketing to create personas; change targeting for new customer acquisition; brief ad agency • Finance (or Analytics) to understand the total lifetime value (LTV) for each user segment • Product to connect feedback with each user segment • Analytics to develop reporting based on user segments
  • 22. Jaysen Gillespie Head of Analytics and Data Science [email protected] THANK YOU