Data mining , Knowledge Discovery Process, Classification
Download as PPTX, PDF4 likes6,285 views

The document provides an overview of data mining techniques and processes. It discusses data mining as the process of extracting knowledge from large amounts of data. It describes common data mining tasks like classification, regression, clustering, and association rule learning. It also outlines popular data mining processes like CRISP-DM and SEMMA that involve steps of business understanding, data preparation, modeling, evaluation and deployment. Decision trees are presented as a popular classification technique that uses a tree structure to split data into nodes and leaves to classify examples.


![ID3, A DECISION TREE ALGORITHM
Use information gain (entropy) to determine how well an attribute separates the training data
according to the class attribute value
p+ is the proportion of positive examples in D
p- is the proportion of negative examples in D
In a dataset containing ten examples, 7 have a positive class attribute value and 3
have a negative class attribute value [7+, 3-]:
If the numbers of positive and negative examples in the set are equal, then the entropy is 1](https://image.slidesharecdn.com/datamining-170510144216/85/Data-mining-Knowledge-Discovery-Process-Classification-32-320.jpg)


Data mining , Knowledge Discovery Process, Classification
- 2. OUTLINE INTRODUCTİON TO DATA MINING KNOWLEDGE DISCOVERY PROCESS DATA MİNİNG TECHNİCS AND TASKS APPLICATION EXAMPLES CONCLUSİON
- 3. OUTLINE INTRODUCTİON TO DATA MINING KNOWLEDGE DISCOVERY PROCESS DATA MİNİNG TECHNİCS AND TASKS APPLICATION EXAMPLES CONCLUSİON
- 4. Origine of data mining The term "Data Mining" appeared around 1990 in the database community . It Draws ideas from maching learning/ Artificial Intelligence, statistics, data systems and other disciplines. Data mining Artificial Intelligence Machine learning statistics Data systems Other disciplines
- 5. The Explosive Growth of Data: More data is generated: Web, text, images … Business transactions, calls, ... Scientific data: astronomy, biology, etc More data is captured: Storage technology faster and cheaper The abundance of data, coupled with the need for powerful data analysis tools, has been described as a ‘’ data rich but information poor situation’’ Why Data mining? What will I do with these data?
- 6. What is Data Mining? Data Mining is defined as the procedure of extracting information from huge sets of data. In other words, we can say that data mining is mining knowledge from data.
- 7. Why is Data Mining important? Changes in the Business Environment Customers becoming more demanding Markets are saturated. Drivers Focus on the customer, competition, and data assets
- 8. Why is Data Mining important (cont) Credit ratings/targeted marketing: Given a database of 100,000 names, which persons are the least likely to default on their credit cards? Identify likely responders to sales promotions Fraud detection Which types of transactions are likely to be fraudulent, given the demographics and transactional history of a particular customer? Data Mining helps extract such information
- 9. Database Processing vs. Data Mining Processing Query Well defined SQL Query Poorly defined No precise query language Output – Precise –Subset of database Output – Fuzzy –Not a subset of database
- 10. Query Examples Database Data Mining – Find all customers who have purchased milk – Find all items which are frequently purchased with milk. (association rules) – Find all credit applicants with last name of Michael. – Identify customers who have purchased more than $10,000 in the last month. – Find all credit applicants who are poor credit risks. (classification) – Identify customers with similar buying habits. (Clustering)
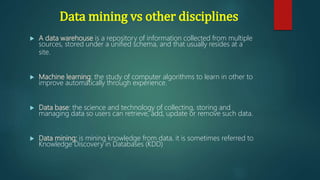
- 11. A data warehouse is a repository of information collected from multiple sources, stored under a unified schema, and that usually resides at a site. Machine learning: the study of computer algorithms to learn in other to improve automatically through experience. Data base: the science and technology of collecting, storing and managing data so users can retrieve, add, update or remove such data. Data mining: is mining knowledge from data. it is sometimes referred to Knowledge Discovery in Databases (KDD) Data mining vs other disciplines
- 12. OUTLINE INTRODUCTİON TO DATA MINING KNOWLEDGE DISCOVERY PROCESS DATA MİNİNG TECHNİCS AND TASKS APPLICATION EXAMPLES CONCLUSİON
- 13. Data Mining vs. KDD Knowledge Discovery in Databases (KDD): is the process of finding useful information and patterns in data. Data mining is one of the tasks in the process of knowledge discovery from the database. It is the Use of algorithms to extract the information and patterns derived by the KDD process.
- 15. Selection: Obtain data from various sources. Pre processing: Cleanse data Transformation: Convert to common format. Transform to new format. Data mining: apply algorithms to the data to find the patterns and evaluate patterns of discovered knowledge. Interpretation: Present results to user in meaningful manner. KDD PROCESS ( continued)
- 16. CRISP-DM PROCESS MODEL It is a data mining process model that describes commonly used approaches that data mining experts use to tackle problems. CRISP-DM breaks the process of data mining into six major phases: BUSINESS UNDERSTANDING: This is the first phase of CRISP-DM process which focuses on and uncovers important factors including success criteria, business and data mining objectives and requirements as well as business terminologies and technical terms. DATA UNDERSTANDING: This is the second phase of CRISP-DM process which focuses on data collection, checking quality and exploring of data to get insight of data to form hypotheses for hidden information. DATA PREPARATION: This phase focuses on selection and preparation of final data set. This phase may include many tasks records, table and attributes selection as well as cleaning and transformation of data. MODELING: This is the fourth phase of CRISP-DM process selection and application of various modeling techniques. Different parameters are set and different models are built for same data mining problem. EVALUATION: The process which focuses on evaluation of obtained models and deciding of how to use the results. Interpretation of the model depends upon the algorithm and models can be evaluated to review whether achieves the objectives properly or not. DEPLOYMENT:This phase focuses on determining the use of obtain knowledge and results.ıt also focuses on organizing, reporting and presenting the gained knowledge when needed. (CRoss-Industry Standard Process for Data Mining)
- 17. Illustration
- 18. SEMMA PROCESS MODEL It offers and allows understanding, organization, development and maintenance of data mining projects. It helps in providing the solutions for business problems and goals. Sample: This stage consists on sampling the data by extracting a portion of a large data set big enough to contain the significant information, yet small enough to manipulate quickly. This stage is pointed out as being optional. Explore: This stage consists on the exploration of the data by searching for unanticipated trends and anomalies in order to gain understanding and ideas. Modify: This stage consists on the modification of the data by creating, selecting, and transforming the variables to focus the model selection process. Model: This stage consists on modeling the data by allowing the software to search automatically for a combination of data that reliably predicts a desired outcome. Assess: This stage consists on assessing the data by evaluating the usefulness and reliability of the findings from the data mining process and estimate how well it performs. (Sample, Explore, Modify, Model, and Access)
- 19. Illustration
- 20. OUTLINE INTRODUCTİON TO DATA MINING KNOWLEDGE DISCOVERY PROCESS DATA MİNİNG TECHNİCS AND TASKS APPLICATION EXAMPLES CONCLUSİON
- 21. Data Mining DescriptivePredictive classification regression Time Series Analysis prediction clustering summarization Association rules Sequence Discovery Data Mining Task Predictive model are used to predict about unknown values from known values. Descriptive model are used to find human- interpretable patterns that describe the data
- 22. Common Data Mining Tasks Data mining involves six common classes of tasks Data mining involves six common classes of tasks. Classification: is the task of generalizing known structure to apply to new data. Regression: is used to map a data item to a real valued prediction variable. Clustering: is the task of discovering groups and structures in the data that are in some way or another "similar", without using known structures in the data Association Rules learning : Searches for relationships between variables Anomaly detection: The identification of unusual data records, that might be interesting or data errors that require further investigation Summarization: providing a more compact representation of the data set, including visualization and report generation.
- 24. Classification Classification is the process of finding a model that describes the data classes or concepts. Goal of classification is to build structures from examples of past decisions that can be used to make decisions for unseen cases. For example, we want to classify an e- mail as "legitimate" or "spam"
- 25. CLASSIFICATION: THE PROCESS In classification, we are given a set of labeled examples These examples are records/instances in the format (x, y) where x is a vector and y is the class attribute, commonly a scalar The classification task is to build model that maps x to y Our task is to find a mapping f such that f(x) = y
- 27. CLASSIFICATION: AN EMAIL EXAMPLE A set of emails is given where users have manually identified spam versus non-spam Our task is to use a set of features such as words in the email (x) to identify spam/non-spam status of the email (y) In this case, classes are y = {spam, non-spam} What would it be dealt with in a social setting?
- 28. Classification methods Decision tree learning Naive Bayes learning K-nearest neighbor classifier ….
- 29. Decision tree Decision tree is a classifier in the form of a tree structure. It consists of nodes, branches and leaves. The top node is called the root node. The tree always starts from the root node and grows down by splitting the data at each level into new nodes. The root node contains the entire data set (all data records), and child nodes hold respective subsets of that set. All nodes are connected by branches. Nodes that are at the end of branches are called terminal nodes, or leaves.
- 30. Illustration Root Node Leaf Node Leaf Node Branches Set of possible answers Set of possible answers
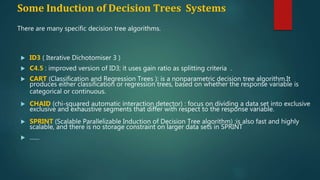
- 31. Some Induction of Decision Trees Systems ID3 ( Iterative Dichotomiser 3 ) C4.5 : improved version of ID3; it uses gain ratio as splitting criteria . CART (Classification and Regression Trees ): is a nonparametric decision tree algorithm.It produces either classification or regression trees, based on whether the response variable is categorical or continuous. CHAID (chi-squared automatic interaction detector) : focus on dividing a data set into exclusive exclusive and exhaustive segments that differ with respect to the response variable. SPRINT (Scalable Parallelizable Induction of Decision Tree algorithm) :is also fast and highly scalable, and there is no storage constraint on larger data sets in SPRINT …… There are many specific decision tree algorithms.
- 32. ID3, A DECISION TREE ALGORITHM Use information gain (entropy) to determine how well an attribute separates the training data according to the class attribute value p+ is the proportion of positive examples in D p- is the proportion of negative examples in D In a dataset containing ten examples, 7 have a positive class attribute value and 3 have a negative class attribute value [7+, 3-]: If the numbers of positive and negative examples in the set are equal, then the entropy is 1
- 33. DECISION TREE: EXAMPLE 1 outlook temperature humidity windy play sunny 85 85 FALSE no sunny 80 90 TRUE no overcast 83 86 FALSE yes rainy 70 96 FALSE yes rainy 68 80 FALSE yes rainy 65 70 TRUE no overcast 64 65 TRUE yes sunny 72 95 FALSE no sunny 69 70 FALSE yes rainy 75 80 FALSE yes sunny 75 70 TRUE yes overcast 72 90 TRUE yes overcast 81 75 FALSE yes rainy 71 91 TRUE no
- 34. DECISION TREE: EXAMPLE 2 Learned Decision Tree 1 Learned Decision Tree 2 Class Labels
- 35. Decision Tree Advantages and Limitations Advantages: Easy to understand. Easy to generate rules limitations: May suffer from over fitting. Handling of missing and inconsistent data, they can produce reliable outcomes only when they deal with “clean” data. …. Despite all the limitations, decision trees have become the most successful technology used for data mining
- 36. BAYESIAN CLASSIFICATION Probabilistic prediction: Predict multiple hypotheses, weighted by their probabilities. Standard: Even when Bayesian methods are computationally intractable, they can provide a standard of optimal decision making against which other methods can be measured
- 37. NAIVE BAYES CLASSIFIER The probabilistic model of NBC is to find the probability of a certain class given multiple disjoint (assumed) events. class variable the instance features Then class attribute value for instance X Assuming that variables are independent
- 38. ILLUSTRATION
- 39. K-Nearest Neighbor KNN is a simple algorithm that stores all available cases and classifies new cases based on a similarity measure. k-nearest neighbor employs the neighbors of a data point to perform classification The instance being classified is assigned the label that the majority of k neighbors’ labels When k = 1, the closest neighbor’s label is used as the predicted label for the instance being classified For determining the neighbors, distance is computed based on some distance metric, e.g., Euclidean distance
- 40. KNN Illustration $0 $50,000 $100,000 $150,000 $200,000 $250,000 0 20 40 60 80 Non-Default Default Age Loan$
- 41. KNN Classification – Distance Age Loan Default Distance 25 $40,000 N 102000 35 $60,000 N 82000 45 $80,000 N 62000 20 $20,000 N 122000 35 $120,000 N 22000 52 $18,000 N 124000 23 $95,000 Y 47000 40 $62,000 Y 80000 60 $100,000 Y 42000 48 $220,000 Y 78000 33 $150,000 Y 8000 48 $142,000 ? 2 21 2 21 )()( yyxxD Euclidean Distance
- 42. KNN Classification – Standardized Distance Age Loan Default Distance 0.125 0.11 N 0.7652 0.375 0.21 N 0.5200 0.625 0.31 N 0.3160 0 0.01 N 0.9245 0.375 0.50 N 0.3428 0.8 0.00 N 0.6220 0.075 0.38 Y 0.6669 0.5 0.22 Y 0.4437 1 0.41 Y 0.3650 0.7 1.00 Y 0.3861 0.325 0.65 Y 0.3771 0.7 0.61 ? MinMax MinX Xs Standardized Variable
- 43. KNN Regression - Distance Age Loan House Price Index Distance 25 $40,000 135 102000 35 $60,000 256 82000 45 $80,000 231 62000 20 $20,000 267 122000 35 $120,000 139 22000 52 $18,000 150 124000 23 $95,000 127 47000 40 $62,000 216 80000 60 $100,000 139 42000 48 $220,000 250 78000 33 $150,000 264 8000 48 $142,000 ? 2 21 2 21 )()( yyxxD
- 44. KNN Regression – Standardized Distance Age Loan House Price Index Distance 0.125 0.11 135 0.7652 0.375 0.21 256 0.5200 0.625 0.31 231 0.3160 0 0.01 267 0.9245 0.375 0.50 139 0.3428 0.8 0.00 150 0.6220 0.075 0.38 127 0.6669 0.5 0.22 216 0.4437 1 0.41 139 0.3650 0.7 1.00 250 0.3861 0.325 0.65 264 0.3771 0.7 0.61 ? MinMax MinX Xs
- 45. KNN – Number of Neighbors If K=1, select the nearest neighbor If K>1, For classification select the most frequent neighbor. For regression calculate the average of K neighbors.
- 46. KNN - Applications Classification and Interpretation legal, medical, news, banking Problem-solving planning, pronunciation Function learning dynamic control
- 47. KNN Advantages/limitation Advantages : Can be applied to the data from any distribution for example, data does not have to be separable with a linear boundary Very simple and intuitive ….. limitation Choosing k may be tricky Need large number of samples for accuracy
- 48. Classification: other approaches Support Vector Machines algorithm is supervised learning model with associated learning algorithms that analyze data and recognize patterns, which is based on statistical learning theory. Rules: The extraction of useful if-then rules from data based on statistical significance Genetic Algorithms: Optimization techniques that use processes such as genetic combination, mutation, and natural selection in a design based on the concepts of natural evolution. … 48
- 49. 2. Regression Predict future values based on past values. Linear Regression assumes linear relationship exists. y = c0 + c1 x1 + … + cn xn Find values to best fit the data.
- 50. REGRESSION Regression analysis includes techniques of modeling and analyzing the relationship between a dependent variable and one or more independent variables Regression analysis is widely used for prediction and forecasting It can be used to infer relationships between the independent and dependent variables.
- 51. LINEAR REGRESSION: EXAMPLE Years of experience Salary ($K) 3 30 8 57 9 64 13 72 3 36 6 43 11 59 21 90 1 20 16 83
- 52. Clustering
- 53. CLUSTERING Clustering is a form of unsupervised learning Clustering algorithms group together similar items It is a technique for grouping together items that are similar in some way – according to some criteria.
- 55. 55 Example Example input database: Two numerical variables. Age Salary 20 40 25 50 24 45 23 50 40 80 45 85 42 87 35 82 70 30 Customer Demographics 0 10 20 30 40 50 60 70 80 90 100 0 20 40 60 80 Age Salaryin$10K Customers
- 56. Clustering algorithms Distance-based algorithms • K-Means Hierarchical algorithms …
- 57. K-MEANS It partitions the given data into k clusters and each cluster has a cluster center, called centroid.
- 58. HIERARCHICAL CLUSTERING Hierarchical clustering is a method of cluster analysis which seeks to build a hierarchy of clusters. Strategies for hierarchical clustering generally fall into two types: Agglomerative: This is a "bottom up" approach: each observation starts in its own cluster, and pairs of clusters are merged as one moves up the hierarchy. Divisive: This is a "top down" approach: all observations start in one cluster, and splits are performed recursively as one moves down the hierarchy.
- 59. ILLUSTRATION
- 60. Clustering Application Market Segmentation: Goal: subdivide a market into distinct subsets of customers where any subset may conceivably be selected as a market target to be reached with a distinct marketing mix. Document Clustering: Goal: To find groups of documents that are similar to each other based on the important terms appearing in them. Biology: categorize genes with similar functionalities. ……
- 61. Association Rules TID Produce 1 MILK, BREAD, EGGS 2 BREAD, SUGAR 3 BREAD, CEREAL 4 MILK, BREAD, SUGAR 5 MILK, CEREAL 6 BREAD, CEREAL 7 MILK, CEREAL 8 MILK, BREAD, CEREAL, EGGS 9 MILK, BREAD, CEREAL 61 Transactions Frequent Itemsets: Milk, Bread (4) Bread, Cereal (3) Milk, Bread, Cereal (2) … Rules: Milk => Bread (66%) Techniques that employ association search all details from operational systems for patterns with a high probability of repetition Example: Market Basket Analysis
- 62. Association Rule Discovery: Application Supermarket shelf management: To identify items that are bought together by sufficiently many customers.
- 63. Visualization Visualizing the data to facilitate human discovery Presenting the discovered results in a visually "nice" way. 63 İllustration
- 64. Visualization techniques Geometric techniques: scatterplots matrices, Hyperslice, parallel coordinates Pixel-oriented techniques: simple line-by-line, spiral and circle segments Hierarchical techniques: Treemap, cone trees Graph-based techniques: 2D and 3D graph Distortion techniques: hyperbolic tree, fisheye view, perspective wall User interaction: brushing, linking, dynamic projections and rotations, dynamic queries
- 65. Advantages of visualization techniques • Visual data exploration can easily deal with very large, highly non homogeneous and noisy amount of data • Visual data exploration requires no understanding of complex mathematical or statistical algorithms • Visualization techniques provide a qualitative overview useful for further quantitative analysis
- 66. Summarization 66 Abstraction or generalization of data resulting in a smaller set which gives general overview of a data.
- 67. Data mining software tools Orange Weka Rattle GUI RapidMiner …..
- 68. OUTLINE INTRODUCTİON TO DATA MINING KNOWLEDGE DISCOVERY PROCESS DATA MİNİNG TECHNİCS AND TASKS APPLICATION EXAMPLES CONCLUSİON
- 69. Applications Banking: loan/credit card approval predict good customers based on old customers Customer relationship management: identify those who are likely to leave for a competitor. Targeted marketing: identify likely responders to promotions Fraud detection: telecommunications, financial transactions from an online stream of event identify fraudulent events Manufacturing and production: automatically adjust knobs when process parameter changes
- 70. Applications (continued) Medicine: disease outcome, effectiveness of treatments analyze patient disease history: find relationship between diseases Molecular/Pharmaceutical: identify new drugs Scientific data analysis: identify new galaxies by searching for sub clusters Web site/store design and promotion: find affinity of visitor to pages and modify layout
- 71. OUTLINE INTRODUCTİON TO DATA MINING KNOWLEDGE DISCOVERY PROCESS DATA MİNİNG TECHNİCS AND TASKS APPLICATION EXAMPLES CONCLUSİON
- 72. Conclusion Data mining: discovering interesting knowledge from large amounts of data . A KDD process includes data selection , transformation, data mining, pattern evaluation, and knowledge presentation
- 74. Next time Some Data mining applications in details Data warehousing process and data mining Other details…
- 75. Additional Resources 1. http://www.twocrows.com/glossary.htm, “Two Crows, Data Mining Glossary” 2. http://en.wikipedia.org/wiki/Data_mining, “Wikipedia” 3. http://phoenix.phys.clemson.edu/tutorials/excel/regression.html 4. http://wwwmaths.anu.edu.au/~steve/pdcn.pdf 5. Data Mining and Knowledge Discovery 6. www.KDnuggets.com