Data Visualization Strategies & Open Source Tools
12 likes2,265 views

Presentation for RefreshDC providing an overview of data visualization strategies and a variety of open source tools to accomplish your goals. The event was made possible by AARP and LivingSocial.


![Open Source Software and Libraries: Practical Applications [panel discussion]](https://cdn.slidesharecdn.com/ss_thumbnails/open-source-software-and-libraries-practical-applications-panel-discussion-1192487042821242-5-thumbnail.jpg?width=560&fit=bounds)


More Related Content
Viewers also liked (19)
Similar to Data Visualization Strategies & Open Source Tools (20)


More from Phase2 (20)


Recently uploaded (20)


Data Visualization Strategies & Open Source Tools
- 1. #dcdataviz Dave Leonard, Phase2 Technology
- 2. What I Do Solutions Architect at Phase2 working on #dcdataviz
- 3. What I Do Solutions Architect at Phase2 working on • • Requirements ElicitationUser Exp and Info Arch Customer Training • • Drupal Consulting • Content Migration Planning Stuff (QA) • Break #dcdataviz
- 4. What I Don’t Do #dcdataviz
- 5. What I Don’t Do Write code Act pretentious #dcdataviz
- 6. Why We’re Here Data visualization concepts, strategies, examples and tools (primarily open-source) #dcdataviz
- 7. The Challenge Massive amounts of data becoming available, how do we make sense of it all? #dcdataviz
- 8. The Challenge Massive amounts of data becoming available, how do we make sense of it all? Semantic Web Open Better Methods Government (i.e. APIs) and Other #dcdataviz
- 9. Data vs Display “What” variables were measured vs “how” you visually represent them #dcdataviz
- 10. Types of Data Quantitative and qualitative #dcdataviz Data vs Display
- 11. Quantitative Data Precise, standardized numerical measurements #dcdataviz Data vs Display
- 12. Quantitative Data Precise, standardized numerical measurements 3.75 mph 98° 17’ 15” N, 45° 9.85 mi average 10’ 6” W #dcdataviz Data vs Display
- 13. Qualitative Data Categorical data with varying degrees of precision #dcdataviz Data vs Display
- 14. Qualitative Data Categorical data with varying degrees of precision 40% of Arlington 60% of 87% of DC residents are Arlington residents satisfied with their residents vote living situation #dcdataviz Data vs Display
- 15. Using Qualitative Data Establish a quantifiable spectrum for collection and presentation #dcdataviz Data vs Display
- 16. Using Qualitative Data Establish a quantifiable spectrum for collection andhow satisfied are On a 1 - 10 scale, presentation you with living in Arlington? (1 = not satisfied, 5 = somewhat satisfied, 10 = extremely satisfied) #dcdataviz Data vs Display
- 17. Display “How” dimensions are visually represented (other than text) #dcdataviz Data vs Display
- 18. Display “How” dimensions are visually represented (other than text) Width Position Color* Icons Length Radius Opacity Shapes #dcdataviz Data vs Display
- 19. Data + Display Mapping data dimensions to visual representations intuitively #dcdataviz
- 20. FATA: Inside Pakistan’s Tribal Regions http://preparedness.interaction.org/ #dcdataviz Data + Display
- 21. FATA: Inside Pakistan’s Tribal Regions http://preparedness.interaction.org/ #dcdataviz Data + Display
- 22. Visual Noise Excessive visual stimuli that distract from the intended purpose #dcdataviz
- 23. #dcdataviz Visual Noise
- 24. “ The most important consideration when designing for efficiency is that every bit of visual content will make it take longer to find any particular element in thefrom “Beautiful - Noah Iliinsky, excerpted visualization. Visualization: How To Make it Efficient” http://is.gd/Qc1BWF #dcdataviz Visual Noise
- 25. #dcdataviz Visual Noise
- 26. #dcdataviz Visual Noise
- 27. #dcdataviz Visual Noise
- 28. #dcdataviz Visual Noise
- 29. “ You’re showing me a lot, but what are you trying to say?Your Brain, excerpted from “Why Should I - Care About What I’m Looking At?” #dcdataviz Visual Noise
- 30. #dcdataviz Visual Noise
- 31. #dcdataviz Visual Noise
- 32. #dcdataviz Visual Noise
- 33. #dcdataviz Visual Noise
- 34. #dcdataviz Visual Noise
- 35. #dcdataviz Visual Noise
- 36. #dcdataviz Visual Noise
- 37. #dcdataviz Visual Noise
- 38. Presentations Demonstrative vs investigative visualizations #dcdataviz
- 39. Presentations Demonstrative vs investigative visualizations Less More User User Demonstrative Investigative #dcdataviz
- 40. Demonstrative AUTHOR dictates your conclusions #dcdataviz
- 41. #dcdataviz Demonstrative Presentations
- 42. #dcdataviz Demonstrative Presentations
- 43. #dcdataviz Demonstrative Presentations
- 44. #dcdataviz Demonstrative Presentations
- 45. #dcdataviz Demonstrative Presentations
- 46. Investigative Empowering YOU to draw your own conclusions #dcdataviz
- 47. #dcdataviz Investigative Presentations
- 48. #dcdataviz Investigative Presentations
- 49. #dcdataviz Investigative Presentations
- 50. #dcdataviz Investigative Presentations
- 51. #dcdataviz Investigative Presentations
- 52. #dcdataviz Investigative Presentations
- 53. #dcdataviz Investigative Presentations
- 54. Pave The Way Compelling demonstration spurs investigation #dcdataviz
- 55. #dcdataviz Pave The Way
- 56. #dcdataviz Pave The Way
- 57. #dcdataviz Pave The Way
- 58. #dcdataviz Pave The Way
- 59. #dcdataviz Pave The Way
- 60. #dcdataviz Pave The Way
- 61. #dcdataviz Pave The Way
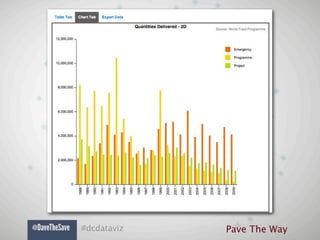
- 62. Tools Used amCharts - Flash and Javascript/HTML5 #dcdataviz Pave The Way
- 63. Tools Used amCharts - Flash and Javascript/HTML5 #dcdataviz Pave The Way
- 64. Tools Used amCharts - Flash and Javascript/HTML5 #dcdataviz Pave The Way
- 65. Open Source Effective presentations built using freely-available, collaborative code #dcdataviz
- 66. Mapping Using open source tools #dcdataviz
- 67. #dcdataviz Open Source Mapping
- 68. #dcdataviz Open Source Mapping
- 69. #dcdataviz Open Source Mapping
- 70. #dcdataviz Open Source Mapping
- 71. #dcdataviz Open Source Mapping
- 72. #dcdataviz Open Source Mapping
- 73. #dcdataviz Open Source Mapping
- 74. #dcdataviz Open Source Mapping
- 75. #dcdataviz Open Source Mapping
- 76. #dcdataviz Open Source Mapping
- 77. Tools #dcdataviz Open Source Mapping
- 78. Tools MapBox, TileMill, and Tilestream Highlighted Features: • Attractive, custom tile designs • Cloud-based storage/delivery of tiles • iPad compatibility for offline viewing Learn More: #dcdataviz Open Source Mapping
- 80. #dcdataviz Open Source Mapping
- 81. #dcdataviz Open Source Mapping
- 82. #dcdataviz Open Source Mapping
- 83. #dcdataviz More MapBox
- 84. #dcdataviz More MapBox
- 85. #dcdataviz More MapBox
- 86. #dcdataviz More MapBox
- 87. #dcdataviz More MapBox
- 89. #dcdataviz Open Source Charting
- 90. Candlestick Chart #dcdataviz Open Source Charting
- 91. Tools jqPlot - A plotting and charting plugin for the jQuery Javascript framework Highlighted Candlestick Chart Code Sample: Features: • Tool tip support • Drag and drop of data points in UI • Computed trend lines Learn More: #dcdataviz Open Source Charting
- 93. #dcdataviz Open Source Trending
- 94. #dcdataviz Open Source Trending
- 95. #dcdataviz Open Source Trending
- 96. #dcdataviz Open Source Trending
- 97. #dcdataviz Open Source Trending
- 98. Tools Used flot - jQuery-based Javascript library Highlighted Learn More: Features: http://code.google.com/p/flot • Drupal integration via Flot module Development Seed Blog Post http://is.gd/LvYXsM • Interactive charts with tooltip support • Panning and zooming capabilities #dcdataviz Open Source Trending
- 100. #dcdataviz Open Source Timelines
- 101. Timeplot - SIMILE Project #dcdataviz Open Source Timelines
- 102. Timeplot - SIMILE Project #dcdataviz Open Source Timelines
- 103. Tools Used Timeplot - DHTML/AJAX-based widget for plotting time series and overlay time-based Highlighted Code Sample: Features: • Timelines • Graphing • Layering of event timelines with data trending Learn More: #dcdataviz Open Source Timelines
- 105. #dcdataviz Open Source Infographics
- 106. #dcdataviz Open Source Infographics
- 107. #dcdataviz Open Source Infographics
- 108. Wrap-Up #dcdataviz
- 109. Takeaways #dcdataviz
- 110. Takeaways • Know your audience and be realistic about #dcdataviz
- 111. Takeaways • Know your audience and be realistic about • Plan your presentation, THEN figure out what tools you need to execute it. #dcdataviz
- 112. Takeaways • Know your audience and be realistic about • Plan your presentation, THEN figure out what tools you need to execute it. • Attractive visuals are useless without clearly- defined and executed goals #dcdataviz
- 113. Takeaways • Know your audience and be realistic about • Plan your presentation, THEN figure out what tools you need to execute it. • Attractive visuals are useless without clearly- defined and executed goals • An abundance of highly-capable, open-source tools is available for you to use and improve. #dcdataviz
- 114. Thank You! Thanks to all who attended, and to these organizations who made this possible: #dcdataviz
Editor's Notes
- #2: Welcome, and thanks for coming out this evening.\n\nI haven’t had the pleasure of meeting many of you, so I’d like to start off by introducing myself so that you have an idea of where I’m coming from.\n
- #3: My formal education was in biological engineering, but I’ve always had an interest in information technology. \n\nMy first job out of school was working at a DNA lab helping to build custom software used for automated sample tracking and profile extraction.\n\nMy current job primarily involves eliciting requirements, driving stakeholder consensus, exposing risks and dependencies, defining the nature of user interactions, laying the groundwork for information architecture, and generally laying the tracks out in front of our developers so that they can proceed unencumbered.\n
- #4: My formal education was in biological engineering, but I’ve always had an interest in information technology. \n\nMy first job out of school was working at a DNA lab helping to build custom software used for automated sample tracking and profile extraction.\n\nMy current job primarily involves eliciting requirements, driving stakeholder consensus, exposing risks and dependencies, defining the nature of user interactions, laying the groundwork for information architecture, and generally laying the tracks out in front of our developers so that they can proceed unencumbered.\n
- #5: My formal education was in biological engineering, but I’ve always had an interest in information technology. \n\nMy first job out of school was working at a DNA lab helping to build custom software used for automated sample tracking and profile extraction.\n\nMy current job primarily involves eliciting requirements, driving stakeholder consensus, exposing risks and dependencies, defining the nature of user interactions, laying the groundwork for information architecture, and generally laying the tracks out in front of our developers so that they can proceed unencumbered.\n
- #6: I’m not a developer, but I have a natural curiosity and want to know how things work on a conceptual level.\n\nI’m here to talk about things I’ve learned, trends I’m seeing, and experiences I’ve had.\n\nMy goal is to make sure that everyone here leaves with something tangible that they can use, or a perspective that helps them think about things a different way.\n
- #7: I’m not a developer, but I have a natural curiosity and want to know how things work on a conceptual level.\n\nI’m here to talk about things I’ve learned, trends I’m seeing, and experiences I’ve had.\n\nMy goal is to make sure that everyone here leaves with something tangible that they can use, or a perspective that helps them think about things a different way.\n
- #8: \n
- #9: \n
- #10: \n
- #11: \n
- #12: \n
- #13: \n
- #14: \n
- #15: \n
- #16: \n
- #17: \n
- #18: \n
- #19: \n
- #20: \n
- #21: \n
- #22: \n
- #23: \n
- #24: \n
- #25: \n
- #26: \n
- #27: \n
- #28: \n
- #29: \n
- #30: Degree of Satisfaction = Bar Color\nNumber of Respondents = Bar Width\n
- #31: Number of Drone Strikes ➔ Radius + Opacity\nPakistani Support for Drone Strikes ➔ Saturation\nPresident who Ordered Drone Strikes ➔ Color \n
- #32: \n
- #33: Don’t blame your data, blame your design.\n
- #34: Don’t blame your data, blame your design.\n
- #35: Don’t blame your data, blame your design.\n
- #36: Don’t blame your data, blame your design.\n
- #37: \n
- #38: \n
- #39: \n
- #40: \n
- #41: \n
- #42: \n
- #43: Here’s a resume that was done as an infographic. Pretty cool idea, right?\n\nApologies in advance to Michael, because I’m going to pick on him a bit.\n\nWhat are we trying to prove here? Maybe this is unintentionally revealing?\n
- #44: Here’s a resume that was done as an infographic. Pretty cool idea, right?\n\nApologies in advance to Michael, because I’m going to pick on him a bit.\n\nWhat are we trying to prove here? Maybe this is unintentionally revealing?\n
- #45: Here’s a resume that was done as an infographic. Pretty cool idea, right?\n\nApologies in advance to Michael, because I’m going to pick on him a bit.\n\nWhat are we trying to prove here? Maybe this is unintentionally revealing?\n
- #46: Here’s a resume that was done as an infographic. Pretty cool idea, right?\n\nApologies in advance to Michael, because I’m going to pick on him a bit.\n\nWhat are we trying to prove here? Maybe this is unintentionally revealing?\n
- #47: Here’s a resume that was done as an infographic. Pretty cool idea, right?\n\nApologies in advance to Michael, because I’m going to pick on him a bit.\n\nWhat are we trying to prove here? Maybe this is unintentionally revealing?\n
- #48: Is this Noise?\n\nDepends on the context of the audience and how the content is delivered.\n\nIf you are already in a particular station, you probably see a “you are here” symbol on the map.\n\nYou are being exposed to this because you need to figure out where you are going, thus the risk of losing the reader’s attention is relatively low.\n\nZoom in on a region\n\nThis map emphasizes the different lines as well as the stations on each line. Also important are the zones crossed, which are shown subtly as alternating gray and white regions.\n\nAn interactive version would allow for reduction of clutter. Thinks like bicycle parking and car ports would only be toggled on by those who need that information.\n
- #49: Is this Noise?\n\nDepends on the context of the audience and how the content is delivered.\n\nIf you are already in a particular station, you probably see a “you are here” symbol on the map.\n\nYou are being exposed to this because you need to figure out where you are going, thus the risk of losing the reader’s attention is relatively low.\n\nZoom in on a region\n\nThis map emphasizes the different lines as well as the stations on each line. Also important are the zones crossed, which are shown subtly as alternating gray and white regions.\n\nAn interactive version would allow for reduction of clutter. Thinks like bicycle parking and car ports would only be toggled on by those who need that information.\n
- #50: Is this Noise?\n\nDepends on the context of the audience and how the content is delivered.\n\nIf you are already in a particular station, you probably see a “you are here” symbol on the map.\n\nYou are being exposed to this because you need to figure out where you are going, thus the risk of losing the reader’s attention is relatively low.\n\nZoom in on a region\n\nThis map emphasizes the different lines as well as the stations on each line. Also important are the zones crossed, which are shown subtly as alternating gray and white regions.\n\nAn interactive version would allow for reduction of clutter. Thinks like bicycle parking and car ports would only be toggled on by those who need that information.\n
- #51: Is this Noise?\n\nDepends on the context of the audience and how the content is delivered.\n\nIf you are already in a particular station, you probably see a “you are here” symbol on the map.\n\nYou are being exposed to this because you need to figure out where you are going, thus the risk of losing the reader’s attention is relatively low.\n\nZoom in on a region\n\nThis map emphasizes the different lines as well as the stations on each line. Also important are the zones crossed, which are shown subtly as alternating gray and white regions.\n\nAn interactive version would allow for reduction of clutter. Thinks like bicycle parking and car ports would only be toggled on by those who need that information.\n
- #52: Is this Noise?\n\nDepends on the context of the audience and how the content is delivered.\n\nIf you are already in a particular station, you probably see a “you are here” symbol on the map.\n\nYou are being exposed to this because you need to figure out where you are going, thus the risk of losing the reader’s attention is relatively low.\n\nZoom in on a region\n\nThis map emphasizes the different lines as well as the stations on each line. Also important are the zones crossed, which are shown subtly as alternating gray and white regions.\n\nAn interactive version would allow for reduction of clutter. Thinks like bicycle parking and car ports would only be toggled on by those who need that information.\n
- #53: \n
- #54: \n
- #55: \n
- #56: \n
- #57: \n
- #58: \n
- #59: \n
- #60: \n
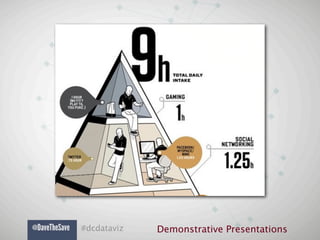
- #61: Daily Media Diet - Wired Magazine\nhttp://is.gd/IrRoHZ\n
- #62: Daily Media Diet - Wired Magazine\nhttp://is.gd/IrRoHZ\n
- #63: Daily Media Diet - Wired Magazine\nhttp://is.gd/IrRoHZ\n
- #64: Demonstrations can be interactive in a literal sense, in that you can touch/feel/use them.\n\nEuclidian solid geometry visualization shown in Tufte’s “Beautiful Evidence”\n
- #65: \n
- #66: Akamai Real-Time Global Network Traffic Monitorhttp://is.gd/1Oueyq\n\nAuthor doesn’t have a specific conclusion in mind beforehand (except maybe “there are a lot more attacks than you think there are) since this is real-time data. \n\nYou draw your own conclusions from it...for example “it looks like recent network attacks are most concentrated on the eastern seaboard.”\n
- #67: Akamai Real-Time Global Network Traffic Monitorhttp://is.gd/1Oueyq\n\nAuthor doesn’t have a specific conclusion in mind beforehand (except maybe “there are a lot more attacks than you think there are) since this is real-time data. \n\nYou draw your own conclusions from it...for example “it looks like recent network attacks are most concentrated on the eastern seaboard.”\n
- #68: Akamai Real-Time Global Network Traffic Monitorhttp://is.gd/1Oueyq\n\nAuthor doesn’t have a specific conclusion in mind beforehand (except maybe “there are a lot more attacks than you think there are) since this is real-time data. \n\nYou draw your own conclusions from it...for example “it looks like recent network attacks are most concentrated on the eastern seaboard.”\n
- #69: Akamai Real-Time Global Network Traffic Monitorhttp://is.gd/1Oueyq\n\nAuthor doesn’t have a specific conclusion in mind beforehand (except maybe “there are a lot more attacks than you think there are) since this is real-time data. \n\nYou draw your own conclusions from it...for example “it looks like recent network attacks are most concentrated on the eastern seaboard.”\n
- #70: Akamai Real-Time Global Network Traffic Monitorhttp://is.gd/1Oueyq\n\nAuthor doesn’t have a specific conclusion in mind beforehand (except maybe “there are a lot more attacks than you think there are) since this is real-time data. \n\nYou draw your own conclusions from it...for example “it looks like recent network attacks are most concentrated on the eastern seaboard.”\n
- #71: \n
- #72: \n
- #73: \n
- #74: How do you cater to the average attention span while still allowing those who are interested to really dive deep?\n
- #75: \n
- #76: \n
- #77: \n
- #78: \n
- #79: \n
- #80: \n
- #81: \n
- #82: \n
- #83: \n
- #84: \n
- #85: \n
- #86: Here are some screenshots from a chart editing UI that someone like myself might use to work with a client to design a chart to be implemented.\n
- #87: Here are some screenshots from a chart editing UI that someone like myself might use to work with a client to design a chart to be implemented.\n
- #88: Here are some screenshots from a chart editing UI that someone like myself might use to work with a client to design a chart to be implemented.\n
- #89: \n
- #90: \n
- #91: Pandemic Preparedness map for joint project of InterAction and USAID, showing public health programs in vulnerable areas.\n\nhttp://preparedness.interaction.org/\n\nMap created by Development Seed, an open source development company that focuses on building communication and visualization tools.\n\nWe work with Development Seed on several projects. I worked closely with them on the World Food Programme’s main site, wfp.org.\n\n\n\n\n
- #92: Pandemic Preparedness map for joint project of InterAction and USAID, showing public health programs in vulnerable areas.\n\nhttp://preparedness.interaction.org/\n\nMap created by Development Seed, an open source development company that focuses on building communication and visualization tools.\n\nWe work with Development Seed on several projects. I worked closely with them on the World Food Programme’s main site, wfp.org.\n\n\n\n\n
- #93: Pandemic Preparedness map for joint project of InterAction and USAID, showing public health programs in vulnerable areas.\n\nhttp://preparedness.interaction.org/\n\nMap created by Development Seed, an open source development company that focuses on building communication and visualization tools.\n\nWe work with Development Seed on several projects. I worked closely with them on the World Food Programme’s main site, wfp.org.\n\n\n\n\n
- #94: Pandemic Preparedness map for joint project of InterAction and USAID, showing public health programs in vulnerable areas.\n\nhttp://preparedness.interaction.org/\n\nMap created by Development Seed, an open source development company that focuses on building communication and visualization tools.\n\nWe work with Development Seed on several projects. I worked closely with them on the World Food Programme’s main site, wfp.org.\n\n\n\n\n
- #95: Pandemic Preparedness map for joint project of InterAction and USAID, showing public health programs in vulnerable areas.\n\nhttp://preparedness.interaction.org/\n\nMap created by Development Seed, an open source development company that focuses on building communication and visualization tools.\n\nWe work with Development Seed on several projects. I worked closely with them on the World Food Programme’s main site, wfp.org.\n\n\n\n\n
- #96: Aid Projects in Haiti\nhttp://preparedness.interaction.org/\n
- #97: Aid Projects in Haiti\nhttp://preparedness.interaction.org/\n
- #98: Aid Projects in Haiti\nhttp://preparedness.interaction.org/\n
- #99: Aid Projects in Haiti\nhttp://preparedness.interaction.org/\n
- #100: Aid Projects in Haiti\nhttp://preparedness.interaction.org/\n
- #101: Aid Projects in Haiti\nhttp://preparedness.interaction.org/\n
- #102: Aid Projects in Haiti\nhttp://preparedness.interaction.org/\n
- #103: Aid Projects in Haiti\nhttp://preparedness.interaction.org/\n
- #104: Aid Projects in Haiti\nhttp://preparedness.interaction.org/\n
- #105: MapBox provides a suite of open source tools and services for creating and using custom maps in the cloud.\n\n\nTileMill leverages OpenLayers, Carto, and Mapnik (C++ based mapping application toolkit)\n\nAt Phase2, I worked on a data visualization project with a high-profile federal agency that utilized MapBox and OpenLayers to display state-specific data related to job creation stemming from the Recovery Act legislation.\n\nWe automatically generated the locations of blog posts using natural language processing and semantic tagging provided by a freely-available service called Open Calais, provided by Thomson Reuters.\n\n
- #106: MapBox provides a suite of open source tools and services for creating and using custom maps in the cloud.\n\n\nTileMill leverages OpenLayers, Carto, and Mapnik (C++ based mapping application toolkit)\n\nAt Phase2, I worked on a data visualization project with a high-profile federal agency that utilized MapBox and OpenLayers to display state-specific data related to job creation stemming from the Recovery Act legislation.\n\nWe automatically generated the locations of blog posts using natural language processing and semantic tagging provided by a freely-available service called Open Calais, provided by Thomson Reuters.\n\n
- #107: MapBox provides a suite of open source tools and services for creating and using custom maps in the cloud.\n\n\nTileMill leverages OpenLayers, Carto, and Mapnik (C++ based mapping application toolkit)\n\nAt Phase2, I worked on a data visualization project with a high-profile federal agency that utilized MapBox and OpenLayers to display state-specific data related to job creation stemming from the Recovery Act legislation.\n\nWe automatically generated the locations of blog posts using natural language processing and semantic tagging provided by a freely-available service called Open Calais, provided by Thomson Reuters.\n\n
- #108: \n
- #109: Map from Japanearthquakerecovery.org, a project of the Business Civic Leadership Center.\n\nUses open data from USGS and tile designs built with TileMill, an open-source map tile design studio.\n
- #110: Map from Japanearthquakerecovery.org, a project of the Business Civic Leadership Center.\n\nUses open data from USGS and tile designs built with TileMill, an open-source map tile design studio.\n
- #111: Map from Japanearthquakerecovery.org, a project of the Business Civic Leadership Center.\n\nUses open data from USGS and tile designs built with TileMill, an open-source map tile design studio.\n
- #112: \n
- #113: \n
- #114: \n
- #115: \n
- #116: \n
- #117: \n
- #118: \n
- #119: \n
- #120: \n
- #121: \n
- #122: This is a visualization tool that we’re considering using for an upcoming project for a client in the financial services industry.\n
- #123: \n
- #124: \n
- #125: \n
- #126: \n
- #127: \n
- #128: \n
- #129: \n
- #130: \n
- #131: \n
- #132: \n
- #133: During World War 1, it became more difficult for people from Europe to emigrate.\n\nAfter World War 1, more restrictive legislation on immigration was put into place, which kept immigration levels lower moving forward.\n\nThey reached their lowest point during the Great Depression.\n
- #134: During World War 1, it became more difficult for people from Europe to emigrate.\n\nAfter World War 1, more restrictive legislation on immigration was put into place, which kept immigration levels lower moving forward.\n\nThey reached their lowest point during the Great Depression.\n
- #135: During World War 1, it became more difficult for people from Europe to emigrate.\n\nAfter World War 1, more restrictive legislation on immigration was put into place, which kept immigration levels lower moving forward.\n\nThey reached their lowest point during the Great Depression.\n
- #136: During World War 1, it became more difficult for people from Europe to emigrate.\n\nAfter World War 1, more restrictive legislation on immigration was put into place, which kept immigration levels lower moving forward.\n\nThey reached their lowest point during the Great Depression.\n
- #137: \n
- #138: \n
- #139: This is a guy who took a trip Zlatibor, a mountain in Serbia.\n\nhttp://www.brankovukelic.com/post/849444944/zlatibor-breathgiving-infographics\n\nInkscape - one of the leading open source SVG graphics editors\n
- #140: This is a guy who took a trip Zlatibor, a mountain in Serbia.\n\nhttp://www.brankovukelic.com/post/849444944/zlatibor-breathgiving-infographics\n\nInkscape - one of the leading open source SVG graphics editors\n
- #141: \n
- #142: \n
- #143: \n
- #144: \n
- #145: \n
- #146: \n
- #147: \n
- #148: \n
- #149: \n