Data Visualizations with D3.js
0 likes173 views
The document summarizes a presentation on data visualization with D3.js given by Brian Greig to the Charlotte Front-End Developers group. The presentation introduced data visualization concepts and the D3 library, covered accessing data via APIs, building basic visualization components like scales and axes, binding data, and making visualizations interactive. It provided examples of effective data visualizations and discussed best practices for structuring visualizations and giving proper context to data.
1 of 21
Download to read offline


![Basic Components
Your basic D3 Starter Kit
• Define the dataset [1]
• Create a container [3-5]
• Bind your data [8]
• Append visual
components & set
attributes [11-18]
• Clean up [24]](https://image.slidesharecdn.com/cfe-d3jscopy-170716040508/85/Data-Visualizations-with-D3-js-11-320.jpg)


Ad
Recommended
Introduction to einstein analytics
Introduction to einstein analyticsSteven Hugo The document is a presentation by Steven Hugo introducing Einstein Analytics, an AI-powered analytics tool integrated with Salesforce, designed for exploring data efficiently. It outlines key components such as datasets, dataflows, lenses, and dashboards, emphasizing their functionalities and advantages over traditional reports. The presentation includes a demo and discusses future learning opportunities related to Einstein Analytics.
Automating Regional Data Integration with Python & ArcPy (Heather Widlund)
Automating Regional Data Integration with Python & ArcPy (Heather Widlund)GIS Colorado The document discusses automating the integration of regional GIS data using Python and ArcPy. The current process of manual data updates is arduous and results in infrequent updates. The proposed solution is to use scripting tools to automate the standardization, integration, and updating of key GIS datasets such as street centerlines, addresses, and emergency service boundaries. This automation will improve emergency response by ensuring up-to-date mapping and address verification. The project involves developing Python scripts to regularly integrate source data according to standardized schemas and push updates to dispatch software.
Dynamic Data Visualization with Tableau
Dynamic Data Visualization with TableauAkashBorse2 Data visualization is the graphical representation of data, allowing for the identification of patterns and the understanding of complex datasets. It is important for transforming raw data into informative insights, especially when dealing with complicated multi-dimensional data. Tableau is highlighted as a powerful tool for data visualization, enabling users to easily handle geographic data, summarize findings, and export data.
Future.ready().watson dataplatform 01
Future.ready().watson dataplatform 01Redazione InnovaPuglia The document outlines the capabilities and components of the Watson Data Platform, emphasizing its role in data engineering, data science, and business analytics. It highlights the integration of various data sources, tools, and processes designed to optimize data usage and collaboration among different user personas. The platform aims to facilitate real-time data analysis, model development, and enhance user experiences through tailored features and community collaboration.
Data migration services
Data migration servicesNitai Partners Inc Nitai Partners provides data architecture, modeling, integration, quality and management services. This includes data modeling for both open source and proprietary systems, integration, quality services, and master data management. They also provide big data and cloud-based data and analytics solutions. Their services include architecture design, best practices, multiple database support, application and performance databases, and data movement between on-premise and cloud, hybrid cloud, and between systems. They have strengths in Oracle technical expertise, rapid delivery using an onsite-offshore model, and a team of 58 consultants.
Introducing Entity Framework Core
Introducing Entity Framework CoreJoy Sarker The document introduces Entity Framework Core, a lightweight, cross-platform object-relational mapper for .NET that streamlines database interactions. It covers essential topics such as data annotations, migrations, and the repository pattern to enhance data management and avoid code duplication. Additionally, it discusses updating records and the importance of maintaining synchronization between application models and the physical data store.
Faster is the New Fast - with Mi Express You can Analyze Location Data Faster
Faster is the New Fast - with Mi Express You can Analyze Location Data FasterMISNet - Integeo SE Asia Roderick Ross from Integeo presented on Map Intelligence's new Mi Express product. Mi Express allows users to analyze location data faster by uploading CSV files, generating points on a map, and adding quick charts and tables to the map without programming. It is aimed at researchers and students to map their own data and share it. Mi Express leverages Integeo's Map Intelligence Server and can work alongside other Map Intelligence products. A demonstration showed the easy process of uploading data and generating interactive maps, charts, and tables to analyze location data. Potential applications include use by government agencies and education sectors.
Creating Data Visualisations for the Web
Creating Data Visualisations for the WebEmpathyBroker This document discusses creating data visualizations for the web. It covers self-serve tools like Google Spreadsheets and Tableau that allow importing data and creating visualizations with no coding. It also covers libraries like Plotly, Vega, and d3 that require coding but offer more flexibility. The document demonstrates processes for creating visualizations with both self-serve tools and libraries, and discusses pros and cons of each approach.
What is Revit Structure - Dhyan Academy
What is Revit Structure - Dhyan Academydhyanacademyengineer Revit Structure is Autodesk's BIM software designed for structural engineering, enhancing design efficiency and collaboration among project members. It features advanced tools for modeling, structural analysis, and documentation, supporting both concrete and steel design workflows. Dhyan Academy offers training on Revit Structure, aimed at helping individuals advance their skills for better career opportunities.
Interactive Visualization of Software Components with Virtual Reality Headsets
Interactive Visualization of Software Components with Virtual Reality HeadsetsAndreas Schreiber The document discusses an interactive visualization system for software components using virtual reality headsets, developed by Andreas Schreiber and Marlene Brüggemann at the German Aerospace Center. It details the architecture of OSGi-based applications, use cases for visualization, and future developments such as voice interaction and support for multiple users. The presentation emphasizes the advantages of visual representation in understanding large software systems and facilitating team collaboration.
JoTechies -Azure Machine Learning
JoTechies -Azure Machine LearningJoTechies The document discusses Azure Machine Learning. It begins with an overview of machine learning and key concepts like labels, features, and algorithms. It then defines Azure Machine Learning as a cloud service for creating and deploying predictive models with an integrated drag-and-drop interface and no software to install. The Azure Machine Learning ecosystem is explained, including getting data, building experiments, evaluating models, and publishing web services. Finally, a demo is described that uses calorie data to create a predictive model and publish it as a REST API for consumption.
Aws community day pune 2020 v3
Aws community day pune 2020 v3Sridevi Murugayen This document provides an overview of AWS Glue, a fully managed ETL service for preparing and loading big data for analytics. It discusses what big data and analytics are, and describes the key components of Glue including the crawler, catalog, architecture and ETL jobs. Glue allows for easy, fast and cost-effective processing of vast amounts of data from sources like Amazon S3. It can be used to build data warehouses, run queries against data lakes, create event-driven pipelines, and understand data assets. The document provides examples of how Glue components like the crawler, catalog, and ETL jobs work together in a workflow.
A Big Data Analysis Framework for Model-Based Web User Behavior Analytics
A Big Data Analysis Framework for Model-Based Web User Behavior AnalyticsAndrea Mauri The document presents a framework for big data analysis focused on model-based web user behavior analytics, aiming to provide insights to designers and decision-makers. It integrates web log analytics with model-driven development to enhance data visualization and user interaction insights. Future work will explore the effects of model restructuring on user behavior and conversion rates.
Pitkin Maps & More (Mary Lakner)
Pitkin Maps & More (Mary Lakner)GIS Colorado This document summarizes a GIS project to create an online mapping and data portal for Pitkin County. It outlines the project goals of providing easy-to-use GIS data and mapping tools, the timeline and vendor selection process, preparation of maps and data, development of site functions using Geocortex software, and outreach efforts. It concludes with an analysis of the project benefits, including time savings, improved data access, and leveraging of technology, and proposes next steps such as developing department-specific sites and new mapping capabilities.
RackBuilder Plus
RackBuilder PlusManageEngine, Zoho Corporation Rackbuilder Plus is a 3D visual modeling software for data centers that allows administrators to create realistic rack views and floor layouts. It replaces traditional documentation tools and offers features like drag-and-drop functionality, live device status, and network discovery. Users can also import data from various sources such as RackTables and Device42.
L21 sharing data using data synchronization
L21 sharing data using data synchronizationNaresh Kumar SAHU This document discusses how to synchronize data between applications using Oracle's data synchronization tools. It describes creating mapping tables between source and destination dimensions, using a wizard to set up synchronizations by specifying the source and destination applications, mapping source dimensions to destination dimensions, applying filters, validating synchronizations, executing synchronizations, and viewing data flows between applications. The goal is to share and consolidate data across different applications.
DB Generator 2016
DB Generator 2016Andy Hamer This document outlines a methodology for developing organizational information requirements (OIR) to establish a single source of truth for building information modeling (BIM) data. The 6-stage process involves:
1. Establishing objectives to define why data is needed, what data is required, and required structure and detail.
2. Auditing existing data sources, formats, locations, and relationships to identify gaps.
3. Consolidating data by collecting from different sources and formats, removing errors and duplicates to use the most updated data.
4. Establishing workflows to define how data moves between internal and external parties and systems.
5. Developing an enterprise-wide data strategy to create consistent data
Let's analyze how world reacts to road traffic by sentiment analysis final
Let's analyze how world reacts to road traffic by sentiment analysis finalSajeetharan Sentiment analysis uses natural language processing to identify opinions in text as positive, negative, or neutral. Analyzing Twitter data through sentiment analysis can provide insight into public opinions on various topics. The presentation described how sentiment analysis of Twitter data on road traffic could work, using Azure cognitive services and Logic Apps for processing without code. A demo then showed these Azure services in action for sentiment analysis.
Mind the Gap - Data Science Meets Software Engineering
Mind the Gap - Data Science Meets Software EngineeringBernhard Haslhofer This document summarizes a talk on combining data science and software engineering approaches. It discusses how the two fields approach problems differently, with software engineering focusing on implementing features and ensuring quality through testing, while data science focuses on evaluating models and metrics. The document proposes a solution of defining goals, collecting ground truth data, implementing models and functions, testing and evaluating them, analyzing errors, and deploying services based on metrics. This "metrics driven software engineering" approach aims to bridge the gaps between the two fields.
This Week in Neo4j - 24th November 2018
This Week in Neo4j - 24th November 2018Neo4j This document summarizes the week's highlights in the Neo4j community, including an online meetup on similarity algorithms, a blog post on session recommendation engines, and a guide on using GraphQL for data ingestion into Neo4j. It also features insights into decision trees and analyzing PostgreSQL metadata using Neo4j. Additional resources and links to detailed blog posts are provided for deeper exploration.
Network analysis on HR strategy
Network analysis on HR strategyMin Luen Sun The document presents a model for network analysis focused on HR strategy, emphasizing data visualization and organizational improvement through analyzing employee communication and departmental connectivity. It uses tools like Eclipse, Alteryx, and Gephi to process and visualize large datasets, assessing variables such as centrality and communication patterns. The analysis helps identify departmental roles, optimize resource allocation, and enhance the overall organizational structure.
Edge processing and High Level Visualization versus Cloud computing and Kibana
Edge processing and High Level Visualization versus Cloud computing and KibanaStefano Milani The document compares edge processing and cloud computing, highlighting their differences in computational power, energy consumption, and data storage capabilities. It discusses visualization techniques, particularly the use of Kibana for high-level data visualization, which offers usability for experts and personalization for end-users. The analysis emphasizes the cost-effectiveness and responsiveness of edge cloud systems versus traditional cloud computing.
Data Visualization With Tableau | Edureka
Data Visualization With Tableau | EdurekaEdureka! The document discusses data visualization using Tableau, highlighting its ability to connect to various data sources and facilitate data analysis. It outlines who should consider using Tableau, such as business analysts and data scientists, and provides insights into job trends and companies utilizing the software. Additionally, it covers Tableau's architecture and visualization capabilities, including real-time use cases.
Internship Presentation
Internship PresentationJobayer Ahmmed This document summarizes Jobayer Ahmmed's internship at NNS Solution Ltd, where he gained experience with functional testing, front end and back end web development, and technical and soft skills development. Some of the projects he worked on included an admin management system for Robi Axiata, an expense management system for City Bank, and a web application for the Department of Agriculture Marketing. During his internship he learned skills like responsive design using Bootstrap and technologies like PHP, MySQL, jQuery and more. He also developed soft skills like communication, teamwork, and handling client relationships.
Introducing greenspaceLive and gTools
Introducing greenspaceLive and gToolscalum_gsl GreenspaceLive aims to provide tools and services to help increase interoperability, reduce carbon footprint, and meet building legislation. Their gTools software suite includes gWorkspace for cloud-based project storage and sharing, gModeller for creating gbXML and IDF models in SketchUp, gEnergy for cloud-based building simulation using EnergyPlus, and gEPC for generating energy performance certificates on the cloud. GreenspaceLive also offers consultancy services such as energy surveys, analysis, and certification.
Relevant Search Leveraging Knowledge Graphs with Neo4j
Relevant Search Leveraging Knowledge Graphs with Neo4jGraphAware The document discusses the significance of knowledge graphs in enhancing relevant search capabilities across various sectors, including e-commerce, finance, and healthcare. It highlights the challenges of data sparsity and the need for robust search architectures that utilize heterogeneous data to improve user experiences and meet business goals. Additionally, it outlines the infrastructure and techniques employed by Graphaware to achieve efficient data handling, search personalization, and recommendation systems.
GIS As-Builts - How & Why
GIS As-Builts - How & WhyGIS Colorado The document discusses GIS as-builts and asset management for municipalities. It describes how GIS technicians can collect location and asset data in the field using GPS during construction projects to pre-populate GIS maps. This avoids digitizing later and allows clients to track project progress. Benefits include accurate feature location, easy data sharing and retrieval, and a foundation for asset management. Interactive maps using GIS as-built data, ArcGIS Online and apps can then help track infrastructure and plan maintenance.
business intelligence
business intelligenceMohammed Hafeez Business intelligence (BI) involves gathering, processing, and analyzing data to provide insights and support decision-making. It transforms raw data into useful information through analytics. BI infrastructure focuses on data quality, rules, extraction, transformation, and loading processes to analyze data sources and provide tools and training for users. Data warehousing involves dimensional modeling and creating a multidimensional database to enable analysis and key performance indicators. Data mining techniques like classification, clustering, and prediction are used to discover patterns in large data sets.
Charlotte Front End - D3
Charlotte Front End - D3Brian Greig The document summarizes a presentation on data visualization with D3.js given by Brian Greig to the Charlotte Front-End Developers group. The presentation covered data visualization concepts, accessing data via APIs, basic D3 components like binding data, building visualizations, and making visualizations interactive. It provided examples of good data visualizations and discussed key terms. It also outlined the steps to structure a D3 application, including initializing scales and domains, entering and updating data, and cleaning up.
Introduction to D3.js
Introduction to D3.jsOleksii Prohonnyi The document provides an introduction to data visualization and the D3.js library, highlighting its features and tools for creating graphical representations of data. It covers D3's capabilities, including selections, data binding, scales, layouts, transitions, and its strengths and weaknesses compared to other visualization libraries. Additionally, it offers resources for further learning and practical applications of D3.js.
More Related Content
What's hot (20)
What is Revit Structure - Dhyan Academy
What is Revit Structure - Dhyan Academydhyanacademyengineer Revit Structure is Autodesk's BIM software designed for structural engineering, enhancing design efficiency and collaboration among project members. It features advanced tools for modeling, structural analysis, and documentation, supporting both concrete and steel design workflows. Dhyan Academy offers training on Revit Structure, aimed at helping individuals advance their skills for better career opportunities.
Interactive Visualization of Software Components with Virtual Reality Headsets
Interactive Visualization of Software Components with Virtual Reality HeadsetsAndreas Schreiber The document discusses an interactive visualization system for software components using virtual reality headsets, developed by Andreas Schreiber and Marlene Brüggemann at the German Aerospace Center. It details the architecture of OSGi-based applications, use cases for visualization, and future developments such as voice interaction and support for multiple users. The presentation emphasizes the advantages of visual representation in understanding large software systems and facilitating team collaboration.
JoTechies -Azure Machine Learning
JoTechies -Azure Machine LearningJoTechies The document discusses Azure Machine Learning. It begins with an overview of machine learning and key concepts like labels, features, and algorithms. It then defines Azure Machine Learning as a cloud service for creating and deploying predictive models with an integrated drag-and-drop interface and no software to install. The Azure Machine Learning ecosystem is explained, including getting data, building experiments, evaluating models, and publishing web services. Finally, a demo is described that uses calorie data to create a predictive model and publish it as a REST API for consumption.
Aws community day pune 2020 v3
Aws community day pune 2020 v3Sridevi Murugayen This document provides an overview of AWS Glue, a fully managed ETL service for preparing and loading big data for analytics. It discusses what big data and analytics are, and describes the key components of Glue including the crawler, catalog, architecture and ETL jobs. Glue allows for easy, fast and cost-effective processing of vast amounts of data from sources like Amazon S3. It can be used to build data warehouses, run queries against data lakes, create event-driven pipelines, and understand data assets. The document provides examples of how Glue components like the crawler, catalog, and ETL jobs work together in a workflow.
A Big Data Analysis Framework for Model-Based Web User Behavior Analytics
A Big Data Analysis Framework for Model-Based Web User Behavior AnalyticsAndrea Mauri The document presents a framework for big data analysis focused on model-based web user behavior analytics, aiming to provide insights to designers and decision-makers. It integrates web log analytics with model-driven development to enhance data visualization and user interaction insights. Future work will explore the effects of model restructuring on user behavior and conversion rates.
Pitkin Maps & More (Mary Lakner)
Pitkin Maps & More (Mary Lakner)GIS Colorado This document summarizes a GIS project to create an online mapping and data portal for Pitkin County. It outlines the project goals of providing easy-to-use GIS data and mapping tools, the timeline and vendor selection process, preparation of maps and data, development of site functions using Geocortex software, and outreach efforts. It concludes with an analysis of the project benefits, including time savings, improved data access, and leveraging of technology, and proposes next steps such as developing department-specific sites and new mapping capabilities.
RackBuilder Plus
RackBuilder PlusManageEngine, Zoho Corporation Rackbuilder Plus is a 3D visual modeling software for data centers that allows administrators to create realistic rack views and floor layouts. It replaces traditional documentation tools and offers features like drag-and-drop functionality, live device status, and network discovery. Users can also import data from various sources such as RackTables and Device42.
L21 sharing data using data synchronization
L21 sharing data using data synchronizationNaresh Kumar SAHU This document discusses how to synchronize data between applications using Oracle's data synchronization tools. It describes creating mapping tables between source and destination dimensions, using a wizard to set up synchronizations by specifying the source and destination applications, mapping source dimensions to destination dimensions, applying filters, validating synchronizations, executing synchronizations, and viewing data flows between applications. The goal is to share and consolidate data across different applications.
DB Generator 2016
DB Generator 2016Andy Hamer This document outlines a methodology for developing organizational information requirements (OIR) to establish a single source of truth for building information modeling (BIM) data. The 6-stage process involves:
1. Establishing objectives to define why data is needed, what data is required, and required structure and detail.
2. Auditing existing data sources, formats, locations, and relationships to identify gaps.
3. Consolidating data by collecting from different sources and formats, removing errors and duplicates to use the most updated data.
4. Establishing workflows to define how data moves between internal and external parties and systems.
5. Developing an enterprise-wide data strategy to create consistent data
Let's analyze how world reacts to road traffic by sentiment analysis final
Let's analyze how world reacts to road traffic by sentiment analysis finalSajeetharan Sentiment analysis uses natural language processing to identify opinions in text as positive, negative, or neutral. Analyzing Twitter data through sentiment analysis can provide insight into public opinions on various topics. The presentation described how sentiment analysis of Twitter data on road traffic could work, using Azure cognitive services and Logic Apps for processing without code. A demo then showed these Azure services in action for sentiment analysis.
Mind the Gap - Data Science Meets Software Engineering
Mind the Gap - Data Science Meets Software EngineeringBernhard Haslhofer This document summarizes a talk on combining data science and software engineering approaches. It discusses how the two fields approach problems differently, with software engineering focusing on implementing features and ensuring quality through testing, while data science focuses on evaluating models and metrics. The document proposes a solution of defining goals, collecting ground truth data, implementing models and functions, testing and evaluating them, analyzing errors, and deploying services based on metrics. This "metrics driven software engineering" approach aims to bridge the gaps between the two fields.
This Week in Neo4j - 24th November 2018
This Week in Neo4j - 24th November 2018Neo4j This document summarizes the week's highlights in the Neo4j community, including an online meetup on similarity algorithms, a blog post on session recommendation engines, and a guide on using GraphQL for data ingestion into Neo4j. It also features insights into decision trees and analyzing PostgreSQL metadata using Neo4j. Additional resources and links to detailed blog posts are provided for deeper exploration.
Network analysis on HR strategy
Network analysis on HR strategyMin Luen Sun The document presents a model for network analysis focused on HR strategy, emphasizing data visualization and organizational improvement through analyzing employee communication and departmental connectivity. It uses tools like Eclipse, Alteryx, and Gephi to process and visualize large datasets, assessing variables such as centrality and communication patterns. The analysis helps identify departmental roles, optimize resource allocation, and enhance the overall organizational structure.
Edge processing and High Level Visualization versus Cloud computing and Kibana
Edge processing and High Level Visualization versus Cloud computing and KibanaStefano Milani The document compares edge processing and cloud computing, highlighting their differences in computational power, energy consumption, and data storage capabilities. It discusses visualization techniques, particularly the use of Kibana for high-level data visualization, which offers usability for experts and personalization for end-users. The analysis emphasizes the cost-effectiveness and responsiveness of edge cloud systems versus traditional cloud computing.
Data Visualization With Tableau | Edureka
Data Visualization With Tableau | EdurekaEdureka! The document discusses data visualization using Tableau, highlighting its ability to connect to various data sources and facilitate data analysis. It outlines who should consider using Tableau, such as business analysts and data scientists, and provides insights into job trends and companies utilizing the software. Additionally, it covers Tableau's architecture and visualization capabilities, including real-time use cases.
Internship Presentation
Internship PresentationJobayer Ahmmed This document summarizes Jobayer Ahmmed's internship at NNS Solution Ltd, where he gained experience with functional testing, front end and back end web development, and technical and soft skills development. Some of the projects he worked on included an admin management system for Robi Axiata, an expense management system for City Bank, and a web application for the Department of Agriculture Marketing. During his internship he learned skills like responsive design using Bootstrap and technologies like PHP, MySQL, jQuery and more. He also developed soft skills like communication, teamwork, and handling client relationships.
Introducing greenspaceLive and gTools
Introducing greenspaceLive and gToolscalum_gsl GreenspaceLive aims to provide tools and services to help increase interoperability, reduce carbon footprint, and meet building legislation. Their gTools software suite includes gWorkspace for cloud-based project storage and sharing, gModeller for creating gbXML and IDF models in SketchUp, gEnergy for cloud-based building simulation using EnergyPlus, and gEPC for generating energy performance certificates on the cloud. GreenspaceLive also offers consultancy services such as energy surveys, analysis, and certification.
Relevant Search Leveraging Knowledge Graphs with Neo4j
Relevant Search Leveraging Knowledge Graphs with Neo4jGraphAware The document discusses the significance of knowledge graphs in enhancing relevant search capabilities across various sectors, including e-commerce, finance, and healthcare. It highlights the challenges of data sparsity and the need for robust search architectures that utilize heterogeneous data to improve user experiences and meet business goals. Additionally, it outlines the infrastructure and techniques employed by Graphaware to achieve efficient data handling, search personalization, and recommendation systems.
GIS As-Builts - How & Why
GIS As-Builts - How & WhyGIS Colorado The document discusses GIS as-builts and asset management for municipalities. It describes how GIS technicians can collect location and asset data in the field using GPS during construction projects to pre-populate GIS maps. This avoids digitizing later and allows clients to track project progress. Benefits include accurate feature location, easy data sharing and retrieval, and a foundation for asset management. Interactive maps using GIS as-built data, ArcGIS Online and apps can then help track infrastructure and plan maintenance.
business intelligence
business intelligenceMohammed Hafeez Business intelligence (BI) involves gathering, processing, and analyzing data to provide insights and support decision-making. It transforms raw data into useful information through analytics. BI infrastructure focuses on data quality, rules, extraction, transformation, and loading processes to analyze data sources and provide tools and training for users. Data warehousing involves dimensional modeling and creating a multidimensional database to enable analysis and key performance indicators. Data mining techniques like classification, clustering, and prediction are used to discover patterns in large data sets.
Similar to Data Visualizations with D3.js (20)
Charlotte Front End - D3
Charlotte Front End - D3Brian Greig The document summarizes a presentation on data visualization with D3.js given by Brian Greig to the Charlotte Front-End Developers group. The presentation covered data visualization concepts, accessing data via APIs, basic D3 components like binding data, building visualizations, and making visualizations interactive. It provided examples of good data visualizations and discussed key terms. It also outlined the steps to structure a D3 application, including initializing scales and domains, entering and updating data, and cleaning up.
Introduction to D3.js
Introduction to D3.jsOleksii Prohonnyi The document provides an introduction to data visualization and the D3.js library, highlighting its features and tools for creating graphical representations of data. It covers D3's capabilities, including selections, data binding, scales, layouts, transitions, and its strengths and weaknesses compared to other visualization libraries. Additionally, it offers resources for further learning and practical applications of D3.js.
Data Visualization for Big Data: Experience from the Front Line
Data Visualization for Big Data: Experience from the Front LineRosa Romero Gómez, PhD This document discusses data visualization for big data. It begins by explaining why visualization is important, as it can help users notice unexpected patterns in data. It then defines data visualization as using interactive visual representations to amplify cognition. The document outlines several steps to create a visualization: identifying relevant tasks; choosing a library; transforming data into a nested JSON format; binding the data; and creating a user-friendly experience with settings. It provides an example of visualizing network threat data to identify suspicious IP addresses and domains.
chapter 6 data visualization ppt.pptx
chapter 6 data visualization ppt.pptxsayalisonavane3 The document discusses data visualization and provides information on:
1) What data visualization is and its purpose of representing data graphically to make it easy to understand.
2) The challenges of big data visualization including visual noise, information loss, large image perception, and high performance requirements.
3) Approaches to big data visualization including tools like Hadoop, R, and D3.
4) D3 (Data Driven Documents) as an open-source JavaScript library for creating custom interactive data visualizations in the browser using SVG, HTML and CSS.
Introduction to data visualisation with D3
Introduction to data visualisation with D3Aleksander Fabijan This document provides an introduction to data visualization with D3.js. It discusses why data visualization is useful, listing reasons like helping people see non-obvious patterns and conveying information universally. It also introduces some common visualization libraries and focuses on D3.js, explaining that it is not limited to specific canvases and allows more creativity than libraries with predefined charts. The document then covers the main concepts of D3.js, including selections of elements, using SVG, and binding data to drive visual element properties. It provides examples of using scales to map data values to pixel coordinates. Finally, it lists some additional learning resources for D3.js.
Data visualization in a Nutshell
Data visualization in a NutshellWingChan46 The document presents an overview of data visualization, explaining its importance in analyzing large data sets through graphical representations like charts and maps. It outlines a data visualization framework consisting of data, mapping, and graphics layers, and discusses three styles of data visualization: interactive, presentation, and storytelling. Additionally, it compares two popular tools, Tableau and D3.js, highlighting their target users, costs, and advantages and disadvantages.
Frontend Architecture and Data Visualization
Frontend Architecture and Data VisualizationAltocloud The document discusses the choice of AngularJS for web app development, emphasizing its ease of testing and fast prototyping capabilities. It also covers essential considerations for data visualization, such as chart necessity, clarity for users, and proper graphing techniques, alongside highlighting the D3.js library for its flexibility in creating data-driven documents. Furthermore, it offers advice for teams adopting Angular, stressing adherence to established style guides and the importance of user experience in data visuals.
Mini-Training: DataViz, data-driven documents and D3.js
Mini-Training: DataViz, data-driven documents and D3.jsBetclic Everest Group Tech Team The document discusses the significance of data visualization (dataviz) as a powerful tool to communicate complex information clearly and stimulate cognitive understanding through various graphical means. It highlights the exponential growth of data and the importance of effective representation methods, referencing tools like d3.js for dynamic data-driven documents. Key principles and methods for effective data visualization are also outlined, emphasizing the need to show data clearly and avoid distortion.
Learn D3.js in 90 minutes
Learn D3.js in 90 minutesJos Dirksen This document is a comprehensive guide for a session on learning D3.js, a JavaScript library for data visualization, focusing on manipulating DOM elements with data. It outlines practical exercises, such as data binding, creating basic charts, and handling SVG elements, while explaining key concepts and commands used in D3.js. Additionally, it highlights what topics will not be covered, indicating the library's vast capabilities beyond the session's scope.
D3.JS Tips & Tricks (export to svg, crossfilter, maps etc.)
D3.JS Tips & Tricks (export to svg, crossfilter, maps etc.)Oleksii Prohonnyi The document provides a comprehensive guide on the d3.js library for data visualization, covering essential concepts such as selections, SVG graphics, scales, layouts, transitions, and various chart types. It includes practical tips, tasks, and solutions related to exporting SVG files, handling user interactions, and implementing various visualization techniques like Sankey diagrams and force layout diagrams. Additionally, it introduces tools like Crossfilter and dc.js for data immersion and offers external resources and references for further learning.
Pittsburgh code and supply
Pittsburgh code and supplydudaspm This document provides an overview of data visualization concepts and techniques. It introduces D3, a JavaScript library for visualizing data in web browsers. It discusses how D3 works by binding data to HTML elements like SVG and manipulating them. Examples are provided of creating simple charts and animations with D3. Transitions, interactions, and best practices like affordances are also covered.
FITC - Data Visualization in Practice
FITC - Data Visualization in PracticeRami Sayar Rami Sayar gave a presentation on data visualization principles and best practices. He covered five principles: 1) context is king, 2) visualizations must match the underlying data, 3) escaping flatland when useful, 4) aggregating details can reveal knowledge in data, and 5) layering and parallelizing views but avoiding "haystacks". He provided examples from Mike Bostock's work with stop-and-frisk data and choropleth maps. Sayar also demonstrated techniques like cubism and recommended resources like books by Edward Tufte and websites like FlowingData.com for learning more about data visualization design.
Dazzing Data Depiction with D3.JS
Dazzing Data Depiction with D3.JSEric Carlisle This document contains a presentation on D3.js, a JavaScript library for manipulating documents based on data. The presentation discusses how data visualization was traditionally part of large software suites or browser plugins before D3. It then covers what D3 is and is not, including that it is a standards-based library native to modern browsers. The rest of the presentation focuses on getting started with D3, the enter-update-exit pattern for binding data to the DOM, transitions, scales, and additional charting libraries to check out.
Academy PRO: D3, part 1
Academy PRO: D3, part 1Binary Studio Data visualization is the presentation of data in a graphical format. Visuals are processed faster by the brain and help reveal patterns, trends, and correlations in the data. D3 is a popular JavaScript library for visualizing data using web standards like SVG, Canvas, and HTML. It allows powerful data-driven transformations of documents by binding data to elements. Scales map abstract data dimensions to visual representations.
Dreamforce 2014 - Introduction to d3.js
Dreamforce 2014 - Introduction to d3.jsramanathanp82 The document introduces d3.js, a low-level visualization library focused on data-driven documents, highlighting its structure and usage for data binding, selections, and basic SVG shapes. It compares d3.js to other frameworks, emphasizing its strength in unique visualizations but also the steep learning curve involved. Additionally, it discusses the Salesforce Analytics API for accessing report data and notes that d3.js does not provide built-in charting options like some other libraries.
Feed your inner data scientist. JS Visualization Tools
Feed your inner data scientist. JS Visualization ToolsDoug Mair This document provides an overview of JavaScript tools for data visualization and analysis, including D3.js, Crossfilter.js, dc.js, and DataTables. It discusses using these libraries to load and manipulate stock market data, create interactive bar and line charts, and build dashboards with multiple coordinated views. Examples are given of creating basic charts with each library and combining them into a dashboard using Crossfilter for filtering and dc.js for charting.
D3js
D3jsManav Prasad This document provides an overview and introduction to data visualization concepts and implementation using D3. It discusses why visualization is useful, challenges in visualization, and how D3 is different from other tools. It demonstrates basic D3 concepts like binding data to DOM elements, using scales to map data values to visual properties, and built-in visualization layouts. Resources for more examples and the D3 wiki are also provided.
Data visualisation with D3
Data visualisation with D3Florian Evéquoz This document provides an overview of data visualization and the D3 JavaScript library. It discusses the foundations of data visualization using historical examples. It then introduces D3, describing it as a JavaScript library for manipulating documents based on data. The document outlines a use case visualizing Twitter data from the Swiss parliament using D3, including the methodology, results, and step-by-step instructions for building the visualization in D3. Key aspects of D3 covered include loading and formatting data, defining scales to map data values to visual properties, and drawing SVG elements to represent the data visually using circles and axes.
D3
D3Xi SiZhe This document provides an overview of D3.js, an open-source JavaScript library for producing dynamic, interactive data visualizations in web browsers. It discusses D3.js's technical features like using SVG, HTML, and CSS, its support for Ajax, JSON, and XML, and how it is useful for web interactivity, advanced data analytics, and allowing powerful and full control. The document also briefly touches on D3.js's learning curve and provides examples of basic DOM manipulation, properties as functions, entering and exiting data, attributes, transitions, and interactions using D3.js.
The D3 Toolbox
The D3 ToolboxMark Rickerby The document discusses D3, a JavaScript library for visualizing data using web standards. It provides selections, joins, and data binding to connect data to DOM elements. D3 uses scales and layouts to map data to visual properties like position, color, and size. It supports a variety of visualizations including maps, sunbursts, streamgraphs, and more. The D3 philosophy emphasizes representational transparency and flexibility over fixed chart types.
Ad
Recently uploaded (20)
IIT KGP Quiz Week 2024 Sports Quiz (Prelims + Finals)
IIT KGP Quiz Week 2024 Sports Quiz (Prelims + Finals)IIT Kharagpur Quiz Club The document outlines the format for the Sports Quiz at Quiz Week 2024, covering various sports & games and requiring participants to Answer without external sources. It includes specific details about question types, scoring, and examples of quiz questions. The document emphasizes fair play and enjoyment of the quiz experience.
Communicable Diseases and National Health Programs – Unit 9 | B.Sc Nursing 5t...
Communicable Diseases and National Health Programs – Unit 9 | B.Sc Nursing 5t...RAKESH SAJJAN This PowerPoint presentation covers Unit 9 – Communicable Diseases and National Health Programs, a core part of the 5th Semester B.Sc Nursing (Community Health Nursing – I) syllabus, as outlined by the Indian Nursing Council (INC).
This unit enables nursing students to understand the epidemiology, prevention, control, and nursing management of common communicable diseases in India, while also offering a structured overview of the National Health Programs implemented to address them.
The content is critical for effective field practice, disease surveillance, early detection, referral, and health education, equipping students to participate in public health interventions and outbreak control at community and national levels.
📘 Key Topics Covered in the PPT:
Definition and classification of communicable diseases
Modes of transmission and chain of infection
Common communicable diseases in India:
Malaria
Tuberculosis
Leprosy
Dengue
HIV/AIDS
Hepatitis
COVID-19 (if included in the current curriculum)
Diarrheal diseases
Acute Respiratory Infections (ARIs)
Epidemiological factors, causative agents, symptoms, and incubation periods
Prevention and control strategies: primary, secondary, and tertiary levels
Nursing responsibilities in patient care, contact tracing, community surveillance, and outbreak control
Health education and behavior change communication for community awareness
Vaccination schedules and cold chain maintenance
National Health Programs related to communicable diseases:
National Vector Borne Disease Control Program (NVBDCP)
Revised National Tuberculosis Control Program (RNTCP)
National Leprosy Eradication Program (NLEP)
National AIDS Control Program (NACP)
Universal Immunization Program (UIP)
IDSP – Integrated Disease Surveillance Program
Overview of standard treatment protocols, referral mechanisms, and community nurse’s role in program implementation
This presentation is ideal for:
Nursing students preparing for university exams, class tests, and field projects
Tutors teaching infectious disease nursing and public health interventions
Nurses involved in immunization, outbreak investigation, and contact tracing
It provides a student-friendly breakdown of concepts, aligned with national priorities, including flowcharts, tables, case examples, and simplified text for field-level application.
Community Health Nursing Approaches, Concepts, Roles & Responsibilities – Uni...
Community Health Nursing Approaches, Concepts, Roles & Responsibilities – Uni...RAKESH SAJJAN This PowerPoint presentation is based on Unit 6 – Community Health Nursing Approaches, Concepts, Roles & Responsibilities of Community Health Nursing Personnel, designed for B.Sc Nursing 5th Semester students under the subject Community Health Nursing – I, following the syllabus of the Indian Nursing Council (INC).
This unit focuses on the various approaches in community health, the organizational framework, and the responsibilities of different levels of nursing staff in the healthcare system. It emphasizes the real-world application of nursing principles to provide comprehensive and preventive care to the community.
📘 Key Areas Covered in this Presentation:
Introduction to the concept of community health nursing
Approaches to community health:
Nursing Process Approach
Epidemiological Approach
Evidence-Based Approach
Problem-Solving Approach
Nursing Theories in Community Health Practice
Explanation of teamwork and intersectoral coordination
Concept of primary health care and its application in community nursing
Levels of health care delivery – primary, secondary, and tertiary care
Home visit process: principles, planning, implementation, and follow-up
Use of community bag and record maintenance
Roles and responsibilities of:
Auxiliary Nurse Midwives (ANMs)
Community Health Officers (CHOs)
Staff Nurses
ASHA workers
Public Health Nurses (PHNs)
Documentation and reporting in community settings
Promotion of health education, immunization, maternal and child health, and nutritional support
Role of nurse in disease surveillance, outbreak control, and health promotion
Ethical principles in community nursing
Coordination with health team members and village health committees
This presentation is useful for:
Nursing students preparing for university theory exams, class tests, or viva
Nursing educators conducting lectures or field discussions
Interns and trainees working in PHCs, sub-centers, or community settings
Community nurses and health educators involved in rural and urban outreach
The content is simplified, clear, and enhanced with point-wise explanations, flowcharts, and field-related examples for better retention and application.
Non-Communicable Diseases and National Health Programs – Unit 10 | B.Sc Nursi...
Non-Communicable Diseases and National Health Programs – Unit 10 | B.Sc Nursi...RAKESH SAJJAN This PowerPoint presentation is prepared for Unit 10 – Non-Communicable Diseases and National Health Programs, as per the 5th Semester B.Sc Nursing syllabus outlined by the Indian Nursing Council (INC) under the subject Community Health Nursing – I.
This unit focuses on equipping students with knowledge of the causes, prevention, and control of non-communicable diseases (NCDs), which are a major public health challenge in India. The presentation emphasizes the nurse’s role in early detection, screening, management, and referral services under national-level programs.
🔹 Key Topics Included:
Definition, burden, and impact of NCDs in India
Epidemiology, risk factors, signs/symptoms, prevention, and management of:
Diabetes Mellitus
Hypertension
Cardiovascular Diseases
Stroke & Obesity
Thyroid Disorders
Blindness
Deafness
Injuries and Accidents (incl. road traffic injuries and trauma guidelines)
NCD-2 Cancers:
Breast Cancer
Cervical Cancer
Oral Cancer
Risk factors, screening, diagnosis, early signs, referral & palliative care
Role of nurse in screening, referral, counseling, and continuum of care
National Programs:
National Program for Prevention and Control of Cancer, Diabetes, Cardiovascular Diseases and Stroke (NPCDCS)
National Program for Control of Blindness
National Program for Prevention and Control of Deafness
National Tobacco Control Program (NTCP)
Introduction to Universal Health Coverage and Ayushman Bharat
Use of standard treatment protocols and referral flowcharts
This presentation is ideal for:
Classroom lectures, field assignments, health education planning, and student projects
Preparing for university exams, class tests, and community field postings
SCHIZOPHRENIA OTHER PSYCHOTIC DISORDER LIKE Persistent delusion/Capgras syndr...
SCHIZOPHRENIA OTHER PSYCHOTIC DISORDER LIKE Persistent delusion/Capgras syndr...parmarjuli1412 SCHIZOPHRENIA INCLUDED TOPIC IS INTRODUCTION, DEFINITION OF GENERAL TERM IN PSYCHIATRIC, THEN DIFINITION OF SCHIZOPHRENIA, EPIDERMIOLOGY, ETIOLOGICAL FACTORS, CLINICAL FEATURE(SIGN AND SYMPTOMS OF SCHIZOPHRENIA), CLINICAL TYPES OF SCHIZOPHRENIA, DIAGNOSIS, INVESTIGATION, TREATMENT MODALITIES(PHARMACOLOGICAL MANAGEMENT, PSYCHOTHERAPY, ECT, PSYCHO-SOCIO-REHABILITATION), NURSING MANAGEMENT(ASSESSMENT,DIAGNOSIS,NURSING INTERVENTION,AND EVALUATION), OTHER PSYCHOTIC DISORDER LIKE Persistent delusion/Capgras syndrome(The Delusion of Doubles)/Acute and Transient Psychotic Disorders/Induced Delusional Disorders/Schizoaffective Disorder /CAPGRAS SYNDROME(DELUSION OF DOUBLE), GERIATRIC CONSIDERATION, FOLLOW UP, HOMECARE AND REHABILITATION OF THE PATIENT,
Code Profiling in Odoo 18 - Odoo 18 Slides
Code Profiling in Odoo 18 - Odoo 18 SlidesCeline George Profiling in Odoo identifies slow code and resource-heavy processes, ensuring better system performance. Odoo code profiling detects bottlenecks in custom modules, making it easier to improve speed and scalability.
GEOGRAPHY-Study Material [ Class 10th] .pdf
GEOGRAPHY-Study Material [ Class 10th] .pdfSHERAZ AHMAD LONE "Geography Study Material for Class 10th" provides a comprehensive and easy-to-understand resource for key topics like Resources & Development, Water Resources, Agriculture, Minerals & Energy, Manufacturing Industries, and Lifelines of the National Economy. Designed as per the latest NCERT/JKBOSE syllabus, it includes notes, maps, diagrams, and MODEL question Paper to help students excel in exams. Whether revising for exams or strengthening conceptual clarity, this material ensures effective learning and high scores. Perfect for last-minute revisions and structured study sessions.
LDMMIA Yoga S10 Free Workshop Grad Level
LDMMIA Yoga S10 Free Workshop Grad LevelLDM & Mia eStudios This is complete for June 17th. For the weekend of Summer Solstice
June 20th-22nd.
6/17/25: “My now Grads, You’re doing well. I applaud your efforts to continue. We all are shifting to new paradigm realities. Its rough, there’s good and bad days/weeks. However, Reiki with Yoga assistance, does work.”
6/18/25: "For those planning the Training Program Do Welcome. Happy Summer 2k25. You are not ignored and much appreciated. Our updates are ongoing and weekly since Spring. I Hope you Enjoy the Practitioner Grad Level. There's more to come. We will also be wrapping up Level One. So I can work on Levels 2 topics. Please see documents for any news updates. Also visit our websites. Every decade I release a Campus eMap. I will work on that for summer 25. We have 2 old libraries online thats open. https://ldmchapels.weebly.com "
Our Monthly Class Roster is 7,141 for 6/21.
ALL students get privacy naturally. Thx Everyone.
As a Guest Student,
You are now upgraded to Grad Level.
See Uploads for “Student Checkins” & “S9”. Thx.
Happy Summer 25.
These are also timeless.
Thank you for attending our workshops.
If you are new, do welcome.
For visual/Video style learning see our practitioner student status.
This is listed under our new training program. Updates ongoing levels 1-3 this summer. We just started Session 1 for level 1.
These are optional programs. I also would like to redo our library ebooks about Hatha and Money Yoga. THe Money Yoga was very much energy healing without the Reiki Method. An updated ebook/course will be done this year. These Projects are for *all fans, followers, teams, and Readers. TY for being presenting.
How payment terms are configured in Odoo 18
How payment terms are configured in Odoo 18Celine George Payment terms in Odoo 18 help define the conditions for when invoices are due. This feature can split payments into multiple parts and automate due dates based on specific rules.
Paper 108 | Thoreau’s Influence on Gandhi: The Evolution of Civil Disobedience
Paper 108 | Thoreau’s Influence on Gandhi: The Evolution of Civil DisobedienceRajdeep Bavaliya Dive into the powerful journey from Thoreau’s 19th‑century essay to Gandhi’s mass movement, and discover how one man’s moral stand became the backbone of nonviolent resistance worldwide. Learn how conscience met strategy to spark revolutions, and why their legacy still inspires today’s social justice warriors. Uncover the evolution of civil disobedience. Don’t forget to like, share, and follow for more deep dives into the ideas that changed the world.
M.A. Sem - 2 | Presentation
Presentation Season - 2
Paper - 108: The American Literature
Submitted Date: April 2, 2025
Paper Name: The American Literature
Topic: Thoreau’s Influence on Gandhi: The Evolution of Civil Disobedience
[Please copy the link and paste it into any web browser to access the content.]
Video Link: https://youtu.be/HXeq6utg7iQ
For a more in-depth discussion of this presentation, please visit the full blog post at the following link: https://rajdeepbavaliya2.blogspot.com/2025/04/thoreau-s-influence-on-gandhi-the-evolution-of-civil-disobedience.html
Please visit this blog to explore additional presentations from this season:
Hashtags:
#CivilDisobedience #ThoreauToGandhi #NonviolentResistance #Satyagraha #Transcendentalism #SocialJustice #HistoryUncovered #GandhiLegacy #ThoreauInfluence #PeacefulProtest
Keyword Tags:
civil disobedience, Thoreau, Gandhi, Satyagraha, nonviolent protest, transcendentalism, moral resistance, Gandhi Thoreau connection, social change, political philosophy
Paper 107 | From Watchdog to Lapdog: Ishiguro’s Fiction and the Rise of “Godi...
Paper 107 | From Watchdog to Lapdog: Ishiguro’s Fiction and the Rise of “Godi...Rajdeep Bavaliya Dive into a captivating analysis where Kazuo Ishiguro’s nuanced fiction meets the stark realities of post‑2014 Indian journalism. Uncover how “Godi Media” turned from watchdog to lapdog, echoing the moral compromises of Ishiguro’s protagonists. We’ll draw parallels between restrained narrative silences and sensationalist headlines—are our media heroes or traitors? Don’t forget to follow for more deep dives!
M.A. Sem - 2 | Presentation
Presentation Season - 2
Paper - 107: The Twentieth Century Literature: From World War II to the End of the Century
Submitted Date: April 4, 2025
Paper Name: The Twentieth Century Literature: From World War II to the End of the Century
Topic: From Watchdog to Lapdog: Ishiguro’s Fiction and the Rise of “Godi Media” in Post-2014 Indian Journalism
[Please copy the link and paste it into any web browser to access the content.]
Video Link: https://youtu.be/kIEqwzhHJ54
For a more in-depth discussion of this presentation, please visit the full blog post at the following link: https://rajdeepbavaliya2.blogspot.com/2025/04/from-watchdog-to-lapdog-ishiguro-s-fiction-and-the-rise-of-godi-media-in-post-2014-indian-journalism.html
Please visit this blog to explore additional presentations from this season:
Hashtags:
#GodiMedia #Ishiguro #MediaEthics #WatchdogVsLapdog #IndianJournalism #PressFreedom #LiteraryCritique #AnArtistOfTheFloatingWorld #MediaCapture #KazuoIshiguro
Keyword Tags:
Godi Media, Ishiguro fiction, post-2014 Indian journalism, media capture, Kazuo Ishiguro analysis, watchdog to lapdog, press freedom India, media ethics, literature and media, An Artist of the Floating World
Nutrition Assessment and Nutrition Education – Unit 4 | B.Sc Nursing 5th Seme...
Nutrition Assessment and Nutrition Education – Unit 4 | B.Sc Nursing 5th Seme...RAKESH SAJJAN This PowerPoint presentation is based on Unit 4 – Nutrition Assessment and Nutrition Education, a core topic in the 5th Semester of B.Sc Nursing under the subject Community Health Nursing – I, as per the Indian Nursing Council (INC) guidelines.
The unit provides foundational knowledge of nutritional assessment techniques, importance of balanced diets, and health education strategies aimed at improving community nutrition. It empowers future nurses to play a key role in promoting nutrition, preventing malnutrition, and implementing dietary interventions at individual, family, and community levels.
✅ The PPT covers the following topics in detail:
Introduction to Nutrition and its role in health and disease prevention
Objectives of nutritional assessment in community settings
Types of nutritional assessment – Anthropometric, Biochemical, Clinical, and Dietary (ABCD) methods
Tools and techniques used in each type of nutritional assessment
Interpreting growth charts, BMI, MUAC, and dietary recalls
Identification of malnutrition, both undernutrition and overnutrition
Common nutritional deficiencies – protein-energy malnutrition, anemia, vitamin A deficiency, iodine deficiency
Principles of nutrition education and behavior change communication
Role of community health nurse in nutrition education during home visits, camps, and school health programs
Use of charts, posters, flashcards, and food models in health teaching
Culturally appropriate and locally available food suggestions
Strategies for promoting infant and young child feeding (IYCF)
National nutrition programs: POSHAN Abhiyaan, Mid-Day Meal Scheme, ICDS, and Anemia Mukt Bharat
Monitoring and evaluation of nutrition interventions
This PPT is perfect for:
B.Sc Nursing students preparing for unit tests or university exams
Nursing educators delivering community health lessons
Field work, community posting presentations, or group health teaching
Health educators and ASHA trainers working on community nutrition
All content is student-friendly, professionally formatted, and aligned with public health priorities and practical nursing roles.
This is why students from these 44 institutions have not received National Se...
This is why students from these 44 institutions have not received National Se...Kweku Zurek This is why students from these 44 institutions have not received National Service PIN codes (LIST)
Health Care Planning and Organization of Health Care at Various Levels – Unit...
Health Care Planning and Organization of Health Care at Various Levels – Unit...RAKESH SAJJAN This comprehensive PowerPoint presentation is prepared for B.Sc Nursing 5th Semester students and covers Unit 2 of Community Health Nursing – I based on the Indian Nursing Council (INC) syllabus. The unit focuses on the planning, structure, and functioning of health care services at various levels in India. It is especially useful for nursing educators and students preparing for university exams, internal assessments, or professional teaching assignments.
The content of this presentation includes:
Historical development of health planning in India
Detailed study of various health committees: Bhore, Mudaliar, Kartar Singh, Shrivastava Committee, etc.
Overview of major health commissions
In-depth understanding of Five-Year Plans and their impact on health care
Community participation and stakeholder involvement in health care planning
Structure of health care delivery system at central, state, district, and peripheral levels
Concepts and implementation of Primary Health Care (PHC) and Sustainable Development Goals (SDGs)
Introduction to Comprehensive Primary Health Care (CPHC) and Health and Wellness Centers (HWCs)
Expanded role of Mid-Level Health Providers (MLHPs) and Community Health Providers (CHPs)
Explanation of national health policies: NHP 1983, 2002, and 2017
Key national missions and schemes including:
National Health Mission (NHM)
National Rural Health Mission (NRHM)
National Urban Health Mission (NUHM)
Ayushman Bharat – Pradhan Mantri Jan Arogya Yojana (PM-JAY)
Universal Health Coverage (UHC) and India’s commitment to equitable health care
This presentation is ideal for:
Nursing students (B.Sc, GNM, Post Basic)
Nursing tutors and faculty
Health educators
Competitive exam aspirants in nursing and public health
It is organized in a clear, point-wise format with relevant terminologies and a focus on applied knowledge. The slides can also be used for community health demonstrations, teaching sessions, and revision guides.
VCE Literature Section A Exam Response Guide
VCE Literature Section A Exam Response Guidejpinnuck This practical guide shows students of Unit 3&4 VCE Literature how to write responses to Section A of the exam. Including a range of examples writing about different types of texts, this guide:
*Breaks down and explains what Q1 and Q2 tasks involve and expect
*Breaks down example responses for each question
*Explains and scaffolds students to write responses for each question
*Includes a comprehensive range of sentence starters and vocabulary for responding to each question
*Includes critical theory vocabulary lists to support Q2 responses
Ad
Data Visualizations with D3.js
- 1. Data Visualizations with D3.js Charlotte Front-End Developers Thursday, July 27, 2017 6:30 PM to 8:30 PM Brian Greig
- 2. Who am I • Brian Greig • Third Party Software Engineer at BoA • 13 years of web development and data analysis • Recent Charlotte transpant • Requisite Social Media @IgnoreIntuition github.com/ignoreintuition/ linkedin.com/in/bgreig/
- 3. Data Visualization with D3.js • Data Visualization concepts • Accessing data via API • Basic components • Binding data • Building visualizations • Making your visuals interactive
- 4. Data Visualization • What is Data Visualization? • What makes a Data Visualization good or bad? Subjective? Objective? • Does your chart tell a story? Does it give insight into the underlying data? • Why D3?
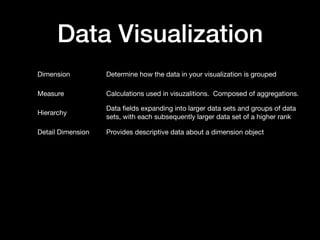
- 6. Data Visualization Dimension Determine how the data in your visualization is grouped Measure Calculations used in visuzalitions. Composed of aggregations. Hierarchy Data fields expanding into larger data sets and groups of data sets, with each subsequently larger data set of a higher rank than the set that came before it. Detail Dimension Provides descriptive data about a dimension object Schema Organization of data (blueprint) Subset Set of which all the elements are contained in another set. Key Terms
- 7. Accessing Data Via API • Spinning up an API Server • Using public APIs • Preprocessing data on your server and exposing it via your own API.
- 8. Accessing Data Via API • XMLHttpRequest • jQuery • d3.request - make an asynchronous request. • d3.queue - manage the concurrent evaluation of asynchronous tasks.
- 9. Basic Components Preparing your data for reporting • Server-side vs client-side • Pre-aggregation / real-time aggregation • Obtaining your data • Aggregating your data (d3.nest) • Filtering your data (array.prototype.filter) • Sorting your data (array.prototype.sort)
- 10. Basic Components Structuring your application • init: This is where you create your scales, ranges, domains, as well as binding your data to the DOM element that is going to use it. • enter: This is the initial, static visualization. here you will assign attributes and values to the different components of your element. • update: Here you will update any of the dynamic attributes of your graph if the user changes the context or scope of your data. • exit: Any cleanup.
- 11. Basic Components Your basic D3 Starter Kit • Define the dataset [1] • Create a container [3-5] • Bind your data [8] • Append visual components & set attributes [11-18] • Clean up [24]
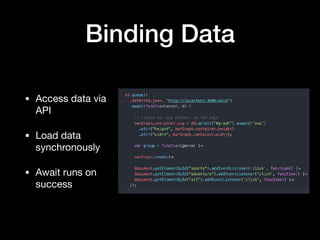
- 12. Binding Data • Access data via API • Load data synchronously • Await runs on success
- 13. Binding Data • Aggregate as much as possible on the server • Use rollup to further aggregate data on the front-end • Use array functions (filter, sort) to create subsets
- 14. The commonality between science and art is in trying to see profoundly - to develop strategies of seeing and showing. - Edward Tufte Build Visualizations
- 15. Build Visualizations _init() • set metric • set scale • scaleOrdinal • scaleLinear • set domains • set axis • bind data
- 16. Build Visualizations _enter() • append the elements to the SVG • set attributes • static • as a function of the data • draw axis
- 17. Build Visualizations Giving your data context • Titles: Always, ALWAYS, include titles. Just enough to give proper context • Tooltips. Allowing your users to highlight the components of your graph reduces clutter • Axis. Terse and explanatory • Colors. Varied and considerate of ADA • Legends. Only if they provide value
- 18. Making it Interactive Leverage the DOM API • Event listeners • Array prototype functions
- 19. Making it Interactive _update() • runs when the graph needs to be redrawn • transitions • update attributes • Attributes that don’t need to be recalculated should be left alone
- 20. Questions
- 21. Appendix • D3 API Reference: https://d3js.org/ • JSON Placeholder: https://jsonplaceholder.typicode.com/ • Github Repo: https://github.com/ignoreintuition/ dataviz_boilerplate • 20 Years of Games: https://www.kaggle.com/egrinstein/ 20-years-of-games