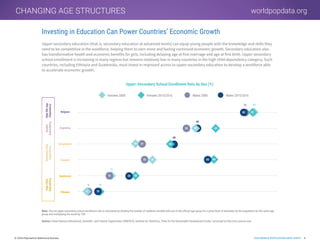
2018
WORLD
POPULATION
DATA SHEET
With a Special Focus on Changing Age Structures
worldpopdata.org
INFORM | EMPOWER | ADVANCE | prb.org
Projected share of world
population ages <15
in 2050, vs. 26% in 2018.21%
The world
population
in 2018.
7.6BILLION
Projected share of world
population ages 65+
in 2050, vs. 9% in 2018.16%
POPULATION REFERENCE BUREAU
© 2018 Population Reference Bureau  2018 WORLD POPULATION DATA SHEET 1
worldpopdata.orgCHANGING AGE STRUCTURES
Most Populous Countries (Millions)
2018
CHINA INDIA
UNITED
STATES INDONESIA BRAZIL PAKISTAN NIGERIA BANGLADESH RUSSIA MEXICO
1,394 1,371 328 265 209 201 196 166 147 131
2050
INDIA CHINA NIGERIA
UNITED
STATES INDONESIA PAKISTAN BRAZIL
CONGO,
DEM. REP. BANGLADESH ETHIOPIA
1,680 1,344 411 390 320 307 231 216 202 191
Total Fertility Rates, 2018
HIGHEST
NIGER CHAD
CONGO,
DEM. REP. SOMALIA ANGOLA MALI
BURKINA
FASO NIGERIA BURUNDI GAMBIA
7.2 6.4 6.3 6.3 6.2 6 5.5 5.5 5.5 5.4
LOWEST
SOUTH KOREA SINGAPORE TAIWAN
BOSNIA-
HERZEGOVINA MOLDOVA SPAIN ITALY GREECE UKRAINE ROMANIA
1.1 1.2 1.2 1.3 1.3 1.3 1.3 1.3 1.3 1.4
Check out the digital data sheet to view interactive
maps, videos, QA, and more exclusive content at
worldpopdata.org.
© 2018 Population Reference Bureau  2018 WORLD POPULATION DATA SHEET 2
worldpopdata.orgCHANGING AGE STRUCTURES
The World Population Is Growing Older
With continued declines in fertility and mortality, the global population’s shift toward an older age structure,
known as population aging, will accelerate. Older adults’ (ages 65+) share of the global population increased from
5 percent in 1960 to 9 percent in 2018 and is projected to rise to 16 percent by 2050, with the segment ages 85 and
older growing the fastest. Children’s (ages 0 to 14) share is falling, from 37 percent in 1960, to 26 percent in 2018,
with a projected decrease to 21 percent by 2050. The timing and speed of age structure changes vary
by country, and these changes have important social and economic implications.
Note: Lighter shaded areas show projected shares from 2018
through 2050.
Source: United Nations Population Division, World Population
Prospects: The 2017 Revision (New York: United Nations, 2017).
Percent of Population by Age Group, 1960-2050
1960
1960
1970 1980 1990 2000 2010 2020
2018
2030 2040 2050
2050
What Is Age Structure?
Age structure is the share of the
total population in each age group.
Population aging is measured by
the relative share of older people
in the population.
Ages 0-14 Ages 15-24 Ages 25-64 Ages 65+
26
21
37
15
14
17
41
50
49
5
9
16
© 2018 Population Reference Bureau  2018 WORLD POPULATION DATA SHEET 3
worldpopdata.orgCHANGING AGE STRUCTURES
Each Population Age Structure Presents Different Challenges
Population age structure has implications for national policy agendas and resource allocation. Countries
with relatively high fertility and child dependency face challenges in investing sufficient resources in the
development of young people’s human capital. If such investments are made, these countries have an
opportunity to reap the economic growth benefits of a larger, better educated working-age population.
Countries experiencing high old-age dependency or double dependency (relatively large shares of child
and older-adult populations) face different challenges. They must address the high costs of older adults’
medical and long-term care needs while also investing in the well-being of and future opportunities for
younger generations.
What Is a Dependency Ratio?
A dependency ratio is the number of people
in a dependent age group (those under
age 15 or ages 65 and older) divided by the
number in the working-age group (ages 15 to
64), multiplied by 100. For instance, a child
dependency ratio of 45 means there are 45
children for every 100 working-age individuals.
Countries by Age Dependency Category, 2018
High Child Dependency
High child dependency
ratio (45) and low old-age
dependency ratio (15).
Moderate Child Dependency
Moderate child dependency
ratio (29-45) and low old-age
dependency ratio (15).
Double Dependency
Moderate child dependency
ratio (29-45) and high old-age
dependency ratio (≥15).
High Old-Age Dependency
Low child dependency
ratio (29) and high old-age
dependency ratio (≥15).
Low Overall Dependency
Low child dependency
ratio (29) and low old-age
dependency ratio (15).
Notes: Israel is the only country with both a high child dependency ratio (45) and a high old-age dependency ratio (≥15). It is included in the double dependency category.
Source: United Nations Population Division, World Population Prospects: The 2017 Revision (New York: United Nations, 2017).
© 2018 Population Reference Bureau  2018 WORLD POPULATION DATA SHEET 4
worldpopdata.orgCHANGING AGE STRUCTURES
Investing in Education Can Power Countries’ Economic Growth
Upper-secondary education (that is, secondary education at advanced levels) can equip young people with the knowledge and skills they
need to be competitive in the workforce, helping them to earn more and fueling continued economic growth. Secondary education also
has transformative health and economic benefits for girls, including delaying age at first marriage and age at first birth. Upper secondary
school enrollment is increasing in many regions but remains relatively low in many countries in the high child dependency category. Such
countries, including Ethiopia and Guatemala, must invest in improved access to upper-secondary education to develop a workforce able
to accelerate economic growth.
HighOld-Age
Dependency
Upper-Secondary School Enrollment Rate by Sex (%)
Belgium
Argentina
Bangladesh
Ecuador
Guatemala
Ethiopia
36
28
28
68
69
25
6533
31
88
53
83
60
48
16
115
83
59
46
4 10
15
87
HighChild
Dependency
ModerateChild
Dependency
Double
Dependency
Males 2000 Males 2015/2016Females 2015/2016Females 2000
Note: The net upper-secondary school enrollment rate is calculated by dividing the number of students enrolled who are of the official age group for a given level of education by the population for the same age
group and multiplying the result by 100.
Source: United Nations Educational, Scientific, and Cultural Organization (UNESCO), Institute for Statistics, “Data for the Sustainable Development Goals,” accessed at http://uis.unesco.org/.
© 2018 Population Reference Bureau  2018 WORLD POPULATION DATA SHEET 5
worldpopdata.orgCHANGING AGE STRUCTURES
Old-Age Labor Force Participation Decreases for Men in Developing Regions
A country’s age structure and its socioeconomic and political contexts can influence the labor force participation rate (LFPR) of older
adults. At the same time, old-age LFPR can impact countries’ policies and social support structures. Rates vary considerably by country.
Overall, they tend to be higher in countries in the high and moderate child dependency categories. However, many countries in these
categories, including the Philippines, show an emerging pattern of decline in older men’s LFPR. In contrast, older adults’ LFPR is
generally rising in high old-age dependency category countries. This rise is driven in part by longer life expectancies and policies that
provide incentives to keep older adults in the formal labor market. Older women’s LFPR is increasing in many countries around the
world, spurred by social security reforms and changing cultural norms.
HighChild
Dependency
Moderate
Child
Dependency
Double
Dependency
HighOld-Age
Dependency
Germany
Japan
United States
Brazil
Phillippines
Tanzania
Labor Force Participation Rate Among Adults Ages 65 and Older by Sex (%)
2 4
32
31
24
29
35
50
78
19
13
11
14
16
16
55
13
47
72
28
28
5 9
51
Males 2000-2004 Males 2014-2017Females 2014-2017Females 2000-2004
Note: The old-age labor force participation rate is defined as the number of individuals ages 65 and older participating in the labor force—by working for pay either part-time or full-time or actively looking for
work—as a percentage of the total population ages 65 and older.
Source: International Labor Organization, Database of Labor Statistics; U.S. Census Bureau, International Population Reports, P95/16-1, An Aging World: 2015 (Washington, DC: U.S. Government Publishing Office,
2016); United Nations, Population Division, World Population Ageing 2015 (New York: United Nations, 2015).
© 2018 Population Reference Bureau  2018 WORLD POPULATION DATA SHEET 6
worldpopdata.orgCHANGING AGE STRUCTURES
The Child Poverty Rate in the United States Has Exceeded
the Rate for Older Adults Since 1974
The poverty rate is one important indicator of economic well-being that varies widely across age groups. In the mid-
1960s, 29 percent of U.S. adults ages 65 and older lived in poverty, compared with 18 percent of children under age 18.
However, trends in poverty rates for these two age groups have diverged markedly since 1974, with the rate among
older adults decreasing, and the rate among children rising to new peaks in the mid-1980s, mid-1990s, and from 2010
to 2012 following the Great Recession. Entitlement programs such as Social Security and Medicare have been effective
in reducing poverty among older adults, but their costs have been rising rapidly as the U.S. population ages. With
limited resources, the United States will continue to face difficult trade-offs in improving the well-being of both children
and older adults. Investing resources today to reduce poverty among children can increase their future productive
capacity and help offset the costs of an aging population.
Percent of Persons in Poverty by Age Group in the United States, 1966-2016
Ages 65+Ages 18
Source: PRB analysis of data from the U.S. Census Bureau, Current Population Survey, Annual Social and Economic Supplement.
1966 1971 1976 1981 1986 1991 1996 2001 2006 2011 2016
29
9
18 1820%
10%
0%
30%
40%
© 2018 Population Reference Bureau	 See notes on page 18 2018 WORLD POPULATION DATA SHEET 7
9.9
BILLION
82 26% 88
Projected
world population
in 2050.
Projected number of
countries in 2050 with
at least 20% of the
population ages 65+,
vs. 13 countries in 2018.
Shareofmarriedwomenin
Senegalusingmodernfamily
planningmethodsin2017,
upfrom12%in2011.
Average life expectancy
for women in Hong Kong,
the highest in the world.
15%1.4 5.6 35%
Total fertility rate in
southern Europe,
the lowest rate of
any world region.
Projectedshare
ofthepopulation
ages15inBrazilin
2050vs.22%in2018.
Number of infant deaths
per 1,000 live births
in the United States,
49th lowest in the world.
HIV prevalence among
women ages 15-49
in eSwatini, the highest
in the world.
CHANGING AGE STRUCTURES
© 2018 Population Reference Bureau	 See notes on page 18 2018 WORLD POPULATION DATA SHEET 8
Population
(millions)
mid-2018
Births
per 1,000
Population
Deaths
per 1,000
Population
Rate of
Natural
Increase (%)
Net
Migration
Rate
Population (millions) Infant
Mortality
Ratea
Total
Fertility
Rateb
GNI per Capita,
PPP 2017c
Percent
Urban
Population
per km2 of
Arable Land
Married Women 15-49
Using Contraceptiond (%) Ages 15-49 With HIV/AID
mid-2030 mid-2050 All Methods Modern Methods Males 2017 Female
WORLD 7,621 19 7 1.2 0 8,571 9,852 31 2.4 16,927 55 535 62 56 — —
MORE DEVELOPED 1,266 10 10 0.0 3 1,301 1,312 5 1.6 43,409 79 242 68 59 — —
LESS DEVELOPED 6,355 21 7 1.4 -1 7,270 8,540 34 2.6 11,445 50 704 61 55 — —
LESS DEVELOPED (Excl. China) 4,953 23 7 1.7 -1 5,841 7,187 37 2.8 9,840 48 632 54 47 0.9 1
LEAST DEVELOPED 1,027 33 8 2.5 -1 1,342 1,954 49 4.2 2,723 33 585 37 33 1.5 2
AFRICA 1,284 35 9 2.6 -1 1,714 2,586 50 4.6 4,965 43 546 36 32 2.7 4
NORTHERN AFRICA 235 26 6 2.0 -1 289 385 24 3.3 10,557 52 548 52 47 0.1 0
Algeria 42.7 26 4 2.2 -0 51.3 64.3 22 3.1 15,050 73 572 57 50 0.1 0
Egypt 97.0 27 6 2.1 -1 120.8 166.5 15 3.4 11,360 43 3,350 59 57 0.1 0
Libya 6.5 20 5 1.4 -4 7.3 8.1 22 2.3 19,940 80 376 42 20 — —
Morocco 35.2 18 5 1.2 -2 39.3 43.6 22 2.2 8,063 62 433 67 59 0.1 0
Sudan 41.7 34 8 2.7 -2 56.8 88.1 45 4.7 4,482 36 210 12 12 0.2 0
Tunisia 11.6 19 6 1.4 -0 12.7 13.8 15 2.3 11,490 68 399 63 51 0.1 0
Western Sahara 0.6 20 5 1.5 7 0.7 0.9 30 2.3 — 87 14,150 — — — —
SUB-SAHARAN AFRICA 1,049 37 9 2.7 -0 1,425 2,200 54 4.9 3,683 40 546 33 28 3.3 5
WESTERN AFRICA 382 38 11 2.7 -1 518 809 62 5.3 4,174 46 445 24 18 1.8 2
Benin 11.5 37 9 2.8 -0 15.6 23.9 63 5.0 2,260 45 425 18 13 0.7 1
Burkina Faso 20.3 40 9 3.1 -1 28.9 48.5 57 5.5 1,810 29 338 32 30 0.6 1
Cabo Verde 0.6 19 5 1.4 -3 0.6 0.6 21 2.2 6,570 66 1,101 61 57 0.5 0
Côte d’Ivoire 24.9 35 12 2.3 0 33.3 51.4 62 4.6 3,820 51 859 24 19 1.9 3
Gambia 2.2 39 8 3.1 -1 3.1 5.0 46 5.4 1,670 61 494 9 8 1.4 1
Ghana 29.5 30 8 2.2 -1 37.3 51.3 37 3.9 4,490 56 627 33 27 1.0 2
Guinea 11.9 39 11 2.8 -2 16.3 25.3 68 4.8 2,270 35 383 9 8 1.1 1
Guinea-Bissau 1.9 36 11 2.6 -1 2.5 3.6 73 4.6 1,700 43 636 16 14 2.6 4
Liberia 4.9 33 8 2.5 -1 6.5 9.8 50 4.2 710 51 971 31 31 1.0 1
Mali 19.4 45 10 3.5 -4 27.5 44.8 56 6.0 2,160 42 303 16 15 0.9 1
Mauritania 4.5 34 8 2.6 1 6.1 9.0 65 4.6 3,900 54 1,009 18 16 0.4 0
Niger 22.2 48 10 3.8 -0 34.0 63.1 60 7.2 990 16 132 19 18 0.3 0
Nigeria 195.9 39 12 2.6 -0 264.1 410.6 67 5.5 5,680 50 576 24 16 2.5 3
Senegal 16.3 33 6 2.7 -1 22.1 34.0 42 4.6 2,620 46 509 28 26 0.3 0
Sierra Leone 7.7 33 13 2.0 -1 9.7 13.0 84 4.2 1,480 41 487 17 16 1.1 1
Togo 8.0 34 9 2.5 -0 10.5 15.3 52 4.5 1,620 42 302 20 17 1.5 2
EASTERN AFRICA 432 36 8 2.8 -1 584 883 45 4.7 2,192 28 651 41 38 3.4 5
Burundi 11.8 41 11 3.0 -0 17.2 30.4 47 5.5 770 13 987 29 23 0.8 1
Comoros 0.8 33 7 2.5 -2 1.1 1.5 55 4.3 1,570 29 1,281 19 14 0.1 0
Djibouti 1.0 23 8 1.5 1 1.1 1.3 52 2.9 — 78 48,550 19 18 1.1 1
Eritrea 6.0 30 7 2.3 -15 6.8 8.9 46 4.1 1,500 40 865 8 7 0.4 0
Ethiopia 107.5 33 7 2.6 -0 139.6 190.9 40 4.4 1,890 20 711 37 35 0.7 1
Kenya 51.0 31 6 2.6 -0 67.0 95.5 36 3.9 3,250 32 878 62 60 3.5 6
Madagascar 26.3 32 6 2.6 -0 35.6 53.8 32 4.1 1,510 37 750 40 33 0.4 0
Malawi 19.1 34 7 2.6 -1 25.6 37.4 42 4.2 1,180 17 502 59 58 7.4 11
Mauritius 1.3 11 8 0.3 -1 1.3 1.2 11.8 1.4 22,570 41 1,710 64 32 — —
Mayotte 0.3 39 3 3.6 -0 0.4 0.6 4 5.1 — 46 2,970 — — — —
Mozambique 30.5 39 10 2.9 -0 42.4 67.8 65 5.3 1,200 32 540 27 25 9.9 15
Réunion 0.9 16 6 1.0 -4 0.9 1.0 7 2.4 — 100 2,539 — — — —
Rwanda 12.6 32 6 2.6 -1 16.6 24.3 32 4.2 1,990 19 1,091 53 48 1.9 3
Seychelles 0.1 17 8 1.0 -3 0.1 0.1 13.4 2.4 26,860 57 64,364 — — — —
Somalia 15.2 43 11 3.2 -3 21.5 35.9 72 6.3 — 45 1,380 15 14 0.1 0
South Sudan 13.0 37 11 2.6 4 17.9 27.9 69 5.0 1,440 20 — 4 2 2.0 2
Tanzania 59.1 39 7 3.3 -1 83.7 138.1 43 5.2 2,916 34 438 38 32 3.4 5
Uganda 44.1 41 9 3.2 -1 61.6 95.6 43 5.4 1,820 24 639 42 36 4.5 7
Zambia 17.7 39 8 3.1 -0 25.8 45.1 49 5.2 3,920 44 465 49 45 8.8 14
POPULATION, HEALTH, AND ENVIRONMENT DATA AND ESTIMATES FOR THE COUNTRIESPOPULATION, HEALTH, AND ENVIRONMENT DATA AND ESTIMATES FOR THE COUNTRIES, TERRITORIES, AND REGIONS OF THE WORLD
© 2018 Population Reference Bureau	 See notes on page 18 2018 WORLD POPULATION DATA SHEET 9
Capita,
017c
Percent
Urban
Population
per km2 of
Arable Land
Married Women 15-49
Using Contraceptiond (%) Ages 15-49 With HIV/AIDS (%) Life Expectancy at Birth (Years) Life Expectancy at Age 65 (Years) Population Ages 15 Population Ages 65+
All Methods Modern Methods Males 2017 Females 2017 Males Females Males Females 2018 (%) 2050 (%)
2050 as a
Multiple of 2018e 2018 (%) 2050 (%)
2050 as a
Multiple of 2018e
27 55 535 62 56 — — 70 74 16 18 26 21 1.1 9 16 2.3
409 79 242 68 59 — — 76 82 18 21 16 16 1.0 18 27 1.5
445 50 704 61 55 — — 69 73 15 17 28 22 1.1 7 14 2.8
840 48 632 54 47 0.9 1.3 67 71 15 17 31 24 1.1 6 12 3.0
723 33 585 37 33 1.5 2.3 63 66 14 15 40 31 1.5 4 7 3.5
65 43 546 36 32 2.7 4.3 61 64 13 15 41 32 1.6 3 6 3.4
57 52 548 52 47 0.1 0.1 71 74 15 16 32 25 1.2 5 12 3.8
050 73 572 57 50 0.1 0.1 77 78 18 19 29 20 1.0 6 17 4.3
360 43 3,350 59 57 0.1 0.1 71 74 13 15 34 25 1.3 4 11 4.7
940 80 376 42 20 — — 69 75 13 16 28 18 0.8 4 17 4.6
063 62 433 67 59 0.1 0.1 75 78 15 17 24 19 0.9 8 18 2.7
482 36 210 12 12 0.2 0.2 63 66 14 15 41 31 1.6 4 6 3.4
490 68 399 63 51 0.1 0.1 75 78 15 18 24 18 0.9 8 20 2.9
— 87 14,150 — — — — 68 72 13 15 28 20 1.1 3 12 6.8
683 40 546 33 28 3.3 5.2 59 62 13 14 43 33 1.6 3 5 3.3
74 46 445 24 18 1.8 2.4 56 58 11 12 44 35 1.7 3 4 3.2
260 45 425 18 13 0.7 1.3 59 62 13 14 43 34 1.6 3 5 3.1
810 29 338 32 30 0.6 1.0 60 61 12 12 47 35 1.8 3 4 3.4
570 66 1,101 61 57 0.5 0.7 71 75 14 16 31 19 0.7 4 12 3.2
820 51 859 24 19 1.9 3.7 52 55 11 12 43 35 1.7 3 4 2.8
670 61 494 9 8 1.4 1.9 60 63 12 13 46 33 1.7 2 4 4.0
490 56 627 33 27 1.0 2.3 62 64 12 13 39 30 1.3 3 6 3.3
270 35 383 9 8 1.1 1.9 58 61 12 12 45 33 1.5 4 5 2.7
700 43 636 16 14 2.6 4.1 56 59 12 12 42 32 1.4 3 5 3.3
710 51 971 31 31 1.0 1.8 62 64 12 13 42 32 1.6 3 5 3.6
160 42 303 16 15 0.9 1.6 58 62 12 12 47 36 1.8 2 4 3.8
900 54 1,009 18 16 0.4 0.3 62 65 12 13 40 32 1.6 3 6 3.6
990 16 132 19 18 0.3 0.3 59 61 12 13 50 43 2.4 3 3 2.9
680 50 576 24 16 2.5 3.0 53 54 11 11 44 35 1.7 3 4 3.1
620 46 509 28 26 0.3 0.6 65 69 13 14 43 33 1.6 3 5 3.8
480 41 487 17 16 1.1 1.6 51 52 10 10 42 29 1.2 3 5 3.1
620 42 302 20 17 1.5 2.7 59 61 12 12 42 32 1.5 3 5 3.5
92 28 651 41 38 3.4 5.6 62 66 14 15 43 32 1.5 3 5 3.5
770 13 987 29 23 0.8 1.4 59 62 13 14 46 36 2.1 2 4 4.2
570 29 1,281 19 14 0.1 0.1 62 65 12 14 40 30 1.3 3 6 3.5
— 78 48,550 19 18 1.1 1.5 61 64 14 15 32 21 0.9 4 10 3.3
500 40 865 8 7 0.4 0.7 62 68 13 14 41 30 1.1 4 6 2.3
890 20 711 37 35 0.7 1.2 64 67 14 15 41 26 1.1 4 7 3.3
250 32 878 62 60 3.5 6.2 65 69 14 16 41 29 1.3 3 7 5.1
510 37 750 40 33 0.4 0.2 64 68 13 14 41 32 1.6 3 6 4.0
180 17 502 59 58 7.4 11.7 61 66 14 15 44 32 1.4 3 5 3.2
570 41 1,710 64 32 — — 71 78 15 19 19 14 0.7 11 24 2.2
— 46 2,970 — — — — 74 77 18 22 44 27 1.3 3 10 8.1
200 32 540 27 25 9.9 15.0 56 60 13 14 45 35 1.7 3 4 3.0
— 100 2,539 — — — — 78 84 18 22 24 17 0.8 11 25 2.6
990 19 1,091 53 48 1.9 3.4 65 69 14 15 40 27 1.3 3 8 5.0
860 57 64,364 — — — — 68 78 14 18 22 18 0.8 8 23 2.8
— 45 1,380 15 14 0.1 0.1 55 58 13 13 47 38 1.9 3 3 2.9
440 20 — 4 2 2.0 2.9 56 58 13 14 42 32 1.7 3 5 3.0
916 34 438 38 32 3.4 5.5 64 67 14 15 45 36 1.9 3 5 3.6
820 24 639 42 36 4.5 7.3 62 64 13 14 48 36 1.6 3 4 3.0
920 44 465 49 45 8.8 14.3 59 64 14 15 45 36 2.0 2 4 4.5
MENT DATA AND ESTIMATES FOR THE COUNTRIES, TERRITORIES, AND REGIONS OF THE WORLD
Population
(millions)
mid-2018
Births
per 1,000
Population
Deaths
per 1,000
Population
Rate of
Natural
Increase (%)
Net
Migration
Rate
Population (millions) Infant
Mortality
Ratea
Total
Fertility
Rateb
GNI per Capita,
PPP 2017c
Percent
Urban
Population
per km2 of
Arable Land
Married Women 15-49
Using Contraceptiond (%) Ages 15-49 With HIV/AID
mid-2030 mid-2050 All Methods Modern Methods Males 2017 Female
WORLD 7,621 19 7 1.2 0 8,571 9,852 31 2.4 16,927 55 535 62 56 — —
MORE DEVELOPED 1,266 10 10 0.0 3 1,301 1,312 5 1.6 43,409 79 242 68 59 — —
LESS DEVELOPED 6,355 21 7 1.4 -1 7,270 8,540 34 2.6 11,445 50 704 61 55 — —
LESS DEVELOPED (Excl. China) 4,953 23 7 1.7 -1 5,841 7,187 37 2.8 9,840 48 632 54 47 0.9 1
LEAST DEVELOPED 1,027 33 8 2.5 -1 1,342 1,954 49 4.2 2,723 33 585 37 33 1.5 2
AFRICA 1,284 35 9 2.6 -1 1,714 2,586 50 4.6 4,965 43 546 36 32 2.7 4
NORTHERN AFRICA 235 26 6 2.0 -1 289 385 24 3.3 10,557 52 548 52 47 0.1 0
Algeria 42.7 26 4 2.2 -0 51.3 64.3 22 3.1 15,050 73 572 57 50 0.1 0
Egypt 97.0 27 6 2.1 -1 120.8 166.5 15 3.4 11,360 43 3,350 59 57 0.1 0
Libya 6.5 20 5 1.4 -4 7.3 8.1 22 2.3 19,940 80 376 42 20 — —
Morocco 35.2 18 5 1.2 -2 39.3 43.6 22 2.2 8,063 62 433 67 59 0.1 0
Sudan 41.7 34 8 2.7 -2 56.8 88.1 45 4.7 4,482 36 210 12 12 0.2 0
Tunisia 11.6 19 6 1.4 -0 12.7 13.8 15 2.3 11,490 68 399 63 51 0.1 0
Western Sahara 0.6 20 5 1.5 7 0.7 0.9 30 2.3 — 87 14,150 — — — —
SUB-SAHARAN AFRICA 1,049 37 9 2.7 -0 1,425 2,200 54 4.9 3,683 40 546 33 28 3.3 5
WESTERN AFRICA 382 38 11 2.7 -1 518 809 62 5.3 4,174 46 445 24 18 1.8 2
Benin 11.5 37 9 2.8 -0 15.6 23.9 63 5.0 2,260 45 425 18 13 0.7 1
Burkina Faso 20.3 40 9 3.1 -1 28.9 48.5 57 5.5 1,810 29 338 32 30 0.6 1
Cabo Verde 0.6 19 5 1.4 -3 0.6 0.6 21 2.2 6,570 66 1,101 61 57 0.5 0
Côte d’Ivoire 24.9 35 12 2.3 0 33.3 51.4 62 4.6 3,820 51 859 24 19 1.9 3
Gambia 2.2 39 8 3.1 -1 3.1 5.0 46 5.4 1,670 61 494 9 8 1.4 1
Ghana 29.5 30 8 2.2 -1 37.3 51.3 37 3.9 4,490 56 627 33 27 1.0 2
Guinea 11.9 39 11 2.8 -2 16.3 25.3 68 4.8 2,270 35 383 9 8 1.1 1
Guinea-Bissau 1.9 36 11 2.6 -1 2.5 3.6 73 4.6 1,700 43 636 16 14 2.6 4
Liberia 4.9 33 8 2.5 -1 6.5 9.8 50 4.2 710 51 971 31 31 1.0 1
Mali 19.4 45 10 3.5 -4 27.5 44.8 56 6.0 2,160 42 303 16 15 0.9 1
Mauritania 4.5 34 8 2.6 1 6.1 9.0 65 4.6 3,900 54 1,009 18 16 0.4 0
Niger 22.2 48 10 3.8 -0 34.0 63.1 60 7.2 990 16 132 19 18 0.3 0
Nigeria 195.9 39 12 2.6 -0 264.1 410.6 67 5.5 5,680 50 576 24 16 2.5 3
Senegal 16.3 33 6 2.7 -1 22.1 34.0 42 4.6 2,620 46 509 28 26 0.3 0
Sierra Leone 7.7 33 13 2.0 -1 9.7 13.0 84 4.2 1,480 41 487 17 16 1.1 1
Togo 8.0 34 9 2.5 -0 10.5 15.3 52 4.5 1,620 42 302 20 17 1.5 2
EASTERN AFRICA 432 36 8 2.8 -1 584 883 45 4.7 2,192 28 651 41 38 3.4 5
Burundi 11.8 41 11 3.0 -0 17.2 30.4 47 5.5 770 13 987 29 23 0.8 1
Comoros 0.8 33 7 2.5 -2 1.1 1.5 55 4.3 1,570 29 1,281 19 14 0.1 0
Djibouti 1.0 23 8 1.5 1 1.1 1.3 52 2.9 — 78 48,550 19 18 1.1 1
Eritrea 6.0 30 7 2.3 -15 6.8 8.9 46 4.1 1,500 40 865 8 7 0.4 0
Ethiopia 107.5 33 7 2.6 -0 139.6 190.9 40 4.4 1,890 20 711 37 35 0.7 1
Kenya 51.0 31 6 2.6 -0 67.0 95.5 36 3.9 3,250 32 878 62 60 3.5 6
Madagascar 26.3 32 6 2.6 -0 35.6 53.8 32 4.1 1,510 37 750 40 33 0.4 0
Malawi 19.1 34 7 2.6 -1 25.6 37.4 42 4.2 1,180 17 502 59 58 7.4 11
Mauritius 1.3 11 8 0.3 -1 1.3 1.2 11.8 1.4 22,570 41 1,710 64 32 — —
Mayotte 0.3 39 3 3.6 -0 0.4 0.6 4 5.1 — 46 2,970 — — — —
Mozambique 30.5 39 10 2.9 -0 42.4 67.8 65 5.3 1,200 32 540 27 25 9.9 15
Réunion 0.9 16 6 1.0 -4 0.9 1.0 7 2.4 — 100 2,539 — — — —
Rwanda 12.6 32 6 2.6 -1 16.6 24.3 32 4.2 1,990 19 1,091 53 48 1.9 3
Seychelles 0.1 17 8 1.0 -3 0.1 0.1 13.4 2.4 26,860 57 64,364 — — — —
Somalia 15.2 43 11 3.2 -3 21.5 35.9 72 6.3 — 45 1,380 15 14 0.1 0
South Sudan 13.0 37 11 2.6 4 17.9 27.9 69 5.0 1,440 20 — 4 2 2.0 2
Tanzania 59.1 39 7 3.3 -1 83.7 138.1 43 5.2 2,916 34 438 38 32 3.4 5
Uganda 44.1 41 9 3.2 -1 61.6 95.6 43 5.4 1,820 24 639 42 36 4.5 7
Zambia 17.7 39 8 3.1 -0 25.8 45.1 49 5.2 3,920 44 465 49 45 8.8 14
POPULATION, HEALTH, AND ENVIRONMENT DATA AND ESTIMATES FOR THE COUNTRIESPOPULATION, HEALTH, AND ENVIRONMENT DATA AND ESTIMATES FOR THE COUNTRIES, TERRITORIES, AND REGIONS OF THE WORLD
© 2018 Population Reference Bureau	 See notes on page 18 2018 WORLD POPULATION DATA SHEET 10
Mauritius 1.3 11 8 0.3 -1 1.3 1.2 11.8 1.4 22,570 41 1,710 64 32 — —
Mayotte 0.3 39 3 3.6 -0 0.4 0.6 4 5.1 — 46 2,970 — — — —
Mozambique 30.5 39 10 2.9 -0 42.4 67.8 65 5.3 1,200 32 540 27 25 9.9 15
Réunion 0.9 16 6 1.0 -4 0.9 1.0 7 2.4 — 100 2,539 — — — —
Rwanda 12.6 32 6 2.6 -1 16.6 24.3 32 4.2 1,990 19 1,091 53 48 1.9 3
Seychelles 0.1 17 8 1.0 -3 0.1 0.1 13.4 2.4 26,860 57 64,364 — — — —
Somalia 15.2 43 11 3.2 -3 21.5 35.9 72 6.3 — 45 1,380 15 14 0.1 0
South Sudan 13.0 37 11 2.6 4 17.9 27.9 69 5.0 1,440 20 — 4 2 2.0 2
Tanzania 59.1 39 7 3.3 -1 83.7 138.1 43 5.2 2,916 34 438 38 32 3.4 5
Uganda 44.1 41 9 3.2 -1 61.6 95.6 43 5.4 1,820 24 639 42 36 4.5 7
Zambia 17.7 39 8 3.1 -0 25.8 45.1 49 5.2 3,920 44 465 49 45 8.8 14
Zimbabwe 14.0 34 10 2.4 -10 17.6 25.6 50 4.0 1,850 32 351 67 66 10.5 16
MIDDLE AFRICA 169 42 10 3.2 -0 245 414 61 5.9 2,780 49 654 20 11 1.1 2
Angola 30.4 45 10 3.5 0 45.4 82.2 44 6.2 6,060 63 620 14 13 1.2 2
Cameroon 25.6 36 10 2.6 0 34.4 51.9 52 4.7 3,640 56 414 34 21 2.5 4
Central African Republic 4.7 36 14 2.2 -10 6.1 8.9 85 4.9 730 41 263 15 12 3.3 4
Chad 15.4 45 13 3.1 1 22.2 36.8 72 6.4 1,920 23 314 6 5 1.0 1
Congo 5.4 33 10 2.3 -5 7.3 11.5 41 4.4 4,880 67 982 30 19 1.9 4
Congo, Dem. Rep. 84.3 43 10 3.3 0 124.3 215.9 67 6.3 870 45 1,188 20 8 0.4 1
Equatorial Guinea 1.3 34 10 2.4 14 1.9 2.8 64 4.7 19,380 71 1,095 13 10 5.4 8
Gabon 2.1 29 8 2.2 3 2.9 3.9 37 3.8 17,010 89 632 31 19 2.3 6
São Tomé and Príncipe 0.2 33 7 2.6 -5 0.3 0.3 38 4.4 3,370 73 2,425 41 37 — —
SOUTHERN AFRICA 66 22 9 1.2 3 78 94 38 2.5 12,693 64 468 55 54 14.0 23
Botswana 2.2 22 10 1.2 3 2.6 3.2 31 2.6 16,990 70 564 53f 51f 18.4 27
eSwatini 1.4 29 10 1.9 -1 1.7 2.1 50 3.3 8,520 24 795 66 66 19.3 35
Lesotho 2.3 29 13 1.6 -2 2.6 3.2 59 3.3 3,510 28 831 60 60 18.7 29
Namibia 2.5 28 8 2.0 0 3.1 4.2 36 3.4 10,320 48 317 56 55 9.5 14
South Africa 57.7 21 9 1.2 4 67.9 81.8 36 2.4 13,090 66 462 55 54 14.0 23
AMERICAS 1,014 15 7 0.8 1 1,113 1,220 13 2.0 31,140 80 273 74 68 — —
NORTHERN AMERICA 365 12 9 0.3 4 396 437 6 1.7 58,737 82 186 74 63 — —
Canada 37.2 11 8 0.3 11 41.0 46.9 4.5 1.5 45,750 81 85 85f — — —
United States 328.0 12 9 0.3 3 354.7 389.6 5.6 1.8 60,200 82 215 73 63 — —
LATIN AMERICA AND THE CARIBBEAN 649 17 6 1.1 -1 717 783 16 2.1 15,273 78 370 74 70 0.7 0
CENTRAL AMERICA 179 19 5 1.4 -1 204 231 19 2.3 15,384 69 641 68 64 0.4 0
Belize 0.4 23 5 1.8 4 0.5 0.6 9 2.6 7,890 45 510 51 49 2.0 1
Costa Rica 5.0 14 5 0.9 2 5.6 6.1 8.0 1.7 16,100 73 2,157 76 75 0.6 0
El Salvador 6.5 20 7 1.3 -7 7.1 8.0 17 2.3 7,540 70 863 72 68 0.8 0
Guatemala 17.2 24 5 1.9 -1 21.2 27.0 28 2.8 8,000 51 1,847 61 49 0.5 0
Honduras 9.0 22 5 1.7 -0 10.3 11.3 25 2.5 4,630 54 884 73 64 0.4 0
Mexico 130.8 19 6 1.3 -1 147.5 164.3 17 2.2 17,740 73 571 67 65 0.4 0
Nicaragua 6.3 20 5 1.5 -4 7.0 7.9 18 2.2 5,680 59 416 80 77 0.3 0
Panama 4.2 19 5 1.4 1 4.9 5.8 14 2.4 21,890 69 739 63 60 1.3 0
CARIBBEAN 43 17 8 0.9 -4 46 47 34 2.2 — 71 830 61 58 1.2 1
Antigua and Barbuda 0.1 15 6 0.9 -0 0.1 0.1 8 1.9 22,980 25 2,564 — — — —
Bahamas 0.4 13 6 0.7 3 0.4 0.4 8 1.6 29,790 83 4,963 — — 2.0 1
Barbados 0.3 11 9 0.1 1 0.3 0.3 9 1.6 17,830 31 2,593 59 55 2.2 1
Cuba 11.1 10 9 0.2 -5 10.8 9.8 4.3 1.6 — 77 369 74 72 0.6 0
Curaçao 0.2 10 9 0.1 -3 0.2 0.2 10.7 1.5 — 89 — — — — —
Dominica 0.07 12 8 0.4 1 0.08 0.08 20 1.8 10,170 71 1,211 — — — —
Dominican Republic 10.8 20 6 1.4 -3 12.0 13.2 31 2.5 15,290 80 1,354 70 68 1.0 0
Grenada 0.1 16 9 0.7 -0 0.1 0.1 19 2.1 14,410 36 3,807 — — — —
Guadeloupe 0.4 10 8 0.1 -9 0.4 0.4 8.1 1.7 — 99 1,707 — — — —
Haiti 10.8 25 8 1.7 -2 12.4 14.5 59 3.0 1,830 55 1,008 34 32 1.5 2
Jamaica 2.9 17 7 1.0 -6 2.9 2.7 14 2.0 8,690 56 2,416 73 68 2.4 1
Martinique 0.4 9 9 0.0 -9 0.4 0.3 7 1.7 — 89 3,329 — — — —
Puerto Rico 3.3 7 9 -0.2 -17 3.2 2.9 7.0 1.1 25,240 94 5,352 84f 72f — —
St. Kitts-Nevis 0.05 14 9 0.5 3 0.06 0.06 17 1.8 26,300 31 1,062 — — — —
Saint Lucia 0.2 12 6 0.7 -3 0.2 0.2 18 1.5 13,230 19 5,780 56 53 — —
St. Vincent and the Grenadines 0.1 16 9 0.7 -6 0.1 0.1 18 2.1 11,770 52 2,210 — — — —
Trinidad and Tobago 1.4 13 8 0.5 -1 1.4 1.4 13 1.6 30,520 53 5,450 40 38 1.4 0
Population
(millions)
mid-2018
Births
per 1,000
Population
Deaths
per 1,000
Population
Rate of
Natural
Increase (%)
Net
Migration
Rate
Population (millions) Infant
Mortality
Ratea
Total
Fertility
Rateb
GNI per Capita,
PPP 2017c
Percent
Urban
Population
per km2 of
Arable Land
Married Women 15-49
Using Contraceptiond (%) Ages 15-49 With HIV/AID
mid-2030 mid-2050 All Methods Modern Methods Males 2017 Female
WORLD 7,621 19 7 1.2 0 8,571 9,852 31 2.4 16,927 55 535 62 56 — —
MORE DEVELOPED 1,266 10 10 0.0 3 1,301 1,312 5 1.6 43,409 79 242 68 59 — —
LESS DEVELOPED 6,355 21 7 1.4 -1 7,270 8,540 34 2.6 11,445 50 704 61 55 — —
LESS DEVELOPED (Excl. China) 4,953 23 7 1.7 -1 5,841 7,187 37 2.8 9,840 48 632 54 47 0.9 1
LEAST DEVELOPED 1,027 33 8 2.5 -1 1,342 1,954 49 4.2 2,723 33 585 37 33 1.5 2
AFRICA 1,284 35 9 2.6 -1 1,714 2,586 50 4.6 4,965 43 546 36 32 2.7 4
NORTHERN AFRICA 235 26 6 2.0 -1 289 385 24 3.3 10,557 52 548 52 47 0.1 0
Algeria 42.7 26 4 2.2 -0 51.3 64.3 22 3.1 15,050 73 572 57 50 0.1 0
Egypt 97.0 27 6 2.1 -1 120.8 166.5 15 3.4 11,360 43 3,350 59 57 0.1 0
Libya 6.5 20 5 1.4 -4 7.3 8.1 22 2.3 19,940 80 376 42 20 — —
Morocco 35.2 18 5 1.2 -2 39.3 43.6 22 2.2 8,063 62 433 67 59 0.1 0
Sudan 41.7 34 8 2.7 -2 56.8 88.1 45 4.7 4,482 36 210 12 12 0.2 0
Tunisia 11.6 19 6 1.4 -0 12.7 13.8 15 2.3 11,490 68 399 63 51 0.1 0
Western Sahara 0.6 20 5 1.5 7 0.7 0.9 30 2.3 — 87 14,150 — — — —
SUB-SAHARAN AFRICA 1,049 37 9 2.7 -0 1,425 2,200 54 4.9 3,683 40 546 33 28 3.3 5
WESTERN AFRICA 382 38 11 2.7 -1 518 809 62 5.3 4,174 46 445 24 18 1.8 2
Benin 11.5 37 9 2.8 -0 15.6 23.9 63 5.0 2,260 45 425 18 13 0.7 1
Burkina Faso 20.3 40 9 3.1 -1 28.9 48.5 57 5.5 1,810 29 338 32 30 0.6 1
Cabo Verde 0.6 19 5 1.4 -3 0.6 0.6 21 2.2 6,570 66 1,101 61 57 0.5 0
Côte d’Ivoire 24.9 35 12 2.3 0 33.3 51.4 62 4.6 3,820 51 859 24 19 1.9 3
Gambia 2.2 39 8 3.1 -1 3.1 5.0 46 5.4 1,670 61 494 9 8 1.4 1
Ghana 29.5 30 8 2.2 -1 37.3 51.3 37 3.9 4,490 56 627 33 27 1.0 2
Guinea 11.9 39 11 2.8 -2 16.3 25.3 68 4.8 2,270 35 383 9 8 1.1 1
Guinea-Bissau 1.9 36 11 2.6 -1 2.5 3.6 73 4.6 1,700 43 636 16 14 2.6 4
Liberia 4.9 33 8 2.5 -1 6.5 9.8 50 4.2 710 51 971 31 31 1.0 1
Mali 19.4 45 10 3.5 -4 27.5 44.8 56 6.0 2,160 42 303 16 15 0.9 1
Mauritania 4.5 34 8 2.6 1 6.1 9.0 65 4.6 3,900 54 1,009 18 16 0.4 0
Niger 22.2 48 10 3.8 -0 34.0 63.1 60 7.2 990 16 132 19 18 0.3 0
Nigeria 195.9 39 12 2.6 -0 264.1 410.6 67 5.5 5,680 50 576 24 16 2.5 3
Senegal 16.3 33 6 2.7 -1 22.1 34.0 42 4.6 2,620 46 509 28 26 0.3 0
Sierra Leone 7.7 33 13 2.0 -1 9.7 13.0 84 4.2 1,480 41 487 17 16 1.1 1
Togo 8.0 34 9 2.5 -0 10.5 15.3 52 4.5 1,620 42 302 20 17 1.5 2
EASTERN AFRICA 432 36 8 2.8 -1 584 883 45 4.7 2,192 28 651 41 38 3.4 5
Burundi 11.8 41 11 3.0 -0 17.2 30.4 47 5.5 770 13 987 29 23 0.8 1
Comoros 0.8 33 7 2.5 -2 1.1 1.5 55 4.3 1,570 29 1,281 19 14 0.1 0
Djibouti 1.0 23 8 1.5 1 1.1 1.3 52 2.9 — 78 48,550 19 18 1.1 1
Eritrea 6.0 30 7 2.3 -15 6.8 8.9 46 4.1 1,500 40 865 8 7 0.4 0
Ethiopia 107.5 33 7 2.6 -0 139.6 190.9 40 4.4 1,890 20 711 37 35 0.7 1
Kenya 51.0 31 6 2.6 -0 67.0 95.5 36 3.9 3,250 32 878 62 60 3.5 6
Madagascar 26.3 32 6 2.6 -0 35.6 53.8 32 4.1 1,510 37 750 40 33 0.4 0
Malawi 19.1 34 7 2.6 -1 25.6 37.4 42 4.2 1,180 17 502 59 58 7.4 11
Mauritius 1.3 11 8 0.3 -1 1.3 1.2 11.8 1.4 22,570 41 1,710 64 32 — —
Mayotte 0.3 39 3 3.6 -0 0.4 0.6 4 5.1 — 46 2,970 — — — —
Mozambique 30.5 39 10 2.9 -0 42.4 67.8 65 5.3 1,200 32 540 27 25 9.9 15
Réunion 0.9 16 6 1.0 -4 0.9 1.0 7 2.4 — 100 2,539 — — — —
Rwanda 12.6 32 6 2.6 -1 16.6 24.3 32 4.2 1,990 19 1,091 53 48 1.9 3
Seychelles 0.1 17 8 1.0 -3 0.1 0.1 13.4 2.4 26,860 57 64,364 — — — —
Somalia 15.2 43 11 3.2 -3 21.5 35.9 72 6.3 — 45 1,380 15 14 0.1 0
South Sudan 13.0 37 11 2.6 4 17.9 27.9 69 5.0 1,440 20 — 4 2 2.0 2
Tanzania 59.1 39 7 3.3 -1 83.7 138.1 43 5.2 2,916 34 438 38 32 3.4 5
Uganda 44.1 41 9 3.2 -1 61.6 95.6 43 5.4 1,820 24 639 42 36 4.5 7
Zambia 17.7 39 8 3.1 -0 25.8 45.1 49 5.2 3,920 44 465 49 45 8.8 14
POPULATION, HEALTH, AND ENVIRONMENT DATA AND ESTIMATES FOR THE COUNTRIESPOPULATION, HEALTH, AND ENVIRONMENT DATA AND ESTIMATES FOR THE COUNTRIES, TERRITORIES, AND REGIONS OF THE WORLD
© 2018 Population Reference Bureau	 See notes on page 18 2018 WORLD POPULATION DATA SHEET 11
570 41 1,710 64 32 — — 71 78 15 19 19 14 0.7 11 24 2.2
— 46 2,970 — — — — 74 77 18 22 44 27 1.3 3 10 8.1
200 32 540 27 25 9.9 15.0 56 60 13 14 45 35 1.7 3 4 3.0
— 100 2,539 — — — — 78 84 18 22 24 17 0.8 11 25 2.6
990 19 1,091 53 48 1.9 3.4 65 69 14 15 40 27 1.3 3 8 5.0
860 57 64,364 — — — — 68 78 14 18 22 18 0.8 8 23 2.8
— 45 1,380 15 14 0.1 0.1 55 58 13 13 47 38 1.9 3 3 2.9
440 20 — 4 2 2.0 2.9 56 58 13 14 42 32 1.7 3 5 3.0
916 34 438 38 32 3.4 5.5 64 67 14 15 45 36 1.9 3 5 3.6
820 24 639 42 36 4.5 7.3 62 64 13 14 48 36 1.6 3 4 3.0
920 44 465 49 45 8.8 14.3 59 64 14 15 45 36 2.0 2 4 4.5
850 32 351 67 66 10.5 16.1 58 62 14 15 39 28 1.3 4 6 2.5
80 49 654 20 11 1.1 2.3 57 60 13 14 46 35 1.9 3 4 3.6
060 63 620 14 13 1.2 2.6 58 62 13 15 48 38 2.1 2 4 4.5
640 56 414 34 21 2.5 4.8 57 60 13 14 43 33 1.6 3 5 3.2
730 41 263 15 12 3.3 4.7 50 54 12 13 44 32 1.4 4 5 2.3
920 23 314 6 5 1.0 1.6 52 54 12 13 47 35 1.8 2 3 3.3
880 67 982 30 19 1.9 4.4 58 61 14 15 42 34 1.7 3 6 4.3
870 45 1,188 20 8 0.4 1.0 58 61 13 14 46 36 2.0 3 4 3.6
380 71 1,095 13 10 5.4 8.1 56 59 13 14 37 29 1.7 3 4 2.8
010 89 632 31 19 2.3 6.4 65 68 14 16 36 27 1.4 4 9 3.9
370 73 2,425 41 37 — — 65 69 14 15 42 32 1.2 4 6 2.6
93 64 468 55 54 14.0 23.9 61 67 12 16 30 22 1.0 5 10 2.7
990 70 564 53f 51f 18.4 27.4 61 65 13 15 32 21 0.9 5 11 3.2
520 24 795 66 66 19.3 35.1 54 61 12 14 37 26 1.0 3 6 2.8
510 28 831 60 60 18.7 29.0 52 56 12 13 36 27 1.1 5 6 1.8
320 48 317 56 55 9.5 14.5 62 65 13 15 37 27 1.2 4 7 2.9
090 66 462 55 54 14.0 23.7 61 67 11 16 30 21 1.0 6 11 2.7
40 80 273 74 68 — — 74 80 18 21 23 17 0.9 11 21 2.3
37 82 186 74 63 — — 77 81 19 21 19 17 1.1 15 23 1.8
750 81 85 85f — — — 80 84 20 22 16 15 1.2 17 26 1.9
200 82 215 73 63 — — 76 81 19 21 19 17 1.1 15 22 1.7
273 78 370 74 70 0.7 0.3 73 79 17 20 25 17 0.8 8 19 2.9
84 69 641 68 64 0.4 0.2 74 79 18 20 29 18 0.8 6 17 3.5
890 45 510 51 49 2.0 1.8 71 77 13 15 36 21 0.9 4 10 3.8
100 73 2,157 76 75 0.6 0.2 78 83 19 21 22 15 0.8 8 24 3.5
540 70 863 72 68 0.8 0.4 69 78 17 19 28 18 0.8 8 17 2.5
000 51 1,847 61 49 0.5 0.3 69 76 17 19 40 23 0.9 5 11 3.7
630 54 884 73 64 0.4 0.3 71 76 17 20 34 19 0.7 5 13 3.1
740 73 571 67 65 0.4 0.1 75 80 18 20 27 17 0.8 7 19 3.5
680 59 416 80 77 0.3 0.1 72 78 18 20 30 17 0.7 5 17 4.1
890 69 739 63 60 1.3 0.6 75 81 19 22 27 20 1.0 8 18 3.2
— 71 830 61 58 1.2 1.2 71 76 17 20 25 18 0.8 10 20 2.2
980 25 2,564 — — — — 74 79 17 19 24 18 0.8 7 19 3.1
790 83 4,963 — — 2.0 1.7 73 79 17 20 20 16 0.8 9 21 2.6
830 31 2,593 59 55 2.2 1.1 73 78 15 17 19 17 0.8 15 25 1.5
— 77 369 74 72 0.6 0.3 76 81 19 21 17 14 0.7 15 31 1.9
— 89 — — — — — 75 82 18 20 18 16 1.0 17 24 1.6
170 71 1,211 — — — — 73 78 — — 22 — — 11 — —
290 80 1,354 70 68 1.0 0.8 71 77 17 20 30 19 0.8 7 16 2.9
410 36 3,807 — — — — 74 79 15 16 26 18 0.7 7 17 2.4
— 99 1,707 — — — — 77 84 19 23 19 15 0.7 18 29 1.6
830 55 1,008 34 32 1.5 2.3 62 67 14 15 33 23 0.9 4 10 3.3
690 56 2,416 73 68 2.4 1.2 74 78 17 20 23 16 0.6 9 22 2.2
— 89 3,329 — — — — 78 84 19 23 17 15 0.8 20 32 1.4
240 94 5,352 84f 72f — — 78 84 18 22 16 13 0.7 19 28 1.3
300 31 1,062 — — — — 73 78 — — 21 — — 8 — —
230 19 5,780 56 53 — — 75 83 16 20 20 13 0.7 11 25 2.3
770 52 2,210 — — — — 70 75 15 17 24 16 0.7 8 19 2.6
520 53 5,450 40 38 1.4 0.8 70 76 13 17 19 16 0.8 10 21 2.1
Mauritius 1.3 11 8 0.3 -1 1.3 1.2 11.8 1.4 22,570 41 1,710 64 32 — —
Mayotte 0.3 39 3 3.6 -0 0.4 0.6 4 5.1 — 46 2,970 — — — —
Mozambique 30.5 39 10 2.9 -0 42.4 67.8 65 5.3 1,200 32 540 27 25 9.9 15
Réunion 0.9 16 6 1.0 -4 0.9 1.0 7 2.4 — 100 2,539 — — — —
Rwanda 12.6 32 6 2.6 -1 16.6 24.3 32 4.2 1,990 19 1,091 53 48 1.9 3
Seychelles 0.1 17 8 1.0 -3 0.1 0.1 13.4 2.4 26,860 57 64,364 — — — —
Somalia 15.2 43 11 3.2 -3 21.5 35.9 72 6.3 — 45 1,380 15 14 0.1 0
South Sudan 13.0 37 11 2.6 4 17.9 27.9 69 5.0 1,440 20 — 4 2 2.0 2
Tanzania 59.1 39 7 3.3 -1 83.7 138.1 43 5.2 2,916 34 438 38 32 3.4 5
Uganda 44.1 41 9 3.2 -1 61.6 95.6 43 5.4 1,820 24 639 42 36 4.5 7
Zambia 17.7 39 8 3.1 -0 25.8 45.1 49 5.2 3,920 44 465 49 45 8.8 14
Zimbabwe 14.0 34 10 2.4 -10 17.6 25.6 50 4.0 1,850 32 351 67 66 10.5 16
MIDDLE AFRICA 169 42 10 3.2 -0 245 414 61 5.9 2,780 49 654 20 11 1.1 2
Angola 30.4 45 10 3.5 0 45.4 82.2 44 6.2 6,060 63 620 14 13 1.2 2
Cameroon 25.6 36 10 2.6 0 34.4 51.9 52 4.7 3,640 56 414 34 21 2.5 4
Central African Republic 4.7 36 14 2.2 -10 6.1 8.9 85 4.9 730 41 263 15 12 3.3 4
Chad 15.4 45 13 3.1 1 22.2 36.8 72 6.4 1,920 23 314 6 5 1.0 1
Congo 5.4 33 10 2.3 -5 7.3 11.5 41 4.4 4,880 67 982 30 19 1.9 4
Congo, Dem. Rep. 84.3 43 10 3.3 0 124.3 215.9 67 6.3 870 45 1,188 20 8 0.4 1
Equatorial Guinea 1.3 34 10 2.4 14 1.9 2.8 64 4.7 19,380 71 1,095 13 10 5.4 8
Gabon 2.1 29 8 2.2 3 2.9 3.9 37 3.8 17,010 89 632 31 19 2.3 6
São Tomé and Príncipe 0.2 33 7 2.6 -5 0.3 0.3 38 4.4 3,370 73 2,425 41 37 — —
SOUTHERN AFRICA 66 22 9 1.2 3 78 94 38 2.5 12,693 64 468 55 54 14.0 23
Botswana 2.2 22 10 1.2 3 2.6 3.2 31 2.6 16,990 70 564 53f 51f 18.4 27
eSwatini 1.4 29 10 1.9 -1 1.7 2.1 50 3.3 8,520 24 795 66 66 19.3 35
Lesotho 2.3 29 13 1.6 -2 2.6 3.2 59 3.3 3,510 28 831 60 60 18.7 29
Namibia 2.5 28 8 2.0 0 3.1 4.2 36 3.4 10,320 48 317 56 55 9.5 14
South Africa 57.7 21 9 1.2 4 67.9 81.8 36 2.4 13,090 66 462 55 54 14.0 23
AMERICAS 1,014 15 7 0.8 1 1,113 1,220 13 2.0 31,140 80 273 74 68 — —
NORTHERN AMERICA 365 12 9 0.3 4 396 437 6 1.7 58,737 82 186 74 63 — —
Canada 37.2 11 8 0.3 11 41.0 46.9 4.5 1.5 45,750 81 85 85f — — —
United States 328.0 12 9 0.3 3 354.7 389.6 5.6 1.8 60,200 82 215 73 63 — —
LATIN AMERICA AND THE CARIBBEAN 649 17 6 1.1 -1 717 783 16 2.1 15,273 78 370 74 70 0.7 0
CENTRAL AMERICA 179 19 5 1.4 -1 204 231 19 2.3 15,384 69 641 68 64 0.4 0
Belize 0.4 23 5 1.8 4 0.5 0.6 9 2.6 7,890 45 510 51 49 2.0 1
Costa Rica 5.0 14 5 0.9 2 5.6 6.1 8.0 1.7 16,100 73 2,157 76 75 0.6 0
El Salvador 6.5 20 7 1.3 -7 7.1 8.0 17 2.3 7,540 70 863 72 68 0.8 0
Guatemala 17.2 24 5 1.9 -1 21.2 27.0 28 2.8 8,000 51 1,847 61 49 0.5 0
Honduras 9.0 22 5 1.7 -0 10.3 11.3 25 2.5 4,630 54 884 73 64 0.4 0
Mexico 130.8 19 6 1.3 -1 147.5 164.3 17 2.2 17,740 73 571 67 65 0.4 0
Nicaragua 6.3 20 5 1.5 -4 7.0 7.9 18 2.2 5,680 59 416 80 77 0.3 0
Panama 4.2 19 5 1.4 1 4.9 5.8 14 2.4 21,890 69 739 63 60 1.3 0
CARIBBEAN 43 17 8 0.9 -4 46 47 34 2.2 — 71 830 61 58 1.2 1
Antigua and Barbuda 0.1 15 6 0.9 -0 0.1 0.1 8 1.9 22,980 25 2,564 — — — —
Bahamas 0.4 13 6 0.7 3 0.4 0.4 8 1.6 29,790 83 4,963 — — 2.0 1
Barbados 0.3 11 9 0.1 1 0.3 0.3 9 1.6 17,830 31 2,593 59 55 2.2 1
Cuba 11.1 10 9 0.2 -5 10.8 9.8 4.3 1.6 — 77 369 74 72 0.6 0
Curaçao 0.2 10 9 0.1 -3 0.2 0.2 10.7 1.5 — 89 — — — — —
Dominica 0.07 12 8 0.4 1 0.08 0.08 20 1.8 10,170 71 1,211 — — — —
Dominican Republic 10.8 20 6 1.4 -3 12.0 13.2 31 2.5 15,290 80 1,354 70 68 1.0 0
Grenada 0.1 16 9 0.7 -0 0.1 0.1 19 2.1 14,410 36 3,807 — — — —
Guadeloupe 0.4 10 8 0.1 -9 0.4 0.4 8.1 1.7 — 99 1,707 — — — —
Haiti 10.8 25 8 1.7 -2 12.4 14.5 59 3.0 1,830 55 1,008 34 32 1.5 2
Jamaica 2.9 17 7 1.0 -6 2.9 2.7 14 2.0 8,690 56 2,416 73 68 2.4 1
Martinique 0.4 9 9 0.0 -9 0.4 0.3 7 1.7 — 89 3,329 — — — —
Puerto Rico 3.3 7 9 -0.2 -17 3.2 2.9 7.0 1.1 25,240 94 5,352 84f 72f — —
St. Kitts-Nevis 0.05 14 9 0.5 3 0.06 0.06 17 1.8 26,300 31 1,062 — — — —
Saint Lucia 0.2 12 6 0.7 -3 0.2 0.2 18 1.5 13,230 19 5,780 56 53 — —
St. Vincent and the Grenadines 0.1 16 9 0.7 -6 0.1 0.1 18 2.1 11,770 52 2,210 — — — —
Trinidad and Tobago 1.4 13 8 0.5 -1 1.4 1.4 13 1.6 30,520 53 5,450 40 38 1.4 0
Capita,
017c
Percent
Urban
Population
per km2 of
Arable Land
Married Women 15-49
Using Contraceptiond (%) Ages 15-49 With HIV/AIDS (%) Life Expectancy at Birth (Years) Life Expectancy at Age 65 (Years) Population Ages 15 Population Ages 65+
All Methods Modern Methods Males 2017 Females 2017 Males Females Males Females 2018 (%) 2050 (%)
2050 as a
Multiple of 2018e 2018 (%) 2050 (%)
2050 as a
Multiple of 2018e
27 55 535 62 56 — — 70 74 16 18 26 21 1.1 9 16 2.3
409 79 242 68 59 — — 76 82 18 21 16 16 1.0 18 27 1.5
445 50 704 61 55 — — 69 73 15 17 28 22 1.1 7 14 2.8
840 48 632 54 47 0.9 1.3 67 71 15 17 31 24 1.1 6 12 3.0
723 33 585 37 33 1.5 2.3 63 66 14 15 40 31 1.5 4 7 3.5
65 43 546 36 32 2.7 4.3 61 64 13 15 41 32 1.6 3 6 3.4
57 52 548 52 47 0.1 0.1 71 74 15 16 32 25 1.2 5 12 3.8
050 73 572 57 50 0.1 0.1 77 78 18 19 29 20 1.0 6 17 4.3
360 43 3,350 59 57 0.1 0.1 71 74 13 15 34 25 1.3 4 11 4.7
940 80 376 42 20 — — 69 75 13 16 28 18 0.8 4 17 4.6
063 62 433 67 59 0.1 0.1 75 78 15 17 24 19 0.9 8 18 2.7
482 36 210 12 12 0.2 0.2 63 66 14 15 41 31 1.6 4 6 3.4
490 68 399 63 51 0.1 0.1 75 78 15 18 24 18 0.9 8 20 2.9
— 87 14,150 — — — — 68 72 13 15 28 20 1.1 3 12 6.8
683 40 546 33 28 3.3 5.2 59 62 13 14 43 33 1.6 3 5 3.3
74 46 445 24 18 1.8 2.4 56 58 11 12 44 35 1.7 3 4 3.2
260 45 425 18 13 0.7 1.3 59 62 13 14 43 34 1.6 3 5 3.1
810 29 338 32 30 0.6 1.0 60 61 12 12 47 35 1.8 3 4 3.4
570 66 1,101 61 57 0.5 0.7 71 75 14 16 31 19 0.7 4 12 3.2
820 51 859 24 19 1.9 3.7 52 55 11 12 43 35 1.7 3 4 2.8
670 61 494 9 8 1.4 1.9 60 63 12 13 46 33 1.7 2 4 4.0
490 56 627 33 27 1.0 2.3 62 64 12 13 39 30 1.3 3 6 3.3
270 35 383 9 8 1.1 1.9 58 61 12 12 45 33 1.5 4 5 2.7
700 43 636 16 14 2.6 4.1 56 59 12 12 42 32 1.4 3 5 3.3
710 51 971 31 31 1.0 1.8 62 64 12 13 42 32 1.6 3 5 3.6
160 42 303 16 15 0.9 1.6 58 62 12 12 47 36 1.8 2 4 3.8
900 54 1,009 18 16 0.4 0.3 62 65 12 13 40 32 1.6 3 6 3.6
990 16 132 19 18 0.3 0.3 59 61 12 13 50 43 2.4 3 3 2.9
680 50 576 24 16 2.5 3.0 53 54 11 11 44 35 1.7 3 4 3.1
620 46 509 28 26 0.3 0.6 65 69 13 14 43 33 1.6 3 5 3.8
480 41 487 17 16 1.1 1.6 51 52 10 10 42 29 1.2 3 5 3.1
620 42 302 20 17 1.5 2.7 59 61 12 12 42 32 1.5 3 5 3.5
92 28 651 41 38 3.4 5.6 62 66 14 15 43 32 1.5 3 5 3.5
770 13 987 29 23 0.8 1.4 59 62 13 14 46 36 2.1 2 4 4.2
570 29 1,281 19 14 0.1 0.1 62 65 12 14 40 30 1.3 3 6 3.5
— 78 48,550 19 18 1.1 1.5 61 64 14 15 32 21 0.9 4 10 3.3
500 40 865 8 7 0.4 0.7 62 68 13 14 41 30 1.1 4 6 2.3
890 20 711 37 35 0.7 1.2 64 67 14 15 41 26 1.1 4 7 3.3
250 32 878 62 60 3.5 6.2 65 69 14 16 41 29 1.3 3 7 5.1
510 37 750 40 33 0.4 0.2 64 68 13 14 41 32 1.6 3 6 4.0
180 17 502 59 58 7.4 11.7 61 66 14 15 44 32 1.4 3 5 3.2
570 41 1,710 64 32 — — 71 78 15 19 19 14 0.7 11 24 2.2
— 46 2,970 — — — — 74 77 18 22 44 27 1.3 3 10 8.1
200 32 540 27 25 9.9 15.0 56 60 13 14 45 35 1.7 3 4 3.0
— 100 2,539 — — — — 78 84 18 22 24 17 0.8 11 25 2.6
990 19 1,091 53 48 1.9 3.4 65 69 14 15 40 27 1.3 3 8 5.0
860 57 64,364 — — — — 68 78 14 18 22 18 0.8 8 23 2.8
— 45 1,380 15 14 0.1 0.1 55 58 13 13 47 38 1.9 3 3 2.9
440 20 — 4 2 2.0 2.9 56 58 13 14 42 32 1.7 3 5 3.0
916 34 438 38 32 3.4 5.5 64 67 14 15 45 36 1.9 3 5 3.6
820 24 639 42 36 4.5 7.3 62 64 13 14 48 36 1.6 3 4 3.0
920 44 465 49 45 8.8 14.3 59 64 14 15 45 36 2.0 2 4 4.5
MENT DATA AND ESTIMATES FOR THE COUNTRIES, TERRITORIES, AND REGIONS OF THE WORLDPOPULATION, HEALTH, AND ENVIRONMENT DATA AND ESTIMATES FOR THE COUNTRIES, TERRITORIES, AND REGIONS OF THE WORLD
© 2018 Population Reference Bureau	 See notes on page 18 2018 WORLD POPULATION DATA SHEET 12
Dominican Republic 10.8 20 6 1.4 -3 12.0 13.2 31 2.5 15,290 80 1,354 70 68 1.0 0
Grenada 0.1 16 9 0.7 -0 0.1 0.1 19 2.1 14,410 36 3,807 — — — —
Guadeloupe 0.4 10 8 0.1 -9 0.4 0.4 8.1 1.7 — 99 1,707 — — — —
Haiti 10.8 25 8 1.7 -2 12.4 14.5 59 3.0 1,830 55 1,008 34 32 1.5 2
Jamaica 2.9 17 7 1.0 -6 2.9 2.7 14 2.0 8,690 56 2,416 73 68 2.4 1
Martinique 0.4 9 9 0.0 -9 0.4 0.3 7 1.7 — 89 3,329 — — — —
Puerto Rico 3.3 7 9 -0.2 -17 3.2 2.9 7.0 1.1 25,240 94 5,352 84f 72f — —
St. Kitts-Nevis 0.05 14 9 0.5 3 0.06 0.06 17 1.8 26,300 31 1,062 — — — —
Saint Lucia 0.2 12 6 0.7 -3 0.2 0.2 18 1.5 13,230 19 5,780 56 53 — —
St. Vincent and the Grenadines 0.1 16 9 0.7 -6 0.1 0.1 18 2.1 11,770 52 2,210 — — — —
Trinidad and Tobago 1.4 13 8 0.5 -1 1.4 1.4 13 1.6 30,520 53 5,450 40 38 1.4 0
SOUTH AMERICA 427 16 6 1.0 -0 467 505 13 2.0 15,509 83 300 79 74 0.7 0
Argentina 44.5 17 8 1.0 -0 49.4 56.4 10.1 2.3 20,270 92 114 81f 78f 0.6 0
Bolivia 11.3 23 7 1.6 -1 13.3 16.5 37 2.9 7,330 69 253 67 45 0.4 0
Brazil 209.4 14 6 0.8 0 223.9 231.0 11 1.7 15,160 86 262 80 78 0.8 0
Chile 18.6 14 6 0.8 2 19.6 20.2 6.9 1.8 23,150 87 1,413 76 70 0.8 0
Colombia 49.8 15 6 0.9 -1 55.5 61.5 14 2.0 14,170 77 2,951 81 76 0.7 0
Ecuador 17.0 20 5 1.5 -0 19.7 23.2 19 2.5 11,350 64 1,595 80 72 0.5 0
French Guiana 0.3 27 4 2.3 4 0.4 0.5 9 3.6 — 85 2,131 — — — —
Guyana 0.8 21 8 1.2 -7 0.8 0.8 31 2.5 8,120 27 186 34 33 1.7 1
Paraguay 6.9 21 6 1.5 -2 7.8 8.9 17 2.5 9,180 61 144 68 67 0.6 0
Peru 32.2 19 6 1.4 -1 36.4 41.1 16 2.4 12,890 78 775 76 54 0.5 0
Suriname 0.6 18 7 1.1 -2 0.6 0.6 16 2.4 14,290 66 874 48 47 1.3 1
Uruguay 3.5 14 9 0.5 -1 3.6 3.7 11.5 2.0 21,870 95 145 80f 78f 0.9 0
Venezuela 31.8 19 5 1.4 -1 36.1 40.5 12.5 2.4 17,440 88 1,179 75 — — —
Population
(millions)
mid-2018
Births
per 1,000
Population
Deaths
per 1,000
Population
Rate of
Natural
Increase (%)
Net
Migration
Rate
Population (millions) Infant
Mortality
Ratea
Total
Fertility
Rateb
GNI per Capita,
PPP 2017c
Percent
Urban
Population
per km2 of
Arable Land
Married Women 15-49 Ages 15-49 With HIV/AI
mid-2030 mid-2050 Using Contraceptiond (%) Males 2017 Female
All Methods Modern Methods
ASIA 4,536 17 7 1.1 -0 4,943 5,253 26 2.1 13,714 49 915 65 59 —
ASIA (EXCL. CHINA) 3,134 19 6 1.3 -1 3,515 3,900 31 2.3 12,210 45 832 56 48 0.3 0
WESTERN ASIA 272 21 5 1.6 1 329 400 22 2.7 28,686 71 701 54 37 —
Armenia 3.0 13 9 0.4 -8 2.8 2.4 8 1.6 10,060 64 664 57 28 0.2 0
Azerbaijan 9.9 15 6 0.9 0 10.7 11.1 11 1.9 16,650 53 513 51 14 0.2 0
Bahrain 1.5 14 2 1.1 23 1.9 2.1 6 1.9 42,930 89 96,054 — — 0.1 0
Cyprus 1.2 11 6 0.5 3 1.3 1.4 3 1.4 33,609 68 1,202 — — 0.2 0
Georgia 3.9 14 13 0.2 -1 3.7 3.4 10 2.1 10,120 58 872 53 35 0.7 0
Iraq 40.2 31 4 2.7 2 53.4 76.5 38 4.1 17,010 70 798 53 36 —
Israel 8.5 21 5 1.6 3 10.8 14.4 3.0 3.1 38,060 91 2,857 — — —
Jordan 10.2 24 3 2.1 0 12.0 13.4 15 3.2 9,110 90 4,462 61 42 —
Kuwait 4.2 14 2 1.3 15 4.9 5.6 8 1.5 83,310 100 54,508 — — 0.1 0
Lebanon 6.1 14 5 0.9 -1 5.5 5.6 7 1.7 14,690 89 4,621 55 47 0.1 0
Oman 4.7 20 2 1.8 32 5.8 7.1 9 2.9 40,240 85 12,326 30 19 —
Palestinian Territory 4.8 31 4 2.7 -2 6.2 8.4 18 4.1 5,560 76 7,566 57 44 —
Qatar 2.7 10 1 0.9 28 3.2 3.8 6 1.9 128,060 100 20,571 38 34 0.2 0
Saudi Arabia 33.4 17 3 1.4 11 39.3 44.9 12 2.4 54,770 84 954 25 21 —
Syria 18.3 22 6 1.6 -21 26.6 34.0 17 2.9 — 54 392 54 38 —
Turkey 81.3 16 5 1.1 0 93.3 104.7 9 2.1 27,550 75 394 74 47 —
United Arab Emirates 9.5 10 2 0.8 8 11.1 13.2 6 1.8 74,410 87 25,444 — — —
Yemen 28.9 32 6 2.5 -1 36.8 48.3 44 4.0 2,380 37 2,317 34 29 —
SOUTH CENTRAL ASIA 1,981 21 6 1.5 -1 2,239 2,508 36 2.4 7,317 36 767 54 46 0.2 0
CENTRAL ASIA 72 24 6 1.8 -1 84 101 17 2.9 11,371 48 192 55 53 0.3 0
Kazakhstan 18.4 23 7 1.5 -1 20.5 24.7 9 3.0 23,440 57 63 56 54 0.3 0
Kyrgyzstan 6.1 26 6 2.1 -1 7.0 8.1 17 3.1 3,620 34 479 42 40 0.3 0
Tajikistan 9.1 33 5 2.7 -2 10.7 12.9 27 3.8 3,670 27 1,241 29 27 0.4 0
Turkmenistan 5.9 26 7 1.9 -1 7.0 8.8 44 3.2 17,320 52 303 50 47 —
Uzbekistan 32.9 22 5 1.7 -1 38.7 46.5 11 2.5 7,130 51 748 65 62 0.3 0
Population
(millions)
mid-2018
Births
per 1,000
Population
Deaths
per 1,000
Population
Rate of
Natural
Increase (%)
Net
Migration
Rate
Population (millions) Infant
Mortality
Ratea
Total
Fertility
Rateb
GNI per Capita,
PPP 2017c
Percent
Urban
Population
per km2 of
Arable Land
Married Women 15-49
Using Contraceptiond (%) Ages 15-49 With HIV/AI
mid-2030 mid-2050 All Methods Modern Methods Males 2017 Female
Saint Lucia 0.2 12 6 0.7 -3 0.2 0.2 18 1.5 13,230 19 5,780 56 53 — —
St. Vincent and the Grenadines 0.1 16 9 0.7 -6 0.1 0.1 18 2.1 11,770 52 2,210 — — — —
Trinidad and Tobago 1.4 13 8 0.5 -1 1.4 1.4 13 1.6 30,520 53 5,450 40 38 1.4 0
SOUTH AMERICA 427 16 6 1.0 -0 467 505 13 2.0 15,509 83 300 79 74 0.7 0
Argentina 44.5 17 8 1.0 -0 49.4 56.4 10.1 2.3 20,270 92 114 81f 78f 0.6 0
Bolivia 11.3 23 7 1.6 -1 13.3 16.5 37 2.9 7,330 69 253 67 45 0.4 0
Brazil 209.4 14 6 0.8 0 223.9 231.0 11 1.7 15,160 86 262 80 78 0.8 0
Chile 18.6 14 6 0.8 2 19.6 20.2 6.9 1.8 23,150 87 1,413 76 70 0.8 0
Colombia 49.8 15 6 0.9 -1 55.5 61.5 14 2.0 14,170 77 2,951 81 76 0.7 0
Ecuador 17.0 20 5 1.5 -0 19.7 23.2 19 2.5 11,350 64 1,595 80 72 0.5 0
French Guiana 0.3 27 4 2.3 4 0.4 0.5 9 3.6 — 85 2,131 — — — —
Guyana 0.8 21 8 1.2 -7 0.8 0.8 31 2.5 8,120 27 186 34 33 1.7 1
Paraguay 6.9 21 6 1.5 -2 7.8 8.9 17 2.5 9,180 61 144 68 67 0.6 0
Peru 32.2 19 6 1.4 -1 36.4 41.1 16 2.4 12,890 78 775 76 54 0.5 0
Suriname 0.6 18 7 1.1 -2 0.6 0.6 16 2.4 14,290 66 874 48 47 1.3 1
Uruguay 3.5 14 9 0.5 -1 3.6 3.7 11.5 2.0 21,870 95 145 80f 78f 0.9 0
Venezuela 31.8 19 5 1.4 -1 36.1 40.5 12.5 2.4 17,440 88 1,179 75 — — —
Population
(millions)
mid-2018
Births
per 1,000
Population
Deaths
per 1,000
Population
Rate of
Natural
Increase (%)
Net
Migration
Rate
Population (millions) Infant
Mortality
Ratea
Total
Fertility
Rateb
GNI per Capita,
PPP 2017c
Percent
Urban
Population
per km2 of
Arable Land
Married Women 15-49 Ages 15-49 With HIV/AID
mid-2030 mid-2050 Using Contraceptiond (%) Males 2017 Female
All Methods Modern Methods
ASIA 4,536 17 7 1.1 -0 4,943 5,253 26 2.1 13,714 49 915 65 59 —
ASIA (EXCL. CHINA) 3,134 19 6 1.3 -1 3,515 3,900 31 2.3 12,210 45 832 56 48 0.3 0
WESTERN ASIA 272 21 5 1.6 1 329 400 22 2.7 28,686 71 701 54 37 —
Armenia 3.0 13 9 0.4 -8 2.8 2.4 8 1.6 10,060 64 664 57 28 0.2 0
Azerbaijan 9.9 15 6 0.9 0 10.7 11.1 11 1.9 16,650 53 513 51 14 0.2 0
Bahrain 1.5 14 2 1.1 23 1.9 2.1 6 1.9 42,930 89 96,054 — — 0.1 0
Cyprus 1.2 11 6 0.5 3 1.3 1.4 3 1.4 33,609 68 1,202 — — 0.2 0
Georgia 3.9 14 13 0.2 -1 3.7 3.4 10 2.1 10,120 58 872 53 35 0.7 0
Iraq 40.2 31 4 2.7 2 53.4 76.5 38 4.1 17,010 70 798 53 36 —
Israel 8.5 21 5 1.6 3 10.8 14.4 3.0 3.1 38,060 91 2,857 — — —
Jordan 10.2 24 3 2.1 0 12.0 13.4 15 3.2 9,110 90 4,462 61 42 —
Kuwait 4.2 14 2 1.3 15 4.9 5.6 8 1.5 83,310 100 54,508 — — 0.1 0
Lebanon 6.1 14 5 0.9 -1 5.5 5.6 7 1.7 14,690 89 4,621 55 47 0.1 0
Oman 4.7 20 2 1.8 32 5.8 7.1 9 2.9 40,240 85 12,326 30 19 —
Palestinian Territory 4.8 31 4 2.7 -2 6.2 8.4 18 4.1 5,560 76 7,566 57 44 —
Qatar 2.7 10 1 0.9 28 3.2 3.8 6 1.9 128,060 100 20,571 38 34 0.2 0
Saudi Arabia 33.4 17 3 1.4 11 39.3 44.9 12 2.4 54,770 84 954 25 21 —
Syria 18.3 22 6 1.6 -21 26.6 34.0 17 2.9 — 54 392 54 38 —
Turkey 81.3 16 5 1.1 0 93.3 104.7 9 2.1 27,550 75 394 74 47 —
United Arab Emirates 9.5 10 2 0.8 8 11.1 13.2 6 1.8 74,410 87 25,444 — — —
Yemen 28.9 32 6 2.5 -1 36.8 48.3 44 4.0 2,380 37 2,317 34 29 —
SOUTH CENTRAL ASIA 1,981 21 6 1.5 -1 2,239 2,508 36 2.4 7,317 36 767 54 46 0.2 0
CENTRAL ASIA 72 24 6 1.8 -1 84 101 17 2.9 11,371 48 192 55 53 0.3 0
Kazakhstan 18.4 23 7 1.5 -1 20.5 24.7 9 3.0 23,440 57 63 56 54 0.3 0
Kyrgyzstan 6.1 26 6 2.1 -1 7.0 8.1 17 3.1 3,620 34 479 42 40 0.3 0
Tajikistan 9.1 33 5 2.7 -2 10.7 12.9 27 3.8 3,670 27 1,241 29 27 0.4 0
Turkmenistan 5.9 26 7 1.9 -1 7.0 8.8 44 3.2 17,320 52 303 50 47 —
Uzbekistan 32.9 22 5 1.7 -1 38.7 46.5 11 2.5 7,130 51 748 65 62 0.3 0
SOUTH ASIA 1,909 21 6 1.5 -1 2,155 2,407 37 2.4 7,163 36 865 53 46 0.2 0
Afghanistan 36.5 35 7 2.8 -0 48.5 68.9 57 4.8 2,000 25 470 23 20 —
Bangladesh 166.4 19 5 1.4 -3 185.6 201.9 28 2.1 4,040 37 2,143 62 54 0.1 0
Bhutan 0.8 18 6 1.2 1 0.9 1.0 26 2.1 8,850 39 815 66 65 —
India 1,371.3 20 6 1.4 -0 1,532.3 1,680.1 34 2.3 7,060 34 876 54 48 0.2 0
Iran 81.6 19 5 1.4 -3 88.4 93.1 5 2.0 21,010 74 555 77 57 0.2 0
Maldives 0.4 20 3 1.7 6 0.5 0.6 8 2.4 15,350 39 10,978 35 27 —
Population
(millions)
mid-2018
Births
per 1,000
Population
Deaths
per 1,000
Population
Rate of
Natural
Increase (%)
Net
Migration
Rate
Population (millions) Infant
Mortality
Ratea
Total
Fertility
Rateb
GNI per Capita,
PPP 2017c
Percent
Urban
Population
per km2 of
Arable Land
Married Women 15-49
Using Contraceptiond (%) Ages 15-49 With HIV/AID
mid-2030 mid-2050 All Methods Modern Methods Males 2017 Female
Population
(millions)
mid-2018
Births
per 1,000
Population
Deaths
per 1,000
Population
Rate of
Natural
Increase (%)
Net
Migration
Rate
Population (millions) Infant
Mortality
Ratea
Total
Fertility
Rateb
GNI per Capita,
PPP 2017c
Percent
Urban
Population
per km2 of
Arable Land
Married Women 15-49
Using Contraceptiond (%) Ages 15-49 With HIV/AID
mid-2030 mid-2050 All Methods Modern Methods Males 2017 Female
WORLD 7,621 19 7 1.2 0 8,571 9,852 31 2.4 16,927 55 535 62 56 — —
MORE DEVELOPED 1,266 10 10 0.0 3 1,301 1,312 5 1.6 43,409 79 242 68 59 — —
LESS DEVELOPED 6,355 21 7 1.4 -1 7,270 8,540 34 2.6 11,445 50 704 61 55 — —
LESS DEVELOPED (Excl. China) 4,953 23 7 1.7 -1 5,841 7,187 37 2.8 9,840 48 632 54 47 0.9 1
LEAST DEVELOPED 1,027 33 8 2.5 -1 1,342 1,954 49 4.2 2,723 33 585 37 33 1.5 2
AFRICA 1,284 35 9 2.6 -1 1,714 2,586 50 4.6 4,965 43 546 36 32 2.7 4
NORTHERN AFRICA 235 26 6 2.0 -1 289 385 24 3.3 10,557 52 548 52 47 0.1 0
Algeria 42.7 26 4 2.2 -0 51.3 64.3 22 3.1 15,050 73 572 57 50 0.1 0
Egypt 97.0 27 6 2.1 -1 120.8 166.5 15 3.4 11,360 43 3,350 59 57 0.1 0
Libya 6.5 20 5 1.4 -4 7.3 8.1 22 2.3 19,940 80 376 42 20 — —
Morocco 35.2 18 5 1.2 -2 39.3 43.6 22 2.2 8,063 62 433 67 59 0.1 0
Sudan 41.7 34 8 2.7 -2 56.8 88.1 45 4.7 4,482 36 210 12 12 0.2 0
Tunisia 11.6 19 6 1.4 -0 12.7 13.8 15 2.3 11,490 68 399 63 51 0.1 0
Western Sahara 0.6 20 5 1.5 7 0.7 0.9 30 2.3 — 87 14,150 — — — —
SUB-SAHARAN AFRICA 1,049 37 9 2.7 -0 1,425 2,200 54 4.9 3,683 40 546 33 28 3.3 5
WESTERN AFRICA 382 38 11 2.7 -1 518 809 62 5.3 4,174 46 445 24 18 1.8 2
Benin 11.5 37 9 2.8 -0 15.6 23.9 63 5.0 2,260 45 425 18 13 0.7 1
Burkina Faso 20.3 40 9 3.1 -1 28.9 48.5 57 5.5 1,810 29 338 32 30 0.6 1
Cabo Verde 0.6 19 5 1.4 -3 0.6 0.6 21 2.2 6,570 66 1,101 61 57 0.5 0
Côte d’Ivoire 24.9 35 12 2.3 0 33.3 51.4 62 4.6 3,820 51 859 24 19 1.9 3
Gambia 2.2 39 8 3.1 -1 3.1 5.0 46 5.4 1,670 61 494 9 8 1.4 1
Ghana 29.5 30 8 2.2 -1 37.3 51.3 37 3.9 4,490 56 627 33 27 1.0 2
Guinea 11.9 39 11 2.8 -2 16.3 25.3 68 4.8 2,270 35 383 9 8 1.1 1
Guinea-Bissau 1.9 36 11 2.6 -1 2.5 3.6 73 4.6 1,700 43 636 16 14 2.6 4
Liberia 4.9 33 8 2.5 -1 6.5 9.8 50 4.2 710 51 971 31 31 1.0 1
Mali 19.4 45 10 3.5 -4 27.5 44.8 56 6.0 2,160 42 303 16 15 0.9 1
Mauritania 4.5 34 8 2.6 1 6.1 9.0 65 4.6 3,900 54 1,009 18 16 0.4 0
Niger 22.2 48 10 3.8 -0 34.0 63.1 60 7.2 990 16 132 19 18 0.3 0
Nigeria 195.9 39 12 2.6 -0 264.1 410.6 67 5.5 5,680 50 576 24 16 2.5 3
Senegal 16.3 33 6 2.7 -1 22.1 34.0 42 4.6 2,620 46 509 28 26 0.3 0
Sierra Leone 7.7 33 13 2.0 -1 9.7 13.0 84 4.2 1,480 41 487 17 16 1.1 1
Togo 8.0 34 9 2.5 -0 10.5 15.3 52 4.5 1,620 42 302 20 17 1.5 2
EASTERN AFRICA 432 36 8 2.8 -1 584 883 45 4.7 2,192 28 651 41 38 3.4 5
Burundi 11.8 41 11 3.0 -0 17.2 30.4 47 5.5 770 13 987 29 23 0.8 1
Comoros 0.8 33 7 2.5 -2 1.1 1.5 55 4.3 1,570 29 1,281 19 14 0.1 0
Djibouti 1.0 23 8 1.5 1 1.1 1.3 52 2.9 — 78 48,550 19 18 1.1 1
Eritrea 6.0 30 7 2.3 -15 6.8 8.9 46 4.1 1,500 40 865 8 7 0.4 0
Ethiopia 107.5 33 7 2.6 -0 139.6 190.9 40 4.4 1,890 20 711 37 35 0.7 1
Kenya 51.0 31 6 2.6 -0 67.0 95.5 36 3.9 3,250 32 878 62 60 3.5 6
Madagascar 26.3 32 6 2.6 -0 35.6 53.8 32 4.1 1,510 37 750 40 33 0.4 0
Malawi 19.1 34 7 2.6 -1 25.6 37.4 42 4.2 1,180 17 502 59 58 7.4 11
Mauritius 1.3 11 8 0.3 -1 1.3 1.2 11.8 1.4 22,570 41 1,710 64 32 — —
Mayotte 0.3 39 3 3.6 -0 0.4 0.6 4 5.1 — 46 2,970 — — — —
Mozambique 30.5 39 10 2.9 -0 42.4 67.8 65 5.3 1,200 32 540 27 25 9.9 15
Réunion 0.9 16 6 1.0 -4 0.9 1.0 7 2.4 — 100 2,539 — — — —
Rwanda 12.6 32 6 2.6 -1 16.6 24.3 32 4.2 1,990 19 1,091 53 48 1.9 3
Seychelles 0.1 17 8 1.0 -3 0.1 0.1 13.4 2.4 26,860 57 64,364 — — — —
Somalia 15.2 43 11 3.2 -3 21.5 35.9 72 6.3 — 45 1,380 15 14 0.1 0
South Sudan 13.0 37 11 2.6 4 17.9 27.9 69 5.0 1,440 20 — 4 2 2.0 2
Tanzania 59.1 39 7 3.3 -1 83.7 138.1 43 5.2 2,916 34 438 38 32 3.4 5
Uganda 44.1 41 9 3.2 -1 61.6 95.6 43 5.4 1,820 24 639 42 36 4.5 7
Zambia 17.7 39 8 3.1 -0 25.8 45.1 49 5.2 3,920 44 465 49 45 8.8 14
POPULATION, HEALTH, AND ENVIRONMENT DATA AND ESTIMATES FOR THE COUNTRIESPOPULATION, HEALTH, AND ENVIRONMENT DATA AND ESTIMATES FOR THE COUNTRIES, TERRITORIES, AND REGIONS OF THE WORLD
© 2018 Population Reference Bureau	 See notes on page 18 2018 WORLD POPULATION DATA SHEET 13
290 80 1,354 70 68 1.0 0.8 71 77 17 20 30 19 0.8 7 16 2.9
410 36 3,807 — — — — 74 79 15 16 26 18 0.7 7 17 2.4
— 99 1,707 — — — — 77 84 19 23 19 15 0.7 18 29 1.6
830 55 1,008 34 32 1.5 2.3 62 67 14 15 33 23 0.9 4 10 3.3
690 56 2,416 73 68 2.4 1.2 74 78 17 20 23 16 0.6 9 22 2.2
— 89 3,329 — — — — 78 84 19 23 17 15 0.8 20 32 1.4
240 94 5,352 84f 72f — — 78 84 18 22 16 13 0.7 19 28 1.3
300 31 1,062 — — — — 73 78 — — 21 — — 8 — —
230 19 5,780 56 53 — — 75 83 16 20 20 13 0.7 11 25 2.3
770 52 2,210 — — — — 70 75 15 17 24 16 0.7 8 19 2.6
520 53 5,450 40 38 1.4 0.8 70 76 13 17 19 16 0.8 10 21 2.1
09 83 300 79 74 0.7 0.3 72 79 17 20 24 17 0.8 8 20 2.9
270 92 114 81f 78f 0.6 0.3 74 80 16 20 25 19 1.0 11 18 2.0
330 69 253 67 45 0.4 0.2 67 72 17 19 32 22 1.0 7 12 2.7
160 86 262 80 78 0.8 0.4 72 79 17 20 22 15 0.7 8 23 3.1
150 87 1,413 76 70 0.8 0.3 77 82 18 21 21 15 0.8 11 24 2.3
170 77 2,951 81 76 0.7 0.2 73 79 17 19 26 16 0.7 8 21 3.2
350 64 1,595 80 72 0.5 0.2 74 79 19 20 29 20 0.9 7 16 3.1
— 85 2,131 — — — — 75 81 17 21 33 25 1.4 5 13 4.6
120 27 186 34 33 1.7 1.7 64 69 12 13 29 21 0.7 5 12 2.3
180 61 144 68 67 0.6 0.3 71 75 17 19 30 20 0.9 6 13 2.7
890 78 775 76 54 0.5 0.2 72 78 17 19 27 19 0.9 7 17 3.2
290 66 874 48 47 1.3 1.4 68 75 14 17 27 19 0.8 7 15 2.5
870 95 145 80f 78f 0.9 0.3 74 81 16 21 21 17 0.8 15 22 1.6
440 88 1,179 75 — — — 73 79 16 19 26 19 0.9 7 16 2.9
Capita,
017c
Percent
Urban
Population
per km2 of
Arable Land
Married Women 15-49 Ages 15-49 With HIV/AIDS (%) Life Expectancy at Birth (Years) Life Expectancy at Age 65 (Years) Population Ages 15 Population Ages 65+
Using Contraceptiond (%) Males 2017 Females 2017 Males Females Males Females 2018 (%) 2050 (%) 2050 as a
Multiple of 2018e
2018 (%) 2050 (%) 2050 as a
Multiple of 2018eAll Methods Modern Methods
714 49 915 65 59 — — 71 74 15 18 24 18 0.9 8 18 2.5
210 45 832 56 48 0.3 0.2 69 73 15 18 27 19 0.9 7 15 2.7
686 71 701 54 37 — — 72 77 15 18 29 22 1.1 6 13 3.6
060 64 664 57 28 0.2 0.1 72 78 15 17 20 15 0.6 11 23 1.7
650 53 513 51 14 0.2 0.1 73 78 13 16 23 17 0.9 7 17 2.9
930 89 96,054 — — 0.1 0.1 76 78 15 16 20 13 0.9 3 13 6.8
609 68 1,202 — — 0.2 0.1 80 85 17 20 16 13 1.0 16 26 1.9
120 58 872 53 35 0.7 0.2 69 78 13 17 20 17 0.8 15 23 1.3
010 70 798 53 36 — — 68 72 13 15 40 32 1.5 3 6 3.4
060 91 2,857 — — — — 81 84 20 22 28 23 1.4 11 17 2.6
110 90 4,462 61 42 — — 73 76 15 17 35 24 0.9 4 11 4.1
310 100 54,508 — — 0.1 0.1 74 76 14 14 21 17 1.1 2 16 9.6
690 89 4,621 55 47 0.1 0.1 77 79 17 20 24 14 0.5 7 23 3.2
240 85 12,326 30 19 — — 75 79 16 19 22 15 1.0 3 14 8.2
560 76 7,566 57 44 — — 72 75 14 16 39 28 1.3 3 7 3.8
060 100 20,571 38 34 0.2 0.1 77 80 17 18 14 11 1.2 1 13 16.2
770 84 954 25 21 — — 73 76 14 16 25 17 0.9 3 17 7.0
— 54 392 54 38 — — 64 77 14 17 37 22 1.1 4 12 5.2
550 75 394 74 47 — — 75 81 15 19 24 17 0.9 9 21 3.1
410 87 25,444 — — — — 77 79 16 17 14 12 1.2 1 14 17.5
380 37 2,317 34 29 — — 64 66 12 14 40 26 1.1 3 6 3.4
317 36 767 54 46 0.2 0.2 68 71 14 15 28 20 0.9 6 13 2.9
371 48 192 55 53 0.3 0.2 69 76 13 16 29 22 1.1 5 12 3.5
440 57 63 56 54 0.3 0.1 68 77 12 16 25 22 1.2 7 13 2.7
620 34 479 42 40 0.3 0.1 67 75 13 16 32 24 1.0 5 11 3.2
670 27 1,241 29 27 0.4 0.1 68 74 13 17 35 27 1.1 3 9 3.7
320 52 303 50 47 — — 64 71 13 15 31 23 1.1 4 11 3.8
130 51 748 65 62 0.3 0.2 71 76 13 16 28 19 1.0 4 13 4.3
Capita,
017c
Percent
Urban
Population
per km2 of
Arable Land
Married Women 15-49
Using Contraceptiond (%) Ages 15-49 With HIV/AIDS (%) Life Expectancy at Birth (Years) Life Expectancy at Age 65 (Years) Population Ages 15 Population Ages 65+
All Methods Modern Methods Males 2017 Females 2017 Males Females Males Females 2018 (%) 2050 (%)
2050 as a
Multiple of 2018e 2018 (%) 2050 (%)
2050 as a
Multiple of 2018e
30 19 5,780 56 53 — — 75 83 16 20 20 13 0.7 11 25 2.3
70 52 2,210 — — — — 70 75 15 17 24 16 0.7 8 19 2.6
20 53 5,450 40 38 1.4 0.8 70 76 13 17 19 16 0.8 10 21 2.1
09 83 300 79 74 0.7 0.3 72 79 17 20 24 17 0.8 8 20 2.9
70 92 114 81f 78f 0.6 0.3 74 80 16 20 25 19 1.0 11 18 2.0
30 69 253 67 45 0.4 0.2 67 72 17 19 32 22 1.0 7 12 2.7
60 86 262 80 78 0.8 0.4 72 79 17 20 22 15 0.7 8 23 3.1
50 87 1,413 76 70 0.8 0.3 77 82 18 21 21 15 0.8 11 24 2.3
70 77 2,951 81 76 0.7 0.2 73 79 17 19 26 16 0.7 8 21 3.2
50 64 1,595 80 72 0.5 0.2 74 79 19 20 29 20 0.9 7 16 3.1
— 85 2,131 — — — — 75 81 17 21 33 25 1.4 5 13 4.6
20 27 186 34 33 1.7 1.7 64 69 12 13 29 21 0.7 5 12 2.3
80 61 144 68 67 0.6 0.3 71 75 17 19 30 20 0.9 6 13 2.7
90 78 775 76 54 0.5 0.2 72 78 17 19 27 19 0.9 7 17 3.2
90 66 874 48 47 1.3 1.4 68 75 14 17 27 19 0.8 7 15 2.5
70 95 145 80f 78f 0.9 0.3 74 81 16 21 21 17 0.8 15 22 1.6
40 88 1,179 75 — — — 73 79 16 19 26 19 0.9 7 16 2.9
Capita,
017c
Percent
Urban
Population
per km2 of
Arable Land
Married Women 15-49 Ages 15-49 With HIV/AIDS (%) Life Expectancy at Birth (Years) Life Expectancy at Age 65 (Years) Population Ages 15 Population Ages 65+
Using Contraceptiond (%) Males 2017 Females 2017 Males Females Males Females 2018 (%) 2050 (%) 2050 as a
Multiple of 2018e
2018 (%) 2050 (%) 2050 as a
Multiple of 2018eAll Methods Modern Methods
14 49 915 65 59 — — 71 74 15 18 24 18 0.9 8 18 2.5
210 45 832 56 48 0.3 0.2 69 73 15 18 27 19 0.9 7 15 2.7
86 71 701 54 37 — — 72 77 15 18 29 22 1.1 6 13 3.6
060 64 664 57 28 0.2 0.1 72 78 15 17 20 15 0.6 11 23 1.7
650 53 513 51 14 0.2 0.1 73 78 13 16 23 17 0.9 7 17 2.9
930 89 96,054 — — 0.1 0.1 76 78 15 16 20 13 0.9 3 13 6.8
609 68 1,202 — — 0.2 0.1 80 85 17 20 16 13 1.0 16 26 1.9
120 58 872 53 35 0.7 0.2 69 78 13 17 20 17 0.8 15 23 1.3
010 70 798 53 36 — — 68 72 13 15 40 32 1.5 3 6 3.4
060 91 2,857 — — — — 81 84 20 22 28 23 1.4 11 17 2.6
110 90 4,462 61 42 — — 73 76 15 17 35 24 0.9 4 11 4.1
310 100 54,508 — — 0.1 0.1 74 76 14 14 21 17 1.1 2 16 9.6
690 89 4,621 55 47 0.1 0.1 77 79 17 20 24 14 0.5 7 23 3.2
240 85 12,326 30 19 — — 75 79 16 19 22 15 1.0 3 14 8.2
560 76 7,566 57 44 — — 72 75 14 16 39 28 1.3 3 7 3.8
060 100 20,571 38 34 0.2 0.1 77 80 17 18 14 11 1.2 1 13 16.2
770 84 954 25 21 — — 73 76 14 16 25 17 0.9 3 17 7.0
— 54 392 54 38 — — 64 77 14 17 37 22 1.1 4 12 5.2
550 75 394 74 47 — — 75 81 15 19 24 17 0.9 9 21 3.1
410 87 25,444 — — — — 77 79 16 17 14 12 1.2 1 14 17.5
380 37 2,317 34 29 — — 64 66 12 14 40 26 1.1 3 6 3.4
317 36 767 54 46 0.2 0.2 68 71 14 15 28 20 0.9 6 13 2.9
71 48 192 55 53 0.3 0.2 69 76 13 16 29 22 1.1 5 12 3.5
440 57 63 56 54 0.3 0.1 68 77 12 16 25 22 1.2 7 13 2.7
620 34 479 42 40 0.3 0.1 67 75 13 16 32 24 1.0 5 11 3.2
670 27 1,241 29 27 0.4 0.1 68 74 13 17 35 27 1.1 3 9 3.7
320 52 303 50 47 — — 64 71 13 15 31 23 1.1 4 11 3.8
130 51 748 65 62 0.3 0.2 71 76 13 16 28 19 1.0 4 13 4.3
63 36 865 53 46 0.2 0.2 68 70 14 15 28 19 0.9 6 13 2.9
000 25 470 23 20 — — 62 65 12 14 44 26 1.1 3 6 4.2
040 37 2,143 62 54 0.1 0.1 70 73 16 18 29 17 0.7 5 16 3.8
850 39 815 66 65 — — 70 70 17 17 27 16 0.7 5 17 4.3
060 34 876 54 48 0.2 0.2 67 70 14 15 28 19 0.8 6 13 2.7
010 74 555 77 57 0.2 0.1 75 77 16 16 24 15 0.7 6 23 4.3
350 39 10,978 35 27 — — 76 78 16 17 23 15 0.8 4 19 5.9
Capita,
017c
Percent
Urban
Population
per km2 of
Arable Land
Married Women 15-49
Using Contraceptiond (%) Ages 15-49 With HIV/AIDS (%) Life Expectancy at Birth (Years) Life Expectancy at Age 65 (Years) Population Ages 15 Population Ages 65+
All Methods Modern Methods Males 2017 Females 2017 Males Females Males Females 2018 (%) 2050 (%)
2050 as a
Multiple of 2018e 2018 (%) 2050 (%)
2050 as a
Multiple of 2018e
Dominican Republic 10.8 20 6 1.4 -3 12.0 13.2 31 2.5 15,290 80 1,354 70 68 1.0 0
Grenada 0.1 16 9 0.7 -0 0.1 0.1 19 2.1 14,410 36 3,807 — — — —
Guadeloupe 0.4 10 8 0.1 -9 0.4 0.4 8.1 1.7 — 99 1,707 — — — —
Haiti 10.8 25 8 1.7 -2 12.4 14.5 59 3.0 1,830 55 1,008 34 32 1.5 2
Jamaica 2.9 17 7 1.0 -6 2.9 2.7 14 2.0 8,690 56 2,416 73 68 2.4 1
Martinique 0.4 9 9 0.0 -9 0.4 0.3 7 1.7 — 89 3,329 — — — —
Puerto Rico 3.3 7 9 -0.2 -17 3.2 2.9 7.0 1.1 25,240 94 5,352 84f 72f — —
St. Kitts-Nevis 0.05 14 9 0.5 3 0.06 0.06 17 1.8 26,300 31 1,062 — — — —
Saint Lucia 0.2 12 6 0.7 -3 0.2 0.2 18 1.5 13,230 19 5,780 56 53 — —
St. Vincent and the Grenadines 0.1 16 9 0.7 -6 0.1 0.1 18 2.1 11,770 52 2,210 — — — —
Trinidad and Tobago 1.4 13 8 0.5 -1 1.4 1.4 13 1.6 30,520 53 5,450 40 38 1.4 0
SOUTH AMERICA 427 16 6 1.0 -0 467 505 13 2.0 15,509 83 300 79 74 0.7 0
Argentina 44.5 17 8 1.0 -0 49.4 56.4 10.1 2.3 20,270 92 114 81f 78f 0.6 0
Bolivia 11.3 23 7 1.6 -1 13.3 16.5 37 2.9 7,330 69 253 67 45 0.4 0
Brazil 209.4 14 6 0.8 0 223.9 231.0 11 1.7 15,160 86 262 80 78 0.8 0
Chile 18.6 14 6 0.8 2 19.6 20.2 6.9 1.8 23,150 87 1,413 76 70 0.8 0
Colombia 49.8 15 6 0.9 -1 55.5 61.5 14 2.0 14,170 77 2,951 81 76 0.7 0
Ecuador 17.0 20 5 1.5 -0 19.7 23.2 19 2.5 11,350 64 1,595 80 72 0.5 0
French Guiana 0.3 27 4 2.3 4 0.4 0.5 9 3.6 — 85 2,131 — — — —
Guyana 0.8 21 8 1.2 -7 0.8 0.8 31 2.5 8,120 27 186 34 33 1.7 1
Paraguay 6.9 21 6 1.5 -2 7.8 8.9 17 2.5 9,180 61 144 68 67 0.6 0
Peru 32.2 19 6 1.4 -1 36.4 41.1 16 2.4 12,890 78 775 76 54 0.5 0
Suriname 0.6 18 7 1.1 -2 0.6 0.6 16 2.4 14,290 66 874 48 47 1.3 1
Uruguay 3.5 14 9 0.5 -1 3.6 3.7 11.5 2.0 21,870 95 145 80f 78f 0.9 0
Venezuela 31.8 19 5 1.4 -1 36.1 40.5 12.5 2.4 17,440 88 1,179 75 — — —
Population
(millions)
mid-2018
Births
per 1,000
Population
Deaths
per 1,000
Population
Rate of
Natural
Increase (%)
Net
Migration
Rate
Population (millions) Infant
Mortality
Ratea
Total
Fertility
Rateb
GNI per Capita,
PPP 2017c
Percent
Urban
Population
per km2 of
Arable Land
Married Women 15-49 Ages 15-49 With HIV/AI
mid-2030 mid-2050 Using Contraceptiond (%) Males 2017 Female
All Methods Modern Methods
ASIA 4,536 17 7 1.1 -0 4,943 5,253 26 2.1 13,714 49 915 65 59 —
ASIA (EXCL. CHINA) 3,134 19 6 1.3 -1 3,515 3,900 31 2.3 12,210 45 832 56 48 0.3 0
WESTERN ASIA 272 21 5 1.6 1 329 400 22 2.7 28,686 71 701 54 37 —
Armenia 3.0 13 9 0.4 -8 2.8 2.4 8 1.6 10,060 64 664 57 28 0.2 0
Azerbaijan 9.9 15 6 0.9 0 10.7 11.1 11 1.9 16,650 53 513 51 14 0.2 0
Bahrain 1.5 14 2 1.1 23 1.9 2.1 6 1.9 42,930 89 96,054 — — 0.1 0
Cyprus 1.2 11 6 0.5 3 1.3 1.4 3 1.4 33,609 68 1,202 — — 0.2 0
Georgia 3.9 14 13 0.2 -1 3.7 3.4 10 2.1 10,120 58 872 53 35 0.7 0
Iraq 40.2 31 4 2.7 2 53.4 76.5 38 4.1 17,010 70 798 53 36 —
Israel 8.5 21 5 1.6 3 10.8 14.4 3.0 3.1 38,060 91 2,857 — — —
Jordan 10.2 24 3 2.1 0 12.0 13.4 15 3.2 9,110 90 4,462 61 42 —
Kuwait 4.2 14 2 1.3 15 4.9 5.6 8 1.5 83,310 100 54,508 — — 0.1 0
Lebanon 6.1 14 5 0.9 -1 5.5 5.6 7 1.7 14,690 89 4,621 55 47 0.1 0
Oman 4.7 20 2 1.8 32 5.8 7.1 9 2.9 40,240 85 12,326 30 19 —
Palestinian Territory 4.8 31 4 2.7 -2 6.2 8.4 18 4.1 5,560 76 7,566 57 44 —
Qatar 2.7 10 1 0.9 28 3.2 3.8 6 1.9 128,060 100 20,571 38 34 0.2 0
Saudi Arabia 33.4 17 3 1.4 11 39.3 44.9 12 2.4 54,770 84 954 25 21 —
Syria 18.3 22 6 1.6 -21 26.6 34.0 17 2.9 — 54 392 54 38 —
Turkey 81.3 16 5 1.1 0 93.3 104.7 9 2.1 27,550 75 394 74 47 —
United Arab Emirates 9.5 10 2 0.8 8 11.1 13.2 6 1.8 74,410 87 25,444 — — —
Yemen 28.9 32 6 2.5 -1 36.8 48.3 44 4.0 2,380 37 2,317 34 29 —
SOUTH CENTRAL ASIA 1,981 21 6 1.5 -1 2,239 2,508 36 2.4 7,317 36 767 54 46 0.2 0
CENTRAL ASIA 72 24 6 1.8 -1 84 101 17 2.9 11,371 48 192 55 53 0.3 0
Kazakhstan 18.4 23 7 1.5 -1 20.5 24.7 9 3.0 23,440 57 63 56 54 0.3 0
Kyrgyzstan 6.1 26 6 2.1 -1 7.0 8.1 17 3.1 3,620 34 479 42 40 0.3 0
Tajikistan 9.1 33 5 2.7 -2 10.7 12.9 27 3.8 3,670 27 1,241 29 27 0.4 0
Turkmenistan 5.9 26 7 1.9 -1 7.0 8.8 44 3.2 17,320 52 303 50 47 —
Uzbekistan 32.9 22 5 1.7 -1 38.7 46.5 11 2.5 7,130 51 748 65 62 0.3 0
Population
(millions)
mid-2018
Births
per 1,000
Population
Deaths
per 1,000
Population
Rate of
Natural
Increase (%)
Net
Migration
Rate
Population (millions) Infant
Mortality
Ratea
Total
Fertility
Rateb
GNI per Capita,
PPP 2017c
Percent
Urban
Population
per km2 of
Arable Land
Married Women 15-49
Using Contraceptiond (%) Ages 15-49 With HIV/AI
mid-2030 mid-2050 All Methods Modern Methods Males 2017 Female
Capita,
017c
Percent
Urban
Population
per km2 of
Arable Land
Married Women 15-49
Using Contraceptiond (%) Ages 15-49 With HIV/AIDS (%) Life Expectancy at Birth (Years) Life Expectancy at Age 65 (Years) Population Ages 15 Population Ages 65+
All Methods Modern Methods Males 2017 Females 2017 Males Females Males Females 2018 (%) 2050 (%)
2050 as a
Multiple of 2018e 2018 (%) 2050 (%)
2050 as a
Multiple of 2018e
27 55 535 62 56 — — 70 74 16 18 26 21 1.1 9 16 2.3
409 79 242 68 59 — — 76 82 18 21 16 16 1.0 18 27 1.5
445 50 704 61 55 — — 69 73 15 17 28 22 1.1 7 14 2.8
840 48 632 54 47 0.9 1.3 67 71 15 17 31 24 1.1 6 12 3.0
723 33 585 37 33 1.5 2.3 63 66 14 15 40 31 1.5 4 7 3.5
65 43 546 36 32 2.7 4.3 61 64 13 15 41 32 1.6 3 6 3.4
57 52 548 52 47 0.1 0.1 71 74 15 16 32 25 1.2 5 12 3.8
050 73 572 57 50 0.1 0.1 77 78 18 19 29 20 1.0 6 17 4.3
360 43 3,350 59 57 0.1 0.1 71 74 13 15 34 25 1.3 4 11 4.7
940 80 376 42 20 — — 69 75 13 16 28 18 0.8 4 17 4.6
063 62 433 67 59 0.1 0.1 75 78 15 17 24 19 0.9 8 18 2.7
482 36 210 12 12 0.2 0.2 63 66 14 15 41 31 1.6 4 6 3.4
490 68 399 63 51 0.1 0.1 75 78 15 18 24 18 0.9 8 20 2.9
— 87 14,150 — — — — 68 72 13 15 28 20 1.1 3 12 6.8
683 40 546 33 28 3.3 5.2 59 62 13 14 43 33 1.6 3 5 3.3
74 46 445 24 18 1.8 2.4 56 58 11 12 44 35 1.7 3 4 3.2
260 45 425 18 13 0.7 1.3 59 62 13 14 43 34 1.6 3 5 3.1
810 29 338 32 30 0.6 1.0 60 61 12 12 47 35 1.8 3 4 3.4
570 66 1,101 61 57 0.5 0.7 71 75 14 16 31 19 0.7 4 12 3.2
820 51 859 24 19 1.9 3.7 52 55 11 12 43 35 1.7 3 4 2.8
670 61 494 9 8 1.4 1.9 60 63 12 13 46 33 1.7 2 4 4.0
490 56 627 33 27 1.0 2.3 62 64 12 13 39 30 1.3 3 6 3.3
270 35 383 9 8 1.1 1.9 58 61 12 12 45 33 1.5 4 5 2.7
700 43 636 16 14 2.6 4.1 56 59 12 12 42 32 1.4 3 5 3.3
710 51 971 31 31 1.0 1.8 62 64 12 13 42 32 1.6 3 5 3.6
160 42 303 16 15 0.9 1.6 58 62 12 12 47 36 1.8 2 4 3.8
900 54 1,009 18 16 0.4 0.3 62 65 12 13 40 32 1.6 3 6 3.6
990 16 132 19 18 0.3 0.3 59 61 12 13 50 43 2.4 3 3 2.9
680 50 576 24 16 2.5 3.0 53 54 11 11 44 35 1.7 3 4 3.1
620 46 509 28 26 0.3 0.6 65 69 13 14 43 33 1.6 3 5 3.8
480 41 487 17 16 1.1 1.6 51 52 10 10 42 29 1.2 3 5 3.1
620 42 302 20 17 1.5 2.7 59 61 12 12 42 32 1.5 3 5 3.5
92 28 651 41 38 3.4 5.6 62 66 14 15 43 32 1.5 3 5 3.5
770 13 987 29 23 0.8 1.4 59 62 13 14 46 36 2.1 2 4 4.2
570 29 1,281 19 14 0.1 0.1 62 65 12 14 40 30 1.3 3 6 3.5
— 78 48,550 19 18 1.1 1.5 61 64 14 15 32 21 0.9 4 10 3.3
500 40 865 8 7 0.4 0.7 62 68 13 14 41 30 1.1 4 6 2.3
890 20 711 37 35 0.7 1.2 64 67 14 15 41 26 1.1 4 7 3.3
250 32 878 62 60 3.5 6.2 65 69 14 16 41 29 1.3 3 7 5.1
510 37 750 40 33 0.4 0.2 64 68 13 14 41 32 1.6 3 6 4.0
180 17 502 59 58 7.4 11.7 61 66 14 15 44 32 1.4 3 5 3.2
570 41 1,710 64 32 — — 71 78 15 19 19 14 0.7 11 24 2.2
— 46 2,970 — — — — 74 77 18 22 44 27 1.3 3 10 8.1
200 32 540 27 25 9.9 15.0 56 60 13 14 45 35 1.7 3 4 3.0
— 100 2,539 — — — — 78 84 18 22 24 17 0.8 11 25 2.6
990 19 1,091 53 48 1.9 3.4 65 69 14 15 40 27 1.3 3 8 5.0
860 57 64,364 — — — — 68 78 14 18 22 18 0.8 8 23 2.8
— 45 1,380 15 14 0.1 0.1 55 58 13 13 47 38 1.9 3 3 2.9
440 20 — 4 2 2.0 2.9 56 58 13 14 42 32 1.7 3 5 3.0
916 34 438 38 32 3.4 5.5 64 67 14 15 45 36 1.9 3 5 3.6
820 24 639 42 36 4.5 7.3 62 64 13 14 48 36 1.6 3 4 3.0
920 44 465 49 45 8.8 14.3 59 64 14 15 45 36 2.0 2 4 4.5
MENT DATA AND ESTIMATES FOR THE COUNTRIES, TERRITORIES, AND REGIONS OF THE WORLD
Saint Lucia 0.2 12 6 0.7 -3 0.2 0.2 18 1.5 13,230 19 5,780 56 53 — —
St. Vincent and the Grenadines 0.1 16 9 0.7 -6 0.1 0.1 18 2.1 11,770 52 2,210 — — — —
Trinidad and Tobago 1.4 13 8 0.5 -1 1.4 1.4 13 1.6 30,520 53 5,450 40 38 1.4 0
SOUTH AMERICA 427 16 6 1.0 -0 467 505 13 2.0 15,509 83 300 79 74 0.7 0
Argentina 44.5 17 8 1.0 -0 49.4 56.4 10.1 2.3 20,270 92 114 81f 78f 0.6 0
Bolivia 11.3 23 7 1.6 -1 13.3 16.5 37 2.9 7,330 69 253 67 45 0.4 0
Brazil 209.4 14 6 0.8 0 223.9 231.0 11 1.7 15,160 86 262 80 78 0.8 0
Chile 18.6 14 6 0.8 2 19.6 20.2 6.9 1.8 23,150 87 1,413 76 70 0.8 0
Colombia 49.8 15 6 0.9 -1 55.5 61.5 14 2.0 14,170 77 2,951 81 76 0.7 0
Ecuador 17.0 20 5 1.5 -0 19.7 23.2 19 2.5 11,350 64 1,595 80 72 0.5 0
French Guiana 0.3 27 4 2.3 4 0.4 0.5 9 3.6 — 85 2,131 — — — —
Guyana 0.8 21 8 1.2 -7 0.8 0.8 31 2.5 8,120 27 186 34 33 1.7 1
Paraguay 6.9 21 6 1.5 -2 7.8 8.9 17 2.5 9,180 61 144 68 67 0.6 0
Peru 32.2 19 6 1.4 -1 36.4 41.1 16 2.4 12,890 78 775 76 54 0.5 0
Suriname 0.6 18 7 1.1 -2 0.6 0.6 16 2.4 14,290 66 874 48 47 1.3 1
Uruguay 3.5 14 9 0.5 -1 3.6 3.7 11.5 2.0 21,870 95 145 80f 78f 0.9 0
Venezuela 31.8 19 5 1.4 -1 36.1 40.5 12.5 2.4 17,440 88 1,179 75 — — —
Population
(millions)
mid-2018
Births
per 1,000
Population
Deaths
per 1,000
Population
Rate of
Natural
Increase (%)
Net
Migration
Rate
Population (millions) Infant
Mortality
Ratea
Total
Fertility
Rateb
GNI per Capita,
PPP 2017c
Percent
Urban
Population
per km2 of
Arable Land
Married Women 15-49 Ages 15-49 With HIV/AI
mid-2030 mid-2050 Using Contraceptiond (%) Males 2017 Female
All Methods Modern Methods
ASIA 4,536 17 7 1.1 -0 4,943 5,253 26 2.1 13,714 49 915 65 59 —
ASIA (EXCL. CHINA) 3,134 19 6 1.3 -1 3,515 3,900 31 2.3 12,210 45 832 56 48 0.3 0
WESTERN ASIA 272 21 5 1.6 1 329 400 22 2.7 28,686 71 701 54 37 —
Armenia 3.0 13 9 0.4 -8 2.8 2.4 8 1.6 10,060 64 664 57 28 0.2 0
Azerbaijan 9.9 15 6 0.9 0 10.7 11.1 11 1.9 16,650 53 513 51 14 0.2 0
Bahrain 1.5 14 2 1.1 23 1.9 2.1 6 1.9 42,930 89 96,054 — — 0.1 0
Cyprus 1.2 11 6 0.5 3 1.3 1.4 3 1.4 33,609 68 1,202 — — 0.2 0
Georgia 3.9 14 13 0.2 -1 3.7 3.4 10 2.1 10,120 58 872 53 35 0.7 0
Iraq 40.2 31 4 2.7 2 53.4 76.5 38 4.1 17,010 70 798 53 36 —
Israel 8.5 21 5 1.6 3 10.8 14.4 3.0 3.1 38,060 91 2,857 — — —
Jordan 10.2 24 3 2.1 0 12.0 13.4 15 3.2 9,110 90 4,462 61 42 —
Kuwait 4.2 14 2 1.3 15 4.9 5.6 8 1.5 83,310 100 54,508 — — 0.1 0
Lebanon 6.1 14 5 0.9 -1 5.5 5.6 7 1.7 14,690 89 4,621 55 47 0.1 0
Oman 4.7 20 2 1.8 32 5.8 7.1 9 2.9 40,240 85 12,326 30 19 —
Palestinian Territory 4.8 31 4 2.7 -2 6.2 8.4 18 4.1 5,560 76 7,566 57 44 —
Qatar 2.7 10 1 0.9 28 3.2 3.8 6 1.9 128,060 100 20,571 38 34 0.2 0
Saudi Arabia 33.4 17 3 1.4 11 39.3 44.9 12 2.4 54,770 84 954 25 21 —
Syria 18.3 22 6 1.6 -21 26.6 34.0 17 2.9 — 54 392 54 38 —
Turkey 81.3 16 5 1.1 0 93.3 104.7 9 2.1 27,550 75 394 74 47 —
United Arab Emirates 9.5 10 2 0.8 8 11.1 13.2 6 1.8 74,410 87 25,444 — — —
Yemen 28.9 32 6 2.5 -1 36.8 48.3 44 4.0 2,380 37 2,317 34 29 —
SOUTH CENTRAL ASIA 1,981 21 6 1.5 -1 2,239 2,508 36 2.4 7,317 36 767 54 46 0.2 0
CENTRAL ASIA 72 24 6 1.8 -1 84 101 17 2.9 11,371 48 192 55 53 0.3 0
Kazakhstan 18.4 23 7 1.5 -1 20.5 24.7 9 3.0 23,440 57 63 56 54 0.3 0
Kyrgyzstan 6.1 26 6 2.1 -1 7.0 8.1 17 3.1 3,620 34 479 42 40 0.3 0
Tajikistan 9.1 33 5 2.7 -2 10.7 12.9 27 3.8 3,670 27 1,241 29 27 0.4 0
Turkmenistan 5.9 26 7 1.9 -1 7.0 8.8 44 3.2 17,320 52 303 50 47 —
Uzbekistan 32.9 22 5 1.7 -1 38.7 46.5 11 2.5 7,130 51 748 65 62 0.3 0
SOUTH ASIA 1,909 21 6 1.5 -1 2,155 2,407 37 2.4 7,163 36 865 53 46 0.2 0
Afghanistan 36.5 35 7 2.8 -0 48.5 68.9 57 4.8 2,000 25 470 23 20 —
Bangladesh 166.4 19 5 1.4 -3 185.6 201.9 28 2.1 4,040 37 2,143 62 54 0.1 0
Bhutan 0.8 18 6 1.2 1 0.9 1.0 26 2.1 8,850 39 815 66 65 —
India 1,371.3 20 6 1.4 -0 1,532.3 1,680.1 34 2.3 7,060 34 876 54 48 0.2 0
Iran 81.6 19 5 1.4 -3 88.4 93.1 5 2.0 21,010 74 555 77 57 0.2 0
Maldives 0.4 20 3 1.7 6 0.5 0.6 8 2.4 15,350 39 10,978 35 27 —
Population
(millions)
mid-2018
Births
per 1,000
Population
Deaths
per 1,000
Population
Rate of
Natural
Increase (%)
Net
Migration
Rate
Population (millions) Infant
Mortality
Ratea
Total
Fertility
Rateb
GNI per Capita,
PPP 2017c
Percent
Urban
Population
per km2 of
Arable Land
Married Women 15-49
Using Contraceptiond (%) Ages 15-49 With HIV/AI
mid-2030 mid-2050 All Methods Modern Methods Males 2017 Female
POPULATION, HEALTH, AND ENVIRONMENT DATA AND ESTIMATES FOR THE COUNTRIES, TERRITORIES, AND REGIONS OF THE WORLD
© 2018 Population Reference Bureau	 See notes on page 18 2018 WORLD POPULATION DATA SHEET 14
Kyrgyzstan 6.1 26 6 2.1 -1 7.0 8.1 17 3.1 3,620 34 479 42 40 0.3 0
Tajikistan 9.1 33 5 2.7 -2 10.7 12.9 27 3.8 3,670 27 1,241 29 27 0.4 0
Turkmenistan 5.9 26 7 1.9 -1 7.0 8.8 44 3.2 17,320 52 303 50 47 —
Uzbekistan 32.9 22 5 1.7 -1 38.7 46.5 11 2.5 7,130 51 748 65 62 0.3 0
SOUTH ASIA 1,909 21 6 1.5 -1 2,155 2,407 37 2.4 7,163 36 865 53 46 0.2 0
Afghanistan 36.5 35 7 2.8 -0 48.5 68.9 57 4.8 2,000 25 470 23 20 —
Bangladesh 166.4 19 5 1.4 -3 185.6 201.9 28 2.1 4,040 37 2,143 62 54 0.1 0
Bhutan 0.8 18 6 1.2 1 0.9 1.0 26 2.1 8,850 39 815 66 65 —
India 1,371.3 20 6 1.4 -0 1,532.3 1,680.1 34 2.3 7,060 34 876 54 48 0.2 0
Iran 81.6 19 5 1.4 -3 88.4 93.1 5 2.0 21,010 74 555 77 57 0.2 0
Maldives 0.4 20 3 1.7 6 0.5 0.6 8 2.4 15,350 39 10,978 35 27 —
Nepal 29.7 20 6 1.4 -2 32.5 33.3 32 2.3 2,710 20 1,406 53 43 0.2 0
Pakistan 200.6 26 7 1.9 -4 244.0 306.6 66 3.1 5,830 37 659 35 26 0.2 0
Sri Lanka 21.7 16 6 0.9 -4 22.2 21.5 7 2.1 12,470 19 1,668 62 51 0.1 0
SOUTHEAST ASIA 650 18 7 1.1 -0 720 786 22 2.3 12,141 48 926 62 56 0.5 0
Brunei 0.4 16 4 1.2 1 0.5 0.5 6 1.9 83,760 78 8,682 — — —
Cambodia 16.0 23 6 1.7 -2 18.8 22.0 24 2.6 3,760 23 421 56 39 0.5 0
Indonesia 265.2 19 7 1.2 -1 293.9 319.7 22 2.4 11,900 54 1,129 61 59 0.5 0
Laos 7.0 24 7 1.7 -3 8.0 9.2 42 2.7 6,650 35 456 50 43 0.3 0
Malaysia 32.5 16 5 1.1 2 36.8 41.7 7 1.9 28,650 75 3,404 52 34 0.7 0
Myanmar 53.9 18 8 1.0 -1 58.9 62.4 52 2.3 5,830 29 495 52 51 0.9 0
Philippines 107.0 21 6 1.5 -1 126.0 152.0 21 2.7 10,030 47 1,914 54 40 0.2 0
Singapore 5.8 9 5 0.4 11 6.1 6.0 2.2 1.2 90,570 100 1,032,235 — — 0.4 0
Thailand 66.2 11 8 0.2 0 66.7 62.6 10 1.5 17,090 50 394 78 76 1.2 1
Timor-Leste 1.2 30 7 2.3 -8 1.5 1.9 30 4.2 6,330 31 798 26 24 —
Vietnam 94.7 16 7 0.9 -0 103.2 108.2 15 2.1 6,450 35 1,353 76 65 0.4 0
EAST ASIA 1,633 12 7 0.4 -0 1,655 1,558 9 1.7 19,961 62 1,274 82 80 —
China 1,393.8 12 7 0.5 -0 1,419.5 1,343.9 10 1.8 16,760 59 1,171 85 84 —
China, Hong Kong SARg 7.4 8 6 0.1 3 8.0 8.2 1.5 1.1 64,100 100 239,555 75 72 —
China, Macao SARg 0.7 10 3 0.7 6 0.8 0.8 2 1.0 96,570 100 — — — —
Japan 126.5 8 11 -0.3 1 119.1 101.8 2.0 1.4 45,470 92 3,012 40 34 0.1 0
Korea, North 25.6 14 9 0.5 -0 26.7 26.8 12 1.9 — 62 1,090 70 69 —
Korea, South 51.8 7 6 0.1 2 52.9 49.4 2.8 1.1 38,260 82 3,537 80 — —
Mongolia 3.2 24 6 1.8 0 3.8 4.6 13 2.8 11,170 68 565 55 48 0.1 0
Taiwan 23.6 9 7 0.2 0 24.0 22.7 3.9 1.2 — 78 3,986 — — —
EUROPE 746 10 11 -0.1 3 751 730 4 1.6 35,501 74 270 70 60 0.7 0
EUROPEAN UNION 512 10 10 0.0 3 518 512 4 1.6 41,207 75 477 71 65 —
NORTHERN EUROPE 105 11 9 0.2 5 111 118 4 1.8 45,710 81 545 82 81 —
Channel Islands 0.2 10 8 0.2 8 0.2 0.2 8.0 1.5 — 31 4,339 — — —
Denmark 5.8 11 9 0.2 4 6.1 6.4 3.8 1.8 51,560 88 246 — — 0.2 0
Estonia 1.3 10 12 -0.1 4 1.2 1.1 2.4 1.6 31,000 69 197 63 58 0.9 0
Finland 5.5 9 10 -0.1 3 5.8 5.9 2.0 1.5 45,730 71 246 86 82 —
Iceland 0.4 12 7 0.5 24 0.4 0.4 2.7 1.7 53,640 94 292 — — —
Ireland 4.9 13 6 0.7 4 5.5 6.8 2.8 1.8 62,440 63 472 65 61 0.3 0
Latvia 1.9 11 15 -0.4 -8 1.7 1.5 4.1 1.7 27,400 68 156 — — —
Lithuania 2.8 10 14 -0.4 -10 2.7 2.4 4.5 1.6 31,030 67 128 63 50 0.2 0
Norway 5.3 11 8 0.3 4 5.9 6.7 2.3 1.6 63,530 81 660 88f 82f 0.2 0
Sweden 10.2 11 9 0.2 10 11.2 12.0 2.5 1.8 50,840 87 395 — — —
United Kingdom 66.4 12 9 0.3 6 70.4 74.7 3.9 1.8 43,160 83 1,105 84 84 —
WESTERN EUROPE 195 10 10 0.0 4 201 203 3 1.7 49,652 80 573 72 70 0.4 0
Austria 8.8 10 9 0.0 5 9.3 9.7 2.9 1.5 52,660 58 657 66 63 0.2 0
Belgium 11.4 10 10 0.1 4 12.0 12.7 3.3 1.6 47,960 98 1,375 67 66 —
France 65.1 11 9 0.2 1 68.5 72.3 3.6 1.9 43,720 80 352 78 73 0.6 0
Germany 82.8 9 11 -0.2 6 82.9 79.1 3.3 1.6 51,760 77 699 69f 69f 0.2 0
Liechtenstein 0.04 10 7 0.3 5 0.04 0.04 4.2 1.6 — 14 1,771 — — —
Luxembourg 0.6 10 7 0.3 18 0.7 0.8 3.3 1.4 72,640 91 968 — — 0.4 0
Monaco 0.04 7 6 0.1 20 0.04 0.05 — 1.5 — 100 — — — —
Netherlands 17.2 10 9 0.1 5 17.9 18.4 3.5 1.6 52,640 92 1,668 73 70 0.3 0
Switzerland 8.5 10 8 0.2 6 9.5 10.3 3.5 1.5 65,910 85 2,138 73 69 —
EASTERN EUROPE 293 11 12 -0.2 1 286 265 5 1.5 23,046 69 150 66 52 1.0 0
Population
(millions)
mid-2018
Births
per 1,000
Population
Deaths
per 1,000
Population
Rate of
Natural
Increase (%)
Net
Migration
Rate
Population (millions) Infant
Mortality
Ratea
Total
Fertility
Rateb
GNI per Capita,
PPP 2017c
Percent
Urban
Population
per km2 of
Arable Land
Married Women 15-49
Using Contraceptiond (%) Ages 15-49 With HIV/AID
mid-2030 mid-2050 All Methods Modern Methods Males 2017 Female
WORLD 7,621 19 7 1.2 0 8,571 9,852 31 2.4 16,927 55 535 62 56 — —
MORE DEVELOPED 1,266 10 10 0.0 3 1,301 1,312 5 1.6 43,409 79 242 68 59 — —
LESS DEVELOPED 6,355 21 7 1.4 -1 7,270 8,540 34 2.6 11,445 50 704 61 55 — —
LESS DEVELOPED (Excl. China) 4,953 23 7 1.7 -1 5,841 7,187 37 2.8 9,840 48 632 54 47 0.9 1
LEAST DEVELOPED 1,027 33 8 2.5 -1 1,342 1,954 49 4.2 2,723 33 585 37 33 1.5 2
AFRICA 1,284 35 9 2.6 -1 1,714 2,586 50 4.6 4,965 43 546 36 32 2.7 4
NORTHERN AFRICA 235 26 6 2.0 -1 289 385 24 3.3 10,557 52 548 52 47 0.1 0
Algeria 42.7 26 4 2.2 -0 51.3 64.3 22 3.1 15,050 73 572 57 50 0.1 0
Egypt 97.0 27 6 2.1 -1 120.8 166.5 15 3.4 11,360 43 3,350 59 57 0.1 0
Libya 6.5 20 5 1.4 -4 7.3 8.1 22 2.3 19,940 80 376 42 20 — —
Morocco 35.2 18 5 1.2 -2 39.3 43.6 22 2.2 8,063 62 433 67 59 0.1 0
Sudan 41.7 34 8 2.7 -2 56.8 88.1 45 4.7 4,482 36 210 12 12 0.2 0
Tunisia 11.6 19 6 1.4 -0 12.7 13.8 15 2.3 11,490 68 399 63 51 0.1 0
Western Sahara 0.6 20 5 1.5 7 0.7 0.9 30 2.3 — 87 14,150 — — — —
SUB-SAHARAN AFRICA 1,049 37 9 2.7 -0 1,425 2,200 54 4.9 3,683 40 546 33 28 3.3 5
WESTERN AFRICA 382 38 11 2.7 -1 518 809 62 5.3 4,174 46 445 24 18 1.8 2
Benin 11.5 37 9 2.8 -0 15.6 23.9 63 5.0 2,260 45 425 18 13 0.7 1
Burkina Faso 20.3 40 9 3.1 -1 28.9 48.5 57 5.5 1,810 29 338 32 30 0.6 1
Cabo Verde 0.6 19 5 1.4 -3 0.6 0.6 21 2.2 6,570 66 1,101 61 57 0.5 0
Côte d’Ivoire 24.9 35 12 2.3 0 33.3 51.4 62 4.6 3,820 51 859 24 19 1.9 3
Gambia 2.2 39 8 3.1 -1 3.1 5.0 46 5.4 1,670 61 494 9 8 1.4 1
Ghana 29.5 30 8 2.2 -1 37.3 51.3 37 3.9 4,490 56 627 33 27 1.0 2
Guinea 11.9 39 11 2.8 -2 16.3 25.3 68 4.8 2,270 35 383 9 8 1.1 1
Guinea-Bissau 1.9 36 11 2.6 -1 2.5 3.6 73 4.6 1,700 43 636 16 14 2.6 4
Liberia 4.9 33 8 2.5 -1 6.5 9.8 50 4.2 710 51 971 31 31 1.0 1
Mali 19.4 45 10 3.5 -4 27.5 44.8 56 6.0 2,160 42 303 16 15 0.9 1
Mauritania 4.5 34 8 2.6 1 6.1 9.0 65 4.6 3,900 54 1,009 18 16 0.4 0
Niger 22.2 48 10 3.8 -0 34.0 63.1 60 7.2 990 16 132 19 18 0.3 0
Nigeria 195.9 39 12 2.6 -0 264.1 410.6 67 5.5 5,680 50 576 24 16 2.5 3
Senegal 16.3 33 6 2.7 -1 22.1 34.0 42 4.6 2,620 46 509 28 26 0.3 0
Sierra Leone 7.7 33 13 2.0 -1 9.7 13.0 84 4.2 1,480 41 487 17 16 1.1 1
Togo 8.0 34 9 2.5 -0 10.5 15.3 52 4.5 1,620 42 302 20 17 1.5 2
EASTERN AFRICA 432 36 8 2.8 -1 584 883 45 4.7 2,192 28 651 41 38 3.4 5
Burundi 11.8 41 11 3.0 -0 17.2 30.4 47 5.5 770 13 987 29 23 0.8 1
Comoros 0.8 33 7 2.5 -2 1.1 1.5 55 4.3 1,570 29 1,281 19 14 0.1 0
Djibouti 1.0 23 8 1.5 1 1.1 1.3 52 2.9 — 78 48,550 19 18 1.1 1
Eritrea 6.0 30 7 2.3 -15 6.8 8.9 46 4.1 1,500 40 865 8 7 0.4 0
Ethiopia 107.5 33 7 2.6 -0 139.6 190.9 40 4.4 1,890 20 711 37 35 0.7 1
Kenya 51.0 31 6 2.6 -0 67.0 95.5 36 3.9 3,250 32 878 62 60 3.5 6
Madagascar 26.3 32 6 2.6 -0 35.6 53.8 32 4.1 1,510 37 750 40 33 0.4 0
Malawi 19.1 34 7 2.6 -1 25.6 37.4 42 4.2 1,180 17 502 59 58 7.4 11
Mauritius 1.3 11 8 0.3 -1 1.3 1.2 11.8 1.4 22,570 41 1,710 64 32 — —
Mayotte 0.3 39 3 3.6 -0 0.4 0.6 4 5.1 — 46 2,970 — — — —
Mozambique 30.5 39 10 2.9 -0 42.4 67.8 65 5.3 1,200 32 540 27 25 9.9 15
Réunion 0.9 16 6 1.0 -4 0.9 1.0 7 2.4 — 100 2,539 — — — —
Rwanda 12.6 32 6 2.6 -1 16.6 24.3 32 4.2 1,990 19 1,091 53 48 1.9 3
Seychelles 0.1 17 8 1.0 -3 0.1 0.1 13.4 2.4 26,860 57 64,364 — — — —
Somalia 15.2 43 11 3.2 -3 21.5 35.9 72 6.3 — 45 1,380 15 14 0.1 0
South Sudan 13.0 37 11 2.6 4 17.9 27.9 69 5.0 1,440 20 — 4 2 2.0 2
Tanzania 59.1 39 7 3.3 -1 83.7 138.1 43 5.2 2,916 34 438 38 32 3.4 5
Uganda 44.1 41 9 3.2 -1 61.6 95.6 43 5.4 1,820 24 639 42 36 4.5 7
Zambia 17.7 39 8 3.1 -0 25.8 45.1 49 5.2 3,920 44 465 49 45 8.8 14
POPULATION, HEALTH, AND ENVIRONMENT DATA AND ESTIMATES FOR THE COUNTRIESPOPULATION, HEALTH, AND ENVIRONMENT DATA AND ESTIMATES FOR THE COUNTRIES, TERRITORIES, AND REGIONS OF THE WORLD
© 2018 Population Reference Bureau	 See notes on page 18 2018 WORLD POPULATION DATA SHEET 15
620 34 479 42 40 0.3 0.1 67 75 13 16 32 24 1.0 5 11 3.2
670 27 1,241 29 27 0.4 0.1 68 74 13 17 35 27 1.1 3 9 3.7
320 52 303 50 47 — — 64 71 13 15 31 23 1.1 4 11 3.8
130 51 748 65 62 0.3 0.2 71 76 13 16 28 19 1.0 4 13 4.3
63 36 865 53 46 0.2 0.2 68 70 14 15 28 19 0.9 6 13 2.9
000 25 470 23 20 — — 62 65 12 14 44 26 1.1 3 6 4.2
040 37 2,143 62 54 0.1 0.1 70 73 16 18 29 17 0.7 5 16 3.8
850 39 815 66 65 — — 70 70 17 17 27 16 0.7 5 17 4.3
060 34 876 54 48 0.2 0.2 67 70 14 15 28 19 0.8 6 13 2.7
010 74 555 77 57 0.2 0.1 75 77 16 16 24 15 0.7 6 23 4.3
350 39 10,978 35 27 — — 76 78 16 17 23 15 0.8 4 19 5.9
710 20 1,406 53 43 0.2 0.1 70 71 13 15 31 17 0.6 5 13 2.8
830 37 659 35 26 0.2 0.1 66 68 14 14 33 25 1.2 4 8 3.1
470 19 1,668 62 51 0.1 0.1 72 79 16 18 25 17 0.7 8 23 2.9
41 48 926 62 56 0.5 0.3 68 73 14 17 27 19 0.9 6 16 3.0
760 78 8,682 — — — — 76 79 16 18 23 16 0.8 4 22 6.3
760 23 421 56 39 0.5 0.6 67 71 13 15 31 22 1.0 4 12 3.9
900 54 1,129 61 59 0.5 0.3 67 71 12 14 28 20 0.9 5 14 3.2
650 35 456 50 43 0.3 0.3 65 68 13 14 33 20 0.8 4 11 3.5
650 75 3,404 52 34 0.7 0.2 73 77 15 17 24 17 0.9 6 16 3.4
830 29 495 52 51 0.9 0.5 64 69 13 14 27 19 0.8 6 13 2.7
030 47 1,914 54 40 0.2 0.1 66 73 13 15 32 24 1.1 5 10 3.0
570 100 1,032,235 — — 0.4 0.1 81 85 19 22 15 11 0.8 13 34 2.7
090 50 394 78 76 1.2 1.0 72 79 17 20 17 13 0.7 12 29 2.3
330 31 798 26 24 — — 67 71 13 14 39 33 1.3 6 5 1.2
450 35 1,353 76 65 0.4 0.2 71 76 16 21 24 17 0.8 8 22 3.1
61 62 1,274 82 80 — — 76 79 16 19 16 14 0.8 13 27 2.0
760 59 1,171 85 84 — — 75 78 15 17 17 14 0.8 11 26 2.2
100 100 239,555 75 72 — — 82 88 20 24 12 12 1.2 17 34 2.2
570 100 — — — — — 80 86 19 24 13 14 1.4 11 28 3.4
470 92 3,012 40 34 0.1 0.1 81 87 19 24 12 13 0.8 28 36 1.0
— 62 1,090 70 69 — — 68 75 11 17 21 16 0.8 10 20 2.2
260 82 3,537 80 — — — 79 85 18 23 13 12 0.9 14 35 2.3
170 68 565 55 48 0.1 0.1 66 75 12 16 30 22 1.1 4 13 4.8
— 78 3,986 — — — — 77 84 19 21 13 12 0.8 13 35 2.5
01 74 270 70 60 0.7 0.4 75 82 17 20 16 15 0.9 18 28 1.5
07 75 477 71 65 — — 78 83 18 21 16 14 0.9 20 30 1.5
10 81 545 82 81 — — 79 83 19 21 18 16 1.0 18 25 1.6
— 31 4,339 — — — — 80 85 18 21 16 13 0.9 17 29 1.7
560 88 246 — — 0.2 0.1 79 83 18 21 17 16 1.1 19 24 1.4
000 69 197 63 58 0.9 0.4 73 82 16 20 16 15 0.8 20 29 1.3
730 71 246 86 82 — — 79 84 19 22 16 16 1.0 21 26 1.3
640 94 292 — — — — 81 84 20 22 19 16 1.0 14 25 2.2
440 63 472 65 61 0.3 0.2 78 83 18 21 21 18 1.2 14 26 2.6
400 68 156 — — — — 70 79 14 19 16 15 0.8 20 28 1.1
030 67 128 63 50 0.2 0.1 69 80 14 19 15 15 0.9 19 26 1.2
530 81 660 88f 82f 0.2 0.1 81 84 19 22 18 16 1.2 17 24 1.8
840 87 395 — — — — 81 84 19 22 18 17 1.1 20 24 1.4
160 83 1,105 84 84 — — 79 83 19 21 18 16 1.0 18 25 1.6
52 80 573 72 70 0.4 0.1 79 84 19 22 15 15 1.0 20 29 1.5
660 58 657 66 63 0.2 0.1 79 84 19 22 14 13 1.0 19 31 1.8
960 98 1,375 67 66 — — 79 84 18 22 17 16 1.1 19 27 1.6
720 80 352 78 73 0.6 0.3 80 85 20 23 18 17 1.0 20 27 1.5
760 77 699 69f 69f 0.2 0.1 78 83 18 21 13 13 0.9 21 31 1.4
— 14 1,771 — — — — 81 84 — — 15 — — 17 — —
640 91 968 — — 0.4 0.1 80 84 19 22 16 16 1.3 14 23 2.2
— 100 — — — — — — — — — 13 — — 26 — —
640 92 1,668 73 70 0.3 0.1 80 83 19 21 16 15 1.0 18 28 1.6
910 85 2,138 73 69 — — 82 85 20 23 15 14 1.1 18 29 1.9
46 69 150 66 52 1.0 0.7 69 78 14 18 17 16 0.8 16 25 1.4
Capita,
017c
Percent
Urban
Population
per km2 of
Arable Land
Married Women 15-49
Using Contraceptiond (%) Ages 15-49 With HIV/AIDS (%) Life Expectancy at Birth (Years) Life Expectancy at Age 65 (Years) Population Ages 15 Population Ages 65+
All Methods Modern Methods Males 2017 Females 2017 Males Females Males Females 2018 (%) 2050 (%)
2050 as a
Multiple of 2018e 2018 (%) 2050 (%)
2050 as a
Multiple of 2018e
27 55 535 62 56 — — 70 74 16 18 26 21 1.1 9 16 2.3
409 79 242 68 59 — — 76 82 18 21 16 16 1.0 18 27 1.5
445 50 704 61 55 — — 69 73 15 17 28 22 1.1 7 14 2.8
840 48 632 54 47 0.9 1.3 67 71 15 17 31 24 1.1 6 12 3.0
723 33 585 37 33 1.5 2.3 63 66 14 15 40 31 1.5 4 7 3.5
65 43 546 36 32 2.7 4.3 61 64 13 15 41 32 1.6 3 6 3.4
57 52 548 52 47 0.1 0.1 71 74 15 16 32 25 1.2 5 12 3.8
050 73 572 57 50 0.1 0.1 77 78 18 19 29 20 1.0 6 17 4.3
360 43 3,350 59 57 0.1 0.1 71 74 13 15 34 25 1.3 4 11 4.7
940 80 376 42 20 — — 69 75 13 16 28 18 0.8 4 17 4.6
063 62 433 67 59 0.1 0.1 75 78 15 17 24 19 0.9 8 18 2.7
482 36 210 12 12 0.2 0.2 63 66 14 15 41 31 1.6 4 6 3.4
490 68 399 63 51 0.1 0.1 75 78 15 18 24 18 0.9 8 20 2.9
— 87 14,150 — — — — 68 72 13 15 28 20 1.1 3 12 6.8
683 40 546 33 28 3.3 5.2 59 62 13 14 43 33 1.6 3 5 3.3
74 46 445 24 18 1.8 2.4 56 58 11 12 44 35 1.7 3 4 3.2
260 45 425 18 13 0.7 1.3 59 62 13 14 43 34 1.6 3 5 3.1
810 29 338 32 30 0.6 1.0 60 61 12 12 47 35 1.8 3 4 3.4
570 66 1,101 61 57 0.5 0.7 71 75 14 16 31 19 0.7 4 12 3.2
820 51 859 24 19 1.9 3.7 52 55 11 12 43 35 1.7 3 4 2.8
670 61 494 9 8 1.4 1.9 60 63 12 13 46 33 1.7 2 4 4.0
490 56 627 33 27 1.0 2.3 62 64 12 13 39 30 1.3 3 6 3.3
270 35 383 9 8 1.1 1.9 58 61 12 12 45 33 1.5 4 5 2.7
700 43 636 16 14 2.6 4.1 56 59 12 12 42 32 1.4 3 5 3.3
710 51 971 31 31 1.0 1.8 62 64 12 13 42 32 1.6 3 5 3.6
160 42 303 16 15 0.9 1.6 58 62 12 12 47 36 1.8 2 4 3.8
900 54 1,009 18 16 0.4 0.3 62 65 12 13 40 32 1.6 3 6 3.6
990 16 132 19 18 0.3 0.3 59 61 12 13 50 43 2.4 3 3 2.9
680 50 576 24 16 2.5 3.0 53 54 11 11 44 35 1.7 3 4 3.1
620 46 509 28 26 0.3 0.6 65 69 13 14 43 33 1.6 3 5 3.8
480 41 487 17 16 1.1 1.6 51 52 10 10 42 29 1.2 3 5 3.1
620 42 302 20 17 1.5 2.7 59 61 12 12 42 32 1.5 3 5 3.5
92 28 651 41 38 3.4 5.6 62 66 14 15 43 32 1.5 3 5 3.5
770 13 987 29 23 0.8 1.4 59 62 13 14 46 36 2.1 2 4 4.2
570 29 1,281 19 14 0.1 0.1 62 65 12 14 40 30 1.3 3 6 3.5
— 78 48,550 19 18 1.1 1.5 61 64 14 15 32 21 0.9 4 10 3.3
500 40 865 8 7 0.4 0.7 62 68 13 14 41 30 1.1 4 6 2.3
890 20 711 37 35 0.7 1.2 64 67 14 15 41 26 1.1 4 7 3.3
250 32 878 62 60 3.5 6.2 65 69 14 16 41 29 1.3 3 7 5.1
510 37 750 40 33 0.4 0.2 64 68 13 14 41 32 1.6 3 6 4.0
180 17 502 59 58 7.4 11.7 61 66 14 15 44 32 1.4 3 5 3.2
570 41 1,710 64 32 — — 71 78 15 19 19 14 0.7 11 24 2.2
— 46 2,970 — — — — 74 77 18 22 44 27 1.3 3 10 8.1
200 32 540 27 25 9.9 15.0 56 60 13 14 45 35 1.7 3 4 3.0
— 100 2,539 — — — — 78 84 18 22 24 17 0.8 11 25 2.6
990 19 1,091 53 48 1.9 3.4 65 69 14 15 40 27 1.3 3 8 5.0
860 57 64,364 — — — — 68 78 14 18 22 18 0.8 8 23 2.8
— 45 1,380 15 14 0.1 0.1 55 58 13 13 47 38 1.9 3 3 2.9
440 20 — 4 2 2.0 2.9 56 58 13 14 42 32 1.7 3 5 3.0
916 34 438 38 32 3.4 5.5 64 67 14 15 45 36 1.9 3 5 3.6
820 24 639 42 36 4.5 7.3 62 64 13 14 48 36 1.6 3 4 3.0
920 44 465 49 45 8.8 14.3 59 64 14 15 45 36 2.0 2 4 4.5
MENT DATA AND ESTIMATES FOR THE COUNTRIES, TERRITORIES, AND REGIONS OF THE WORLD
Kyrgyzstan 6.1 26 6 2.1 -1 7.0 8.1 17 3.1 3,620 34 479 42 40 0.3 0
Tajikistan 9.1 33 5 2.7 -2 10.7 12.9 27 3.8 3,670 27 1,241 29 27 0.4 0
Turkmenistan 5.9 26 7 1.9 -1 7.0 8.8 44 3.2 17,320 52 303 50 47 —
Uzbekistan 32.9 22 5 1.7 -1 38.7 46.5 11 2.5 7,130 51 748 65 62 0.3 0
SOUTH ASIA 1,909 21 6 1.5 -1 2,155 2,407 37 2.4 7,163 36 865 53 46 0.2 0
Afghanistan 36.5 35 7 2.8 -0 48.5 68.9 57 4.8 2,000 25 470 23 20 —
Bangladesh 166.4 19 5 1.4 -3 185.6 201.9 28 2.1 4,040 37 2,143 62 54 0.1 0
Bhutan 0.8 18 6 1.2 1 0.9 1.0 26 2.1 8,850 39 815 66 65 —
India 1,371.3 20 6 1.4 -0 1,532.3 1,680.1 34 2.3 7,060 34 876 54 48 0.2 0
Iran 81.6 19 5 1.4 -3 88.4 93.1 5 2.0 21,010 74 555 77 57 0.2 0
Maldives 0.4 20 3 1.7 6 0.5 0.6 8 2.4 15,350 39 10,978 35 27 —
Nepal 29.7 20 6 1.4 -2 32.5 33.3 32 2.3 2,710 20 1,406 53 43 0.2 0
Pakistan 200.6 26 7 1.9 -4 244.0 306.6 66 3.1 5,830 37 659 35 26 0.2 0
Sri Lanka 21.7 16 6 0.9 -4 22.2 21.5 7 2.1 12,470 19 1,668 62 51 0.1 0
SOUTHEAST ASIA 650 18 7 1.1 -0 720 786 22 2.3 12,141 48 926 62 56 0.5 0
Brunei 0.4 16 4 1.2 1 0.5 0.5 6 1.9 83,760 78 8,682 — — —
Cambodia 16.0 23 6 1.7 -2 18.8 22.0 24 2.6 3,760 23 421 56 39 0.5 0
Indonesia 265.2 19 7 1.2 -1 293.9 319.7 22 2.4 11,900 54 1,129 61 59 0.5 0
Laos 7.0 24 7 1.7 -3 8.0 9.2 42 2.7 6,650 35 456 50 43 0.3 0
Malaysia 32.5 16 5 1.1 2 36.8 41.7 7 1.9 28,650 75 3,404 52 34 0.7 0
Myanmar 53.9 18 8 1.0 -1 58.9 62.4 52 2.3 5,830 29 495 52 51 0.9 0
Philippines 107.0 21 6 1.5 -1 126.0 152.0 21 2.7 10,030 47 1,914 54 40 0.2 0
Singapore 5.8 9 5 0.4 11 6.1 6.0 2.2 1.2 90,570 100 1,032,235 — — 0.4 0
Thailand 66.2 11 8 0.2 0 66.7 62.6 10 1.5 17,090 50 394 78 76 1.2 1
Timor-Leste 1.2 30 7 2.3 -8 1.5 1.9 30 4.2 6,330 31 798 26 24 —
Vietnam 94.7 16 7 0.9 -0 103.2 108.2 15 2.1 6,450 35 1,353 76 65 0.4 0
EAST ASIA 1,633 12 7 0.4 -0 1,655 1,558 9 1.7 19,961 62 1,274 82 80 —
China 1,393.8 12 7 0.5 -0 1,419.5 1,343.9 10 1.8 16,760 59 1,171 85 84 —
China, Hong Kong SARg 7.4 8 6 0.1 3 8.0 8.2 1.5 1.1 64,100 100 239,555 75 72 —
China, Macao SARg 0.7 10 3 0.7 6 0.8 0.8 2 1.0 96,570 100 — — — —
Japan 126.5 8 11 -0.3 1 119.1 101.8 2.0 1.4 45,470 92 3,012 40 34 0.1 0
Korea, North 25.6 14 9 0.5 -0 26.7 26.8 12 1.9 — 62 1,090 70 69 —
Korea, South 51.8 7 6 0.1 2 52.9 49.4 2.8 1.1 38,260 82 3,537 80 — —
Mongolia 3.2 24 6 1.8 0 3.8 4.6 13 2.8 11,170 68 565 55 48 0.1 0
Taiwan 23.6 9 7 0.2 0 24.0 22.7 3.9 1.2 — 78 3,986 — — —
EUROPE 746 10 11 -0.1 3 751 730 4 1.6 35,501 74 270 70 60 0.7 0
EUROPEAN UNION 512 10 10 0.0 3 518 512 4 1.6 41,207 75 477 71 65 —
NORTHERN EUROPE 105 11 9 0.2 5 111 118 4 1.8 45,710 81 545 82 81 —
Channel Islands 0.2 10 8 0.2 8 0.2 0.2 8.0 1.5 — 31 4,339 — — —
Denmark 5.8 11 9 0.2 4 6.1 6.4 3.8 1.8 51,560 88 246 — — 0.2 0
Estonia 1.3 10 12 -0.1 4 1.2 1.1 2.4 1.6 31,000 69 197 63 58 0.9 0
Finland 5.5 9 10 -0.1 3 5.8 5.9 2.0 1.5 45,730 71 246 86 82 —
Iceland 0.4 12 7 0.5 24 0.4 0.4 2.7 1.7 53,640 94 292 — — —
Ireland 4.9 13 6 0.7 4 5.5 6.8 2.8 1.8 62,440 63 472 65 61 0.3 0
Latvia 1.9 11 15 -0.4 -8 1.7 1.5 4.1 1.7 27,400 68 156 — — —
Lithuania 2.8 10 14 -0.4 -10 2.7 2.4 4.5 1.6 31,030 67 128 63 50 0.2 0
Norway 5.3 11 8 0.3 4 5.9 6.7 2.3 1.6 63,530 81 660 88f 82f 0.2 0
Sweden 10.2 11 9 0.2 10 11.2 12.0 2.5 1.8 50,840 87 395 — — —
United Kingdom 66.4 12 9 0.3 6 70.4 74.7 3.9 1.8 43,160 83 1,105 84 84 —
WESTERN EUROPE 195 10 10 0.0 4 201 203 3 1.7 49,652 80 573 72 70 0.4 0
Austria 8.8 10 9 0.0 5 9.3 9.7 2.9 1.5 52,660 58 657 66 63 0.2 0
Belgium 11.4 10 10 0.1 4 12.0 12.7 3.3 1.6 47,960 98 1,375 67 66 —
France 65.1 11 9 0.2 1 68.5 72.3 3.6 1.9 43,720 80 352 78 73 0.6 0
Germany 82.8 9 11 -0.2 6 82.9 79.1 3.3 1.6 51,760 77 699 69f 69f 0.2 0
Liechtenstein 0.04 10 7 0.3 5 0.04 0.04 4.2 1.6 — 14 1,771 — — —
Luxembourg 0.6 10 7 0.3 18 0.7 0.8 3.3 1.4 72,640 91 968 — — 0.4 0
Monaco 0.04 7 6 0.1 20 0.04 0.05 — 1.5 — 100 — — — —
Netherlands 17.2 10 9 0.1 5 17.9 18.4 3.5 1.6 52,640 92 1,668 73 70 0.3 0
Switzerland 8.5 10 8 0.2 6 9.5 10.3 3.5 1.5 65,910 85 2,138 73 69 —
EASTERN EUROPE 293 11 12 -0.2 1 286 265 5 1.5 23,046 69 150 66 52 1.0 0
POPULATION, HEALTH, AND ENVIRONMENT DATA AND ESTIMATES FOR THE COUNTRIES, TERRITORIES, AND REGIONS OF THE WORLD
© 2018 Population Reference Bureau	 See notes on page 18 2018 WORLD POPULATION DATA SHEET 16
WESTERN EUROPE 195 10 10 0.0 4 201 203 3 1.7 49,652 80 573 72 70 0.4 0
Austria 8.8 10 9 0.0 5 9.3 9.7 2.9 1.5 52,660 58 657 66 63 0.2 0
Belgium 11.4 10 10 0.1 4 12.0 12.7 3.3 1.6 47,960 98 1,375 67 66 —
France 65.1 11 9 0.2 1 68.5 72.3 3.6 1.9 43,720 80 352 78 73 0.6 0
Germany 82.8 9 11 -0.2 6 82.9 79.1 3.3 1.6 51,760 77 699 69f 69f 0.2 0
Liechtenstein 0.04 10 7 0.3 5 0.04 0.04 4.2 1.6 — 14 1,771 — — — —
Luxembourg 0.6 10 7 0.3 18 0.7 0.8 3.3 1.4 72,640 91 968 — — 0.4 0
Monaco 0.04 7 6 0.1 20 0.04 0.05 — 1.5 — 100 — — — —
Netherlands 17.2 10 9 0.1 5 17.9 18.4 3.5 1.6 52,640 92 1,668 73 70 0.3 0
Switzerland 8.5 10 8 0.2 6 9.5 10.3 3.5 1.5 65,910 85 2,138 73 69 —
EASTERN EUROPE 293 11 12 -0.2 1 286 265 5 1.5 23,046 69 150 66 52 1.0 0
Belarus 9.5 11 13 -0.2 0 9.5 9.5 3.2 1.5 18,140 78 167 63 52 0.5 0
Bulgaria 7.0 9 16 -0.7 -1 6.6 5.8 6.4 1.6 20,500 73 200 69 40 0.1 0
Czechia 10.6 11 11 0.0 3 10.7 10.5 2.7 1.7 35,010 74 339 86f 78f 0.1 0
Hungary 9.8 9 14 -0.4 1 9.6 9.2 3.6 1.5 27,220 71 221 62 54 0.1 0
Moldova 3.5 11 11 0.0 0 3.4 2.9 9 1.3 6,060 43 195 60 42 0.7 0
Poland 38.4 11 11 0.0 0 37.2 34.0 4.0 1.4 28,170 60 353 51 41 —
Romania 19.5 10 13 -0.4 -2 17.9 15.1 7.1 1.4 25,150 54 222 70 51 0.2 0
Russia 147.3 12 12 -0.1 2 146.1 137.9 5.5 1.6 24,893 74 120 68 55 1.4 0
Slovakia 5.4 11 10 0.1 1 5.4 5.0 4.5 1.5 31,360 54 394 — — 0.1 0
Ukraine 42.3 9 14 -0.5 0 39.6 35.0 7.7 1.3 8,900 70 130 65 48 1.0 0
SOUTHERN EUROPE 153 8 10 -0.2 2 153 144 3 1.4 34,394 71 546 67 54 0.4 0
Albania 2.9 11 8 0.3 -5 2.8 2.5 8.0 1.6 12,120 60 466 69 11 0.1 0
Andorra 0.08 8 4 0.4 21 0.08 0.08 3.4 1.1 — 88 10,025 — — —
Bosnia-Herzegovina 3.5 9 10 -0.2 0 3.7 3.1 6 1.3 12,880 48 340 46 12 —
Croatia 4.1 9 12 -0.3 -5 3.9 3.5 4.3 1.4 24,700 57 488 — — —
Greece 10.6 9 11 -0.2 -4 10.8 10.0 4.2 1.3 27,820 79 477 76f 46f 0.3 0
Italy 60.6 8 11 -0.3 3 60.1 57.6 2.9 1.3 40,030 70 917 65 52 0.3 0
Kosovoh 1.8 13 5 0.8 0 1.8 1.7 9 1.7 11,050 38 — — — —
Macedoniai 2.1 11 10 0.1 1 2.1 1.9 9 1.4 14,590 58 500 40 13 0.1 0
Malta 0.5 10 7 0.3 19 0.5 0.5 7.4 1.4 36,740 95 5,188 — — —
Montenegro 0.6 12 11 0.1 -1 0.6 0.7 2.3 1.8 19,150 67 7,153 23 15 0.1 0
Portugal 10.3 8 11 -0.2 0 10.0 9.2 2.6 1.4 31,490 65 908 74 67 0.8 0
San Marino 0.03 7 8 -0.2 5 0.04 0.04 3.8 1.0 — 97 3,336 — — —
Serbia 7.0 9 14 -0.5 3 8.1 6.7 5.4 1.5 14,040 60 271 58 18 0.1 0
Slovenia 2.1 10 10 0.0 1 2.1 1.9 1.8 1.6 33,910 55 1,123 — — 0.1 
Spain 46.7 8 9 -0.1 4 45.9 44.3 2.8 1.3 38,090 80 379 71f 70f 0.6 0
OCEANIA 41 17 7 1.0 7 50 64 21 2.3 33,668 67 86 57 53 0.3 0
Australia 24.1 13 7 0.6 10 30.1 37.6 3.4 1.7 45,780 86 52 67 65 0.2 
Federated States of Micronesia 0.1 22 6 1.6 -13 0.1 0.1 32 3.0 4,210 23 5,288 — — —
Fiji 0.9 18 7 1.1 -5 0.9 1.0 14 2.3 9,090 56 539 — — —
French Polynesia 0.3 14 5 0.9 -5 0.3 0.3 7.5 1.8 — 62 11,079 — — —
Guam 0.2 21 6 1.5 -11 0.2 0.2 13.1 3.2 — 95 16,467 67f 58f —
Kiribati 0.1 29 7 2.2 -4 0.1 0.2 44 3.8 3,850 54 5,757 22 18 —
Marshall Islands 0.06 27 4 2.3 -18 0.06 0.06 22 4.1 5,560 77 2,754 45 42 —
Nauru 0.01 30 8 2.3 -11 0.01 0.01 18 3.9 17,960 100 — 36 25 —
New Caledonia 0.3 15 6 1.0 4 0.3 0.3 12 2.1 — 71 4,559 — — —
New Zealand 4.9 12 7 0.5 15 5.6 6.1 3.9 1.8 39,560 86 830 — — 0.2 0
Palau 0.02 12 10 0.2 1 0.02 0.03 17 2.0 13,950 80 1,782 33f 30f —
Papua New Guinea 8.5 29 7 2.2 -0 10.9 15.4 46 3.8 4,040 13 2,828 32 24 0.7 1
Samoa 0.2 25 4 2.0 -13 0.2 0.3 14 3.8 6,390 19 2,483 27 24 —
Solomon Islands 0.7 28 5 2.4 -4 0.8 1.1 25 3.8 2,270 24 3,421 29 24 —
Tonga 0.1 24 6 1.8 -10 0.1 0.1 19 3.6 6,050 23 554 34 28 —
Tuvalu 0.01 25 9 1.5 -12 0.01 0.01 10 3.6 5,780 62 — 31 22 —
Vanuatu 0.3 27 5 2.2 0 0.4 0.6 22 3.5 3,170 25 1,516 49 37 —
Population
(millions)
mid-2018
Births
per 1,000
Population
Deaths
per 1,000
Population
Rate of
Natural
Increase (%)
Net
Migration
Rate
Population (millions) Infant
Mortality
Ratea
Total
Fertility
Rateb
GNI per Capita,
PPP 2017c
Percent
Urban
Population
per km2 of
Arable Land
Married Women 15-49
Using Contraceptiond (%) Ages 15-49 With HIV/AID
mid-2030 mid-2050 All Methods Modern Methods Males 2017 Female
WORLD 7,621 19 7 1.2 0 8,571 9,852 31 2.4 16,927 55 535 62 56 — —
MORE DEVELOPED 1,266 10 10 0.0 3 1,301 1,312 5 1.6 43,409 79 242 68 59 — —
LESS DEVELOPED 6,355 21 7 1.4 -1 7,270 8,540 34 2.6 11,445 50 704 61 55 — —
LESS DEVELOPED (Excl. China) 4,953 23 7 1.7 -1 5,841 7,187 37 2.8 9,840 48 632 54 47 0.9 1
LEAST DEVELOPED 1,027 33 8 2.5 -1 1,342 1,954 49 4.2 2,723 33 585 37 33 1.5 2
AFRICA 1,284 35 9 2.6 -1 1,714 2,586 50 4.6 4,965 43 546 36 32 2.7 4
NORTHERN AFRICA 235 26 6 2.0 -1 289 385 24 3.3 10,557 52 548 52 47 0.1 0
Algeria 42.7 26 4 2.2 -0 51.3 64.3 22 3.1 15,050 73 572 57 50 0.1 0
Egypt 97.0 27 6 2.1 -1 120.8 166.5 15 3.4 11,360 43 3,350 59 57 0.1 0
Libya 6.5 20 5 1.4 -4 7.3 8.1 22 2.3 19,940 80 376 42 20 — —
Morocco 35.2 18 5 1.2 -2 39.3 43.6 22 2.2 8,063 62 433 67 59 0.1 0
Sudan 41.7 34 8 2.7 -2 56.8 88.1 45 4.7 4,482 36 210 12 12 0.2 0
Tunisia 11.6 19 6 1.4 -0 12.7 13.8 15 2.3 11,490 68 399 63 51 0.1 0
Western Sahara 0.6 20 5 1.5 7 0.7 0.9 30 2.3 — 87 14,150 — — — —
SUB-SAHARAN AFRICA 1,049 37 9 2.7 -0 1,425 2,200 54 4.9 3,683 40 546 33 28 3.3 5
WESTERN AFRICA 382 38 11 2.7 -1 518 809 62 5.3 4,174 46 445 24 18 1.8 2
Benin 11.5 37 9 2.8 -0 15.6 23.9 63 5.0 2,260 45 425 18 13 0.7 1
Burkina Faso 20.3 40 9 3.1 -1 28.9 48.5 57 5.5 1,810 29 338 32 30 0.6 1
Cabo Verde 0.6 19 5 1.4 -3 0.6 0.6 21 2.2 6,570 66 1,101 61 57 0.5 0
Côte d’Ivoire 24.9 35 12 2.3 0 33.3 51.4 62 4.6 3,820 51 859 24 19 1.9 3
Gambia 2.2 39 8 3.1 -1 3.1 5.0 46 5.4 1,670 61 494 9 8 1.4 1
Ghana 29.5 30 8 2.2 -1 37.3 51.3 37 3.9 4,490 56 627 33 27 1.0 2
Guinea 11.9 39 11 2.8 -2 16.3 25.3 68 4.8 2,270 35 383 9 8 1.1 1
Guinea-Bissau 1.9 36 11 2.6 -1 2.5 3.6 73 4.6 1,700 43 636 16 14 2.6 4
Liberia 4.9 33 8 2.5 -1 6.5 9.8 50 4.2 710 51 971 31 31 1.0 1
Mali 19.4 45 10 3.5 -4 27.5 44.8 56 6.0 2,160 42 303 16 15 0.9 1
Mauritania 4.5 34 8 2.6 1 6.1 9.0 65 4.6 3,900 54 1,009 18 16 0.4 0
Niger 22.2 48 10 3.8 -0 34.0 63.1 60 7.2 990 16 132 19 18 0.3 0
Nigeria 195.9 39 12 2.6 -0 264.1 410.6 67 5.5 5,680 50 576 24 16 2.5 3
Senegal 16.3 33 6 2.7 -1 22.1 34.0 42 4.6 2,620 46 509 28 26 0.3 0
Sierra Leone 7.7 33 13 2.0 -1 9.7 13.0 84 4.2 1,480 41 487 17 16 1.1 1
Togo 8.0 34 9 2.5 -0 10.5 15.3 52 4.5 1,620 42 302 20 17 1.5 2
EASTERN AFRICA 432 36 8 2.8 -1 584 883 45 4.7 2,192 28 651 41 38 3.4 5
Burundi 11.8 41 11 3.0 -0 17.2 30.4 47 5.5 770 13 987 29 23 0.8 1
Comoros 0.8 33 7 2.5 -2 1.1 1.5 55 4.3 1,570 29 1,281 19 14 0.1 0
Djibouti 1.0 23 8 1.5 1 1.1 1.3 52 2.9 — 78 48,550 19 18 1.1 1
Eritrea 6.0 30 7 2.3 -15 6.8 8.9 46 4.1 1,500 40 865 8 7 0.4 0
Ethiopia 107.5 33 7 2.6 -0 139.6 190.9 40 4.4 1,890 20 711 37 35 0.7 1
Kenya 51.0 31 6 2.6 -0 67.0 95.5 36 3.9 3,250 32 878 62 60 3.5 6
Madagascar 26.3 32 6 2.6 -0 35.6 53.8 32 4.1 1,510 37 750 40 33 0.4 0
Malawi 19.1 34 7 2.6 -1 25.6 37.4 42 4.2 1,180 17 502 59 58 7.4 11
Mauritius 1.3 11 8 0.3 -1 1.3 1.2 11.8 1.4 22,570 41 1,710 64 32 — —
Mayotte 0.3 39 3 3.6 -0 0.4 0.6 4 5.1 — 46 2,970 — — — —
Mozambique 30.5 39 10 2.9 -0 42.4 67.8 65 5.3 1,200 32 540 27 25 9.9 15
Réunion 0.9 16 6 1.0 -4 0.9 1.0 7 2.4 — 100 2,539 — — — —
Rwanda 12.6 32 6 2.6 -1 16.6 24.3 32 4.2 1,990 19 1,091 53 48 1.9 3
Seychelles 0.1 17 8 1.0 -3 0.1 0.1 13.4 2.4 26,860 57 64,364 — — — —
Somalia 15.2 43 11 3.2 -3 21.5 35.9 72 6.3 — 45 1,380 15 14 0.1 0
South Sudan 13.0 37 11 2.6 4 17.9 27.9 69 5.0 1,440 20 — 4 2 2.0 2
Tanzania 59.1 39 7 3.3 -1 83.7 138.1 43 5.2 2,916 34 438 38 32 3.4 5
Uganda 44.1 41 9 3.2 -1 61.6 95.6 43 5.4 1,820 24 639 42 36 4.5 7
Zambia 17.7 39 8 3.1 -0 25.8 45.1 49 5.2 3,920 44 465 49 45 8.8 14
POPULATION, HEALTH, AND ENVIRONMENT DATA AND ESTIMATES FOR THE COUNTRIESPOPULATION, HEALTH, AND ENVIRONMENT DATA AND ESTIMATES FOR THE COUNTRIES, TERRITORIES, AND REGIONS OF THE WORLD
© 2018 Population Reference Bureau	 See notes on page 18 2018 WORLD POPULATION DATA SHEET 17
52 80 573 72 70 0.4 0.1 79 84 19 22 15 15 1.0 20 29 1.5
660 58 657 66 63 0.2 0.1 79 84 19 22 14 13 1.0 19 31 1.8
960 98 1,375 67 66 — — 79 84 18 22 17 16 1.1 19 27 1.6
720 80 352 78 73 0.6 0.3 80 85 20 23 18 17 1.0 20 27 1.5
760 77 699 69f 69f 0.2 0.1 78 83 18 21 13 13 0.9 21 31 1.4
— 14 1,771 — — — — 81 84 — — 15 — — 17 — —
640 91 968 — — 0.4 0.1 80 84 19 22 16 16 1.3 14 23 2.2
— 100 — — — — — — — — — 13 — — 26 — —
640 92 1,668 73 70 0.3 0.1 80 83 19 21 16 15 1.0 18 28 1.6
910 85 2,138 73 69 — — 82 85 20 23 15 14 1.1 18 29 1.9
46 69 150 66 52 1.0 0.7 69 78 14 18 17 16 0.8 16 25 1.4
140 78 167 63 52 0.5 0.4 69 79 13 18 17 17 1.0 15 24 1.6
500 73 200 69 40 0.1 0.1 71 78 14 18 14 14 0.8 21 29 1.1
010 74 339 86f 78f 0.1 0.1 76 82 16 20 16 15 0.9 19 30 1.5
220 71 221 62 54 0.1 0.1 72 79 15 19 15 14 0.9 19 28 1.4
060 43 195 60 42 0.7 0.4 68 76 12 16 16 13 0.6 11 24 1.7
170 60 353 51 41 — — 74 82 16 20 15 12 0.7 17 32 1.6
150 54 222 70 51 0.2 0.1 72 79 15 18 16 14 0.7 18 28 1.2
893 74 120 68 55 1.4 0.9 68 78 13 18 18 17 0.9 14 22 1.5
360 54 394 — — 0.1 0.1 74 80 15 19 16 14 0.8 16 29 1.7
900 70 130 65 48 1.0 0.9 67 76 13 17 15 15 0.8 16 25 1.3
94 71 546 67 54 0.4 0.2 79 84 19 22 14 13 0.8 20 34 1.6
120 60 466 69 11 0.1 0.1 77 80 16 19 18 13 0.7 14 28 1.8
— 88 10,025 — — — — — — — — 14 — — 14 — —
880 48 340 46 12 — — 74 79 15 18 14 13 0.8 16 29 1.6
700 57 488 — — — — 74 80 15 19 15 13 0.8 19 30 1.3
820 79 477 76f 46f 0.3 0.1 78 84 18 21 14 12 0.8 21 35 1.6
030 70 917 65 52 0.3 0.2 81 85 20 22 13 13 0.9 23 35 1.5
050 38 — — — — — 74 79 — — 24 — — 8 — —
590 58 500 40 13 0.1 0.1 73 78 15 16 17 14 0.8 14 25 1.7
740 95 5,188 — — — — 81 84 18 20 14 13 0.9 19 29 1.5
150 67 7,153 23 15 0.1 0.1 74 79 15 18 18 15 0.9 15 26 1.9
490 65 908 74 67 0.8 0.3 78 83 18 22 14 12 0.8 21 36 1.5
— 97 3,336 — — — — 82 87 — — 15 — — 18 — —
040 60 271 58 18 0.1 0.1 73 78 14 17 14 15 1.0 19 25 1.3
910 55 1,123 — — 0.1 0.1 78 84 18 21 15 14 0.9 19 33 1.6
090 80 379 71f 70f 0.6 0.2 80 86 19 23 15 13 0.8 19 36 1.8
68 67 86 57 53 0.3 0.3 76 80 19 22 24 20 1.3 12 18 2.3
780 86 52 67 65 0.2 0.1 80 85 20 22 19 17 1.4 16 22 2.2
210 23 5,288 — — — — 68 70 13 14 34 23 0.7 5 7 1.7
090 56 539 — — — — 67 73 12 16 29 21 0.8 6 14 2.7
— 62 11,079 — — — — 74 78 16 18 24 16 0.8 8 21 3.2
— 95 16,467 67f 58f — — 76 82 17 20 25 18 0.9 9 19 2.7
850 54 5,757 22 18 — — 63 70 12 14 35 28 1.4 4 8 3.5
560 77 2,754 45 42 — — 71 73 — — 41 — — 3 — —
960 100 — 36 25 — — 58 65 — — 37 — — 13 — —
— 71 4,559 — — — — 74 80 15 19 23 18 0.9 9 18 2.5
560 86 830 — — 0.2 0.1 80 83 19 22 19 16 1.1 15 24 2.0
950 80 1,782 33f 30f — — 70 77 — — 21 — — 7 — —
040 13 2,828 32 24 0.7 1.0 63 68 12 15 36 27 1.4 4 7 3.5
390 19 2,483 27 24 — — 74 76 14 19 38 28 1.0 5 11 3.0
270 24 3,421 29 24 — — 70 73 13 15 39 28 1.2 4 8 3.9
050 23 554 34 28 — — 70 76 13 18 36 28 1.0 6 10 2.1
780 62 — 31 22 — — 67 72 — — 33 — — 5 — —
170 25 1,516 49 37 — — 70 74 14 16 36 27 1.4 4 10 4.2
Capita,
017c
Percent
Urban
Population
per km2 of
Arable Land
Married Women 15-49
Using Contraceptiond (%) Ages 15-49 With HIV/AIDS (%) Life Expectancy at Birth (Years) Life Expectancy at Age 65 (Years) Population Ages 15 Population Ages 65+
All Methods Modern Methods Males 2017 Females 2017 Males Females Males Females 2018 (%) 2050 (%)
2050 as a
Multiple of 2018e 2018 (%) 2050 (%)
2050 as a
Multiple of 2018e
27 55 535 62 56 — — 70 74 16 18 26 21 1.1 9 16 2.3
409 79 242 68 59 — — 76 82 18 21 16 16 1.0 18 27 1.5
445 50 704 61 55 — — 69 73 15 17 28 22 1.1 7 14 2.8
840 48 632 54 47 0.9 1.3 67 71 15 17 31 24 1.1 6 12 3.0
723 33 585 37 33 1.5 2.3 63 66 14 15 40 31 1.5 4 7 3.5
65 43 546 36 32 2.7 4.3 61 64 13 15 41 32 1.6 3 6 3.4
57 52 548 52 47 0.1 0.1 71 74 15 16 32 25 1.2 5 12 3.8
050 73 572 57 50 0.1 0.1 77 78 18 19 29 20 1.0 6 17 4.3
360 43 3,350 59 57 0.1 0.1 71 74 13 15 34 25 1.3 4 11 4.7
940 80 376 42 20 — — 69 75 13 16 28 18 0.8 4 17 4.6
063 62 433 67 59 0.1 0.1 75 78 15 17 24 19 0.9 8 18 2.7
482 36 210 12 12 0.2 0.2 63 66 14 15 41 31 1.6 4 6 3.4
490 68 399 63 51 0.1 0.1 75 78 15 18 24 18 0.9 8 20 2.9
— 87 14,150 — — — — 68 72 13 15 28 20 1.1 3 12 6.8
683 40 546 33 28 3.3 5.2 59 62 13 14 43 33 1.6 3 5 3.3
74 46 445 24 18 1.8 2.4 56 58 11 12 44 35 1.7 3 4 3.2
260 45 425 18 13 0.7 1.3 59 62 13 14 43 34 1.6 3 5 3.1
810 29 338 32 30 0.6 1.0 60 61 12 12 47 35 1.8 3 4 3.4
570 66 1,101 61 57 0.5 0.7 71 75 14 16 31 19 0.7 4 12 3.2
820 51 859 24 19 1.9 3.7 52 55 11 12 43 35 1.7 3 4 2.8
670 61 494 9 8 1.4 1.9 60 63 12 13 46 33 1.7 2 4 4.0
490 56 627 33 27 1.0 2.3 62 64 12 13 39 30 1.3 3 6 3.3
270 35 383 9 8 1.1 1.9 58 61 12 12 45 33 1.5 4 5 2.7
700 43 636 16 14 2.6 4.1 56 59 12 12 42 32 1.4 3 5 3.3
710 51 971 31 31 1.0 1.8 62 64 12 13 42 32 1.6 3 5 3.6
160 42 303 16 15 0.9 1.6 58 62 12 12 47 36 1.8 2 4 3.8
900 54 1,009 18 16 0.4 0.3 62 65 12 13 40 32 1.6 3 6 3.6
990 16 132 19 18 0.3 0.3 59 61 12 13 50 43 2.4 3 3 2.9
680 50 576 24 16 2.5 3.0 53 54 11 11 44 35 1.7 3 4 3.1
620 46 509 28 26 0.3 0.6 65 69 13 14 43 33 1.6 3 5 3.8
480 41 487 17 16 1.1 1.6 51 52 10 10 42 29 1.2 3 5 3.1
620 42 302 20 17 1.5 2.7 59 61 12 12 42 32 1.5 3 5 3.5
92 28 651 41 38 3.4 5.6 62 66 14 15 43 32 1.5 3 5 3.5
770 13 987 29 23 0.8 1.4 59 62 13 14 46 36 2.1 2 4 4.2
570 29 1,281 19 14 0.1 0.1 62 65 12 14 40 30 1.3 3 6 3.5
— 78 48,550 19 18 1.1 1.5 61 64 14 15 32 21 0.9 4 10 3.3
500 40 865 8 7 0.4 0.7 62 68 13 14 41 30 1.1 4 6 2.3
890 20 711 37 35 0.7 1.2 64 67 14 15 41 26 1.1 4 7 3.3
250 32 878 62 60 3.5 6.2 65 69 14 16 41 29 1.3 3 7 5.1
510 37 750 40 33 0.4 0.2 64 68 13 14 41 32 1.6 3 6 4.0
180 17 502 59 58 7.4 11.7 61 66 14 15 44 32 1.4 3 5 3.2
570 41 1,710 64 32 — — 71 78 15 19 19 14 0.7 11 24 2.2
— 46 2,970 — — — — 74 77 18 22 44 27 1.3 3 10 8.1
200 32 540 27 25 9.9 15.0 56 60 13 14 45 35 1.7 3 4 3.0
— 100 2,539 — — — — 78 84 18 22 24 17 0.8 11 25 2.6
990 19 1,091 53 48 1.9 3.4 65 69 14 15 40 27 1.3 3 8 5.0
860 57 64,364 — — — — 68 78 14 18 22 18 0.8 8 23 2.8
— 45 1,380 15 14 0.1 0.1 55 58 13 13 47 38 1.9 3 3 2.9
440 20 — 4 2 2.0 2.9 56 58 13 14 42 32 1.7 3 5 3.0
916 34 438 38 32 3.4 5.5 64 67 14 15 45 36 1.9 3 5 3.6
820 24 639 42 36 4.5 7.3 62 64 13 14 48 36 1.6 3 4 3.0
920 44 465 49 45 8.8 14.3 59 64 14 15 45 36 2.0 2 4 4.5
MENT DATA AND ESTIMATES FOR THE COUNTRIES, TERRITORIES, AND REGIONS OF THE WORLD
WESTERN EUROPE 195 10 10 0.0 4 201 203 3 1.7 49,652 80 573 72 70 0.4 0
Austria 8.8 10 9 0.0 5 9.3 9.7 2.9 1.5 52,660 58 657 66 63 0.2 0
Belgium 11.4 10 10 0.1 4 12.0 12.7 3.3 1.6 47,960 98 1,375 67 66 —
France 65.1 11 9 0.2 1 68.5 72.3 3.6 1.9 43,720 80 352 78 73 0.6 0
Germany 82.8 9 11 -0.2 6 82.9 79.1 3.3 1.6 51,760 77 699 69f 69f 0.2 0
Liechtenstein 0.04 10 7 0.3 5 0.04 0.04 4.2 1.6 — 14 1,771 — — —
Luxembourg 0.6 10 7 0.3 18 0.7 0.8 3.3 1.4 72,640 91 968 — — 0.4 0
Monaco 0.04 7 6 0.1 20 0.04 0.05 — 1.5 — 100 — — — —
Netherlands 17.2 10 9 0.1 5 17.9 18.4 3.5 1.6 52,640 92 1,668 73 70 0.3 0
Switzerland 8.5 10 8 0.2 6 9.5 10.3 3.5 1.5 65,910 85 2,138 73 69 —
EASTERN EUROPE 293 11 12 -0.2 1 286 265 5 1.5 23,046 69 150 66 52 1.0 0
Belarus 9.5 11 13 -0.2 0 9.5 9.5 3.2 1.5 18,140 78 167 63 52 0.5 0
Bulgaria 7.0 9 16 -0.7 -1 6.6 5.8 6.4 1.6 20,500 73 200 69 40 0.1 0
Czechia 10.6 11 11 0.0 3 10.7 10.5 2.7 1.7 35,010 74 339 86f 78f 0.1 0
Hungary 9.8 9 14 -0.4 1 9.6 9.2 3.6 1.5 27,220 71 221 62 54 0.1 0
Moldova 3.5 11 11 0.0 0 3.4 2.9 9 1.3 6,060 43 195 60 42 0.7 0
Poland 38.4 11 11 0.0 0 37.2 34.0 4.0 1.4 28,170 60 353 51 41 —
Romania 19.5 10 13 -0.4 -2 17.9 15.1 7.1 1.4 25,150 54 222 70 51 0.2 0
Russia 147.3 12 12 -0.1 2 146.1 137.9 5.5 1.6 24,893 74 120 68 55 1.4 0
Slovakia 5.4 11 10 0.1 1 5.4 5.0 4.5 1.5 31,360 54 394 — — 0.1 0
Ukraine 42.3 9 14 -0.5 0 39.6 35.0 7.7 1.3 8,900 70 130 65 48 1.0 0
SOUTHERN EUROPE 153 8 10 -0.2 2 153 144 3 1.4 34,394 71 546 67 54 0.4 0
Albania 2.9 11 8 0.3 -5 2.8 2.5 8.0 1.6 12,120 60 466 69 11 0.1 0
Andorra 0.08 8 4 0.4 21 0.08 0.08 3.4 1.1 — 88 10,025 — — —
Bosnia-Herzegovina 3.5 9 10 -0.2 0 3.7 3.1 6 1.3 12,880 48 340 46 12 —
Croatia 4.1 9 12 -0.3 -5 3.9 3.5 4.3 1.4 24,700 57 488 — — —
Greece 10.6 9 11 -0.2 -4 10.8 10.0 4.2 1.3 27,820 79 477 76f 46f 0.3 0
Italy 60.6 8 11 -0.3 3 60.1 57.6 2.9 1.3 40,030 70 917 65 52 0.3 0
Kosovoh 1.8 13 5 0.8 0 1.8 1.7 9 1.7 11,050 38 — — — —
Macedoniai 2.1 11 10 0.1 1 2.1 1.9 9 1.4 14,590 58 500 40 13 0.1 0
Malta 0.5 10 7 0.3 19 0.5 0.5 7.4 1.4 36,740 95 5,188 — — —
Montenegro 0.6 12 11 0.1 -1 0.6 0.7 2.3 1.8 19,150 67 7,153 23 15 0.1 0
Portugal 10.3 8 11 -0.2 0 10.0 9.2 2.6 1.4 31,490 65 908 74 67 0.8 0
San Marino 0.03 7 8 -0.2 5 0.04 0.04 3.8 1.0 — 97 3,336 — — —
Serbia 7.0 9 14 -0.5 3 8.1 6.7 5.4 1.5 14,040 60 271 58 18 0.1 0
Slovenia 2.1 10 10 0.0 1 2.1 1.9 1.8 1.6 33,910 55 1,123 — — 0.1 
Spain 46.7 8 9 -0.1 4 45.9 44.3 2.8 1.3 38,090 80 379 71f 70f 0.6 0
OCEANIA 41 17 7 1.0 7 50 64 21 2.3 33,668 67 86 57 53 0.3 0
Australia 24.1 13 7 0.6 10 30.1 37.6 3.4 1.7 45,780 86 52 67 65 0.2 
Federated States of Micronesia 0.1 22 6 1.6 -13 0.1 0.1 32 3.0 4,210 23 5,288 — — —
Fiji 0.9 18 7 1.1 -5 0.9 1.0 14 2.3 9,090 56 539 — — —
French Polynesia 0.3 14 5 0.9 -5 0.3 0.3 7.5 1.8 — 62 11,079 — — —
Guam 0.2 21 6 1.5 -11 0.2 0.2 13.1 3.2 — 95 16,467 67f 58f —
Kiribati 0.1 29 7 2.2 -4 0.1 0.2 44 3.8 3,850 54 5,757 22 18 —
Marshall Islands 0.06 27 4 2.3 -18 0.06 0.06 22 4.1 5,560 77 2,754 45 42 —
Nauru 0.01 30 8 2.3 -11 0.01 0.01 18 3.9 17,960 100 — 36 25 —
New Caledonia 0.3 15 6 1.0 4 0.3 0.3 12 2.1 — 71 4,559 — — —
New Zealand 4.9 12 7 0.5 15 5.6 6.1 3.9 1.8 39,560 86 830 — — 0.2 0
Palau 0.02 12 10 0.2 1 0.02 0.03 17 2.0 13,950 80 1,782 33f 30f —
Papua New Guinea 8.5 29 7 2.2 -0 10.9 15.4 46 3.8 4,040 13 2,828 32 24 0.7 1
Samoa 0.2 25 4 2.0 -13 0.2 0.3 14 3.8 6,390 19 2,483 27 24 —
Solomon Islands 0.7 28 5 2.4 -4 0.8 1.1 25 3.8 2,270 24 3,421 29 24 —
Tonga 0.1 24 6 1.8 -10 0.1 0.1 19 3.6 6,050 23 554 34 28 —
Tuvalu 0.01 25 9 1.5 -12 0.01 0.01 10 3.6 5,780 62 — 31 22 —
Vanuatu 0.3 27 5 2.2 0 0.4 0.6 22 3.5 3,170 25 1,516 49 37 —
POPULATION, HEALTH, AND ENVIRONMENT DATA AND ESTIMATES FOR THE COUNTRIES, TERRITORIES, AND REGIONS OF THE WORLD
© 2018 Population Reference Bureau  2018 WORLD POPULATION DATA SHEET 18
worldpopdata.orgCHANGING AGE STRUCTURES
Acknowledgments
This publication is funded by the William and Flora
Hewlett Foundation, the U.S. Agency for International
Development (USAID) (PACE Project, No. AID-
0AA-A-16-00002), and individual supporters. The
contents are the responsibility of Population Reference
Bureau and do not necessarily reflect the views of USAID
or the United States government.
Notes
The Data Sheet lists all geopolitical entities with
populations of 150,000 or more and all members of the
UN, including sovereign states, dependencies, overseas
departments, and some territories whose status or
boundaries may be undetermined or in dispute. More
developed regions, following the UN classification,
comprise all of Europe and North America, plus Australia,
Japan, and New Zealand. All other regions and countries
are classified as less developed. The least developed
countries consist of 47 countries with especially low
incomes, high economic vulnerability, and poor human
development indicators. The criteria and list of countries,
as defined by the UN, can be found at http://unohrlls.
org/about-ldcs/.
World and Regional Totals: Regional population totals
are independently rounded and include small countries
or areas not shown. Regional and world rates and
percentages are weighted averages of countries for which
data are available. Regional averages are shown when
data or estimates are available for at least three-quarters
of the region’s population.
World Population Data Sheets from different years
should not be used as a time series. Fluctuations in
values from year to year often reflect revisions based
on new data or estimates rather than actual changes
in levels.
Sources
The rates and figures are primarily compiled from
the following sources: national statistical offices’
websites, regional organizations’ websites, online
databases, statistical yearbooks, and bulletins from
various countries; demographic surveys such as the
Demographic and Health Surveys, Multiple Indicator
Cluster Surveys, and Performance and Monitoring
Accountability 2020 Surveys; the UN Demographic
Yearbook 2016 and Population and Vital Statistics Report
of the UN Statistics Division; World Population Prospects:
The 2017 Revision, World Contraceptive Use 2018, and
World Urbanization Prospects: The 2018 Revision of the
UN Population Division; the International Data Base of
the International Programs Center, U.S. Census Bureau;
World Development Indicators online database of the
World Bank; AIDSinfo online database of the UNAIDS; and
FAOSTAT online database of the Food and Agricultural
Organization of the United Nations. The sources also
include direct communication with demographers and
country experts from around the world. Specific data
sources may be obtained by contacting the authors of
the 2018 World Population Data Sheet. For countries
with complete registration of births and deaths, rates
are those most recently reported. For more developed
countries, vital rates refer to 2017 or 2016.
Definitions
MID-2018 POPULATION AND PROJECTED
POPULATION, 2030 AND 2050
Current estimates and projections are based on a recent
census, official national data, or analyses conducted by
national statistical offices, regional organizations, PRB,
UN Population Division, or International Programs of the
U.S. Census Bureau. The effects of refugee movements,
large numbers of foreign workers, and population shifts
due to current events are taken into account to the
extent possible. Projected populations are based on
reasonable assumptions on the future course of fertility,
mortality, and migration.
BIRTH AND DEATH RATE
The annual number of births and deaths per 1,000 total
population.
RATE OF NATURAL INCREASE
The birth rate minus the death rate, expressed as a
percentage. This value represents the estimated rate of
population growth without regard for migration.
NET MIGRATION RATE
The estimated net migration (immigration minus
emigration) per 1,000 population. For some countries,
data are derived as a residual from estimated birth,
death, and population growth rates.
INFANT MORTALITY RATE
The annual number of deaths of infants under age 1 per
1,000 live births. Decimals indicate national statistics
reported as completely registered; those without are
estimates from the sources cited above. Rates shown in
italics are based on fewer than 50 annual infant deaths
and, as a result, are subject to considerable yearly
variability; rates shown for such countries are estimated
from an average of the previous three years.
TOTAL FERTILITY RATE
The average number of children a woman would have
assuming that current age-specific birth rates remain
constant throughout her childbearing years (usually
considered to be ages 15 to 49).
GNI PER CAPITA PPP, 2017 ($ CURRENT
INTERNATIONAL)
GNI per capita PPP is gross national income in
purchasing power parity (PPP) divided by mid-year
population.
PERCENT URBAN
Percentage of the total population living in areas termed
“urban” by that country or by the UN.
POPULATION PER SQUARE KILOMETER OF
ARABLE LAND
The mid-year 2018 population divided by the square
kilometers of arable land.
CONTRACEPTIVE USE
The percentage of currently married or “in
union” women (unless otherwise indicated) of
reproductive age who are currently using any
form of contraception. Modern methods comprise
clinic and supply methods, including the pill,
injectable, implant, IUD, condom, and sterilization.
The inclusions of lactational amenorrhea and/or
Standard Days Method in modern methods vary
across countries. Data are from the most recently
available national-level surveys since 2000. Data prior
to 2012 are shown in italics.
AGES 15-49 WITH HIV/AIDS BY SEX, 2017
The percentage of the population ages 15 to 49 living
with HIV/AIDS.
LIFE EXPECTANCY AT BIRTH/AGE 65 BY SEX
The average number of years a newborn infant or a
65-year-old can expect to live under current mortality
rates.
POPULATION AGES 15/AGES 65+, 2018 AND 2050
The current percentage estimates and projections of the
total population in those age groups, which are often
considered the “dependent ages.”
POPULATION IN 2050 AGES 15/AGES 65+ AS A
MULTIPLE OF 2018 POPULATION
A ratio of the projected 2050 population ages 15 or ages
65+ over the 2018 population for corresponding ages.
For example, a ratio of 2 for those ages 15 indicates that
the 2050 population for that age group is projected to
be twice the size of its 2018 population. This indicator
was calculated using unrounded numbers. Thus, the
numbers may not match the calculation using the
rounded population size and percent that appear on the
data sheet.
For additional notes, see the reverse side.
Data prepared by PRB demographers Toshiko Kaneda,
Charlotte Greenbaum, and Kaitlyn Patierno.
© August 2018. Population Reference Bureau.
All rights reserved. ISSN 0085-8315
Cover photo: Seng Kit Loy / EyeEm.
Notes
A date range indicates the most recent data
point during that time period.
(—) Indicates data unavailable or inapplicable.
a Infant deaths per 1,000 live births. Rates shown with
decimals indicate national statistics reported as
completely registered, while those with no decimal
are estimates from the sources cited on the reverse.
Rates shown in italics are based on fewer than
50 annual infant deaths, so the figure is estimated
from an average of the previous three years.
b Average number of children born to
a woman during her lifetime.
c In current international dollars. Data prior to 2017
are shown in italics.
d Data prior to 2012 are shown in italics.
e This indicator is the 2050 population ages 15
or ages 65+ divided by the 2018 population for
corresponding ages using unrounded numbers.
The indicator value may therefore not match a
hand calculation using the rounded population
size and percent that appear on the data sheet.
f Data refer to sexually active women, ever-married
women, or all women.
g Special Administrative Region.
h Kosovo declared independence from Serbia
on Feb. 17, 2008. Serbia has not recognized
Kosovo’s independence.
i The former Yugoslav Republic.
PRB’s 2018 World Population
Data Sheet is available in English
and French at worldpopdata.org.
Also online, find a customized
digital data sheet with an interactive
map, chart, and table tool.
To order PRB publications
(discounts available for bulk orders):
•	 Online at www.prb.org
•	 E-mail: popref@prb.org
•	 Call toll-free: 800-877-9881
•	 Fax: 202-328-3937
•	 Mail: 1875 Connecticut Ave., NW,
Suite 520, Washington, DC 20009.
PRB.ORG
1875 Connecticut Avenue, NW, Suite 520
Washington, D.C. 20009 USA
800-877-9881
popref@prb.org
Stay connected
with PRB
@prbdata
CORE THEMES
CHILDREN
 FAMILIES
AGING HEALTH
 NUTRITION
POPULATION
CHANGE
PEOPLE, HEALTH,
PLANET
INEQUALITY
 POVERTY
FAMILY PLANNING 
REPRODUCTIVE HEALTH
YOUTHGENDER
The Population Reference Bureau informs people around the world about population, health, and the environment,
and empowers them to use that information to advance the well-being of current and future generations.
U.S. CENSUS  THE AMERICAN
COMMUNITY SURVEY
Please support us. The World Population Data Sheet reaches tens of thousands of people worldwide who count on it
for essential data and insights. Please help PRB maintain its commitment to this and other public information
products by visiting prb.org and clicking on the “Donate” button at the top right side of the page.
View our interactive Annual Report to learn more about PRB’s activities and impact at prb.org/annualreport

Datos de La población mundial 2018. (Population Reference Bureau) 2018 world-population-data-sheet eng

  • 1.
    2018 WORLD POPULATION DATA SHEET With aSpecial Focus on Changing Age Structures worldpopdata.org INFORM | EMPOWER | ADVANCE | prb.org Projected share of world population ages <15 in 2050, vs. 26% in 2018.21% The world population in 2018. 7.6BILLION Projected share of world population ages 65+ in 2050, vs. 9% in 2018.16% POPULATION REFERENCE BUREAU
  • 2.
    © 2018 PopulationReference Bureau 2018 WORLD POPULATION DATA SHEET 1 worldpopdata.orgCHANGING AGE STRUCTURES Most Populous Countries (Millions) 2018 CHINA INDIA UNITED STATES INDONESIA BRAZIL PAKISTAN NIGERIA BANGLADESH RUSSIA MEXICO 1,394 1,371 328 265 209 201 196 166 147 131 2050 INDIA CHINA NIGERIA UNITED STATES INDONESIA PAKISTAN BRAZIL CONGO, DEM. REP. BANGLADESH ETHIOPIA 1,680 1,344 411 390 320 307 231 216 202 191 Total Fertility Rates, 2018 HIGHEST NIGER CHAD CONGO, DEM. REP. SOMALIA ANGOLA MALI BURKINA FASO NIGERIA BURUNDI GAMBIA 7.2 6.4 6.3 6.3 6.2 6 5.5 5.5 5.5 5.4 LOWEST SOUTH KOREA SINGAPORE TAIWAN BOSNIA- HERZEGOVINA MOLDOVA SPAIN ITALY GREECE UKRAINE ROMANIA 1.1 1.2 1.2 1.3 1.3 1.3 1.3 1.3 1.3 1.4 Check out the digital data sheet to view interactive maps, videos, QA, and more exclusive content at worldpopdata.org.
  • 3.
    © 2018 PopulationReference Bureau 2018 WORLD POPULATION DATA SHEET 2 worldpopdata.orgCHANGING AGE STRUCTURES The World Population Is Growing Older With continued declines in fertility and mortality, the global population’s shift toward an older age structure, known as population aging, will accelerate. Older adults’ (ages 65+) share of the global population increased from 5 percent in 1960 to 9 percent in 2018 and is projected to rise to 16 percent by 2050, with the segment ages 85 and older growing the fastest. Children’s (ages 0 to 14) share is falling, from 37 percent in 1960, to 26 percent in 2018, with a projected decrease to 21 percent by 2050. The timing and speed of age structure changes vary by country, and these changes have important social and economic implications. Note: Lighter shaded areas show projected shares from 2018 through 2050. Source: United Nations Population Division, World Population Prospects: The 2017 Revision (New York: United Nations, 2017). Percent of Population by Age Group, 1960-2050 1960 1960 1970 1980 1990 2000 2010 2020 2018 2030 2040 2050 2050 What Is Age Structure? Age structure is the share of the total population in each age group. Population aging is measured by the relative share of older people in the population. Ages 0-14 Ages 15-24 Ages 25-64 Ages 65+ 26 21 37 15 14 17 41 50 49 5 9 16
  • 4.
    © 2018 PopulationReference Bureau 2018 WORLD POPULATION DATA SHEET 3 worldpopdata.orgCHANGING AGE STRUCTURES Each Population Age Structure Presents Different Challenges Population age structure has implications for national policy agendas and resource allocation. Countries with relatively high fertility and child dependency face challenges in investing sufficient resources in the development of young people’s human capital. If such investments are made, these countries have an opportunity to reap the economic growth benefits of a larger, better educated working-age population. Countries experiencing high old-age dependency or double dependency (relatively large shares of child and older-adult populations) face different challenges. They must address the high costs of older adults’ medical and long-term care needs while also investing in the well-being of and future opportunities for younger generations. What Is a Dependency Ratio? A dependency ratio is the number of people in a dependent age group (those under age 15 or ages 65 and older) divided by the number in the working-age group (ages 15 to 64), multiplied by 100. For instance, a child dependency ratio of 45 means there are 45 children for every 100 working-age individuals. Countries by Age Dependency Category, 2018 High Child Dependency High child dependency ratio (45) and low old-age dependency ratio (15). Moderate Child Dependency Moderate child dependency ratio (29-45) and low old-age dependency ratio (15). Double Dependency Moderate child dependency ratio (29-45) and high old-age dependency ratio (≥15). High Old-Age Dependency Low child dependency ratio (29) and high old-age dependency ratio (≥15). Low Overall Dependency Low child dependency ratio (29) and low old-age dependency ratio (15). Notes: Israel is the only country with both a high child dependency ratio (45) and a high old-age dependency ratio (≥15). It is included in the double dependency category. Source: United Nations Population Division, World Population Prospects: The 2017 Revision (New York: United Nations, 2017).
  • 5.
    © 2018 PopulationReference Bureau 2018 WORLD POPULATION DATA SHEET 4 worldpopdata.orgCHANGING AGE STRUCTURES Investing in Education Can Power Countries’ Economic Growth Upper-secondary education (that is, secondary education at advanced levels) can equip young people with the knowledge and skills they need to be competitive in the workforce, helping them to earn more and fueling continued economic growth. Secondary education also has transformative health and economic benefits for girls, including delaying age at first marriage and age at first birth. Upper secondary school enrollment is increasing in many regions but remains relatively low in many countries in the high child dependency category. Such countries, including Ethiopia and Guatemala, must invest in improved access to upper-secondary education to develop a workforce able to accelerate economic growth. HighOld-Age Dependency Upper-Secondary School Enrollment Rate by Sex (%) Belgium Argentina Bangladesh Ecuador Guatemala Ethiopia 36 28 28 68 69 25 6533 31 88 53 83 60 48 16 115 83 59 46 4 10 15 87 HighChild Dependency ModerateChild Dependency Double Dependency Males 2000 Males 2015/2016Females 2015/2016Females 2000 Note: The net upper-secondary school enrollment rate is calculated by dividing the number of students enrolled who are of the official age group for a given level of education by the population for the same age group and multiplying the result by 100. Source: United Nations Educational, Scientific, and Cultural Organization (UNESCO), Institute for Statistics, “Data for the Sustainable Development Goals,” accessed at http://uis.unesco.org/.
  • 6.
    © 2018 PopulationReference Bureau 2018 WORLD POPULATION DATA SHEET 5 worldpopdata.orgCHANGING AGE STRUCTURES Old-Age Labor Force Participation Decreases for Men in Developing Regions A country’s age structure and its socioeconomic and political contexts can influence the labor force participation rate (LFPR) of older adults. At the same time, old-age LFPR can impact countries’ policies and social support structures. Rates vary considerably by country. Overall, they tend to be higher in countries in the high and moderate child dependency categories. However, many countries in these categories, including the Philippines, show an emerging pattern of decline in older men’s LFPR. In contrast, older adults’ LFPR is generally rising in high old-age dependency category countries. This rise is driven in part by longer life expectancies and policies that provide incentives to keep older adults in the formal labor market. Older women’s LFPR is increasing in many countries around the world, spurred by social security reforms and changing cultural norms. HighChild Dependency Moderate Child Dependency Double Dependency HighOld-Age Dependency Germany Japan United States Brazil Phillippines Tanzania Labor Force Participation Rate Among Adults Ages 65 and Older by Sex (%) 2 4 32 31 24 29 35 50 78 19 13 11 14 16 16 55 13 47 72 28 28 5 9 51 Males 2000-2004 Males 2014-2017Females 2014-2017Females 2000-2004 Note: The old-age labor force participation rate is defined as the number of individuals ages 65 and older participating in the labor force—by working for pay either part-time or full-time or actively looking for work—as a percentage of the total population ages 65 and older. Source: International Labor Organization, Database of Labor Statistics; U.S. Census Bureau, International Population Reports, P95/16-1, An Aging World: 2015 (Washington, DC: U.S. Government Publishing Office, 2016); United Nations, Population Division, World Population Ageing 2015 (New York: United Nations, 2015).
  • 7.
    © 2018 PopulationReference Bureau 2018 WORLD POPULATION DATA SHEET 6 worldpopdata.orgCHANGING AGE STRUCTURES The Child Poverty Rate in the United States Has Exceeded the Rate for Older Adults Since 1974 The poverty rate is one important indicator of economic well-being that varies widely across age groups. In the mid- 1960s, 29 percent of U.S. adults ages 65 and older lived in poverty, compared with 18 percent of children under age 18. However, trends in poverty rates for these two age groups have diverged markedly since 1974, with the rate among older adults decreasing, and the rate among children rising to new peaks in the mid-1980s, mid-1990s, and from 2010 to 2012 following the Great Recession. Entitlement programs such as Social Security and Medicare have been effective in reducing poverty among older adults, but their costs have been rising rapidly as the U.S. population ages. With limited resources, the United States will continue to face difficult trade-offs in improving the well-being of both children and older adults. Investing resources today to reduce poverty among children can increase their future productive capacity and help offset the costs of an aging population. Percent of Persons in Poverty by Age Group in the United States, 1966-2016 Ages 65+Ages 18 Source: PRB analysis of data from the U.S. Census Bureau, Current Population Survey, Annual Social and Economic Supplement. 1966 1971 1976 1981 1986 1991 1996 2001 2006 2011 2016 29 9 18 1820% 10% 0% 30% 40%
  • 8.
    © 2018 PopulationReference Bureau See notes on page 18 2018 WORLD POPULATION DATA SHEET 7 9.9 BILLION 82 26% 88 Projected world population in 2050. Projected number of countries in 2050 with at least 20% of the population ages 65+, vs. 13 countries in 2018. Shareofmarriedwomenin Senegalusingmodernfamily planningmethodsin2017, upfrom12%in2011. Average life expectancy for women in Hong Kong, the highest in the world. 15%1.4 5.6 35% Total fertility rate in southern Europe, the lowest rate of any world region. Projectedshare ofthepopulation ages15inBrazilin 2050vs.22%in2018. Number of infant deaths per 1,000 live births in the United States, 49th lowest in the world. HIV prevalence among women ages 15-49 in eSwatini, the highest in the world. CHANGING AGE STRUCTURES
  • 9.
    © 2018 PopulationReference Bureau See notes on page 18 2018 WORLD POPULATION DATA SHEET 8 Population (millions) mid-2018 Births per 1,000 Population Deaths per 1,000 Population Rate of Natural Increase (%) Net Migration Rate Population (millions) Infant Mortality Ratea Total Fertility Rateb GNI per Capita, PPP 2017c Percent Urban Population per km2 of Arable Land Married Women 15-49 Using Contraceptiond (%) Ages 15-49 With HIV/AID mid-2030 mid-2050 All Methods Modern Methods Males 2017 Female WORLD 7,621 19 7 1.2 0 8,571 9,852 31 2.4 16,927 55 535 62 56 — — MORE DEVELOPED 1,266 10 10 0.0 3 1,301 1,312 5 1.6 43,409 79 242 68 59 — — LESS DEVELOPED 6,355 21 7 1.4 -1 7,270 8,540 34 2.6 11,445 50 704 61 55 — — LESS DEVELOPED (Excl. China) 4,953 23 7 1.7 -1 5,841 7,187 37 2.8 9,840 48 632 54 47 0.9 1 LEAST DEVELOPED 1,027 33 8 2.5 -1 1,342 1,954 49 4.2 2,723 33 585 37 33 1.5 2 AFRICA 1,284 35 9 2.6 -1 1,714 2,586 50 4.6 4,965 43 546 36 32 2.7 4 NORTHERN AFRICA 235 26 6 2.0 -1 289 385 24 3.3 10,557 52 548 52 47 0.1 0 Algeria 42.7 26 4 2.2 -0 51.3 64.3 22 3.1 15,050 73 572 57 50 0.1 0 Egypt 97.0 27 6 2.1 -1 120.8 166.5 15 3.4 11,360 43 3,350 59 57 0.1 0 Libya 6.5 20 5 1.4 -4 7.3 8.1 22 2.3 19,940 80 376 42 20 — — Morocco 35.2 18 5 1.2 -2 39.3 43.6 22 2.2 8,063 62 433 67 59 0.1 0 Sudan 41.7 34 8 2.7 -2 56.8 88.1 45 4.7 4,482 36 210 12 12 0.2 0 Tunisia 11.6 19 6 1.4 -0 12.7 13.8 15 2.3 11,490 68 399 63 51 0.1 0 Western Sahara 0.6 20 5 1.5 7 0.7 0.9 30 2.3 — 87 14,150 — — — — SUB-SAHARAN AFRICA 1,049 37 9 2.7 -0 1,425 2,200 54 4.9 3,683 40 546 33 28 3.3 5 WESTERN AFRICA 382 38 11 2.7 -1 518 809 62 5.3 4,174 46 445 24 18 1.8 2 Benin 11.5 37 9 2.8 -0 15.6 23.9 63 5.0 2,260 45 425 18 13 0.7 1 Burkina Faso 20.3 40 9 3.1 -1 28.9 48.5 57 5.5 1,810 29 338 32 30 0.6 1 Cabo Verde 0.6 19 5 1.4 -3 0.6 0.6 21 2.2 6,570 66 1,101 61 57 0.5 0 Côte d’Ivoire 24.9 35 12 2.3 0 33.3 51.4 62 4.6 3,820 51 859 24 19 1.9 3 Gambia 2.2 39 8 3.1 -1 3.1 5.0 46 5.4 1,670 61 494 9 8 1.4 1 Ghana 29.5 30 8 2.2 -1 37.3 51.3 37 3.9 4,490 56 627 33 27 1.0 2 Guinea 11.9 39 11 2.8 -2 16.3 25.3 68 4.8 2,270 35 383 9 8 1.1 1 Guinea-Bissau 1.9 36 11 2.6 -1 2.5 3.6 73 4.6 1,700 43 636 16 14 2.6 4 Liberia 4.9 33 8 2.5 -1 6.5 9.8 50 4.2 710 51 971 31 31 1.0 1 Mali 19.4 45 10 3.5 -4 27.5 44.8 56 6.0 2,160 42 303 16 15 0.9 1 Mauritania 4.5 34 8 2.6 1 6.1 9.0 65 4.6 3,900 54 1,009 18 16 0.4 0 Niger 22.2 48 10 3.8 -0 34.0 63.1 60 7.2 990 16 132 19 18 0.3 0 Nigeria 195.9 39 12 2.6 -0 264.1 410.6 67 5.5 5,680 50 576 24 16 2.5 3 Senegal 16.3 33 6 2.7 -1 22.1 34.0 42 4.6 2,620 46 509 28 26 0.3 0 Sierra Leone 7.7 33 13 2.0 -1 9.7 13.0 84 4.2 1,480 41 487 17 16 1.1 1 Togo 8.0 34 9 2.5 -0 10.5 15.3 52 4.5 1,620 42 302 20 17 1.5 2 EASTERN AFRICA 432 36 8 2.8 -1 584 883 45 4.7 2,192 28 651 41 38 3.4 5 Burundi 11.8 41 11 3.0 -0 17.2 30.4 47 5.5 770 13 987 29 23 0.8 1 Comoros 0.8 33 7 2.5 -2 1.1 1.5 55 4.3 1,570 29 1,281 19 14 0.1 0 Djibouti 1.0 23 8 1.5 1 1.1 1.3 52 2.9 — 78 48,550 19 18 1.1 1 Eritrea 6.0 30 7 2.3 -15 6.8 8.9 46 4.1 1,500 40 865 8 7 0.4 0 Ethiopia 107.5 33 7 2.6 -0 139.6 190.9 40 4.4 1,890 20 711 37 35 0.7 1 Kenya 51.0 31 6 2.6 -0 67.0 95.5 36 3.9 3,250 32 878 62 60 3.5 6 Madagascar 26.3 32 6 2.6 -0 35.6 53.8 32 4.1 1,510 37 750 40 33 0.4 0 Malawi 19.1 34 7 2.6 -1 25.6 37.4 42 4.2 1,180 17 502 59 58 7.4 11 Mauritius 1.3 11 8 0.3 -1 1.3 1.2 11.8 1.4 22,570 41 1,710 64 32 — — Mayotte 0.3 39 3 3.6 -0 0.4 0.6 4 5.1 — 46 2,970 — — — — Mozambique 30.5 39 10 2.9 -0 42.4 67.8 65 5.3 1,200 32 540 27 25 9.9 15 Réunion 0.9 16 6 1.0 -4 0.9 1.0 7 2.4 — 100 2,539 — — — — Rwanda 12.6 32 6 2.6 -1 16.6 24.3 32 4.2 1,990 19 1,091 53 48 1.9 3 Seychelles 0.1 17 8 1.0 -3 0.1 0.1 13.4 2.4 26,860 57 64,364 — — — — Somalia 15.2 43 11 3.2 -3 21.5 35.9 72 6.3 — 45 1,380 15 14 0.1 0 South Sudan 13.0 37 11 2.6 4 17.9 27.9 69 5.0 1,440 20 — 4 2 2.0 2 Tanzania 59.1 39 7 3.3 -1 83.7 138.1 43 5.2 2,916 34 438 38 32 3.4 5 Uganda 44.1 41 9 3.2 -1 61.6 95.6 43 5.4 1,820 24 639 42 36 4.5 7 Zambia 17.7 39 8 3.1 -0 25.8 45.1 49 5.2 3,920 44 465 49 45 8.8 14 POPULATION, HEALTH, AND ENVIRONMENT DATA AND ESTIMATES FOR THE COUNTRIESPOPULATION, HEALTH, AND ENVIRONMENT DATA AND ESTIMATES FOR THE COUNTRIES, TERRITORIES, AND REGIONS OF THE WORLD
  • 10.
    © 2018 PopulationReference Bureau See notes on page 18 2018 WORLD POPULATION DATA SHEET 9 Capita, 017c Percent Urban Population per km2 of Arable Land Married Women 15-49 Using Contraceptiond (%) Ages 15-49 With HIV/AIDS (%) Life Expectancy at Birth (Years) Life Expectancy at Age 65 (Years) Population Ages 15 Population Ages 65+ All Methods Modern Methods Males 2017 Females 2017 Males Females Males Females 2018 (%) 2050 (%) 2050 as a Multiple of 2018e 2018 (%) 2050 (%) 2050 as a Multiple of 2018e 27 55 535 62 56 — — 70 74 16 18 26 21 1.1 9 16 2.3 409 79 242 68 59 — — 76 82 18 21 16 16 1.0 18 27 1.5 445 50 704 61 55 — — 69 73 15 17 28 22 1.1 7 14 2.8 840 48 632 54 47 0.9 1.3 67 71 15 17 31 24 1.1 6 12 3.0 723 33 585 37 33 1.5 2.3 63 66 14 15 40 31 1.5 4 7 3.5 65 43 546 36 32 2.7 4.3 61 64 13 15 41 32 1.6 3 6 3.4 57 52 548 52 47 0.1 0.1 71 74 15 16 32 25 1.2 5 12 3.8 050 73 572 57 50 0.1 0.1 77 78 18 19 29 20 1.0 6 17 4.3 360 43 3,350 59 57 0.1 0.1 71 74 13 15 34 25 1.3 4 11 4.7 940 80 376 42 20 — — 69 75 13 16 28 18 0.8 4 17 4.6 063 62 433 67 59 0.1 0.1 75 78 15 17 24 19 0.9 8 18 2.7 482 36 210 12 12 0.2 0.2 63 66 14 15 41 31 1.6 4 6 3.4 490 68 399 63 51 0.1 0.1 75 78 15 18 24 18 0.9 8 20 2.9 — 87 14,150 — — — — 68 72 13 15 28 20 1.1 3 12 6.8 683 40 546 33 28 3.3 5.2 59 62 13 14 43 33 1.6 3 5 3.3 74 46 445 24 18 1.8 2.4 56 58 11 12 44 35 1.7 3 4 3.2 260 45 425 18 13 0.7 1.3 59 62 13 14 43 34 1.6 3 5 3.1 810 29 338 32 30 0.6 1.0 60 61 12 12 47 35 1.8 3 4 3.4 570 66 1,101 61 57 0.5 0.7 71 75 14 16 31 19 0.7 4 12 3.2 820 51 859 24 19 1.9 3.7 52 55 11 12 43 35 1.7 3 4 2.8 670 61 494 9 8 1.4 1.9 60 63 12 13 46 33 1.7 2 4 4.0 490 56 627 33 27 1.0 2.3 62 64 12 13 39 30 1.3 3 6 3.3 270 35 383 9 8 1.1 1.9 58 61 12 12 45 33 1.5 4 5 2.7 700 43 636 16 14 2.6 4.1 56 59 12 12 42 32 1.4 3 5 3.3 710 51 971 31 31 1.0 1.8 62 64 12 13 42 32 1.6 3 5 3.6 160 42 303 16 15 0.9 1.6 58 62 12 12 47 36 1.8 2 4 3.8 900 54 1,009 18 16 0.4 0.3 62 65 12 13 40 32 1.6 3 6 3.6 990 16 132 19 18 0.3 0.3 59 61 12 13 50 43 2.4 3 3 2.9 680 50 576 24 16 2.5 3.0 53 54 11 11 44 35 1.7 3 4 3.1 620 46 509 28 26 0.3 0.6 65 69 13 14 43 33 1.6 3 5 3.8 480 41 487 17 16 1.1 1.6 51 52 10 10 42 29 1.2 3 5 3.1 620 42 302 20 17 1.5 2.7 59 61 12 12 42 32 1.5 3 5 3.5 92 28 651 41 38 3.4 5.6 62 66 14 15 43 32 1.5 3 5 3.5 770 13 987 29 23 0.8 1.4 59 62 13 14 46 36 2.1 2 4 4.2 570 29 1,281 19 14 0.1 0.1 62 65 12 14 40 30 1.3 3 6 3.5 — 78 48,550 19 18 1.1 1.5 61 64 14 15 32 21 0.9 4 10 3.3 500 40 865 8 7 0.4 0.7 62 68 13 14 41 30 1.1 4 6 2.3 890 20 711 37 35 0.7 1.2 64 67 14 15 41 26 1.1 4 7 3.3 250 32 878 62 60 3.5 6.2 65 69 14 16 41 29 1.3 3 7 5.1 510 37 750 40 33 0.4 0.2 64 68 13 14 41 32 1.6 3 6 4.0 180 17 502 59 58 7.4 11.7 61 66 14 15 44 32 1.4 3 5 3.2 570 41 1,710 64 32 — — 71 78 15 19 19 14 0.7 11 24 2.2 — 46 2,970 — — — — 74 77 18 22 44 27 1.3 3 10 8.1 200 32 540 27 25 9.9 15.0 56 60 13 14 45 35 1.7 3 4 3.0 — 100 2,539 — — — — 78 84 18 22 24 17 0.8 11 25 2.6 990 19 1,091 53 48 1.9 3.4 65 69 14 15 40 27 1.3 3 8 5.0 860 57 64,364 — — — — 68 78 14 18 22 18 0.8 8 23 2.8 — 45 1,380 15 14 0.1 0.1 55 58 13 13 47 38 1.9 3 3 2.9 440 20 — 4 2 2.0 2.9 56 58 13 14 42 32 1.7 3 5 3.0 916 34 438 38 32 3.4 5.5 64 67 14 15 45 36 1.9 3 5 3.6 820 24 639 42 36 4.5 7.3 62 64 13 14 48 36 1.6 3 4 3.0 920 44 465 49 45 8.8 14.3 59 64 14 15 45 36 2.0 2 4 4.5 MENT DATA AND ESTIMATES FOR THE COUNTRIES, TERRITORIES, AND REGIONS OF THE WORLD Population (millions) mid-2018 Births per 1,000 Population Deaths per 1,000 Population Rate of Natural Increase (%) Net Migration Rate Population (millions) Infant Mortality Ratea Total Fertility Rateb GNI per Capita, PPP 2017c Percent Urban Population per km2 of Arable Land Married Women 15-49 Using Contraceptiond (%) Ages 15-49 With HIV/AID mid-2030 mid-2050 All Methods Modern Methods Males 2017 Female WORLD 7,621 19 7 1.2 0 8,571 9,852 31 2.4 16,927 55 535 62 56 — — MORE DEVELOPED 1,266 10 10 0.0 3 1,301 1,312 5 1.6 43,409 79 242 68 59 — — LESS DEVELOPED 6,355 21 7 1.4 -1 7,270 8,540 34 2.6 11,445 50 704 61 55 — — LESS DEVELOPED (Excl. China) 4,953 23 7 1.7 -1 5,841 7,187 37 2.8 9,840 48 632 54 47 0.9 1 LEAST DEVELOPED 1,027 33 8 2.5 -1 1,342 1,954 49 4.2 2,723 33 585 37 33 1.5 2 AFRICA 1,284 35 9 2.6 -1 1,714 2,586 50 4.6 4,965 43 546 36 32 2.7 4 NORTHERN AFRICA 235 26 6 2.0 -1 289 385 24 3.3 10,557 52 548 52 47 0.1 0 Algeria 42.7 26 4 2.2 -0 51.3 64.3 22 3.1 15,050 73 572 57 50 0.1 0 Egypt 97.0 27 6 2.1 -1 120.8 166.5 15 3.4 11,360 43 3,350 59 57 0.1 0 Libya 6.5 20 5 1.4 -4 7.3 8.1 22 2.3 19,940 80 376 42 20 — — Morocco 35.2 18 5 1.2 -2 39.3 43.6 22 2.2 8,063 62 433 67 59 0.1 0 Sudan 41.7 34 8 2.7 -2 56.8 88.1 45 4.7 4,482 36 210 12 12 0.2 0 Tunisia 11.6 19 6 1.4 -0 12.7 13.8 15 2.3 11,490 68 399 63 51 0.1 0 Western Sahara 0.6 20 5 1.5 7 0.7 0.9 30 2.3 — 87 14,150 — — — — SUB-SAHARAN AFRICA 1,049 37 9 2.7 -0 1,425 2,200 54 4.9 3,683 40 546 33 28 3.3 5 WESTERN AFRICA 382 38 11 2.7 -1 518 809 62 5.3 4,174 46 445 24 18 1.8 2 Benin 11.5 37 9 2.8 -0 15.6 23.9 63 5.0 2,260 45 425 18 13 0.7 1 Burkina Faso 20.3 40 9 3.1 -1 28.9 48.5 57 5.5 1,810 29 338 32 30 0.6 1 Cabo Verde 0.6 19 5 1.4 -3 0.6 0.6 21 2.2 6,570 66 1,101 61 57 0.5 0 Côte d’Ivoire 24.9 35 12 2.3 0 33.3 51.4 62 4.6 3,820 51 859 24 19 1.9 3 Gambia 2.2 39 8 3.1 -1 3.1 5.0 46 5.4 1,670 61 494 9 8 1.4 1 Ghana 29.5 30 8 2.2 -1 37.3 51.3 37 3.9 4,490 56 627 33 27 1.0 2 Guinea 11.9 39 11 2.8 -2 16.3 25.3 68 4.8 2,270 35 383 9 8 1.1 1 Guinea-Bissau 1.9 36 11 2.6 -1 2.5 3.6 73 4.6 1,700 43 636 16 14 2.6 4 Liberia 4.9 33 8 2.5 -1 6.5 9.8 50 4.2 710 51 971 31 31 1.0 1 Mali 19.4 45 10 3.5 -4 27.5 44.8 56 6.0 2,160 42 303 16 15 0.9 1 Mauritania 4.5 34 8 2.6 1 6.1 9.0 65 4.6 3,900 54 1,009 18 16 0.4 0 Niger 22.2 48 10 3.8 -0 34.0 63.1 60 7.2 990 16 132 19 18 0.3 0 Nigeria 195.9 39 12 2.6 -0 264.1 410.6 67 5.5 5,680 50 576 24 16 2.5 3 Senegal 16.3 33 6 2.7 -1 22.1 34.0 42 4.6 2,620 46 509 28 26 0.3 0 Sierra Leone 7.7 33 13 2.0 -1 9.7 13.0 84 4.2 1,480 41 487 17 16 1.1 1 Togo 8.0 34 9 2.5 -0 10.5 15.3 52 4.5 1,620 42 302 20 17 1.5 2 EASTERN AFRICA 432 36 8 2.8 -1 584 883 45 4.7 2,192 28 651 41 38 3.4 5 Burundi 11.8 41 11 3.0 -0 17.2 30.4 47 5.5 770 13 987 29 23 0.8 1 Comoros 0.8 33 7 2.5 -2 1.1 1.5 55 4.3 1,570 29 1,281 19 14 0.1 0 Djibouti 1.0 23 8 1.5 1 1.1 1.3 52 2.9 — 78 48,550 19 18 1.1 1 Eritrea 6.0 30 7 2.3 -15 6.8 8.9 46 4.1 1,500 40 865 8 7 0.4 0 Ethiopia 107.5 33 7 2.6 -0 139.6 190.9 40 4.4 1,890 20 711 37 35 0.7 1 Kenya 51.0 31 6 2.6 -0 67.0 95.5 36 3.9 3,250 32 878 62 60 3.5 6 Madagascar 26.3 32 6 2.6 -0 35.6 53.8 32 4.1 1,510 37 750 40 33 0.4 0 Malawi 19.1 34 7 2.6 -1 25.6 37.4 42 4.2 1,180 17 502 59 58 7.4 11 Mauritius 1.3 11 8 0.3 -1 1.3 1.2 11.8 1.4 22,570 41 1,710 64 32 — — Mayotte 0.3 39 3 3.6 -0 0.4 0.6 4 5.1 — 46 2,970 — — — — Mozambique 30.5 39 10 2.9 -0 42.4 67.8 65 5.3 1,200 32 540 27 25 9.9 15 Réunion 0.9 16 6 1.0 -4 0.9 1.0 7 2.4 — 100 2,539 — — — — Rwanda 12.6 32 6 2.6 -1 16.6 24.3 32 4.2 1,990 19 1,091 53 48 1.9 3 Seychelles 0.1 17 8 1.0 -3 0.1 0.1 13.4 2.4 26,860 57 64,364 — — — — Somalia 15.2 43 11 3.2 -3 21.5 35.9 72 6.3 — 45 1,380 15 14 0.1 0 South Sudan 13.0 37 11 2.6 4 17.9 27.9 69 5.0 1,440 20 — 4 2 2.0 2 Tanzania 59.1 39 7 3.3 -1 83.7 138.1 43 5.2 2,916 34 438 38 32 3.4 5 Uganda 44.1 41 9 3.2 -1 61.6 95.6 43 5.4 1,820 24 639 42 36 4.5 7 Zambia 17.7 39 8 3.1 -0 25.8 45.1 49 5.2 3,920 44 465 49 45 8.8 14 POPULATION, HEALTH, AND ENVIRONMENT DATA AND ESTIMATES FOR THE COUNTRIESPOPULATION, HEALTH, AND ENVIRONMENT DATA AND ESTIMATES FOR THE COUNTRIES, TERRITORIES, AND REGIONS OF THE WORLD
  • 11.
    © 2018 PopulationReference Bureau See notes on page 18 2018 WORLD POPULATION DATA SHEET 10 Mauritius 1.3 11 8 0.3 -1 1.3 1.2 11.8 1.4 22,570 41 1,710 64 32 — — Mayotte 0.3 39 3 3.6 -0 0.4 0.6 4 5.1 — 46 2,970 — — — — Mozambique 30.5 39 10 2.9 -0 42.4 67.8 65 5.3 1,200 32 540 27 25 9.9 15 Réunion 0.9 16 6 1.0 -4 0.9 1.0 7 2.4 — 100 2,539 — — — — Rwanda 12.6 32 6 2.6 -1 16.6 24.3 32 4.2 1,990 19 1,091 53 48 1.9 3 Seychelles 0.1 17 8 1.0 -3 0.1 0.1 13.4 2.4 26,860 57 64,364 — — — — Somalia 15.2 43 11 3.2 -3 21.5 35.9 72 6.3 — 45 1,380 15 14 0.1 0 South Sudan 13.0 37 11 2.6 4 17.9 27.9 69 5.0 1,440 20 — 4 2 2.0 2 Tanzania 59.1 39 7 3.3 -1 83.7 138.1 43 5.2 2,916 34 438 38 32 3.4 5 Uganda 44.1 41 9 3.2 -1 61.6 95.6 43 5.4 1,820 24 639 42 36 4.5 7 Zambia 17.7 39 8 3.1 -0 25.8 45.1 49 5.2 3,920 44 465 49 45 8.8 14 Zimbabwe 14.0 34 10 2.4 -10 17.6 25.6 50 4.0 1,850 32 351 67 66 10.5 16 MIDDLE AFRICA 169 42 10 3.2 -0 245 414 61 5.9 2,780 49 654 20 11 1.1 2 Angola 30.4 45 10 3.5 0 45.4 82.2 44 6.2 6,060 63 620 14 13 1.2 2 Cameroon 25.6 36 10 2.6 0 34.4 51.9 52 4.7 3,640 56 414 34 21 2.5 4 Central African Republic 4.7 36 14 2.2 -10 6.1 8.9 85 4.9 730 41 263 15 12 3.3 4 Chad 15.4 45 13 3.1 1 22.2 36.8 72 6.4 1,920 23 314 6 5 1.0 1 Congo 5.4 33 10 2.3 -5 7.3 11.5 41 4.4 4,880 67 982 30 19 1.9 4 Congo, Dem. Rep. 84.3 43 10 3.3 0 124.3 215.9 67 6.3 870 45 1,188 20 8 0.4 1 Equatorial Guinea 1.3 34 10 2.4 14 1.9 2.8 64 4.7 19,380 71 1,095 13 10 5.4 8 Gabon 2.1 29 8 2.2 3 2.9 3.9 37 3.8 17,010 89 632 31 19 2.3 6 São Tomé and Príncipe 0.2 33 7 2.6 -5 0.3 0.3 38 4.4 3,370 73 2,425 41 37 — — SOUTHERN AFRICA 66 22 9 1.2 3 78 94 38 2.5 12,693 64 468 55 54 14.0 23 Botswana 2.2 22 10 1.2 3 2.6 3.2 31 2.6 16,990 70 564 53f 51f 18.4 27 eSwatini 1.4 29 10 1.9 -1 1.7 2.1 50 3.3 8,520 24 795 66 66 19.3 35 Lesotho 2.3 29 13 1.6 -2 2.6 3.2 59 3.3 3,510 28 831 60 60 18.7 29 Namibia 2.5 28 8 2.0 0 3.1 4.2 36 3.4 10,320 48 317 56 55 9.5 14 South Africa 57.7 21 9 1.2 4 67.9 81.8 36 2.4 13,090 66 462 55 54 14.0 23 AMERICAS 1,014 15 7 0.8 1 1,113 1,220 13 2.0 31,140 80 273 74 68 — — NORTHERN AMERICA 365 12 9 0.3 4 396 437 6 1.7 58,737 82 186 74 63 — — Canada 37.2 11 8 0.3 11 41.0 46.9 4.5 1.5 45,750 81 85 85f — — — United States 328.0 12 9 0.3 3 354.7 389.6 5.6 1.8 60,200 82 215 73 63 — — LATIN AMERICA AND THE CARIBBEAN 649 17 6 1.1 -1 717 783 16 2.1 15,273 78 370 74 70 0.7 0 CENTRAL AMERICA 179 19 5 1.4 -1 204 231 19 2.3 15,384 69 641 68 64 0.4 0 Belize 0.4 23 5 1.8 4 0.5 0.6 9 2.6 7,890 45 510 51 49 2.0 1 Costa Rica 5.0 14 5 0.9 2 5.6 6.1 8.0 1.7 16,100 73 2,157 76 75 0.6 0 El Salvador 6.5 20 7 1.3 -7 7.1 8.0 17 2.3 7,540 70 863 72 68 0.8 0 Guatemala 17.2 24 5 1.9 -1 21.2 27.0 28 2.8 8,000 51 1,847 61 49 0.5 0 Honduras 9.0 22 5 1.7 -0 10.3 11.3 25 2.5 4,630 54 884 73 64 0.4 0 Mexico 130.8 19 6 1.3 -1 147.5 164.3 17 2.2 17,740 73 571 67 65 0.4 0 Nicaragua 6.3 20 5 1.5 -4 7.0 7.9 18 2.2 5,680 59 416 80 77 0.3 0 Panama 4.2 19 5 1.4 1 4.9 5.8 14 2.4 21,890 69 739 63 60 1.3 0 CARIBBEAN 43 17 8 0.9 -4 46 47 34 2.2 — 71 830 61 58 1.2 1 Antigua and Barbuda 0.1 15 6 0.9 -0 0.1 0.1 8 1.9 22,980 25 2,564 — — — — Bahamas 0.4 13 6 0.7 3 0.4 0.4 8 1.6 29,790 83 4,963 — — 2.0 1 Barbados 0.3 11 9 0.1 1 0.3 0.3 9 1.6 17,830 31 2,593 59 55 2.2 1 Cuba 11.1 10 9 0.2 -5 10.8 9.8 4.3 1.6 — 77 369 74 72 0.6 0 Curaçao 0.2 10 9 0.1 -3 0.2 0.2 10.7 1.5 — 89 — — — — — Dominica 0.07 12 8 0.4 1 0.08 0.08 20 1.8 10,170 71 1,211 — — — — Dominican Republic 10.8 20 6 1.4 -3 12.0 13.2 31 2.5 15,290 80 1,354 70 68 1.0 0 Grenada 0.1 16 9 0.7 -0 0.1 0.1 19 2.1 14,410 36 3,807 — — — — Guadeloupe 0.4 10 8 0.1 -9 0.4 0.4 8.1 1.7 — 99 1,707 — — — — Haiti 10.8 25 8 1.7 -2 12.4 14.5 59 3.0 1,830 55 1,008 34 32 1.5 2 Jamaica 2.9 17 7 1.0 -6 2.9 2.7 14 2.0 8,690 56 2,416 73 68 2.4 1 Martinique 0.4 9 9 0.0 -9 0.4 0.3 7 1.7 — 89 3,329 — — — — Puerto Rico 3.3 7 9 -0.2 -17 3.2 2.9 7.0 1.1 25,240 94 5,352 84f 72f — — St. Kitts-Nevis 0.05 14 9 0.5 3 0.06 0.06 17 1.8 26,300 31 1,062 — — — — Saint Lucia 0.2 12 6 0.7 -3 0.2 0.2 18 1.5 13,230 19 5,780 56 53 — — St. Vincent and the Grenadines 0.1 16 9 0.7 -6 0.1 0.1 18 2.1 11,770 52 2,210 — — — — Trinidad and Tobago 1.4 13 8 0.5 -1 1.4 1.4 13 1.6 30,520 53 5,450 40 38 1.4 0 Population (millions) mid-2018 Births per 1,000 Population Deaths per 1,000 Population Rate of Natural Increase (%) Net Migration Rate Population (millions) Infant Mortality Ratea Total Fertility Rateb GNI per Capita, PPP 2017c Percent Urban Population per km2 of Arable Land Married Women 15-49 Using Contraceptiond (%) Ages 15-49 With HIV/AID mid-2030 mid-2050 All Methods Modern Methods Males 2017 Female WORLD 7,621 19 7 1.2 0 8,571 9,852 31 2.4 16,927 55 535 62 56 — — MORE DEVELOPED 1,266 10 10 0.0 3 1,301 1,312 5 1.6 43,409 79 242 68 59 — — LESS DEVELOPED 6,355 21 7 1.4 -1 7,270 8,540 34 2.6 11,445 50 704 61 55 — — LESS DEVELOPED (Excl. China) 4,953 23 7 1.7 -1 5,841 7,187 37 2.8 9,840 48 632 54 47 0.9 1 LEAST DEVELOPED 1,027 33 8 2.5 -1 1,342 1,954 49 4.2 2,723 33 585 37 33 1.5 2 AFRICA 1,284 35 9 2.6 -1 1,714 2,586 50 4.6 4,965 43 546 36 32 2.7 4 NORTHERN AFRICA 235 26 6 2.0 -1 289 385 24 3.3 10,557 52 548 52 47 0.1 0 Algeria 42.7 26 4 2.2 -0 51.3 64.3 22 3.1 15,050 73 572 57 50 0.1 0 Egypt 97.0 27 6 2.1 -1 120.8 166.5 15 3.4 11,360 43 3,350 59 57 0.1 0 Libya 6.5 20 5 1.4 -4 7.3 8.1 22 2.3 19,940 80 376 42 20 — — Morocco 35.2 18 5 1.2 -2 39.3 43.6 22 2.2 8,063 62 433 67 59 0.1 0 Sudan 41.7 34 8 2.7 -2 56.8 88.1 45 4.7 4,482 36 210 12 12 0.2 0 Tunisia 11.6 19 6 1.4 -0 12.7 13.8 15 2.3 11,490 68 399 63 51 0.1 0 Western Sahara 0.6 20 5 1.5 7 0.7 0.9 30 2.3 — 87 14,150 — — — — SUB-SAHARAN AFRICA 1,049 37 9 2.7 -0 1,425 2,200 54 4.9 3,683 40 546 33 28 3.3 5 WESTERN AFRICA 382 38 11 2.7 -1 518 809 62 5.3 4,174 46 445 24 18 1.8 2 Benin 11.5 37 9 2.8 -0 15.6 23.9 63 5.0 2,260 45 425 18 13 0.7 1 Burkina Faso 20.3 40 9 3.1 -1 28.9 48.5 57 5.5 1,810 29 338 32 30 0.6 1 Cabo Verde 0.6 19 5 1.4 -3 0.6 0.6 21 2.2 6,570 66 1,101 61 57 0.5 0 Côte d’Ivoire 24.9 35 12 2.3 0 33.3 51.4 62 4.6 3,820 51 859 24 19 1.9 3 Gambia 2.2 39 8 3.1 -1 3.1 5.0 46 5.4 1,670 61 494 9 8 1.4 1 Ghana 29.5 30 8 2.2 -1 37.3 51.3 37 3.9 4,490 56 627 33 27 1.0 2 Guinea 11.9 39 11 2.8 -2 16.3 25.3 68 4.8 2,270 35 383 9 8 1.1 1 Guinea-Bissau 1.9 36 11 2.6 -1 2.5 3.6 73 4.6 1,700 43 636 16 14 2.6 4 Liberia 4.9 33 8 2.5 -1 6.5 9.8 50 4.2 710 51 971 31 31 1.0 1 Mali 19.4 45 10 3.5 -4 27.5 44.8 56 6.0 2,160 42 303 16 15 0.9 1 Mauritania 4.5 34 8 2.6 1 6.1 9.0 65 4.6 3,900 54 1,009 18 16 0.4 0 Niger 22.2 48 10 3.8 -0 34.0 63.1 60 7.2 990 16 132 19 18 0.3 0 Nigeria 195.9 39 12 2.6 -0 264.1 410.6 67 5.5 5,680 50 576 24 16 2.5 3 Senegal 16.3 33 6 2.7 -1 22.1 34.0 42 4.6 2,620 46 509 28 26 0.3 0 Sierra Leone 7.7 33 13 2.0 -1 9.7 13.0 84 4.2 1,480 41 487 17 16 1.1 1 Togo 8.0 34 9 2.5 -0 10.5 15.3 52 4.5 1,620 42 302 20 17 1.5 2 EASTERN AFRICA 432 36 8 2.8 -1 584 883 45 4.7 2,192 28 651 41 38 3.4 5 Burundi 11.8 41 11 3.0 -0 17.2 30.4 47 5.5 770 13 987 29 23 0.8 1 Comoros 0.8 33 7 2.5 -2 1.1 1.5 55 4.3 1,570 29 1,281 19 14 0.1 0 Djibouti 1.0 23 8 1.5 1 1.1 1.3 52 2.9 — 78 48,550 19 18 1.1 1 Eritrea 6.0 30 7 2.3 -15 6.8 8.9 46 4.1 1,500 40 865 8 7 0.4 0 Ethiopia 107.5 33 7 2.6 -0 139.6 190.9 40 4.4 1,890 20 711 37 35 0.7 1 Kenya 51.0 31 6 2.6 -0 67.0 95.5 36 3.9 3,250 32 878 62 60 3.5 6 Madagascar 26.3 32 6 2.6 -0 35.6 53.8 32 4.1 1,510 37 750 40 33 0.4 0 Malawi 19.1 34 7 2.6 -1 25.6 37.4 42 4.2 1,180 17 502 59 58 7.4 11 Mauritius 1.3 11 8 0.3 -1 1.3 1.2 11.8 1.4 22,570 41 1,710 64 32 — — Mayotte 0.3 39 3 3.6 -0 0.4 0.6 4 5.1 — 46 2,970 — — — — Mozambique 30.5 39 10 2.9 -0 42.4 67.8 65 5.3 1,200 32 540 27 25 9.9 15 Réunion 0.9 16 6 1.0 -4 0.9 1.0 7 2.4 — 100 2,539 — — — — Rwanda 12.6 32 6 2.6 -1 16.6 24.3 32 4.2 1,990 19 1,091 53 48 1.9 3 Seychelles 0.1 17 8 1.0 -3 0.1 0.1 13.4 2.4 26,860 57 64,364 — — — — Somalia 15.2 43 11 3.2 -3 21.5 35.9 72 6.3 — 45 1,380 15 14 0.1 0 South Sudan 13.0 37 11 2.6 4 17.9 27.9 69 5.0 1,440 20 — 4 2 2.0 2 Tanzania 59.1 39 7 3.3 -1 83.7 138.1 43 5.2 2,916 34 438 38 32 3.4 5 Uganda 44.1 41 9 3.2 -1 61.6 95.6 43 5.4 1,820 24 639 42 36 4.5 7 Zambia 17.7 39 8 3.1 -0 25.8 45.1 49 5.2 3,920 44 465 49 45 8.8 14 POPULATION, HEALTH, AND ENVIRONMENT DATA AND ESTIMATES FOR THE COUNTRIESPOPULATION, HEALTH, AND ENVIRONMENT DATA AND ESTIMATES FOR THE COUNTRIES, TERRITORIES, AND REGIONS OF THE WORLD
  • 12.
    © 2018 PopulationReference Bureau See notes on page 18 2018 WORLD POPULATION DATA SHEET 11 570 41 1,710 64 32 — — 71 78 15 19 19 14 0.7 11 24 2.2 — 46 2,970 — — — — 74 77 18 22 44 27 1.3 3 10 8.1 200 32 540 27 25 9.9 15.0 56 60 13 14 45 35 1.7 3 4 3.0 — 100 2,539 — — — — 78 84 18 22 24 17 0.8 11 25 2.6 990 19 1,091 53 48 1.9 3.4 65 69 14 15 40 27 1.3 3 8 5.0 860 57 64,364 — — — — 68 78 14 18 22 18 0.8 8 23 2.8 — 45 1,380 15 14 0.1 0.1 55 58 13 13 47 38 1.9 3 3 2.9 440 20 — 4 2 2.0 2.9 56 58 13 14 42 32 1.7 3 5 3.0 916 34 438 38 32 3.4 5.5 64 67 14 15 45 36 1.9 3 5 3.6 820 24 639 42 36 4.5 7.3 62 64 13 14 48 36 1.6 3 4 3.0 920 44 465 49 45 8.8 14.3 59 64 14 15 45 36 2.0 2 4 4.5 850 32 351 67 66 10.5 16.1 58 62 14 15 39 28 1.3 4 6 2.5 80 49 654 20 11 1.1 2.3 57 60 13 14 46 35 1.9 3 4 3.6 060 63 620 14 13 1.2 2.6 58 62 13 15 48 38 2.1 2 4 4.5 640 56 414 34 21 2.5 4.8 57 60 13 14 43 33 1.6 3 5 3.2 730 41 263 15 12 3.3 4.7 50 54 12 13 44 32 1.4 4 5 2.3 920 23 314 6 5 1.0 1.6 52 54 12 13 47 35 1.8 2 3 3.3 880 67 982 30 19 1.9 4.4 58 61 14 15 42 34 1.7 3 6 4.3 870 45 1,188 20 8 0.4 1.0 58 61 13 14 46 36 2.0 3 4 3.6 380 71 1,095 13 10 5.4 8.1 56 59 13 14 37 29 1.7 3 4 2.8 010 89 632 31 19 2.3 6.4 65 68 14 16 36 27 1.4 4 9 3.9 370 73 2,425 41 37 — — 65 69 14 15 42 32 1.2 4 6 2.6 93 64 468 55 54 14.0 23.9 61 67 12 16 30 22 1.0 5 10 2.7 990 70 564 53f 51f 18.4 27.4 61 65 13 15 32 21 0.9 5 11 3.2 520 24 795 66 66 19.3 35.1 54 61 12 14 37 26 1.0 3 6 2.8 510 28 831 60 60 18.7 29.0 52 56 12 13 36 27 1.1 5 6 1.8 320 48 317 56 55 9.5 14.5 62 65 13 15 37 27 1.2 4 7 2.9 090 66 462 55 54 14.0 23.7 61 67 11 16 30 21 1.0 6 11 2.7 40 80 273 74 68 — — 74 80 18 21 23 17 0.9 11 21 2.3 37 82 186 74 63 — — 77 81 19 21 19 17 1.1 15 23 1.8 750 81 85 85f — — — 80 84 20 22 16 15 1.2 17 26 1.9 200 82 215 73 63 — — 76 81 19 21 19 17 1.1 15 22 1.7 273 78 370 74 70 0.7 0.3 73 79 17 20 25 17 0.8 8 19 2.9 84 69 641 68 64 0.4 0.2 74 79 18 20 29 18 0.8 6 17 3.5 890 45 510 51 49 2.0 1.8 71 77 13 15 36 21 0.9 4 10 3.8 100 73 2,157 76 75 0.6 0.2 78 83 19 21 22 15 0.8 8 24 3.5 540 70 863 72 68 0.8 0.4 69 78 17 19 28 18 0.8 8 17 2.5 000 51 1,847 61 49 0.5 0.3 69 76 17 19 40 23 0.9 5 11 3.7 630 54 884 73 64 0.4 0.3 71 76 17 20 34 19 0.7 5 13 3.1 740 73 571 67 65 0.4 0.1 75 80 18 20 27 17 0.8 7 19 3.5 680 59 416 80 77 0.3 0.1 72 78 18 20 30 17 0.7 5 17 4.1 890 69 739 63 60 1.3 0.6 75 81 19 22 27 20 1.0 8 18 3.2 — 71 830 61 58 1.2 1.2 71 76 17 20 25 18 0.8 10 20 2.2 980 25 2,564 — — — — 74 79 17 19 24 18 0.8 7 19 3.1 790 83 4,963 — — 2.0 1.7 73 79 17 20 20 16 0.8 9 21 2.6 830 31 2,593 59 55 2.2 1.1 73 78 15 17 19 17 0.8 15 25 1.5 — 77 369 74 72 0.6 0.3 76 81 19 21 17 14 0.7 15 31 1.9 — 89 — — — — — 75 82 18 20 18 16 1.0 17 24 1.6 170 71 1,211 — — — — 73 78 — — 22 — — 11 — — 290 80 1,354 70 68 1.0 0.8 71 77 17 20 30 19 0.8 7 16 2.9 410 36 3,807 — — — — 74 79 15 16 26 18 0.7 7 17 2.4 — 99 1,707 — — — — 77 84 19 23 19 15 0.7 18 29 1.6 830 55 1,008 34 32 1.5 2.3 62 67 14 15 33 23 0.9 4 10 3.3 690 56 2,416 73 68 2.4 1.2 74 78 17 20 23 16 0.6 9 22 2.2 — 89 3,329 — — — — 78 84 19 23 17 15 0.8 20 32 1.4 240 94 5,352 84f 72f — — 78 84 18 22 16 13 0.7 19 28 1.3 300 31 1,062 — — — — 73 78 — — 21 — — 8 — — 230 19 5,780 56 53 — — 75 83 16 20 20 13 0.7 11 25 2.3 770 52 2,210 — — — — 70 75 15 17 24 16 0.7 8 19 2.6 520 53 5,450 40 38 1.4 0.8 70 76 13 17 19 16 0.8 10 21 2.1 Mauritius 1.3 11 8 0.3 -1 1.3 1.2 11.8 1.4 22,570 41 1,710 64 32 — — Mayotte 0.3 39 3 3.6 -0 0.4 0.6 4 5.1 — 46 2,970 — — — — Mozambique 30.5 39 10 2.9 -0 42.4 67.8 65 5.3 1,200 32 540 27 25 9.9 15 Réunion 0.9 16 6 1.0 -4 0.9 1.0 7 2.4 — 100 2,539 — — — — Rwanda 12.6 32 6 2.6 -1 16.6 24.3 32 4.2 1,990 19 1,091 53 48 1.9 3 Seychelles 0.1 17 8 1.0 -3 0.1 0.1 13.4 2.4 26,860 57 64,364 — — — — Somalia 15.2 43 11 3.2 -3 21.5 35.9 72 6.3 — 45 1,380 15 14 0.1 0 South Sudan 13.0 37 11 2.6 4 17.9 27.9 69 5.0 1,440 20 — 4 2 2.0 2 Tanzania 59.1 39 7 3.3 -1 83.7 138.1 43 5.2 2,916 34 438 38 32 3.4 5 Uganda 44.1 41 9 3.2 -1 61.6 95.6 43 5.4 1,820 24 639 42 36 4.5 7 Zambia 17.7 39 8 3.1 -0 25.8 45.1 49 5.2 3,920 44 465 49 45 8.8 14 Zimbabwe 14.0 34 10 2.4 -10 17.6 25.6 50 4.0 1,850 32 351 67 66 10.5 16 MIDDLE AFRICA 169 42 10 3.2 -0 245 414 61 5.9 2,780 49 654 20 11 1.1 2 Angola 30.4 45 10 3.5 0 45.4 82.2 44 6.2 6,060 63 620 14 13 1.2 2 Cameroon 25.6 36 10 2.6 0 34.4 51.9 52 4.7 3,640 56 414 34 21 2.5 4 Central African Republic 4.7 36 14 2.2 -10 6.1 8.9 85 4.9 730 41 263 15 12 3.3 4 Chad 15.4 45 13 3.1 1 22.2 36.8 72 6.4 1,920 23 314 6 5 1.0 1 Congo 5.4 33 10 2.3 -5 7.3 11.5 41 4.4 4,880 67 982 30 19 1.9 4 Congo, Dem. Rep. 84.3 43 10 3.3 0 124.3 215.9 67 6.3 870 45 1,188 20 8 0.4 1 Equatorial Guinea 1.3 34 10 2.4 14 1.9 2.8 64 4.7 19,380 71 1,095 13 10 5.4 8 Gabon 2.1 29 8 2.2 3 2.9 3.9 37 3.8 17,010 89 632 31 19 2.3 6 São Tomé and Príncipe 0.2 33 7 2.6 -5 0.3 0.3 38 4.4 3,370 73 2,425 41 37 — — SOUTHERN AFRICA 66 22 9 1.2 3 78 94 38 2.5 12,693 64 468 55 54 14.0 23 Botswana 2.2 22 10 1.2 3 2.6 3.2 31 2.6 16,990 70 564 53f 51f 18.4 27 eSwatini 1.4 29 10 1.9 -1 1.7 2.1 50 3.3 8,520 24 795 66 66 19.3 35 Lesotho 2.3 29 13 1.6 -2 2.6 3.2 59 3.3 3,510 28 831 60 60 18.7 29 Namibia 2.5 28 8 2.0 0 3.1 4.2 36 3.4 10,320 48 317 56 55 9.5 14 South Africa 57.7 21 9 1.2 4 67.9 81.8 36 2.4 13,090 66 462 55 54 14.0 23 AMERICAS 1,014 15 7 0.8 1 1,113 1,220 13 2.0 31,140 80 273 74 68 — — NORTHERN AMERICA 365 12 9 0.3 4 396 437 6 1.7 58,737 82 186 74 63 — — Canada 37.2 11 8 0.3 11 41.0 46.9 4.5 1.5 45,750 81 85 85f — — — United States 328.0 12 9 0.3 3 354.7 389.6 5.6 1.8 60,200 82 215 73 63 — — LATIN AMERICA AND THE CARIBBEAN 649 17 6 1.1 -1 717 783 16 2.1 15,273 78 370 74 70 0.7 0 CENTRAL AMERICA 179 19 5 1.4 -1 204 231 19 2.3 15,384 69 641 68 64 0.4 0 Belize 0.4 23 5 1.8 4 0.5 0.6 9 2.6 7,890 45 510 51 49 2.0 1 Costa Rica 5.0 14 5 0.9 2 5.6 6.1 8.0 1.7 16,100 73 2,157 76 75 0.6 0 El Salvador 6.5 20 7 1.3 -7 7.1 8.0 17 2.3 7,540 70 863 72 68 0.8 0 Guatemala 17.2 24 5 1.9 -1 21.2 27.0 28 2.8 8,000 51 1,847 61 49 0.5 0 Honduras 9.0 22 5 1.7 -0 10.3 11.3 25 2.5 4,630 54 884 73 64 0.4 0 Mexico 130.8 19 6 1.3 -1 147.5 164.3 17 2.2 17,740 73 571 67 65 0.4 0 Nicaragua 6.3 20 5 1.5 -4 7.0 7.9 18 2.2 5,680 59 416 80 77 0.3 0 Panama 4.2 19 5 1.4 1 4.9 5.8 14 2.4 21,890 69 739 63 60 1.3 0 CARIBBEAN 43 17 8 0.9 -4 46 47 34 2.2 — 71 830 61 58 1.2 1 Antigua and Barbuda 0.1 15 6 0.9 -0 0.1 0.1 8 1.9 22,980 25 2,564 — — — — Bahamas 0.4 13 6 0.7 3 0.4 0.4 8 1.6 29,790 83 4,963 — — 2.0 1 Barbados 0.3 11 9 0.1 1 0.3 0.3 9 1.6 17,830 31 2,593 59 55 2.2 1 Cuba 11.1 10 9 0.2 -5 10.8 9.8 4.3 1.6 — 77 369 74 72 0.6 0 Curaçao 0.2 10 9 0.1 -3 0.2 0.2 10.7 1.5 — 89 — — — — — Dominica 0.07 12 8 0.4 1 0.08 0.08 20 1.8 10,170 71 1,211 — — — — Dominican Republic 10.8 20 6 1.4 -3 12.0 13.2 31 2.5 15,290 80 1,354 70 68 1.0 0 Grenada 0.1 16 9 0.7 -0 0.1 0.1 19 2.1 14,410 36 3,807 — — — — Guadeloupe 0.4 10 8 0.1 -9 0.4 0.4 8.1 1.7 — 99 1,707 — — — — Haiti 10.8 25 8 1.7 -2 12.4 14.5 59 3.0 1,830 55 1,008 34 32 1.5 2 Jamaica 2.9 17 7 1.0 -6 2.9 2.7 14 2.0 8,690 56 2,416 73 68 2.4 1 Martinique 0.4 9 9 0.0 -9 0.4 0.3 7 1.7 — 89 3,329 — — — — Puerto Rico 3.3 7 9 -0.2 -17 3.2 2.9 7.0 1.1 25,240 94 5,352 84f 72f — — St. Kitts-Nevis 0.05 14 9 0.5 3 0.06 0.06 17 1.8 26,300 31 1,062 — — — — Saint Lucia 0.2 12 6 0.7 -3 0.2 0.2 18 1.5 13,230 19 5,780 56 53 — — St. Vincent and the Grenadines 0.1 16 9 0.7 -6 0.1 0.1 18 2.1 11,770 52 2,210 — — — — Trinidad and Tobago 1.4 13 8 0.5 -1 1.4 1.4 13 1.6 30,520 53 5,450 40 38 1.4 0 Capita, 017c Percent Urban Population per km2 of Arable Land Married Women 15-49 Using Contraceptiond (%) Ages 15-49 With HIV/AIDS (%) Life Expectancy at Birth (Years) Life Expectancy at Age 65 (Years) Population Ages 15 Population Ages 65+ All Methods Modern Methods Males 2017 Females 2017 Males Females Males Females 2018 (%) 2050 (%) 2050 as a Multiple of 2018e 2018 (%) 2050 (%) 2050 as a Multiple of 2018e 27 55 535 62 56 — — 70 74 16 18 26 21 1.1 9 16 2.3 409 79 242 68 59 — — 76 82 18 21 16 16 1.0 18 27 1.5 445 50 704 61 55 — — 69 73 15 17 28 22 1.1 7 14 2.8 840 48 632 54 47 0.9 1.3 67 71 15 17 31 24 1.1 6 12 3.0 723 33 585 37 33 1.5 2.3 63 66 14 15 40 31 1.5 4 7 3.5 65 43 546 36 32 2.7 4.3 61 64 13 15 41 32 1.6 3 6 3.4 57 52 548 52 47 0.1 0.1 71 74 15 16 32 25 1.2 5 12 3.8 050 73 572 57 50 0.1 0.1 77 78 18 19 29 20 1.0 6 17 4.3 360 43 3,350 59 57 0.1 0.1 71 74 13 15 34 25 1.3 4 11 4.7 940 80 376 42 20 — — 69 75 13 16 28 18 0.8 4 17 4.6 063 62 433 67 59 0.1 0.1 75 78 15 17 24 19 0.9 8 18 2.7 482 36 210 12 12 0.2 0.2 63 66 14 15 41 31 1.6 4 6 3.4 490 68 399 63 51 0.1 0.1 75 78 15 18 24 18 0.9 8 20 2.9 — 87 14,150 — — — — 68 72 13 15 28 20 1.1 3 12 6.8 683 40 546 33 28 3.3 5.2 59 62 13 14 43 33 1.6 3 5 3.3 74 46 445 24 18 1.8 2.4 56 58 11 12 44 35 1.7 3 4 3.2 260 45 425 18 13 0.7 1.3 59 62 13 14 43 34 1.6 3 5 3.1 810 29 338 32 30 0.6 1.0 60 61 12 12 47 35 1.8 3 4 3.4 570 66 1,101 61 57 0.5 0.7 71 75 14 16 31 19 0.7 4 12 3.2 820 51 859 24 19 1.9 3.7 52 55 11 12 43 35 1.7 3 4 2.8 670 61 494 9 8 1.4 1.9 60 63 12 13 46 33 1.7 2 4 4.0 490 56 627 33 27 1.0 2.3 62 64 12 13 39 30 1.3 3 6 3.3 270 35 383 9 8 1.1 1.9 58 61 12 12 45 33 1.5 4 5 2.7 700 43 636 16 14 2.6 4.1 56 59 12 12 42 32 1.4 3 5 3.3 710 51 971 31 31 1.0 1.8 62 64 12 13 42 32 1.6 3 5 3.6 160 42 303 16 15 0.9 1.6 58 62 12 12 47 36 1.8 2 4 3.8 900 54 1,009 18 16 0.4 0.3 62 65 12 13 40 32 1.6 3 6 3.6 990 16 132 19 18 0.3 0.3 59 61 12 13 50 43 2.4 3 3 2.9 680 50 576 24 16 2.5 3.0 53 54 11 11 44 35 1.7 3 4 3.1 620 46 509 28 26 0.3 0.6 65 69 13 14 43 33 1.6 3 5 3.8 480 41 487 17 16 1.1 1.6 51 52 10 10 42 29 1.2 3 5 3.1 620 42 302 20 17 1.5 2.7 59 61 12 12 42 32 1.5 3 5 3.5 92 28 651 41 38 3.4 5.6 62 66 14 15 43 32 1.5 3 5 3.5 770 13 987 29 23 0.8 1.4 59 62 13 14 46 36 2.1 2 4 4.2 570 29 1,281 19 14 0.1 0.1 62 65 12 14 40 30 1.3 3 6 3.5 — 78 48,550 19 18 1.1 1.5 61 64 14 15 32 21 0.9 4 10 3.3 500 40 865 8 7 0.4 0.7 62 68 13 14 41 30 1.1 4 6 2.3 890 20 711 37 35 0.7 1.2 64 67 14 15 41 26 1.1 4 7 3.3 250 32 878 62 60 3.5 6.2 65 69 14 16 41 29 1.3 3 7 5.1 510 37 750 40 33 0.4 0.2 64 68 13 14 41 32 1.6 3 6 4.0 180 17 502 59 58 7.4 11.7 61 66 14 15 44 32 1.4 3 5 3.2 570 41 1,710 64 32 — — 71 78 15 19 19 14 0.7 11 24 2.2 — 46 2,970 — — — — 74 77 18 22 44 27 1.3 3 10 8.1 200 32 540 27 25 9.9 15.0 56 60 13 14 45 35 1.7 3 4 3.0 — 100 2,539 — — — — 78 84 18 22 24 17 0.8 11 25 2.6 990 19 1,091 53 48 1.9 3.4 65 69 14 15 40 27 1.3 3 8 5.0 860 57 64,364 — — — — 68 78 14 18 22 18 0.8 8 23 2.8 — 45 1,380 15 14 0.1 0.1 55 58 13 13 47 38 1.9 3 3 2.9 440 20 — 4 2 2.0 2.9 56 58 13 14 42 32 1.7 3 5 3.0 916 34 438 38 32 3.4 5.5 64 67 14 15 45 36 1.9 3 5 3.6 820 24 639 42 36 4.5 7.3 62 64 13 14 48 36 1.6 3 4 3.0 920 44 465 49 45 8.8 14.3 59 64 14 15 45 36 2.0 2 4 4.5 MENT DATA AND ESTIMATES FOR THE COUNTRIES, TERRITORIES, AND REGIONS OF THE WORLDPOPULATION, HEALTH, AND ENVIRONMENT DATA AND ESTIMATES FOR THE COUNTRIES, TERRITORIES, AND REGIONS OF THE WORLD
  • 13.
    © 2018 PopulationReference Bureau See notes on page 18 2018 WORLD POPULATION DATA SHEET 12 Dominican Republic 10.8 20 6 1.4 -3 12.0 13.2 31 2.5 15,290 80 1,354 70 68 1.0 0 Grenada 0.1 16 9 0.7 -0 0.1 0.1 19 2.1 14,410 36 3,807 — — — — Guadeloupe 0.4 10 8 0.1 -9 0.4 0.4 8.1 1.7 — 99 1,707 — — — — Haiti 10.8 25 8 1.7 -2 12.4 14.5 59 3.0 1,830 55 1,008 34 32 1.5 2 Jamaica 2.9 17 7 1.0 -6 2.9 2.7 14 2.0 8,690 56 2,416 73 68 2.4 1 Martinique 0.4 9 9 0.0 -9 0.4 0.3 7 1.7 — 89 3,329 — — — — Puerto Rico 3.3 7 9 -0.2 -17 3.2 2.9 7.0 1.1 25,240 94 5,352 84f 72f — — St. Kitts-Nevis 0.05 14 9 0.5 3 0.06 0.06 17 1.8 26,300 31 1,062 — — — — Saint Lucia 0.2 12 6 0.7 -3 0.2 0.2 18 1.5 13,230 19 5,780 56 53 — — St. Vincent and the Grenadines 0.1 16 9 0.7 -6 0.1 0.1 18 2.1 11,770 52 2,210 — — — — Trinidad and Tobago 1.4 13 8 0.5 -1 1.4 1.4 13 1.6 30,520 53 5,450 40 38 1.4 0 SOUTH AMERICA 427 16 6 1.0 -0 467 505 13 2.0 15,509 83 300 79 74 0.7 0 Argentina 44.5 17 8 1.0 -0 49.4 56.4 10.1 2.3 20,270 92 114 81f 78f 0.6 0 Bolivia 11.3 23 7 1.6 -1 13.3 16.5 37 2.9 7,330 69 253 67 45 0.4 0 Brazil 209.4 14 6 0.8 0 223.9 231.0 11 1.7 15,160 86 262 80 78 0.8 0 Chile 18.6 14 6 0.8 2 19.6 20.2 6.9 1.8 23,150 87 1,413 76 70 0.8 0 Colombia 49.8 15 6 0.9 -1 55.5 61.5 14 2.0 14,170 77 2,951 81 76 0.7 0 Ecuador 17.0 20 5 1.5 -0 19.7 23.2 19 2.5 11,350 64 1,595 80 72 0.5 0 French Guiana 0.3 27 4 2.3 4 0.4 0.5 9 3.6 — 85 2,131 — — — — Guyana 0.8 21 8 1.2 -7 0.8 0.8 31 2.5 8,120 27 186 34 33 1.7 1 Paraguay 6.9 21 6 1.5 -2 7.8 8.9 17 2.5 9,180 61 144 68 67 0.6 0 Peru 32.2 19 6 1.4 -1 36.4 41.1 16 2.4 12,890 78 775 76 54 0.5 0 Suriname 0.6 18 7 1.1 -2 0.6 0.6 16 2.4 14,290 66 874 48 47 1.3 1 Uruguay 3.5 14 9 0.5 -1 3.6 3.7 11.5 2.0 21,870 95 145 80f 78f 0.9 0 Venezuela 31.8 19 5 1.4 -1 36.1 40.5 12.5 2.4 17,440 88 1,179 75 — — — Population (millions) mid-2018 Births per 1,000 Population Deaths per 1,000 Population Rate of Natural Increase (%) Net Migration Rate Population (millions) Infant Mortality Ratea Total Fertility Rateb GNI per Capita, PPP 2017c Percent Urban Population per km2 of Arable Land Married Women 15-49 Ages 15-49 With HIV/AI mid-2030 mid-2050 Using Contraceptiond (%) Males 2017 Female All Methods Modern Methods ASIA 4,536 17 7 1.1 -0 4,943 5,253 26 2.1 13,714 49 915 65 59 — ASIA (EXCL. CHINA) 3,134 19 6 1.3 -1 3,515 3,900 31 2.3 12,210 45 832 56 48 0.3 0 WESTERN ASIA 272 21 5 1.6 1 329 400 22 2.7 28,686 71 701 54 37 — Armenia 3.0 13 9 0.4 -8 2.8 2.4 8 1.6 10,060 64 664 57 28 0.2 0 Azerbaijan 9.9 15 6 0.9 0 10.7 11.1 11 1.9 16,650 53 513 51 14 0.2 0 Bahrain 1.5 14 2 1.1 23 1.9 2.1 6 1.9 42,930 89 96,054 — — 0.1 0 Cyprus 1.2 11 6 0.5 3 1.3 1.4 3 1.4 33,609 68 1,202 — — 0.2 0 Georgia 3.9 14 13 0.2 -1 3.7 3.4 10 2.1 10,120 58 872 53 35 0.7 0 Iraq 40.2 31 4 2.7 2 53.4 76.5 38 4.1 17,010 70 798 53 36 — Israel 8.5 21 5 1.6 3 10.8 14.4 3.0 3.1 38,060 91 2,857 — — — Jordan 10.2 24 3 2.1 0 12.0 13.4 15 3.2 9,110 90 4,462 61 42 — Kuwait 4.2 14 2 1.3 15 4.9 5.6 8 1.5 83,310 100 54,508 — — 0.1 0 Lebanon 6.1 14 5 0.9 -1 5.5 5.6 7 1.7 14,690 89 4,621 55 47 0.1 0 Oman 4.7 20 2 1.8 32 5.8 7.1 9 2.9 40,240 85 12,326 30 19 — Palestinian Territory 4.8 31 4 2.7 -2 6.2 8.4 18 4.1 5,560 76 7,566 57 44 — Qatar 2.7 10 1 0.9 28 3.2 3.8 6 1.9 128,060 100 20,571 38 34 0.2 0 Saudi Arabia 33.4 17 3 1.4 11 39.3 44.9 12 2.4 54,770 84 954 25 21 — Syria 18.3 22 6 1.6 -21 26.6 34.0 17 2.9 — 54 392 54 38 — Turkey 81.3 16 5 1.1 0 93.3 104.7 9 2.1 27,550 75 394 74 47 — United Arab Emirates 9.5 10 2 0.8 8 11.1 13.2 6 1.8 74,410 87 25,444 — — — Yemen 28.9 32 6 2.5 -1 36.8 48.3 44 4.0 2,380 37 2,317 34 29 — SOUTH CENTRAL ASIA 1,981 21 6 1.5 -1 2,239 2,508 36 2.4 7,317 36 767 54 46 0.2 0 CENTRAL ASIA 72 24 6 1.8 -1 84 101 17 2.9 11,371 48 192 55 53 0.3 0 Kazakhstan 18.4 23 7 1.5 -1 20.5 24.7 9 3.0 23,440 57 63 56 54 0.3 0 Kyrgyzstan 6.1 26 6 2.1 -1 7.0 8.1 17 3.1 3,620 34 479 42 40 0.3 0 Tajikistan 9.1 33 5 2.7 -2 10.7 12.9 27 3.8 3,670 27 1,241 29 27 0.4 0 Turkmenistan 5.9 26 7 1.9 -1 7.0 8.8 44 3.2 17,320 52 303 50 47 — Uzbekistan 32.9 22 5 1.7 -1 38.7 46.5 11 2.5 7,130 51 748 65 62 0.3 0 Population (millions) mid-2018 Births per 1,000 Population Deaths per 1,000 Population Rate of Natural Increase (%) Net Migration Rate Population (millions) Infant Mortality Ratea Total Fertility Rateb GNI per Capita, PPP 2017c Percent Urban Population per km2 of Arable Land Married Women 15-49 Using Contraceptiond (%) Ages 15-49 With HIV/AI mid-2030 mid-2050 All Methods Modern Methods Males 2017 Female Saint Lucia 0.2 12 6 0.7 -3 0.2 0.2 18 1.5 13,230 19 5,780 56 53 — — St. Vincent and the Grenadines 0.1 16 9 0.7 -6 0.1 0.1 18 2.1 11,770 52 2,210 — — — — Trinidad and Tobago 1.4 13 8 0.5 -1 1.4 1.4 13 1.6 30,520 53 5,450 40 38 1.4 0 SOUTH AMERICA 427 16 6 1.0 -0 467 505 13 2.0 15,509 83 300 79 74 0.7 0 Argentina 44.5 17 8 1.0 -0 49.4 56.4 10.1 2.3 20,270 92 114 81f 78f 0.6 0 Bolivia 11.3 23 7 1.6 -1 13.3 16.5 37 2.9 7,330 69 253 67 45 0.4 0 Brazil 209.4 14 6 0.8 0 223.9 231.0 11 1.7 15,160 86 262 80 78 0.8 0 Chile 18.6 14 6 0.8 2 19.6 20.2 6.9 1.8 23,150 87 1,413 76 70 0.8 0 Colombia 49.8 15 6 0.9 -1 55.5 61.5 14 2.0 14,170 77 2,951 81 76 0.7 0 Ecuador 17.0 20 5 1.5 -0 19.7 23.2 19 2.5 11,350 64 1,595 80 72 0.5 0 French Guiana 0.3 27 4 2.3 4 0.4 0.5 9 3.6 — 85 2,131 — — — — Guyana 0.8 21 8 1.2 -7 0.8 0.8 31 2.5 8,120 27 186 34 33 1.7 1 Paraguay 6.9 21 6 1.5 -2 7.8 8.9 17 2.5 9,180 61 144 68 67 0.6 0 Peru 32.2 19 6 1.4 -1 36.4 41.1 16 2.4 12,890 78 775 76 54 0.5 0 Suriname 0.6 18 7 1.1 -2 0.6 0.6 16 2.4 14,290 66 874 48 47 1.3 1 Uruguay 3.5 14 9 0.5 -1 3.6 3.7 11.5 2.0 21,870 95 145 80f 78f 0.9 0 Venezuela 31.8 19 5 1.4 -1 36.1 40.5 12.5 2.4 17,440 88 1,179 75 — — — Population (millions) mid-2018 Births per 1,000 Population Deaths per 1,000 Population Rate of Natural Increase (%) Net Migration Rate Population (millions) Infant Mortality Ratea Total Fertility Rateb GNI per Capita, PPP 2017c Percent Urban Population per km2 of Arable Land Married Women 15-49 Ages 15-49 With HIV/AID mid-2030 mid-2050 Using Contraceptiond (%) Males 2017 Female All Methods Modern Methods ASIA 4,536 17 7 1.1 -0 4,943 5,253 26 2.1 13,714 49 915 65 59 — ASIA (EXCL. CHINA) 3,134 19 6 1.3 -1 3,515 3,900 31 2.3 12,210 45 832 56 48 0.3 0 WESTERN ASIA 272 21 5 1.6 1 329 400 22 2.7 28,686 71 701 54 37 — Armenia 3.0 13 9 0.4 -8 2.8 2.4 8 1.6 10,060 64 664 57 28 0.2 0 Azerbaijan 9.9 15 6 0.9 0 10.7 11.1 11 1.9 16,650 53 513 51 14 0.2 0 Bahrain 1.5 14 2 1.1 23 1.9 2.1 6 1.9 42,930 89 96,054 — — 0.1 0 Cyprus 1.2 11 6 0.5 3 1.3 1.4 3 1.4 33,609 68 1,202 — — 0.2 0 Georgia 3.9 14 13 0.2 -1 3.7 3.4 10 2.1 10,120 58 872 53 35 0.7 0 Iraq 40.2 31 4 2.7 2 53.4 76.5 38 4.1 17,010 70 798 53 36 — Israel 8.5 21 5 1.6 3 10.8 14.4 3.0 3.1 38,060 91 2,857 — — — Jordan 10.2 24 3 2.1 0 12.0 13.4 15 3.2 9,110 90 4,462 61 42 — Kuwait 4.2 14 2 1.3 15 4.9 5.6 8 1.5 83,310 100 54,508 — — 0.1 0 Lebanon 6.1 14 5 0.9 -1 5.5 5.6 7 1.7 14,690 89 4,621 55 47 0.1 0 Oman 4.7 20 2 1.8 32 5.8 7.1 9 2.9 40,240 85 12,326 30 19 — Palestinian Territory 4.8 31 4 2.7 -2 6.2 8.4 18 4.1 5,560 76 7,566 57 44 — Qatar 2.7 10 1 0.9 28 3.2 3.8 6 1.9 128,060 100 20,571 38 34 0.2 0 Saudi Arabia 33.4 17 3 1.4 11 39.3 44.9 12 2.4 54,770 84 954 25 21 — Syria 18.3 22 6 1.6 -21 26.6 34.0 17 2.9 — 54 392 54 38 — Turkey 81.3 16 5 1.1 0 93.3 104.7 9 2.1 27,550 75 394 74 47 — United Arab Emirates 9.5 10 2 0.8 8 11.1 13.2 6 1.8 74,410 87 25,444 — — — Yemen 28.9 32 6 2.5 -1 36.8 48.3 44 4.0 2,380 37 2,317 34 29 — SOUTH CENTRAL ASIA 1,981 21 6 1.5 -1 2,239 2,508 36 2.4 7,317 36 767 54 46 0.2 0 CENTRAL ASIA 72 24 6 1.8 -1 84 101 17 2.9 11,371 48 192 55 53 0.3 0 Kazakhstan 18.4 23 7 1.5 -1 20.5 24.7 9 3.0 23,440 57 63 56 54 0.3 0 Kyrgyzstan 6.1 26 6 2.1 -1 7.0 8.1 17 3.1 3,620 34 479 42 40 0.3 0 Tajikistan 9.1 33 5 2.7 -2 10.7 12.9 27 3.8 3,670 27 1,241 29 27 0.4 0 Turkmenistan 5.9 26 7 1.9 -1 7.0 8.8 44 3.2 17,320 52 303 50 47 — Uzbekistan 32.9 22 5 1.7 -1 38.7 46.5 11 2.5 7,130 51 748 65 62 0.3 0 SOUTH ASIA 1,909 21 6 1.5 -1 2,155 2,407 37 2.4 7,163 36 865 53 46 0.2 0 Afghanistan 36.5 35 7 2.8 -0 48.5 68.9 57 4.8 2,000 25 470 23 20 — Bangladesh 166.4 19 5 1.4 -3 185.6 201.9 28 2.1 4,040 37 2,143 62 54 0.1 0 Bhutan 0.8 18 6 1.2 1 0.9 1.0 26 2.1 8,850 39 815 66 65 — India 1,371.3 20 6 1.4 -0 1,532.3 1,680.1 34 2.3 7,060 34 876 54 48 0.2 0 Iran 81.6 19 5 1.4 -3 88.4 93.1 5 2.0 21,010 74 555 77 57 0.2 0 Maldives 0.4 20 3 1.7 6 0.5 0.6 8 2.4 15,350 39 10,978 35 27 — Population (millions) mid-2018 Births per 1,000 Population Deaths per 1,000 Population Rate of Natural Increase (%) Net Migration Rate Population (millions) Infant Mortality Ratea Total Fertility Rateb GNI per Capita, PPP 2017c Percent Urban Population per km2 of Arable Land Married Women 15-49 Using Contraceptiond (%) Ages 15-49 With HIV/AID mid-2030 mid-2050 All Methods Modern Methods Males 2017 Female Population (millions) mid-2018 Births per 1,000 Population Deaths per 1,000 Population Rate of Natural Increase (%) Net Migration Rate Population (millions) Infant Mortality Ratea Total Fertility Rateb GNI per Capita, PPP 2017c Percent Urban Population per km2 of Arable Land Married Women 15-49 Using Contraceptiond (%) Ages 15-49 With HIV/AID mid-2030 mid-2050 All Methods Modern Methods Males 2017 Female WORLD 7,621 19 7 1.2 0 8,571 9,852 31 2.4 16,927 55 535 62 56 — — MORE DEVELOPED 1,266 10 10 0.0 3 1,301 1,312 5 1.6 43,409 79 242 68 59 — — LESS DEVELOPED 6,355 21 7 1.4 -1 7,270 8,540 34 2.6 11,445 50 704 61 55 — — LESS DEVELOPED (Excl. China) 4,953 23 7 1.7 -1 5,841 7,187 37 2.8 9,840 48 632 54 47 0.9 1 LEAST DEVELOPED 1,027 33 8 2.5 -1 1,342 1,954 49 4.2 2,723 33 585 37 33 1.5 2 AFRICA 1,284 35 9 2.6 -1 1,714 2,586 50 4.6 4,965 43 546 36 32 2.7 4 NORTHERN AFRICA 235 26 6 2.0 -1 289 385 24 3.3 10,557 52 548 52 47 0.1 0 Algeria 42.7 26 4 2.2 -0 51.3 64.3 22 3.1 15,050 73 572 57 50 0.1 0 Egypt 97.0 27 6 2.1 -1 120.8 166.5 15 3.4 11,360 43 3,350 59 57 0.1 0 Libya 6.5 20 5 1.4 -4 7.3 8.1 22 2.3 19,940 80 376 42 20 — — Morocco 35.2 18 5 1.2 -2 39.3 43.6 22 2.2 8,063 62 433 67 59 0.1 0 Sudan 41.7 34 8 2.7 -2 56.8 88.1 45 4.7 4,482 36 210 12 12 0.2 0 Tunisia 11.6 19 6 1.4 -0 12.7 13.8 15 2.3 11,490 68 399 63 51 0.1 0 Western Sahara 0.6 20 5 1.5 7 0.7 0.9 30 2.3 — 87 14,150 — — — — SUB-SAHARAN AFRICA 1,049 37 9 2.7 -0 1,425 2,200 54 4.9 3,683 40 546 33 28 3.3 5 WESTERN AFRICA 382 38 11 2.7 -1 518 809 62 5.3 4,174 46 445 24 18 1.8 2 Benin 11.5 37 9 2.8 -0 15.6 23.9 63 5.0 2,260 45 425 18 13 0.7 1 Burkina Faso 20.3 40 9 3.1 -1 28.9 48.5 57 5.5 1,810 29 338 32 30 0.6 1 Cabo Verde 0.6 19 5 1.4 -3 0.6 0.6 21 2.2 6,570 66 1,101 61 57 0.5 0 Côte d’Ivoire 24.9 35 12 2.3 0 33.3 51.4 62 4.6 3,820 51 859 24 19 1.9 3 Gambia 2.2 39 8 3.1 -1 3.1 5.0 46 5.4 1,670 61 494 9 8 1.4 1 Ghana 29.5 30 8 2.2 -1 37.3 51.3 37 3.9 4,490 56 627 33 27 1.0 2 Guinea 11.9 39 11 2.8 -2 16.3 25.3 68 4.8 2,270 35 383 9 8 1.1 1 Guinea-Bissau 1.9 36 11 2.6 -1 2.5 3.6 73 4.6 1,700 43 636 16 14 2.6 4 Liberia 4.9 33 8 2.5 -1 6.5 9.8 50 4.2 710 51 971 31 31 1.0 1 Mali 19.4 45 10 3.5 -4 27.5 44.8 56 6.0 2,160 42 303 16 15 0.9 1 Mauritania 4.5 34 8 2.6 1 6.1 9.0 65 4.6 3,900 54 1,009 18 16 0.4 0 Niger 22.2 48 10 3.8 -0 34.0 63.1 60 7.2 990 16 132 19 18 0.3 0 Nigeria 195.9 39 12 2.6 -0 264.1 410.6 67 5.5 5,680 50 576 24 16 2.5 3 Senegal 16.3 33 6 2.7 -1 22.1 34.0 42 4.6 2,620 46 509 28 26 0.3 0 Sierra Leone 7.7 33 13 2.0 -1 9.7 13.0 84 4.2 1,480 41 487 17 16 1.1 1 Togo 8.0 34 9 2.5 -0 10.5 15.3 52 4.5 1,620 42 302 20 17 1.5 2 EASTERN AFRICA 432 36 8 2.8 -1 584 883 45 4.7 2,192 28 651 41 38 3.4 5 Burundi 11.8 41 11 3.0 -0 17.2 30.4 47 5.5 770 13 987 29 23 0.8 1 Comoros 0.8 33 7 2.5 -2 1.1 1.5 55 4.3 1,570 29 1,281 19 14 0.1 0 Djibouti 1.0 23 8 1.5 1 1.1 1.3 52 2.9 — 78 48,550 19 18 1.1 1 Eritrea 6.0 30 7 2.3 -15 6.8 8.9 46 4.1 1,500 40 865 8 7 0.4 0 Ethiopia 107.5 33 7 2.6 -0 139.6 190.9 40 4.4 1,890 20 711 37 35 0.7 1 Kenya 51.0 31 6 2.6 -0 67.0 95.5 36 3.9 3,250 32 878 62 60 3.5 6 Madagascar 26.3 32 6 2.6 -0 35.6 53.8 32 4.1 1,510 37 750 40 33 0.4 0 Malawi 19.1 34 7 2.6 -1 25.6 37.4 42 4.2 1,180 17 502 59 58 7.4 11 Mauritius 1.3 11 8 0.3 -1 1.3 1.2 11.8 1.4 22,570 41 1,710 64 32 — — Mayotte 0.3 39 3 3.6 -0 0.4 0.6 4 5.1 — 46 2,970 — — — — Mozambique 30.5 39 10 2.9 -0 42.4 67.8 65 5.3 1,200 32 540 27 25 9.9 15 Réunion 0.9 16 6 1.0 -4 0.9 1.0 7 2.4 — 100 2,539 — — — — Rwanda 12.6 32 6 2.6 -1 16.6 24.3 32 4.2 1,990 19 1,091 53 48 1.9 3 Seychelles 0.1 17 8 1.0 -3 0.1 0.1 13.4 2.4 26,860 57 64,364 — — — — Somalia 15.2 43 11 3.2 -3 21.5 35.9 72 6.3 — 45 1,380 15 14 0.1 0 South Sudan 13.0 37 11 2.6 4 17.9 27.9 69 5.0 1,440 20 — 4 2 2.0 2 Tanzania 59.1 39 7 3.3 -1 83.7 138.1 43 5.2 2,916 34 438 38 32 3.4 5 Uganda 44.1 41 9 3.2 -1 61.6 95.6 43 5.4 1,820 24 639 42 36 4.5 7 Zambia 17.7 39 8 3.1 -0 25.8 45.1 49 5.2 3,920 44 465 49 45 8.8 14 POPULATION, HEALTH, AND ENVIRONMENT DATA AND ESTIMATES FOR THE COUNTRIESPOPULATION, HEALTH, AND ENVIRONMENT DATA AND ESTIMATES FOR THE COUNTRIES, TERRITORIES, AND REGIONS OF THE WORLD
  • 14.
    © 2018 PopulationReference Bureau See notes on page 18 2018 WORLD POPULATION DATA SHEET 13 290 80 1,354 70 68 1.0 0.8 71 77 17 20 30 19 0.8 7 16 2.9 410 36 3,807 — — — — 74 79 15 16 26 18 0.7 7 17 2.4 — 99 1,707 — — — — 77 84 19 23 19 15 0.7 18 29 1.6 830 55 1,008 34 32 1.5 2.3 62 67 14 15 33 23 0.9 4 10 3.3 690 56 2,416 73 68 2.4 1.2 74 78 17 20 23 16 0.6 9 22 2.2 — 89 3,329 — — — — 78 84 19 23 17 15 0.8 20 32 1.4 240 94 5,352 84f 72f — — 78 84 18 22 16 13 0.7 19 28 1.3 300 31 1,062 — — — — 73 78 — — 21 — — 8 — — 230 19 5,780 56 53 — — 75 83 16 20 20 13 0.7 11 25 2.3 770 52 2,210 — — — — 70 75 15 17 24 16 0.7 8 19 2.6 520 53 5,450 40 38 1.4 0.8 70 76 13 17 19 16 0.8 10 21 2.1 09 83 300 79 74 0.7 0.3 72 79 17 20 24 17 0.8 8 20 2.9 270 92 114 81f 78f 0.6 0.3 74 80 16 20 25 19 1.0 11 18 2.0 330 69 253 67 45 0.4 0.2 67 72 17 19 32 22 1.0 7 12 2.7 160 86 262 80 78 0.8 0.4 72 79 17 20 22 15 0.7 8 23 3.1 150 87 1,413 76 70 0.8 0.3 77 82 18 21 21 15 0.8 11 24 2.3 170 77 2,951 81 76 0.7 0.2 73 79 17 19 26 16 0.7 8 21 3.2 350 64 1,595 80 72 0.5 0.2 74 79 19 20 29 20 0.9 7 16 3.1 — 85 2,131 — — — — 75 81 17 21 33 25 1.4 5 13 4.6 120 27 186 34 33 1.7 1.7 64 69 12 13 29 21 0.7 5 12 2.3 180 61 144 68 67 0.6 0.3 71 75 17 19 30 20 0.9 6 13 2.7 890 78 775 76 54 0.5 0.2 72 78 17 19 27 19 0.9 7 17 3.2 290 66 874 48 47 1.3 1.4 68 75 14 17 27 19 0.8 7 15 2.5 870 95 145 80f 78f 0.9 0.3 74 81 16 21 21 17 0.8 15 22 1.6 440 88 1,179 75 — — — 73 79 16 19 26 19 0.9 7 16 2.9 Capita, 017c Percent Urban Population per km2 of Arable Land Married Women 15-49 Ages 15-49 With HIV/AIDS (%) Life Expectancy at Birth (Years) Life Expectancy at Age 65 (Years) Population Ages 15 Population Ages 65+ Using Contraceptiond (%) Males 2017 Females 2017 Males Females Males Females 2018 (%) 2050 (%) 2050 as a Multiple of 2018e 2018 (%) 2050 (%) 2050 as a Multiple of 2018eAll Methods Modern Methods 714 49 915 65 59 — — 71 74 15 18 24 18 0.9 8 18 2.5 210 45 832 56 48 0.3 0.2 69 73 15 18 27 19 0.9 7 15 2.7 686 71 701 54 37 — — 72 77 15 18 29 22 1.1 6 13 3.6 060 64 664 57 28 0.2 0.1 72 78 15 17 20 15 0.6 11 23 1.7 650 53 513 51 14 0.2 0.1 73 78 13 16 23 17 0.9 7 17 2.9 930 89 96,054 — — 0.1 0.1 76 78 15 16 20 13 0.9 3 13 6.8 609 68 1,202 — — 0.2 0.1 80 85 17 20 16 13 1.0 16 26 1.9 120 58 872 53 35 0.7 0.2 69 78 13 17 20 17 0.8 15 23 1.3 010 70 798 53 36 — — 68 72 13 15 40 32 1.5 3 6 3.4 060 91 2,857 — — — — 81 84 20 22 28 23 1.4 11 17 2.6 110 90 4,462 61 42 — — 73 76 15 17 35 24 0.9 4 11 4.1 310 100 54,508 — — 0.1 0.1 74 76 14 14 21 17 1.1 2 16 9.6 690 89 4,621 55 47 0.1 0.1 77 79 17 20 24 14 0.5 7 23 3.2 240 85 12,326 30 19 — — 75 79 16 19 22 15 1.0 3 14 8.2 560 76 7,566 57 44 — — 72 75 14 16 39 28 1.3 3 7 3.8 060 100 20,571 38 34 0.2 0.1 77 80 17 18 14 11 1.2 1 13 16.2 770 84 954 25 21 — — 73 76 14 16 25 17 0.9 3 17 7.0 — 54 392 54 38 — — 64 77 14 17 37 22 1.1 4 12 5.2 550 75 394 74 47 — — 75 81 15 19 24 17 0.9 9 21 3.1 410 87 25,444 — — — — 77 79 16 17 14 12 1.2 1 14 17.5 380 37 2,317 34 29 — — 64 66 12 14 40 26 1.1 3 6 3.4 317 36 767 54 46 0.2 0.2 68 71 14 15 28 20 0.9 6 13 2.9 371 48 192 55 53 0.3 0.2 69 76 13 16 29 22 1.1 5 12 3.5 440 57 63 56 54 0.3 0.1 68 77 12 16 25 22 1.2 7 13 2.7 620 34 479 42 40 0.3 0.1 67 75 13 16 32 24 1.0 5 11 3.2 670 27 1,241 29 27 0.4 0.1 68 74 13 17 35 27 1.1 3 9 3.7 320 52 303 50 47 — — 64 71 13 15 31 23 1.1 4 11 3.8 130 51 748 65 62 0.3 0.2 71 76 13 16 28 19 1.0 4 13 4.3 Capita, 017c Percent Urban Population per km2 of Arable Land Married Women 15-49 Using Contraceptiond (%) Ages 15-49 With HIV/AIDS (%) Life Expectancy at Birth (Years) Life Expectancy at Age 65 (Years) Population Ages 15 Population Ages 65+ All Methods Modern Methods Males 2017 Females 2017 Males Females Males Females 2018 (%) 2050 (%) 2050 as a Multiple of 2018e 2018 (%) 2050 (%) 2050 as a Multiple of 2018e 30 19 5,780 56 53 — — 75 83 16 20 20 13 0.7 11 25 2.3 70 52 2,210 — — — — 70 75 15 17 24 16 0.7 8 19 2.6 20 53 5,450 40 38 1.4 0.8 70 76 13 17 19 16 0.8 10 21 2.1 09 83 300 79 74 0.7 0.3 72 79 17 20 24 17 0.8 8 20 2.9 70 92 114 81f 78f 0.6 0.3 74 80 16 20 25 19 1.0 11 18 2.0 30 69 253 67 45 0.4 0.2 67 72 17 19 32 22 1.0 7 12 2.7 60 86 262 80 78 0.8 0.4 72 79 17 20 22 15 0.7 8 23 3.1 50 87 1,413 76 70 0.8 0.3 77 82 18 21 21 15 0.8 11 24 2.3 70 77 2,951 81 76 0.7 0.2 73 79 17 19 26 16 0.7 8 21 3.2 50 64 1,595 80 72 0.5 0.2 74 79 19 20 29 20 0.9 7 16 3.1 — 85 2,131 — — — — 75 81 17 21 33 25 1.4 5 13 4.6 20 27 186 34 33 1.7 1.7 64 69 12 13 29 21 0.7 5 12 2.3 80 61 144 68 67 0.6 0.3 71 75 17 19 30 20 0.9 6 13 2.7 90 78 775 76 54 0.5 0.2 72 78 17 19 27 19 0.9 7 17 3.2 90 66 874 48 47 1.3 1.4 68 75 14 17 27 19 0.8 7 15 2.5 70 95 145 80f 78f 0.9 0.3 74 81 16 21 21 17 0.8 15 22 1.6 40 88 1,179 75 — — — 73 79 16 19 26 19 0.9 7 16 2.9 Capita, 017c Percent Urban Population per km2 of Arable Land Married Women 15-49 Ages 15-49 With HIV/AIDS (%) Life Expectancy at Birth (Years) Life Expectancy at Age 65 (Years) Population Ages 15 Population Ages 65+ Using Contraceptiond (%) Males 2017 Females 2017 Males Females Males Females 2018 (%) 2050 (%) 2050 as a Multiple of 2018e 2018 (%) 2050 (%) 2050 as a Multiple of 2018eAll Methods Modern Methods 14 49 915 65 59 — — 71 74 15 18 24 18 0.9 8 18 2.5 210 45 832 56 48 0.3 0.2 69 73 15 18 27 19 0.9 7 15 2.7 86 71 701 54 37 — — 72 77 15 18 29 22 1.1 6 13 3.6 060 64 664 57 28 0.2 0.1 72 78 15 17 20 15 0.6 11 23 1.7 650 53 513 51 14 0.2 0.1 73 78 13 16 23 17 0.9 7 17 2.9 930 89 96,054 — — 0.1 0.1 76 78 15 16 20 13 0.9 3 13 6.8 609 68 1,202 — — 0.2 0.1 80 85 17 20 16 13 1.0 16 26 1.9 120 58 872 53 35 0.7 0.2 69 78 13 17 20 17 0.8 15 23 1.3 010 70 798 53 36 — — 68 72 13 15 40 32 1.5 3 6 3.4 060 91 2,857 — — — — 81 84 20 22 28 23 1.4 11 17 2.6 110 90 4,462 61 42 — — 73 76 15 17 35 24 0.9 4 11 4.1 310 100 54,508 — — 0.1 0.1 74 76 14 14 21 17 1.1 2 16 9.6 690 89 4,621 55 47 0.1 0.1 77 79 17 20 24 14 0.5 7 23 3.2 240 85 12,326 30 19 — — 75 79 16 19 22 15 1.0 3 14 8.2 560 76 7,566 57 44 — — 72 75 14 16 39 28 1.3 3 7 3.8 060 100 20,571 38 34 0.2 0.1 77 80 17 18 14 11 1.2 1 13 16.2 770 84 954 25 21 — — 73 76 14 16 25 17 0.9 3 17 7.0 — 54 392 54 38 — — 64 77 14 17 37 22 1.1 4 12 5.2 550 75 394 74 47 — — 75 81 15 19 24 17 0.9 9 21 3.1 410 87 25,444 — — — — 77 79 16 17 14 12 1.2 1 14 17.5 380 37 2,317 34 29 — — 64 66 12 14 40 26 1.1 3 6 3.4 317 36 767 54 46 0.2 0.2 68 71 14 15 28 20 0.9 6 13 2.9 71 48 192 55 53 0.3 0.2 69 76 13 16 29 22 1.1 5 12 3.5 440 57 63 56 54 0.3 0.1 68 77 12 16 25 22 1.2 7 13 2.7 620 34 479 42 40 0.3 0.1 67 75 13 16 32 24 1.0 5 11 3.2 670 27 1,241 29 27 0.4 0.1 68 74 13 17 35 27 1.1 3 9 3.7 320 52 303 50 47 — — 64 71 13 15 31 23 1.1 4 11 3.8 130 51 748 65 62 0.3 0.2 71 76 13 16 28 19 1.0 4 13 4.3 63 36 865 53 46 0.2 0.2 68 70 14 15 28 19 0.9 6 13 2.9 000 25 470 23 20 — — 62 65 12 14 44 26 1.1 3 6 4.2 040 37 2,143 62 54 0.1 0.1 70 73 16 18 29 17 0.7 5 16 3.8 850 39 815 66 65 — — 70 70 17 17 27 16 0.7 5 17 4.3 060 34 876 54 48 0.2 0.2 67 70 14 15 28 19 0.8 6 13 2.7 010 74 555 77 57 0.2 0.1 75 77 16 16 24 15 0.7 6 23 4.3 350 39 10,978 35 27 — — 76 78 16 17 23 15 0.8 4 19 5.9 Capita, 017c Percent Urban Population per km2 of Arable Land Married Women 15-49 Using Contraceptiond (%) Ages 15-49 With HIV/AIDS (%) Life Expectancy at Birth (Years) Life Expectancy at Age 65 (Years) Population Ages 15 Population Ages 65+ All Methods Modern Methods Males 2017 Females 2017 Males Females Males Females 2018 (%) 2050 (%) 2050 as a Multiple of 2018e 2018 (%) 2050 (%) 2050 as a Multiple of 2018e Dominican Republic 10.8 20 6 1.4 -3 12.0 13.2 31 2.5 15,290 80 1,354 70 68 1.0 0 Grenada 0.1 16 9 0.7 -0 0.1 0.1 19 2.1 14,410 36 3,807 — — — — Guadeloupe 0.4 10 8 0.1 -9 0.4 0.4 8.1 1.7 — 99 1,707 — — — — Haiti 10.8 25 8 1.7 -2 12.4 14.5 59 3.0 1,830 55 1,008 34 32 1.5 2 Jamaica 2.9 17 7 1.0 -6 2.9 2.7 14 2.0 8,690 56 2,416 73 68 2.4 1 Martinique 0.4 9 9 0.0 -9 0.4 0.3 7 1.7 — 89 3,329 — — — — Puerto Rico 3.3 7 9 -0.2 -17 3.2 2.9 7.0 1.1 25,240 94 5,352 84f 72f — — St. Kitts-Nevis 0.05 14 9 0.5 3 0.06 0.06 17 1.8 26,300 31 1,062 — — — — Saint Lucia 0.2 12 6 0.7 -3 0.2 0.2 18 1.5 13,230 19 5,780 56 53 — — St. Vincent and the Grenadines 0.1 16 9 0.7 -6 0.1 0.1 18 2.1 11,770 52 2,210 — — — — Trinidad and Tobago 1.4 13 8 0.5 -1 1.4 1.4 13 1.6 30,520 53 5,450 40 38 1.4 0 SOUTH AMERICA 427 16 6 1.0 -0 467 505 13 2.0 15,509 83 300 79 74 0.7 0 Argentina 44.5 17 8 1.0 -0 49.4 56.4 10.1 2.3 20,270 92 114 81f 78f 0.6 0 Bolivia 11.3 23 7 1.6 -1 13.3 16.5 37 2.9 7,330 69 253 67 45 0.4 0 Brazil 209.4 14 6 0.8 0 223.9 231.0 11 1.7 15,160 86 262 80 78 0.8 0 Chile 18.6 14 6 0.8 2 19.6 20.2 6.9 1.8 23,150 87 1,413 76 70 0.8 0 Colombia 49.8 15 6 0.9 -1 55.5 61.5 14 2.0 14,170 77 2,951 81 76 0.7 0 Ecuador 17.0 20 5 1.5 -0 19.7 23.2 19 2.5 11,350 64 1,595 80 72 0.5 0 French Guiana 0.3 27 4 2.3 4 0.4 0.5 9 3.6 — 85 2,131 — — — — Guyana 0.8 21 8 1.2 -7 0.8 0.8 31 2.5 8,120 27 186 34 33 1.7 1 Paraguay 6.9 21 6 1.5 -2 7.8 8.9 17 2.5 9,180 61 144 68 67 0.6 0 Peru 32.2 19 6 1.4 -1 36.4 41.1 16 2.4 12,890 78 775 76 54 0.5 0 Suriname 0.6 18 7 1.1 -2 0.6 0.6 16 2.4 14,290 66 874 48 47 1.3 1 Uruguay 3.5 14 9 0.5 -1 3.6 3.7 11.5 2.0 21,870 95 145 80f 78f 0.9 0 Venezuela 31.8 19 5 1.4 -1 36.1 40.5 12.5 2.4 17,440 88 1,179 75 — — — Population (millions) mid-2018 Births per 1,000 Population Deaths per 1,000 Population Rate of Natural Increase (%) Net Migration Rate Population (millions) Infant Mortality Ratea Total Fertility Rateb GNI per Capita, PPP 2017c Percent Urban Population per km2 of Arable Land Married Women 15-49 Ages 15-49 With HIV/AI mid-2030 mid-2050 Using Contraceptiond (%) Males 2017 Female All Methods Modern Methods ASIA 4,536 17 7 1.1 -0 4,943 5,253 26 2.1 13,714 49 915 65 59 — ASIA (EXCL. CHINA) 3,134 19 6 1.3 -1 3,515 3,900 31 2.3 12,210 45 832 56 48 0.3 0 WESTERN ASIA 272 21 5 1.6 1 329 400 22 2.7 28,686 71 701 54 37 — Armenia 3.0 13 9 0.4 -8 2.8 2.4 8 1.6 10,060 64 664 57 28 0.2 0 Azerbaijan 9.9 15 6 0.9 0 10.7 11.1 11 1.9 16,650 53 513 51 14 0.2 0 Bahrain 1.5 14 2 1.1 23 1.9 2.1 6 1.9 42,930 89 96,054 — — 0.1 0 Cyprus 1.2 11 6 0.5 3 1.3 1.4 3 1.4 33,609 68 1,202 — — 0.2 0 Georgia 3.9 14 13 0.2 -1 3.7 3.4 10 2.1 10,120 58 872 53 35 0.7 0 Iraq 40.2 31 4 2.7 2 53.4 76.5 38 4.1 17,010 70 798 53 36 — Israel 8.5 21 5 1.6 3 10.8 14.4 3.0 3.1 38,060 91 2,857 — — — Jordan 10.2 24 3 2.1 0 12.0 13.4 15 3.2 9,110 90 4,462 61 42 — Kuwait 4.2 14 2 1.3 15 4.9 5.6 8 1.5 83,310 100 54,508 — — 0.1 0 Lebanon 6.1 14 5 0.9 -1 5.5 5.6 7 1.7 14,690 89 4,621 55 47 0.1 0 Oman 4.7 20 2 1.8 32 5.8 7.1 9 2.9 40,240 85 12,326 30 19 — Palestinian Territory 4.8 31 4 2.7 -2 6.2 8.4 18 4.1 5,560 76 7,566 57 44 — Qatar 2.7 10 1 0.9 28 3.2 3.8 6 1.9 128,060 100 20,571 38 34 0.2 0 Saudi Arabia 33.4 17 3 1.4 11 39.3 44.9 12 2.4 54,770 84 954 25 21 — Syria 18.3 22 6 1.6 -21 26.6 34.0 17 2.9 — 54 392 54 38 — Turkey 81.3 16 5 1.1 0 93.3 104.7 9 2.1 27,550 75 394 74 47 — United Arab Emirates 9.5 10 2 0.8 8 11.1 13.2 6 1.8 74,410 87 25,444 — — — Yemen 28.9 32 6 2.5 -1 36.8 48.3 44 4.0 2,380 37 2,317 34 29 — SOUTH CENTRAL ASIA 1,981 21 6 1.5 -1 2,239 2,508 36 2.4 7,317 36 767 54 46 0.2 0 CENTRAL ASIA 72 24 6 1.8 -1 84 101 17 2.9 11,371 48 192 55 53 0.3 0 Kazakhstan 18.4 23 7 1.5 -1 20.5 24.7 9 3.0 23,440 57 63 56 54 0.3 0 Kyrgyzstan 6.1 26 6 2.1 -1 7.0 8.1 17 3.1 3,620 34 479 42 40 0.3 0 Tajikistan 9.1 33 5 2.7 -2 10.7 12.9 27 3.8 3,670 27 1,241 29 27 0.4 0 Turkmenistan 5.9 26 7 1.9 -1 7.0 8.8 44 3.2 17,320 52 303 50 47 — Uzbekistan 32.9 22 5 1.7 -1 38.7 46.5 11 2.5 7,130 51 748 65 62 0.3 0 Population (millions) mid-2018 Births per 1,000 Population Deaths per 1,000 Population Rate of Natural Increase (%) Net Migration Rate Population (millions) Infant Mortality Ratea Total Fertility Rateb GNI per Capita, PPP 2017c Percent Urban Population per km2 of Arable Land Married Women 15-49 Using Contraceptiond (%) Ages 15-49 With HIV/AI mid-2030 mid-2050 All Methods Modern Methods Males 2017 Female Capita, 017c Percent Urban Population per km2 of Arable Land Married Women 15-49 Using Contraceptiond (%) Ages 15-49 With HIV/AIDS (%) Life Expectancy at Birth (Years) Life Expectancy at Age 65 (Years) Population Ages 15 Population Ages 65+ All Methods Modern Methods Males 2017 Females 2017 Males Females Males Females 2018 (%) 2050 (%) 2050 as a Multiple of 2018e 2018 (%) 2050 (%) 2050 as a Multiple of 2018e 27 55 535 62 56 — — 70 74 16 18 26 21 1.1 9 16 2.3 409 79 242 68 59 — — 76 82 18 21 16 16 1.0 18 27 1.5 445 50 704 61 55 — — 69 73 15 17 28 22 1.1 7 14 2.8 840 48 632 54 47 0.9 1.3 67 71 15 17 31 24 1.1 6 12 3.0 723 33 585 37 33 1.5 2.3 63 66 14 15 40 31 1.5 4 7 3.5 65 43 546 36 32 2.7 4.3 61 64 13 15 41 32 1.6 3 6 3.4 57 52 548 52 47 0.1 0.1 71 74 15 16 32 25 1.2 5 12 3.8 050 73 572 57 50 0.1 0.1 77 78 18 19 29 20 1.0 6 17 4.3 360 43 3,350 59 57 0.1 0.1 71 74 13 15 34 25 1.3 4 11 4.7 940 80 376 42 20 — — 69 75 13 16 28 18 0.8 4 17 4.6 063 62 433 67 59 0.1 0.1 75 78 15 17 24 19 0.9 8 18 2.7 482 36 210 12 12 0.2 0.2 63 66 14 15 41 31 1.6 4 6 3.4 490 68 399 63 51 0.1 0.1 75 78 15 18 24 18 0.9 8 20 2.9 — 87 14,150 — — — — 68 72 13 15 28 20 1.1 3 12 6.8 683 40 546 33 28 3.3 5.2 59 62 13 14 43 33 1.6 3 5 3.3 74 46 445 24 18 1.8 2.4 56 58 11 12 44 35 1.7 3 4 3.2 260 45 425 18 13 0.7 1.3 59 62 13 14 43 34 1.6 3 5 3.1 810 29 338 32 30 0.6 1.0 60 61 12 12 47 35 1.8 3 4 3.4 570 66 1,101 61 57 0.5 0.7 71 75 14 16 31 19 0.7 4 12 3.2 820 51 859 24 19 1.9 3.7 52 55 11 12 43 35 1.7 3 4 2.8 670 61 494 9 8 1.4 1.9 60 63 12 13 46 33 1.7 2 4 4.0 490 56 627 33 27 1.0 2.3 62 64 12 13 39 30 1.3 3 6 3.3 270 35 383 9 8 1.1 1.9 58 61 12 12 45 33 1.5 4 5 2.7 700 43 636 16 14 2.6 4.1 56 59 12 12 42 32 1.4 3 5 3.3 710 51 971 31 31 1.0 1.8 62 64 12 13 42 32 1.6 3 5 3.6 160 42 303 16 15 0.9 1.6 58 62 12 12 47 36 1.8 2 4 3.8 900 54 1,009 18 16 0.4 0.3 62 65 12 13 40 32 1.6 3 6 3.6 990 16 132 19 18 0.3 0.3 59 61 12 13 50 43 2.4 3 3 2.9 680 50 576 24 16 2.5 3.0 53 54 11 11 44 35 1.7 3 4 3.1 620 46 509 28 26 0.3 0.6 65 69 13 14 43 33 1.6 3 5 3.8 480 41 487 17 16 1.1 1.6 51 52 10 10 42 29 1.2 3 5 3.1 620 42 302 20 17 1.5 2.7 59 61 12 12 42 32 1.5 3 5 3.5 92 28 651 41 38 3.4 5.6 62 66 14 15 43 32 1.5 3 5 3.5 770 13 987 29 23 0.8 1.4 59 62 13 14 46 36 2.1 2 4 4.2 570 29 1,281 19 14 0.1 0.1 62 65 12 14 40 30 1.3 3 6 3.5 — 78 48,550 19 18 1.1 1.5 61 64 14 15 32 21 0.9 4 10 3.3 500 40 865 8 7 0.4 0.7 62 68 13 14 41 30 1.1 4 6 2.3 890 20 711 37 35 0.7 1.2 64 67 14 15 41 26 1.1 4 7 3.3 250 32 878 62 60 3.5 6.2 65 69 14 16 41 29 1.3 3 7 5.1 510 37 750 40 33 0.4 0.2 64 68 13 14 41 32 1.6 3 6 4.0 180 17 502 59 58 7.4 11.7 61 66 14 15 44 32 1.4 3 5 3.2 570 41 1,710 64 32 — — 71 78 15 19 19 14 0.7 11 24 2.2 — 46 2,970 — — — — 74 77 18 22 44 27 1.3 3 10 8.1 200 32 540 27 25 9.9 15.0 56 60 13 14 45 35 1.7 3 4 3.0 — 100 2,539 — — — — 78 84 18 22 24 17 0.8 11 25 2.6 990 19 1,091 53 48 1.9 3.4 65 69 14 15 40 27 1.3 3 8 5.0 860 57 64,364 — — — — 68 78 14 18 22 18 0.8 8 23 2.8 — 45 1,380 15 14 0.1 0.1 55 58 13 13 47 38 1.9 3 3 2.9 440 20 — 4 2 2.0 2.9 56 58 13 14 42 32 1.7 3 5 3.0 916 34 438 38 32 3.4 5.5 64 67 14 15 45 36 1.9 3 5 3.6 820 24 639 42 36 4.5 7.3 62 64 13 14 48 36 1.6 3 4 3.0 920 44 465 49 45 8.8 14.3 59 64 14 15 45 36 2.0 2 4 4.5 MENT DATA AND ESTIMATES FOR THE COUNTRIES, TERRITORIES, AND REGIONS OF THE WORLD Saint Lucia 0.2 12 6 0.7 -3 0.2 0.2 18 1.5 13,230 19 5,780 56 53 — — St. Vincent and the Grenadines 0.1 16 9 0.7 -6 0.1 0.1 18 2.1 11,770 52 2,210 — — — — Trinidad and Tobago 1.4 13 8 0.5 -1 1.4 1.4 13 1.6 30,520 53 5,450 40 38 1.4 0 SOUTH AMERICA 427 16 6 1.0 -0 467 505 13 2.0 15,509 83 300 79 74 0.7 0 Argentina 44.5 17 8 1.0 -0 49.4 56.4 10.1 2.3 20,270 92 114 81f 78f 0.6 0 Bolivia 11.3 23 7 1.6 -1 13.3 16.5 37 2.9 7,330 69 253 67 45 0.4 0 Brazil 209.4 14 6 0.8 0 223.9 231.0 11 1.7 15,160 86 262 80 78 0.8 0 Chile 18.6 14 6 0.8 2 19.6 20.2 6.9 1.8 23,150 87 1,413 76 70 0.8 0 Colombia 49.8 15 6 0.9 -1 55.5 61.5 14 2.0 14,170 77 2,951 81 76 0.7 0 Ecuador 17.0 20 5 1.5 -0 19.7 23.2 19 2.5 11,350 64 1,595 80 72 0.5 0 French Guiana 0.3 27 4 2.3 4 0.4 0.5 9 3.6 — 85 2,131 — — — — Guyana 0.8 21 8 1.2 -7 0.8 0.8 31 2.5 8,120 27 186 34 33 1.7 1 Paraguay 6.9 21 6 1.5 -2 7.8 8.9 17 2.5 9,180 61 144 68 67 0.6 0 Peru 32.2 19 6 1.4 -1 36.4 41.1 16 2.4 12,890 78 775 76 54 0.5 0 Suriname 0.6 18 7 1.1 -2 0.6 0.6 16 2.4 14,290 66 874 48 47 1.3 1 Uruguay 3.5 14 9 0.5 -1 3.6 3.7 11.5 2.0 21,870 95 145 80f 78f 0.9 0 Venezuela 31.8 19 5 1.4 -1 36.1 40.5 12.5 2.4 17,440 88 1,179 75 — — — Population (millions) mid-2018 Births per 1,000 Population Deaths per 1,000 Population Rate of Natural Increase (%) Net Migration Rate Population (millions) Infant Mortality Ratea Total Fertility Rateb GNI per Capita, PPP 2017c Percent Urban Population per km2 of Arable Land Married Women 15-49 Ages 15-49 With HIV/AI mid-2030 mid-2050 Using Contraceptiond (%) Males 2017 Female All Methods Modern Methods ASIA 4,536 17 7 1.1 -0 4,943 5,253 26 2.1 13,714 49 915 65 59 — ASIA (EXCL. CHINA) 3,134 19 6 1.3 -1 3,515 3,900 31 2.3 12,210 45 832 56 48 0.3 0 WESTERN ASIA 272 21 5 1.6 1 329 400 22 2.7 28,686 71 701 54 37 — Armenia 3.0 13 9 0.4 -8 2.8 2.4 8 1.6 10,060 64 664 57 28 0.2 0 Azerbaijan 9.9 15 6 0.9 0 10.7 11.1 11 1.9 16,650 53 513 51 14 0.2 0 Bahrain 1.5 14 2 1.1 23 1.9 2.1 6 1.9 42,930 89 96,054 — — 0.1 0 Cyprus 1.2 11 6 0.5 3 1.3 1.4 3 1.4 33,609 68 1,202 — — 0.2 0 Georgia 3.9 14 13 0.2 -1 3.7 3.4 10 2.1 10,120 58 872 53 35 0.7 0 Iraq 40.2 31 4 2.7 2 53.4 76.5 38 4.1 17,010 70 798 53 36 — Israel 8.5 21 5 1.6 3 10.8 14.4 3.0 3.1 38,060 91 2,857 — — — Jordan 10.2 24 3 2.1 0 12.0 13.4 15 3.2 9,110 90 4,462 61 42 — Kuwait 4.2 14 2 1.3 15 4.9 5.6 8 1.5 83,310 100 54,508 — — 0.1 0 Lebanon 6.1 14 5 0.9 -1 5.5 5.6 7 1.7 14,690 89 4,621 55 47 0.1 0 Oman 4.7 20 2 1.8 32 5.8 7.1 9 2.9 40,240 85 12,326 30 19 — Palestinian Territory 4.8 31 4 2.7 -2 6.2 8.4 18 4.1 5,560 76 7,566 57 44 — Qatar 2.7 10 1 0.9 28 3.2 3.8 6 1.9 128,060 100 20,571 38 34 0.2 0 Saudi Arabia 33.4 17 3 1.4 11 39.3 44.9 12 2.4 54,770 84 954 25 21 — Syria 18.3 22 6 1.6 -21 26.6 34.0 17 2.9 — 54 392 54 38 — Turkey 81.3 16 5 1.1 0 93.3 104.7 9 2.1 27,550 75 394 74 47 — United Arab Emirates 9.5 10 2 0.8 8 11.1 13.2 6 1.8 74,410 87 25,444 — — — Yemen 28.9 32 6 2.5 -1 36.8 48.3 44 4.0 2,380 37 2,317 34 29 — SOUTH CENTRAL ASIA 1,981 21 6 1.5 -1 2,239 2,508 36 2.4 7,317 36 767 54 46 0.2 0 CENTRAL ASIA 72 24 6 1.8 -1 84 101 17 2.9 11,371 48 192 55 53 0.3 0 Kazakhstan 18.4 23 7 1.5 -1 20.5 24.7 9 3.0 23,440 57 63 56 54 0.3 0 Kyrgyzstan 6.1 26 6 2.1 -1 7.0 8.1 17 3.1 3,620 34 479 42 40 0.3 0 Tajikistan 9.1 33 5 2.7 -2 10.7 12.9 27 3.8 3,670 27 1,241 29 27 0.4 0 Turkmenistan 5.9 26 7 1.9 -1 7.0 8.8 44 3.2 17,320 52 303 50 47 — Uzbekistan 32.9 22 5 1.7 -1 38.7 46.5 11 2.5 7,130 51 748 65 62 0.3 0 SOUTH ASIA 1,909 21 6 1.5 -1 2,155 2,407 37 2.4 7,163 36 865 53 46 0.2 0 Afghanistan 36.5 35 7 2.8 -0 48.5 68.9 57 4.8 2,000 25 470 23 20 — Bangladesh 166.4 19 5 1.4 -3 185.6 201.9 28 2.1 4,040 37 2,143 62 54 0.1 0 Bhutan 0.8 18 6 1.2 1 0.9 1.0 26 2.1 8,850 39 815 66 65 — India 1,371.3 20 6 1.4 -0 1,532.3 1,680.1 34 2.3 7,060 34 876 54 48 0.2 0 Iran 81.6 19 5 1.4 -3 88.4 93.1 5 2.0 21,010 74 555 77 57 0.2 0 Maldives 0.4 20 3 1.7 6 0.5 0.6 8 2.4 15,350 39 10,978 35 27 — Population (millions) mid-2018 Births per 1,000 Population Deaths per 1,000 Population Rate of Natural Increase (%) Net Migration Rate Population (millions) Infant Mortality Ratea Total Fertility Rateb GNI per Capita, PPP 2017c Percent Urban Population per km2 of Arable Land Married Women 15-49 Using Contraceptiond (%) Ages 15-49 With HIV/AI mid-2030 mid-2050 All Methods Modern Methods Males 2017 Female POPULATION, HEALTH, AND ENVIRONMENT DATA AND ESTIMATES FOR THE COUNTRIES, TERRITORIES, AND REGIONS OF THE WORLD
  • 15.
    © 2018 PopulationReference Bureau See notes on page 18 2018 WORLD POPULATION DATA SHEET 14 Kyrgyzstan 6.1 26 6 2.1 -1 7.0 8.1 17 3.1 3,620 34 479 42 40 0.3 0 Tajikistan 9.1 33 5 2.7 -2 10.7 12.9 27 3.8 3,670 27 1,241 29 27 0.4 0 Turkmenistan 5.9 26 7 1.9 -1 7.0 8.8 44 3.2 17,320 52 303 50 47 — Uzbekistan 32.9 22 5 1.7 -1 38.7 46.5 11 2.5 7,130 51 748 65 62 0.3 0 SOUTH ASIA 1,909 21 6 1.5 -1 2,155 2,407 37 2.4 7,163 36 865 53 46 0.2 0 Afghanistan 36.5 35 7 2.8 -0 48.5 68.9 57 4.8 2,000 25 470 23 20 — Bangladesh 166.4 19 5 1.4 -3 185.6 201.9 28 2.1 4,040 37 2,143 62 54 0.1 0 Bhutan 0.8 18 6 1.2 1 0.9 1.0 26 2.1 8,850 39 815 66 65 — India 1,371.3 20 6 1.4 -0 1,532.3 1,680.1 34 2.3 7,060 34 876 54 48 0.2 0 Iran 81.6 19 5 1.4 -3 88.4 93.1 5 2.0 21,010 74 555 77 57 0.2 0 Maldives 0.4 20 3 1.7 6 0.5 0.6 8 2.4 15,350 39 10,978 35 27 — Nepal 29.7 20 6 1.4 -2 32.5 33.3 32 2.3 2,710 20 1,406 53 43 0.2 0 Pakistan 200.6 26 7 1.9 -4 244.0 306.6 66 3.1 5,830 37 659 35 26 0.2 0 Sri Lanka 21.7 16 6 0.9 -4 22.2 21.5 7 2.1 12,470 19 1,668 62 51 0.1 0 SOUTHEAST ASIA 650 18 7 1.1 -0 720 786 22 2.3 12,141 48 926 62 56 0.5 0 Brunei 0.4 16 4 1.2 1 0.5 0.5 6 1.9 83,760 78 8,682 — — — Cambodia 16.0 23 6 1.7 -2 18.8 22.0 24 2.6 3,760 23 421 56 39 0.5 0 Indonesia 265.2 19 7 1.2 -1 293.9 319.7 22 2.4 11,900 54 1,129 61 59 0.5 0 Laos 7.0 24 7 1.7 -3 8.0 9.2 42 2.7 6,650 35 456 50 43 0.3 0 Malaysia 32.5 16 5 1.1 2 36.8 41.7 7 1.9 28,650 75 3,404 52 34 0.7 0 Myanmar 53.9 18 8 1.0 -1 58.9 62.4 52 2.3 5,830 29 495 52 51 0.9 0 Philippines 107.0 21 6 1.5 -1 126.0 152.0 21 2.7 10,030 47 1,914 54 40 0.2 0 Singapore 5.8 9 5 0.4 11 6.1 6.0 2.2 1.2 90,570 100 1,032,235 — — 0.4 0 Thailand 66.2 11 8 0.2 0 66.7 62.6 10 1.5 17,090 50 394 78 76 1.2 1 Timor-Leste 1.2 30 7 2.3 -8 1.5 1.9 30 4.2 6,330 31 798 26 24 — Vietnam 94.7 16 7 0.9 -0 103.2 108.2 15 2.1 6,450 35 1,353 76 65 0.4 0 EAST ASIA 1,633 12 7 0.4 -0 1,655 1,558 9 1.7 19,961 62 1,274 82 80 — China 1,393.8 12 7 0.5 -0 1,419.5 1,343.9 10 1.8 16,760 59 1,171 85 84 — China, Hong Kong SARg 7.4 8 6 0.1 3 8.0 8.2 1.5 1.1 64,100 100 239,555 75 72 — China, Macao SARg 0.7 10 3 0.7 6 0.8 0.8 2 1.0 96,570 100 — — — — Japan 126.5 8 11 -0.3 1 119.1 101.8 2.0 1.4 45,470 92 3,012 40 34 0.1 0 Korea, North 25.6 14 9 0.5 -0 26.7 26.8 12 1.9 — 62 1,090 70 69 — Korea, South 51.8 7 6 0.1 2 52.9 49.4 2.8 1.1 38,260 82 3,537 80 — — Mongolia 3.2 24 6 1.8 0 3.8 4.6 13 2.8 11,170 68 565 55 48 0.1 0 Taiwan 23.6 9 7 0.2 0 24.0 22.7 3.9 1.2 — 78 3,986 — — — EUROPE 746 10 11 -0.1 3 751 730 4 1.6 35,501 74 270 70 60 0.7 0 EUROPEAN UNION 512 10 10 0.0 3 518 512 4 1.6 41,207 75 477 71 65 — NORTHERN EUROPE 105 11 9 0.2 5 111 118 4 1.8 45,710 81 545 82 81 — Channel Islands 0.2 10 8 0.2 8 0.2 0.2 8.0 1.5 — 31 4,339 — — — Denmark 5.8 11 9 0.2 4 6.1 6.4 3.8 1.8 51,560 88 246 — — 0.2 0 Estonia 1.3 10 12 -0.1 4 1.2 1.1 2.4 1.6 31,000 69 197 63 58 0.9 0 Finland 5.5 9 10 -0.1 3 5.8 5.9 2.0 1.5 45,730 71 246 86 82 — Iceland 0.4 12 7 0.5 24 0.4 0.4 2.7 1.7 53,640 94 292 — — — Ireland 4.9 13 6 0.7 4 5.5 6.8 2.8 1.8 62,440 63 472 65 61 0.3 0 Latvia 1.9 11 15 -0.4 -8 1.7 1.5 4.1 1.7 27,400 68 156 — — — Lithuania 2.8 10 14 -0.4 -10 2.7 2.4 4.5 1.6 31,030 67 128 63 50 0.2 0 Norway 5.3 11 8 0.3 4 5.9 6.7 2.3 1.6 63,530 81 660 88f 82f 0.2 0 Sweden 10.2 11 9 0.2 10 11.2 12.0 2.5 1.8 50,840 87 395 — — — United Kingdom 66.4 12 9 0.3 6 70.4 74.7 3.9 1.8 43,160 83 1,105 84 84 — WESTERN EUROPE 195 10 10 0.0 4 201 203 3 1.7 49,652 80 573 72 70 0.4 0 Austria 8.8 10 9 0.0 5 9.3 9.7 2.9 1.5 52,660 58 657 66 63 0.2 0 Belgium 11.4 10 10 0.1 4 12.0 12.7 3.3 1.6 47,960 98 1,375 67 66 — France 65.1 11 9 0.2 1 68.5 72.3 3.6 1.9 43,720 80 352 78 73 0.6 0 Germany 82.8 9 11 -0.2 6 82.9 79.1 3.3 1.6 51,760 77 699 69f 69f 0.2 0 Liechtenstein 0.04 10 7 0.3 5 0.04 0.04 4.2 1.6 — 14 1,771 — — — Luxembourg 0.6 10 7 0.3 18 0.7 0.8 3.3 1.4 72,640 91 968 — — 0.4 0 Monaco 0.04 7 6 0.1 20 0.04 0.05 — 1.5 — 100 — — — — Netherlands 17.2 10 9 0.1 5 17.9 18.4 3.5 1.6 52,640 92 1,668 73 70 0.3 0 Switzerland 8.5 10 8 0.2 6 9.5 10.3 3.5 1.5 65,910 85 2,138 73 69 — EASTERN EUROPE 293 11 12 -0.2 1 286 265 5 1.5 23,046 69 150 66 52 1.0 0 Population (millions) mid-2018 Births per 1,000 Population Deaths per 1,000 Population Rate of Natural Increase (%) Net Migration Rate Population (millions) Infant Mortality Ratea Total Fertility Rateb GNI per Capita, PPP 2017c Percent Urban Population per km2 of Arable Land Married Women 15-49 Using Contraceptiond (%) Ages 15-49 With HIV/AID mid-2030 mid-2050 All Methods Modern Methods Males 2017 Female WORLD 7,621 19 7 1.2 0 8,571 9,852 31 2.4 16,927 55 535 62 56 — — MORE DEVELOPED 1,266 10 10 0.0 3 1,301 1,312 5 1.6 43,409 79 242 68 59 — — LESS DEVELOPED 6,355 21 7 1.4 -1 7,270 8,540 34 2.6 11,445 50 704 61 55 — — LESS DEVELOPED (Excl. China) 4,953 23 7 1.7 -1 5,841 7,187 37 2.8 9,840 48 632 54 47 0.9 1 LEAST DEVELOPED 1,027 33 8 2.5 -1 1,342 1,954 49 4.2 2,723 33 585 37 33 1.5 2 AFRICA 1,284 35 9 2.6 -1 1,714 2,586 50 4.6 4,965 43 546 36 32 2.7 4 NORTHERN AFRICA 235 26 6 2.0 -1 289 385 24 3.3 10,557 52 548 52 47 0.1 0 Algeria 42.7 26 4 2.2 -0 51.3 64.3 22 3.1 15,050 73 572 57 50 0.1 0 Egypt 97.0 27 6 2.1 -1 120.8 166.5 15 3.4 11,360 43 3,350 59 57 0.1 0 Libya 6.5 20 5 1.4 -4 7.3 8.1 22 2.3 19,940 80 376 42 20 — — Morocco 35.2 18 5 1.2 -2 39.3 43.6 22 2.2 8,063 62 433 67 59 0.1 0 Sudan 41.7 34 8 2.7 -2 56.8 88.1 45 4.7 4,482 36 210 12 12 0.2 0 Tunisia 11.6 19 6 1.4 -0 12.7 13.8 15 2.3 11,490 68 399 63 51 0.1 0 Western Sahara 0.6 20 5 1.5 7 0.7 0.9 30 2.3 — 87 14,150 — — — — SUB-SAHARAN AFRICA 1,049 37 9 2.7 -0 1,425 2,200 54 4.9 3,683 40 546 33 28 3.3 5 WESTERN AFRICA 382 38 11 2.7 -1 518 809 62 5.3 4,174 46 445 24 18 1.8 2 Benin 11.5 37 9 2.8 -0 15.6 23.9 63 5.0 2,260 45 425 18 13 0.7 1 Burkina Faso 20.3 40 9 3.1 -1 28.9 48.5 57 5.5 1,810 29 338 32 30 0.6 1 Cabo Verde 0.6 19 5 1.4 -3 0.6 0.6 21 2.2 6,570 66 1,101 61 57 0.5 0 Côte d’Ivoire 24.9 35 12 2.3 0 33.3 51.4 62 4.6 3,820 51 859 24 19 1.9 3 Gambia 2.2 39 8 3.1 -1 3.1 5.0 46 5.4 1,670 61 494 9 8 1.4 1 Ghana 29.5 30 8 2.2 -1 37.3 51.3 37 3.9 4,490 56 627 33 27 1.0 2 Guinea 11.9 39 11 2.8 -2 16.3 25.3 68 4.8 2,270 35 383 9 8 1.1 1 Guinea-Bissau 1.9 36 11 2.6 -1 2.5 3.6 73 4.6 1,700 43 636 16 14 2.6 4 Liberia 4.9 33 8 2.5 -1 6.5 9.8 50 4.2 710 51 971 31 31 1.0 1 Mali 19.4 45 10 3.5 -4 27.5 44.8 56 6.0 2,160 42 303 16 15 0.9 1 Mauritania 4.5 34 8 2.6 1 6.1 9.0 65 4.6 3,900 54 1,009 18 16 0.4 0 Niger 22.2 48 10 3.8 -0 34.0 63.1 60 7.2 990 16 132 19 18 0.3 0 Nigeria 195.9 39 12 2.6 -0 264.1 410.6 67 5.5 5,680 50 576 24 16 2.5 3 Senegal 16.3 33 6 2.7 -1 22.1 34.0 42 4.6 2,620 46 509 28 26 0.3 0 Sierra Leone 7.7 33 13 2.0 -1 9.7 13.0 84 4.2 1,480 41 487 17 16 1.1 1 Togo 8.0 34 9 2.5 -0 10.5 15.3 52 4.5 1,620 42 302 20 17 1.5 2 EASTERN AFRICA 432 36 8 2.8 -1 584 883 45 4.7 2,192 28 651 41 38 3.4 5 Burundi 11.8 41 11 3.0 -0 17.2 30.4 47 5.5 770 13 987 29 23 0.8 1 Comoros 0.8 33 7 2.5 -2 1.1 1.5 55 4.3 1,570 29 1,281 19 14 0.1 0 Djibouti 1.0 23 8 1.5 1 1.1 1.3 52 2.9 — 78 48,550 19 18 1.1 1 Eritrea 6.0 30 7 2.3 -15 6.8 8.9 46 4.1 1,500 40 865 8 7 0.4 0 Ethiopia 107.5 33 7 2.6 -0 139.6 190.9 40 4.4 1,890 20 711 37 35 0.7 1 Kenya 51.0 31 6 2.6 -0 67.0 95.5 36 3.9 3,250 32 878 62 60 3.5 6 Madagascar 26.3 32 6 2.6 -0 35.6 53.8 32 4.1 1,510 37 750 40 33 0.4 0 Malawi 19.1 34 7 2.6 -1 25.6 37.4 42 4.2 1,180 17 502 59 58 7.4 11 Mauritius 1.3 11 8 0.3 -1 1.3 1.2 11.8 1.4 22,570 41 1,710 64 32 — — Mayotte 0.3 39 3 3.6 -0 0.4 0.6 4 5.1 — 46 2,970 — — — — Mozambique 30.5 39 10 2.9 -0 42.4 67.8 65 5.3 1,200 32 540 27 25 9.9 15 Réunion 0.9 16 6 1.0 -4 0.9 1.0 7 2.4 — 100 2,539 — — — — Rwanda 12.6 32 6 2.6 -1 16.6 24.3 32 4.2 1,990 19 1,091 53 48 1.9 3 Seychelles 0.1 17 8 1.0 -3 0.1 0.1 13.4 2.4 26,860 57 64,364 — — — — Somalia 15.2 43 11 3.2 -3 21.5 35.9 72 6.3 — 45 1,380 15 14 0.1 0 South Sudan 13.0 37 11 2.6 4 17.9 27.9 69 5.0 1,440 20 — 4 2 2.0 2 Tanzania 59.1 39 7 3.3 -1 83.7 138.1 43 5.2 2,916 34 438 38 32 3.4 5 Uganda 44.1 41 9 3.2 -1 61.6 95.6 43 5.4 1,820 24 639 42 36 4.5 7 Zambia 17.7 39 8 3.1 -0 25.8 45.1 49 5.2 3,920 44 465 49 45 8.8 14 POPULATION, HEALTH, AND ENVIRONMENT DATA AND ESTIMATES FOR THE COUNTRIESPOPULATION, HEALTH, AND ENVIRONMENT DATA AND ESTIMATES FOR THE COUNTRIES, TERRITORIES, AND REGIONS OF THE WORLD
  • 16.
    © 2018 PopulationReference Bureau See notes on page 18 2018 WORLD POPULATION DATA SHEET 15 620 34 479 42 40 0.3 0.1 67 75 13 16 32 24 1.0 5 11 3.2 670 27 1,241 29 27 0.4 0.1 68 74 13 17 35 27 1.1 3 9 3.7 320 52 303 50 47 — — 64 71 13 15 31 23 1.1 4 11 3.8 130 51 748 65 62 0.3 0.2 71 76 13 16 28 19 1.0 4 13 4.3 63 36 865 53 46 0.2 0.2 68 70 14 15 28 19 0.9 6 13 2.9 000 25 470 23 20 — — 62 65 12 14 44 26 1.1 3 6 4.2 040 37 2,143 62 54 0.1 0.1 70 73 16 18 29 17 0.7 5 16 3.8 850 39 815 66 65 — — 70 70 17 17 27 16 0.7 5 17 4.3 060 34 876 54 48 0.2 0.2 67 70 14 15 28 19 0.8 6 13 2.7 010 74 555 77 57 0.2 0.1 75 77 16 16 24 15 0.7 6 23 4.3 350 39 10,978 35 27 — — 76 78 16 17 23 15 0.8 4 19 5.9 710 20 1,406 53 43 0.2 0.1 70 71 13 15 31 17 0.6 5 13 2.8 830 37 659 35 26 0.2 0.1 66 68 14 14 33 25 1.2 4 8 3.1 470 19 1,668 62 51 0.1 0.1 72 79 16 18 25 17 0.7 8 23 2.9 41 48 926 62 56 0.5 0.3 68 73 14 17 27 19 0.9 6 16 3.0 760 78 8,682 — — — — 76 79 16 18 23 16 0.8 4 22 6.3 760 23 421 56 39 0.5 0.6 67 71 13 15 31 22 1.0 4 12 3.9 900 54 1,129 61 59 0.5 0.3 67 71 12 14 28 20 0.9 5 14 3.2 650 35 456 50 43 0.3 0.3 65 68 13 14 33 20 0.8 4 11 3.5 650 75 3,404 52 34 0.7 0.2 73 77 15 17 24 17 0.9 6 16 3.4 830 29 495 52 51 0.9 0.5 64 69 13 14 27 19 0.8 6 13 2.7 030 47 1,914 54 40 0.2 0.1 66 73 13 15 32 24 1.1 5 10 3.0 570 100 1,032,235 — — 0.4 0.1 81 85 19 22 15 11 0.8 13 34 2.7 090 50 394 78 76 1.2 1.0 72 79 17 20 17 13 0.7 12 29 2.3 330 31 798 26 24 — — 67 71 13 14 39 33 1.3 6 5 1.2 450 35 1,353 76 65 0.4 0.2 71 76 16 21 24 17 0.8 8 22 3.1 61 62 1,274 82 80 — — 76 79 16 19 16 14 0.8 13 27 2.0 760 59 1,171 85 84 — — 75 78 15 17 17 14 0.8 11 26 2.2 100 100 239,555 75 72 — — 82 88 20 24 12 12 1.2 17 34 2.2 570 100 — — — — — 80 86 19 24 13 14 1.4 11 28 3.4 470 92 3,012 40 34 0.1 0.1 81 87 19 24 12 13 0.8 28 36 1.0 — 62 1,090 70 69 — — 68 75 11 17 21 16 0.8 10 20 2.2 260 82 3,537 80 — — — 79 85 18 23 13 12 0.9 14 35 2.3 170 68 565 55 48 0.1 0.1 66 75 12 16 30 22 1.1 4 13 4.8 — 78 3,986 — — — — 77 84 19 21 13 12 0.8 13 35 2.5 01 74 270 70 60 0.7 0.4 75 82 17 20 16 15 0.9 18 28 1.5 07 75 477 71 65 — — 78 83 18 21 16 14 0.9 20 30 1.5 10 81 545 82 81 — — 79 83 19 21 18 16 1.0 18 25 1.6 — 31 4,339 — — — — 80 85 18 21 16 13 0.9 17 29 1.7 560 88 246 — — 0.2 0.1 79 83 18 21 17 16 1.1 19 24 1.4 000 69 197 63 58 0.9 0.4 73 82 16 20 16 15 0.8 20 29 1.3 730 71 246 86 82 — — 79 84 19 22 16 16 1.0 21 26 1.3 640 94 292 — — — — 81 84 20 22 19 16 1.0 14 25 2.2 440 63 472 65 61 0.3 0.2 78 83 18 21 21 18 1.2 14 26 2.6 400 68 156 — — — — 70 79 14 19 16 15 0.8 20 28 1.1 030 67 128 63 50 0.2 0.1 69 80 14 19 15 15 0.9 19 26 1.2 530 81 660 88f 82f 0.2 0.1 81 84 19 22 18 16 1.2 17 24 1.8 840 87 395 — — — — 81 84 19 22 18 17 1.1 20 24 1.4 160 83 1,105 84 84 — — 79 83 19 21 18 16 1.0 18 25 1.6 52 80 573 72 70 0.4 0.1 79 84 19 22 15 15 1.0 20 29 1.5 660 58 657 66 63 0.2 0.1 79 84 19 22 14 13 1.0 19 31 1.8 960 98 1,375 67 66 — — 79 84 18 22 17 16 1.1 19 27 1.6 720 80 352 78 73 0.6 0.3 80 85 20 23 18 17 1.0 20 27 1.5 760 77 699 69f 69f 0.2 0.1 78 83 18 21 13 13 0.9 21 31 1.4 — 14 1,771 — — — — 81 84 — — 15 — — 17 — — 640 91 968 — — 0.4 0.1 80 84 19 22 16 16 1.3 14 23 2.2 — 100 — — — — — — — — — 13 — — 26 — — 640 92 1,668 73 70 0.3 0.1 80 83 19 21 16 15 1.0 18 28 1.6 910 85 2,138 73 69 — — 82 85 20 23 15 14 1.1 18 29 1.9 46 69 150 66 52 1.0 0.7 69 78 14 18 17 16 0.8 16 25 1.4 Capita, 017c Percent Urban Population per km2 of Arable Land Married Women 15-49 Using Contraceptiond (%) Ages 15-49 With HIV/AIDS (%) Life Expectancy at Birth (Years) Life Expectancy at Age 65 (Years) Population Ages 15 Population Ages 65+ All Methods Modern Methods Males 2017 Females 2017 Males Females Males Females 2018 (%) 2050 (%) 2050 as a Multiple of 2018e 2018 (%) 2050 (%) 2050 as a Multiple of 2018e 27 55 535 62 56 — — 70 74 16 18 26 21 1.1 9 16 2.3 409 79 242 68 59 — — 76 82 18 21 16 16 1.0 18 27 1.5 445 50 704 61 55 — — 69 73 15 17 28 22 1.1 7 14 2.8 840 48 632 54 47 0.9 1.3 67 71 15 17 31 24 1.1 6 12 3.0 723 33 585 37 33 1.5 2.3 63 66 14 15 40 31 1.5 4 7 3.5 65 43 546 36 32 2.7 4.3 61 64 13 15 41 32 1.6 3 6 3.4 57 52 548 52 47 0.1 0.1 71 74 15 16 32 25 1.2 5 12 3.8 050 73 572 57 50 0.1 0.1 77 78 18 19 29 20 1.0 6 17 4.3 360 43 3,350 59 57 0.1 0.1 71 74 13 15 34 25 1.3 4 11 4.7 940 80 376 42 20 — — 69 75 13 16 28 18 0.8 4 17 4.6 063 62 433 67 59 0.1 0.1 75 78 15 17 24 19 0.9 8 18 2.7 482 36 210 12 12 0.2 0.2 63 66 14 15 41 31 1.6 4 6 3.4 490 68 399 63 51 0.1 0.1 75 78 15 18 24 18 0.9 8 20 2.9 — 87 14,150 — — — — 68 72 13 15 28 20 1.1 3 12 6.8 683 40 546 33 28 3.3 5.2 59 62 13 14 43 33 1.6 3 5 3.3 74 46 445 24 18 1.8 2.4 56 58 11 12 44 35 1.7 3 4 3.2 260 45 425 18 13 0.7 1.3 59 62 13 14 43 34 1.6 3 5 3.1 810 29 338 32 30 0.6 1.0 60 61 12 12 47 35 1.8 3 4 3.4 570 66 1,101 61 57 0.5 0.7 71 75 14 16 31 19 0.7 4 12 3.2 820 51 859 24 19 1.9 3.7 52 55 11 12 43 35 1.7 3 4 2.8 670 61 494 9 8 1.4 1.9 60 63 12 13 46 33 1.7 2 4 4.0 490 56 627 33 27 1.0 2.3 62 64 12 13 39 30 1.3 3 6 3.3 270 35 383 9 8 1.1 1.9 58 61 12 12 45 33 1.5 4 5 2.7 700 43 636 16 14 2.6 4.1 56 59 12 12 42 32 1.4 3 5 3.3 710 51 971 31 31 1.0 1.8 62 64 12 13 42 32 1.6 3 5 3.6 160 42 303 16 15 0.9 1.6 58 62 12 12 47 36 1.8 2 4 3.8 900 54 1,009 18 16 0.4 0.3 62 65 12 13 40 32 1.6 3 6 3.6 990 16 132 19 18 0.3 0.3 59 61 12 13 50 43 2.4 3 3 2.9 680 50 576 24 16 2.5 3.0 53 54 11 11 44 35 1.7 3 4 3.1 620 46 509 28 26 0.3 0.6 65 69 13 14 43 33 1.6 3 5 3.8 480 41 487 17 16 1.1 1.6 51 52 10 10 42 29 1.2 3 5 3.1 620 42 302 20 17 1.5 2.7 59 61 12 12 42 32 1.5 3 5 3.5 92 28 651 41 38 3.4 5.6 62 66 14 15 43 32 1.5 3 5 3.5 770 13 987 29 23 0.8 1.4 59 62 13 14 46 36 2.1 2 4 4.2 570 29 1,281 19 14 0.1 0.1 62 65 12 14 40 30 1.3 3 6 3.5 — 78 48,550 19 18 1.1 1.5 61 64 14 15 32 21 0.9 4 10 3.3 500 40 865 8 7 0.4 0.7 62 68 13 14 41 30 1.1 4 6 2.3 890 20 711 37 35 0.7 1.2 64 67 14 15 41 26 1.1 4 7 3.3 250 32 878 62 60 3.5 6.2 65 69 14 16 41 29 1.3 3 7 5.1 510 37 750 40 33 0.4 0.2 64 68 13 14 41 32 1.6 3 6 4.0 180 17 502 59 58 7.4 11.7 61 66 14 15 44 32 1.4 3 5 3.2 570 41 1,710 64 32 — — 71 78 15 19 19 14 0.7 11 24 2.2 — 46 2,970 — — — — 74 77 18 22 44 27 1.3 3 10 8.1 200 32 540 27 25 9.9 15.0 56 60 13 14 45 35 1.7 3 4 3.0 — 100 2,539 — — — — 78 84 18 22 24 17 0.8 11 25 2.6 990 19 1,091 53 48 1.9 3.4 65 69 14 15 40 27 1.3 3 8 5.0 860 57 64,364 — — — — 68 78 14 18 22 18 0.8 8 23 2.8 — 45 1,380 15 14 0.1 0.1 55 58 13 13 47 38 1.9 3 3 2.9 440 20 — 4 2 2.0 2.9 56 58 13 14 42 32 1.7 3 5 3.0 916 34 438 38 32 3.4 5.5 64 67 14 15 45 36 1.9 3 5 3.6 820 24 639 42 36 4.5 7.3 62 64 13 14 48 36 1.6 3 4 3.0 920 44 465 49 45 8.8 14.3 59 64 14 15 45 36 2.0 2 4 4.5 MENT DATA AND ESTIMATES FOR THE COUNTRIES, TERRITORIES, AND REGIONS OF THE WORLD Kyrgyzstan 6.1 26 6 2.1 -1 7.0 8.1 17 3.1 3,620 34 479 42 40 0.3 0 Tajikistan 9.1 33 5 2.7 -2 10.7 12.9 27 3.8 3,670 27 1,241 29 27 0.4 0 Turkmenistan 5.9 26 7 1.9 -1 7.0 8.8 44 3.2 17,320 52 303 50 47 — Uzbekistan 32.9 22 5 1.7 -1 38.7 46.5 11 2.5 7,130 51 748 65 62 0.3 0 SOUTH ASIA 1,909 21 6 1.5 -1 2,155 2,407 37 2.4 7,163 36 865 53 46 0.2 0 Afghanistan 36.5 35 7 2.8 -0 48.5 68.9 57 4.8 2,000 25 470 23 20 — Bangladesh 166.4 19 5 1.4 -3 185.6 201.9 28 2.1 4,040 37 2,143 62 54 0.1 0 Bhutan 0.8 18 6 1.2 1 0.9 1.0 26 2.1 8,850 39 815 66 65 — India 1,371.3 20 6 1.4 -0 1,532.3 1,680.1 34 2.3 7,060 34 876 54 48 0.2 0 Iran 81.6 19 5 1.4 -3 88.4 93.1 5 2.0 21,010 74 555 77 57 0.2 0 Maldives 0.4 20 3 1.7 6 0.5 0.6 8 2.4 15,350 39 10,978 35 27 — Nepal 29.7 20 6 1.4 -2 32.5 33.3 32 2.3 2,710 20 1,406 53 43 0.2 0 Pakistan 200.6 26 7 1.9 -4 244.0 306.6 66 3.1 5,830 37 659 35 26 0.2 0 Sri Lanka 21.7 16 6 0.9 -4 22.2 21.5 7 2.1 12,470 19 1,668 62 51 0.1 0 SOUTHEAST ASIA 650 18 7 1.1 -0 720 786 22 2.3 12,141 48 926 62 56 0.5 0 Brunei 0.4 16 4 1.2 1 0.5 0.5 6 1.9 83,760 78 8,682 — — — Cambodia 16.0 23 6 1.7 -2 18.8 22.0 24 2.6 3,760 23 421 56 39 0.5 0 Indonesia 265.2 19 7 1.2 -1 293.9 319.7 22 2.4 11,900 54 1,129 61 59 0.5 0 Laos 7.0 24 7 1.7 -3 8.0 9.2 42 2.7 6,650 35 456 50 43 0.3 0 Malaysia 32.5 16 5 1.1 2 36.8 41.7 7 1.9 28,650 75 3,404 52 34 0.7 0 Myanmar 53.9 18 8 1.0 -1 58.9 62.4 52 2.3 5,830 29 495 52 51 0.9 0 Philippines 107.0 21 6 1.5 -1 126.0 152.0 21 2.7 10,030 47 1,914 54 40 0.2 0 Singapore 5.8 9 5 0.4 11 6.1 6.0 2.2 1.2 90,570 100 1,032,235 — — 0.4 0 Thailand 66.2 11 8 0.2 0 66.7 62.6 10 1.5 17,090 50 394 78 76 1.2 1 Timor-Leste 1.2 30 7 2.3 -8 1.5 1.9 30 4.2 6,330 31 798 26 24 — Vietnam 94.7 16 7 0.9 -0 103.2 108.2 15 2.1 6,450 35 1,353 76 65 0.4 0 EAST ASIA 1,633 12 7 0.4 -0 1,655 1,558 9 1.7 19,961 62 1,274 82 80 — China 1,393.8 12 7 0.5 -0 1,419.5 1,343.9 10 1.8 16,760 59 1,171 85 84 — China, Hong Kong SARg 7.4 8 6 0.1 3 8.0 8.2 1.5 1.1 64,100 100 239,555 75 72 — China, Macao SARg 0.7 10 3 0.7 6 0.8 0.8 2 1.0 96,570 100 — — — — Japan 126.5 8 11 -0.3 1 119.1 101.8 2.0 1.4 45,470 92 3,012 40 34 0.1 0 Korea, North 25.6 14 9 0.5 -0 26.7 26.8 12 1.9 — 62 1,090 70 69 — Korea, South 51.8 7 6 0.1 2 52.9 49.4 2.8 1.1 38,260 82 3,537 80 — — Mongolia 3.2 24 6 1.8 0 3.8 4.6 13 2.8 11,170 68 565 55 48 0.1 0 Taiwan 23.6 9 7 0.2 0 24.0 22.7 3.9 1.2 — 78 3,986 — — — EUROPE 746 10 11 -0.1 3 751 730 4 1.6 35,501 74 270 70 60 0.7 0 EUROPEAN UNION 512 10 10 0.0 3 518 512 4 1.6 41,207 75 477 71 65 — NORTHERN EUROPE 105 11 9 0.2 5 111 118 4 1.8 45,710 81 545 82 81 — Channel Islands 0.2 10 8 0.2 8 0.2 0.2 8.0 1.5 — 31 4,339 — — — Denmark 5.8 11 9 0.2 4 6.1 6.4 3.8 1.8 51,560 88 246 — — 0.2 0 Estonia 1.3 10 12 -0.1 4 1.2 1.1 2.4 1.6 31,000 69 197 63 58 0.9 0 Finland 5.5 9 10 -0.1 3 5.8 5.9 2.0 1.5 45,730 71 246 86 82 — Iceland 0.4 12 7 0.5 24 0.4 0.4 2.7 1.7 53,640 94 292 — — — Ireland 4.9 13 6 0.7 4 5.5 6.8 2.8 1.8 62,440 63 472 65 61 0.3 0 Latvia 1.9 11 15 -0.4 -8 1.7 1.5 4.1 1.7 27,400 68 156 — — — Lithuania 2.8 10 14 -0.4 -10 2.7 2.4 4.5 1.6 31,030 67 128 63 50 0.2 0 Norway 5.3 11 8 0.3 4 5.9 6.7 2.3 1.6 63,530 81 660 88f 82f 0.2 0 Sweden 10.2 11 9 0.2 10 11.2 12.0 2.5 1.8 50,840 87 395 — — — United Kingdom 66.4 12 9 0.3 6 70.4 74.7 3.9 1.8 43,160 83 1,105 84 84 — WESTERN EUROPE 195 10 10 0.0 4 201 203 3 1.7 49,652 80 573 72 70 0.4 0 Austria 8.8 10 9 0.0 5 9.3 9.7 2.9 1.5 52,660 58 657 66 63 0.2 0 Belgium 11.4 10 10 0.1 4 12.0 12.7 3.3 1.6 47,960 98 1,375 67 66 — France 65.1 11 9 0.2 1 68.5 72.3 3.6 1.9 43,720 80 352 78 73 0.6 0 Germany 82.8 9 11 -0.2 6 82.9 79.1 3.3 1.6 51,760 77 699 69f 69f 0.2 0 Liechtenstein 0.04 10 7 0.3 5 0.04 0.04 4.2 1.6 — 14 1,771 — — — Luxembourg 0.6 10 7 0.3 18 0.7 0.8 3.3 1.4 72,640 91 968 — — 0.4 0 Monaco 0.04 7 6 0.1 20 0.04 0.05 — 1.5 — 100 — — — — Netherlands 17.2 10 9 0.1 5 17.9 18.4 3.5 1.6 52,640 92 1,668 73 70 0.3 0 Switzerland 8.5 10 8 0.2 6 9.5 10.3 3.5 1.5 65,910 85 2,138 73 69 — EASTERN EUROPE 293 11 12 -0.2 1 286 265 5 1.5 23,046 69 150 66 52 1.0 0 POPULATION, HEALTH, AND ENVIRONMENT DATA AND ESTIMATES FOR THE COUNTRIES, TERRITORIES, AND REGIONS OF THE WORLD
  • 17.
    © 2018 PopulationReference Bureau See notes on page 18 2018 WORLD POPULATION DATA SHEET 16 WESTERN EUROPE 195 10 10 0.0 4 201 203 3 1.7 49,652 80 573 72 70 0.4 0 Austria 8.8 10 9 0.0 5 9.3 9.7 2.9 1.5 52,660 58 657 66 63 0.2 0 Belgium 11.4 10 10 0.1 4 12.0 12.7 3.3 1.6 47,960 98 1,375 67 66 — France 65.1 11 9 0.2 1 68.5 72.3 3.6 1.9 43,720 80 352 78 73 0.6 0 Germany 82.8 9 11 -0.2 6 82.9 79.1 3.3 1.6 51,760 77 699 69f 69f 0.2 0 Liechtenstein 0.04 10 7 0.3 5 0.04 0.04 4.2 1.6 — 14 1,771 — — — — Luxembourg 0.6 10 7 0.3 18 0.7 0.8 3.3 1.4 72,640 91 968 — — 0.4 0 Monaco 0.04 7 6 0.1 20 0.04 0.05 — 1.5 — 100 — — — — Netherlands 17.2 10 9 0.1 5 17.9 18.4 3.5 1.6 52,640 92 1,668 73 70 0.3 0 Switzerland 8.5 10 8 0.2 6 9.5 10.3 3.5 1.5 65,910 85 2,138 73 69 — EASTERN EUROPE 293 11 12 -0.2 1 286 265 5 1.5 23,046 69 150 66 52 1.0 0 Belarus 9.5 11 13 -0.2 0 9.5 9.5 3.2 1.5 18,140 78 167 63 52 0.5 0 Bulgaria 7.0 9 16 -0.7 -1 6.6 5.8 6.4 1.6 20,500 73 200 69 40 0.1 0 Czechia 10.6 11 11 0.0 3 10.7 10.5 2.7 1.7 35,010 74 339 86f 78f 0.1 0 Hungary 9.8 9 14 -0.4 1 9.6 9.2 3.6 1.5 27,220 71 221 62 54 0.1 0 Moldova 3.5 11 11 0.0 0 3.4 2.9 9 1.3 6,060 43 195 60 42 0.7 0 Poland 38.4 11 11 0.0 0 37.2 34.0 4.0 1.4 28,170 60 353 51 41 — Romania 19.5 10 13 -0.4 -2 17.9 15.1 7.1 1.4 25,150 54 222 70 51 0.2 0 Russia 147.3 12 12 -0.1 2 146.1 137.9 5.5 1.6 24,893 74 120 68 55 1.4 0 Slovakia 5.4 11 10 0.1 1 5.4 5.0 4.5 1.5 31,360 54 394 — — 0.1 0 Ukraine 42.3 9 14 -0.5 0 39.6 35.0 7.7 1.3 8,900 70 130 65 48 1.0 0 SOUTHERN EUROPE 153 8 10 -0.2 2 153 144 3 1.4 34,394 71 546 67 54 0.4 0 Albania 2.9 11 8 0.3 -5 2.8 2.5 8.0 1.6 12,120 60 466 69 11 0.1 0 Andorra 0.08 8 4 0.4 21 0.08 0.08 3.4 1.1 — 88 10,025 — — — Bosnia-Herzegovina 3.5 9 10 -0.2 0 3.7 3.1 6 1.3 12,880 48 340 46 12 — Croatia 4.1 9 12 -0.3 -5 3.9 3.5 4.3 1.4 24,700 57 488 — — — Greece 10.6 9 11 -0.2 -4 10.8 10.0 4.2 1.3 27,820 79 477 76f 46f 0.3 0 Italy 60.6 8 11 -0.3 3 60.1 57.6 2.9 1.3 40,030 70 917 65 52 0.3 0 Kosovoh 1.8 13 5 0.8 0 1.8 1.7 9 1.7 11,050 38 — — — — Macedoniai 2.1 11 10 0.1 1 2.1 1.9 9 1.4 14,590 58 500 40 13 0.1 0 Malta 0.5 10 7 0.3 19 0.5 0.5 7.4 1.4 36,740 95 5,188 — — — Montenegro 0.6 12 11 0.1 -1 0.6 0.7 2.3 1.8 19,150 67 7,153 23 15 0.1 0 Portugal 10.3 8 11 -0.2 0 10.0 9.2 2.6 1.4 31,490 65 908 74 67 0.8 0 San Marino 0.03 7 8 -0.2 5 0.04 0.04 3.8 1.0 — 97 3,336 — — — Serbia 7.0 9 14 -0.5 3 8.1 6.7 5.4 1.5 14,040 60 271 58 18 0.1 0 Slovenia 2.1 10 10 0.0 1 2.1 1.9 1.8 1.6 33,910 55 1,123 — — 0.1 Spain 46.7 8 9 -0.1 4 45.9 44.3 2.8 1.3 38,090 80 379 71f 70f 0.6 0 OCEANIA 41 17 7 1.0 7 50 64 21 2.3 33,668 67 86 57 53 0.3 0 Australia 24.1 13 7 0.6 10 30.1 37.6 3.4 1.7 45,780 86 52 67 65 0.2 Federated States of Micronesia 0.1 22 6 1.6 -13 0.1 0.1 32 3.0 4,210 23 5,288 — — — Fiji 0.9 18 7 1.1 -5 0.9 1.0 14 2.3 9,090 56 539 — — — French Polynesia 0.3 14 5 0.9 -5 0.3 0.3 7.5 1.8 — 62 11,079 — — — Guam 0.2 21 6 1.5 -11 0.2 0.2 13.1 3.2 — 95 16,467 67f 58f — Kiribati 0.1 29 7 2.2 -4 0.1 0.2 44 3.8 3,850 54 5,757 22 18 — Marshall Islands 0.06 27 4 2.3 -18 0.06 0.06 22 4.1 5,560 77 2,754 45 42 — Nauru 0.01 30 8 2.3 -11 0.01 0.01 18 3.9 17,960 100 — 36 25 — New Caledonia 0.3 15 6 1.0 4 0.3 0.3 12 2.1 — 71 4,559 — — — New Zealand 4.9 12 7 0.5 15 5.6 6.1 3.9 1.8 39,560 86 830 — — 0.2 0 Palau 0.02 12 10 0.2 1 0.02 0.03 17 2.0 13,950 80 1,782 33f 30f — Papua New Guinea 8.5 29 7 2.2 -0 10.9 15.4 46 3.8 4,040 13 2,828 32 24 0.7 1 Samoa 0.2 25 4 2.0 -13 0.2 0.3 14 3.8 6,390 19 2,483 27 24 — Solomon Islands 0.7 28 5 2.4 -4 0.8 1.1 25 3.8 2,270 24 3,421 29 24 — Tonga 0.1 24 6 1.8 -10 0.1 0.1 19 3.6 6,050 23 554 34 28 — Tuvalu 0.01 25 9 1.5 -12 0.01 0.01 10 3.6 5,780 62 — 31 22 — Vanuatu 0.3 27 5 2.2 0 0.4 0.6 22 3.5 3,170 25 1,516 49 37 — Population (millions) mid-2018 Births per 1,000 Population Deaths per 1,000 Population Rate of Natural Increase (%) Net Migration Rate Population (millions) Infant Mortality Ratea Total Fertility Rateb GNI per Capita, PPP 2017c Percent Urban Population per km2 of Arable Land Married Women 15-49 Using Contraceptiond (%) Ages 15-49 With HIV/AID mid-2030 mid-2050 All Methods Modern Methods Males 2017 Female WORLD 7,621 19 7 1.2 0 8,571 9,852 31 2.4 16,927 55 535 62 56 — — MORE DEVELOPED 1,266 10 10 0.0 3 1,301 1,312 5 1.6 43,409 79 242 68 59 — — LESS DEVELOPED 6,355 21 7 1.4 -1 7,270 8,540 34 2.6 11,445 50 704 61 55 — — LESS DEVELOPED (Excl. China) 4,953 23 7 1.7 -1 5,841 7,187 37 2.8 9,840 48 632 54 47 0.9 1 LEAST DEVELOPED 1,027 33 8 2.5 -1 1,342 1,954 49 4.2 2,723 33 585 37 33 1.5 2 AFRICA 1,284 35 9 2.6 -1 1,714 2,586 50 4.6 4,965 43 546 36 32 2.7 4 NORTHERN AFRICA 235 26 6 2.0 -1 289 385 24 3.3 10,557 52 548 52 47 0.1 0 Algeria 42.7 26 4 2.2 -0 51.3 64.3 22 3.1 15,050 73 572 57 50 0.1 0 Egypt 97.0 27 6 2.1 -1 120.8 166.5 15 3.4 11,360 43 3,350 59 57 0.1 0 Libya 6.5 20 5 1.4 -4 7.3 8.1 22 2.3 19,940 80 376 42 20 — — Morocco 35.2 18 5 1.2 -2 39.3 43.6 22 2.2 8,063 62 433 67 59 0.1 0 Sudan 41.7 34 8 2.7 -2 56.8 88.1 45 4.7 4,482 36 210 12 12 0.2 0 Tunisia 11.6 19 6 1.4 -0 12.7 13.8 15 2.3 11,490 68 399 63 51 0.1 0 Western Sahara 0.6 20 5 1.5 7 0.7 0.9 30 2.3 — 87 14,150 — — — — SUB-SAHARAN AFRICA 1,049 37 9 2.7 -0 1,425 2,200 54 4.9 3,683 40 546 33 28 3.3 5 WESTERN AFRICA 382 38 11 2.7 -1 518 809 62 5.3 4,174 46 445 24 18 1.8 2 Benin 11.5 37 9 2.8 -0 15.6 23.9 63 5.0 2,260 45 425 18 13 0.7 1 Burkina Faso 20.3 40 9 3.1 -1 28.9 48.5 57 5.5 1,810 29 338 32 30 0.6 1 Cabo Verde 0.6 19 5 1.4 -3 0.6 0.6 21 2.2 6,570 66 1,101 61 57 0.5 0 Côte d’Ivoire 24.9 35 12 2.3 0 33.3 51.4 62 4.6 3,820 51 859 24 19 1.9 3 Gambia 2.2 39 8 3.1 -1 3.1 5.0 46 5.4 1,670 61 494 9 8 1.4 1 Ghana 29.5 30 8 2.2 -1 37.3 51.3 37 3.9 4,490 56 627 33 27 1.0 2 Guinea 11.9 39 11 2.8 -2 16.3 25.3 68 4.8 2,270 35 383 9 8 1.1 1 Guinea-Bissau 1.9 36 11 2.6 -1 2.5 3.6 73 4.6 1,700 43 636 16 14 2.6 4 Liberia 4.9 33 8 2.5 -1 6.5 9.8 50 4.2 710 51 971 31 31 1.0 1 Mali 19.4 45 10 3.5 -4 27.5 44.8 56 6.0 2,160 42 303 16 15 0.9 1 Mauritania 4.5 34 8 2.6 1 6.1 9.0 65 4.6 3,900 54 1,009 18 16 0.4 0 Niger 22.2 48 10 3.8 -0 34.0 63.1 60 7.2 990 16 132 19 18 0.3 0 Nigeria 195.9 39 12 2.6 -0 264.1 410.6 67 5.5 5,680 50 576 24 16 2.5 3 Senegal 16.3 33 6 2.7 -1 22.1 34.0 42 4.6 2,620 46 509 28 26 0.3 0 Sierra Leone 7.7 33 13 2.0 -1 9.7 13.0 84 4.2 1,480 41 487 17 16 1.1 1 Togo 8.0 34 9 2.5 -0 10.5 15.3 52 4.5 1,620 42 302 20 17 1.5 2 EASTERN AFRICA 432 36 8 2.8 -1 584 883 45 4.7 2,192 28 651 41 38 3.4 5 Burundi 11.8 41 11 3.0 -0 17.2 30.4 47 5.5 770 13 987 29 23 0.8 1 Comoros 0.8 33 7 2.5 -2 1.1 1.5 55 4.3 1,570 29 1,281 19 14 0.1 0 Djibouti 1.0 23 8 1.5 1 1.1 1.3 52 2.9 — 78 48,550 19 18 1.1 1 Eritrea 6.0 30 7 2.3 -15 6.8 8.9 46 4.1 1,500 40 865 8 7 0.4 0 Ethiopia 107.5 33 7 2.6 -0 139.6 190.9 40 4.4 1,890 20 711 37 35 0.7 1 Kenya 51.0 31 6 2.6 -0 67.0 95.5 36 3.9 3,250 32 878 62 60 3.5 6 Madagascar 26.3 32 6 2.6 -0 35.6 53.8 32 4.1 1,510 37 750 40 33 0.4 0 Malawi 19.1 34 7 2.6 -1 25.6 37.4 42 4.2 1,180 17 502 59 58 7.4 11 Mauritius 1.3 11 8 0.3 -1 1.3 1.2 11.8 1.4 22,570 41 1,710 64 32 — — Mayotte 0.3 39 3 3.6 -0 0.4 0.6 4 5.1 — 46 2,970 — — — — Mozambique 30.5 39 10 2.9 -0 42.4 67.8 65 5.3 1,200 32 540 27 25 9.9 15 Réunion 0.9 16 6 1.0 -4 0.9 1.0 7 2.4 — 100 2,539 — — — — Rwanda 12.6 32 6 2.6 -1 16.6 24.3 32 4.2 1,990 19 1,091 53 48 1.9 3 Seychelles 0.1 17 8 1.0 -3 0.1 0.1 13.4 2.4 26,860 57 64,364 — — — — Somalia 15.2 43 11 3.2 -3 21.5 35.9 72 6.3 — 45 1,380 15 14 0.1 0 South Sudan 13.0 37 11 2.6 4 17.9 27.9 69 5.0 1,440 20 — 4 2 2.0 2 Tanzania 59.1 39 7 3.3 -1 83.7 138.1 43 5.2 2,916 34 438 38 32 3.4 5 Uganda 44.1 41 9 3.2 -1 61.6 95.6 43 5.4 1,820 24 639 42 36 4.5 7 Zambia 17.7 39 8 3.1 -0 25.8 45.1 49 5.2 3,920 44 465 49 45 8.8 14 POPULATION, HEALTH, AND ENVIRONMENT DATA AND ESTIMATES FOR THE COUNTRIESPOPULATION, HEALTH, AND ENVIRONMENT DATA AND ESTIMATES FOR THE COUNTRIES, TERRITORIES, AND REGIONS OF THE WORLD
  • 18.
    © 2018 PopulationReference Bureau See notes on page 18 2018 WORLD POPULATION DATA SHEET 17 52 80 573 72 70 0.4 0.1 79 84 19 22 15 15 1.0 20 29 1.5 660 58 657 66 63 0.2 0.1 79 84 19 22 14 13 1.0 19 31 1.8 960 98 1,375 67 66 — — 79 84 18 22 17 16 1.1 19 27 1.6 720 80 352 78 73 0.6 0.3 80 85 20 23 18 17 1.0 20 27 1.5 760 77 699 69f 69f 0.2 0.1 78 83 18 21 13 13 0.9 21 31 1.4 — 14 1,771 — — — — 81 84 — — 15 — — 17 — — 640 91 968 — — 0.4 0.1 80 84 19 22 16 16 1.3 14 23 2.2 — 100 — — — — — — — — — 13 — — 26 — — 640 92 1,668 73 70 0.3 0.1 80 83 19 21 16 15 1.0 18 28 1.6 910 85 2,138 73 69 — — 82 85 20 23 15 14 1.1 18 29 1.9 46 69 150 66 52 1.0 0.7 69 78 14 18 17 16 0.8 16 25 1.4 140 78 167 63 52 0.5 0.4 69 79 13 18 17 17 1.0 15 24 1.6 500 73 200 69 40 0.1 0.1 71 78 14 18 14 14 0.8 21 29 1.1 010 74 339 86f 78f 0.1 0.1 76 82 16 20 16 15 0.9 19 30 1.5 220 71 221 62 54 0.1 0.1 72 79 15 19 15 14 0.9 19 28 1.4 060 43 195 60 42 0.7 0.4 68 76 12 16 16 13 0.6 11 24 1.7 170 60 353 51 41 — — 74 82 16 20 15 12 0.7 17 32 1.6 150 54 222 70 51 0.2 0.1 72 79 15 18 16 14 0.7 18 28 1.2 893 74 120 68 55 1.4 0.9 68 78 13 18 18 17 0.9 14 22 1.5 360 54 394 — — 0.1 0.1 74 80 15 19 16 14 0.8 16 29 1.7 900 70 130 65 48 1.0 0.9 67 76 13 17 15 15 0.8 16 25 1.3 94 71 546 67 54 0.4 0.2 79 84 19 22 14 13 0.8 20 34 1.6 120 60 466 69 11 0.1 0.1 77 80 16 19 18 13 0.7 14 28 1.8 — 88 10,025 — — — — — — — — 14 — — 14 — — 880 48 340 46 12 — — 74 79 15 18 14 13 0.8 16 29 1.6 700 57 488 — — — — 74 80 15 19 15 13 0.8 19 30 1.3 820 79 477 76f 46f 0.3 0.1 78 84 18 21 14 12 0.8 21 35 1.6 030 70 917 65 52 0.3 0.2 81 85 20 22 13 13 0.9 23 35 1.5 050 38 — — — — — 74 79 — — 24 — — 8 — — 590 58 500 40 13 0.1 0.1 73 78 15 16 17 14 0.8 14 25 1.7 740 95 5,188 — — — — 81 84 18 20 14 13 0.9 19 29 1.5 150 67 7,153 23 15 0.1 0.1 74 79 15 18 18 15 0.9 15 26 1.9 490 65 908 74 67 0.8 0.3 78 83 18 22 14 12 0.8 21 36 1.5 — 97 3,336 — — — — 82 87 — — 15 — — 18 — — 040 60 271 58 18 0.1 0.1 73 78 14 17 14 15 1.0 19 25 1.3 910 55 1,123 — — 0.1 0.1 78 84 18 21 15 14 0.9 19 33 1.6 090 80 379 71f 70f 0.6 0.2 80 86 19 23 15 13 0.8 19 36 1.8 68 67 86 57 53 0.3 0.3 76 80 19 22 24 20 1.3 12 18 2.3 780 86 52 67 65 0.2 0.1 80 85 20 22 19 17 1.4 16 22 2.2 210 23 5,288 — — — — 68 70 13 14 34 23 0.7 5 7 1.7 090 56 539 — — — — 67 73 12 16 29 21 0.8 6 14 2.7 — 62 11,079 — — — — 74 78 16 18 24 16 0.8 8 21 3.2 — 95 16,467 67f 58f — — 76 82 17 20 25 18 0.9 9 19 2.7 850 54 5,757 22 18 — — 63 70 12 14 35 28 1.4 4 8 3.5 560 77 2,754 45 42 — — 71 73 — — 41 — — 3 — — 960 100 — 36 25 — — 58 65 — — 37 — — 13 — — — 71 4,559 — — — — 74 80 15 19 23 18 0.9 9 18 2.5 560 86 830 — — 0.2 0.1 80 83 19 22 19 16 1.1 15 24 2.0 950 80 1,782 33f 30f — — 70 77 — — 21 — — 7 — — 040 13 2,828 32 24 0.7 1.0 63 68 12 15 36 27 1.4 4 7 3.5 390 19 2,483 27 24 — — 74 76 14 19 38 28 1.0 5 11 3.0 270 24 3,421 29 24 — — 70 73 13 15 39 28 1.2 4 8 3.9 050 23 554 34 28 — — 70 76 13 18 36 28 1.0 6 10 2.1 780 62 — 31 22 — — 67 72 — — 33 — — 5 — — 170 25 1,516 49 37 — — 70 74 14 16 36 27 1.4 4 10 4.2 Capita, 017c Percent Urban Population per km2 of Arable Land Married Women 15-49 Using Contraceptiond (%) Ages 15-49 With HIV/AIDS (%) Life Expectancy at Birth (Years) Life Expectancy at Age 65 (Years) Population Ages 15 Population Ages 65+ All Methods Modern Methods Males 2017 Females 2017 Males Females Males Females 2018 (%) 2050 (%) 2050 as a Multiple of 2018e 2018 (%) 2050 (%) 2050 as a Multiple of 2018e 27 55 535 62 56 — — 70 74 16 18 26 21 1.1 9 16 2.3 409 79 242 68 59 — — 76 82 18 21 16 16 1.0 18 27 1.5 445 50 704 61 55 — — 69 73 15 17 28 22 1.1 7 14 2.8 840 48 632 54 47 0.9 1.3 67 71 15 17 31 24 1.1 6 12 3.0 723 33 585 37 33 1.5 2.3 63 66 14 15 40 31 1.5 4 7 3.5 65 43 546 36 32 2.7 4.3 61 64 13 15 41 32 1.6 3 6 3.4 57 52 548 52 47 0.1 0.1 71 74 15 16 32 25 1.2 5 12 3.8 050 73 572 57 50 0.1 0.1 77 78 18 19 29 20 1.0 6 17 4.3 360 43 3,350 59 57 0.1 0.1 71 74 13 15 34 25 1.3 4 11 4.7 940 80 376 42 20 — — 69 75 13 16 28 18 0.8 4 17 4.6 063 62 433 67 59 0.1 0.1 75 78 15 17 24 19 0.9 8 18 2.7 482 36 210 12 12 0.2 0.2 63 66 14 15 41 31 1.6 4 6 3.4 490 68 399 63 51 0.1 0.1 75 78 15 18 24 18 0.9 8 20 2.9 — 87 14,150 — — — — 68 72 13 15 28 20 1.1 3 12 6.8 683 40 546 33 28 3.3 5.2 59 62 13 14 43 33 1.6 3 5 3.3 74 46 445 24 18 1.8 2.4 56 58 11 12 44 35 1.7 3 4 3.2 260 45 425 18 13 0.7 1.3 59 62 13 14 43 34 1.6 3 5 3.1 810 29 338 32 30 0.6 1.0 60 61 12 12 47 35 1.8 3 4 3.4 570 66 1,101 61 57 0.5 0.7 71 75 14 16 31 19 0.7 4 12 3.2 820 51 859 24 19 1.9 3.7 52 55 11 12 43 35 1.7 3 4 2.8 670 61 494 9 8 1.4 1.9 60 63 12 13 46 33 1.7 2 4 4.0 490 56 627 33 27 1.0 2.3 62 64 12 13 39 30 1.3 3 6 3.3 270 35 383 9 8 1.1 1.9 58 61 12 12 45 33 1.5 4 5 2.7 700 43 636 16 14 2.6 4.1 56 59 12 12 42 32 1.4 3 5 3.3 710 51 971 31 31 1.0 1.8 62 64 12 13 42 32 1.6 3 5 3.6 160 42 303 16 15 0.9 1.6 58 62 12 12 47 36 1.8 2 4 3.8 900 54 1,009 18 16 0.4 0.3 62 65 12 13 40 32 1.6 3 6 3.6 990 16 132 19 18 0.3 0.3 59 61 12 13 50 43 2.4 3 3 2.9 680 50 576 24 16 2.5 3.0 53 54 11 11 44 35 1.7 3 4 3.1 620 46 509 28 26 0.3 0.6 65 69 13 14 43 33 1.6 3 5 3.8 480 41 487 17 16 1.1 1.6 51 52 10 10 42 29 1.2 3 5 3.1 620 42 302 20 17 1.5 2.7 59 61 12 12 42 32 1.5 3 5 3.5 92 28 651 41 38 3.4 5.6 62 66 14 15 43 32 1.5 3 5 3.5 770 13 987 29 23 0.8 1.4 59 62 13 14 46 36 2.1 2 4 4.2 570 29 1,281 19 14 0.1 0.1 62 65 12 14 40 30 1.3 3 6 3.5 — 78 48,550 19 18 1.1 1.5 61 64 14 15 32 21 0.9 4 10 3.3 500 40 865 8 7 0.4 0.7 62 68 13 14 41 30 1.1 4 6 2.3 890 20 711 37 35 0.7 1.2 64 67 14 15 41 26 1.1 4 7 3.3 250 32 878 62 60 3.5 6.2 65 69 14 16 41 29 1.3 3 7 5.1 510 37 750 40 33 0.4 0.2 64 68 13 14 41 32 1.6 3 6 4.0 180 17 502 59 58 7.4 11.7 61 66 14 15 44 32 1.4 3 5 3.2 570 41 1,710 64 32 — — 71 78 15 19 19 14 0.7 11 24 2.2 — 46 2,970 — — — — 74 77 18 22 44 27 1.3 3 10 8.1 200 32 540 27 25 9.9 15.0 56 60 13 14 45 35 1.7 3 4 3.0 — 100 2,539 — — — — 78 84 18 22 24 17 0.8 11 25 2.6 990 19 1,091 53 48 1.9 3.4 65 69 14 15 40 27 1.3 3 8 5.0 860 57 64,364 — — — — 68 78 14 18 22 18 0.8 8 23 2.8 — 45 1,380 15 14 0.1 0.1 55 58 13 13 47 38 1.9 3 3 2.9 440 20 — 4 2 2.0 2.9 56 58 13 14 42 32 1.7 3 5 3.0 916 34 438 38 32 3.4 5.5 64 67 14 15 45 36 1.9 3 5 3.6 820 24 639 42 36 4.5 7.3 62 64 13 14 48 36 1.6 3 4 3.0 920 44 465 49 45 8.8 14.3 59 64 14 15 45 36 2.0 2 4 4.5 MENT DATA AND ESTIMATES FOR THE COUNTRIES, TERRITORIES, AND REGIONS OF THE WORLD WESTERN EUROPE 195 10 10 0.0 4 201 203 3 1.7 49,652 80 573 72 70 0.4 0 Austria 8.8 10 9 0.0 5 9.3 9.7 2.9 1.5 52,660 58 657 66 63 0.2 0 Belgium 11.4 10 10 0.1 4 12.0 12.7 3.3 1.6 47,960 98 1,375 67 66 — France 65.1 11 9 0.2 1 68.5 72.3 3.6 1.9 43,720 80 352 78 73 0.6 0 Germany 82.8 9 11 -0.2 6 82.9 79.1 3.3 1.6 51,760 77 699 69f 69f 0.2 0 Liechtenstein 0.04 10 7 0.3 5 0.04 0.04 4.2 1.6 — 14 1,771 — — — Luxembourg 0.6 10 7 0.3 18 0.7 0.8 3.3 1.4 72,640 91 968 — — 0.4 0 Monaco 0.04 7 6 0.1 20 0.04 0.05 — 1.5 — 100 — — — — Netherlands 17.2 10 9 0.1 5 17.9 18.4 3.5 1.6 52,640 92 1,668 73 70 0.3 0 Switzerland 8.5 10 8 0.2 6 9.5 10.3 3.5 1.5 65,910 85 2,138 73 69 — EASTERN EUROPE 293 11 12 -0.2 1 286 265 5 1.5 23,046 69 150 66 52 1.0 0 Belarus 9.5 11 13 -0.2 0 9.5 9.5 3.2 1.5 18,140 78 167 63 52 0.5 0 Bulgaria 7.0 9 16 -0.7 -1 6.6 5.8 6.4 1.6 20,500 73 200 69 40 0.1 0 Czechia 10.6 11 11 0.0 3 10.7 10.5 2.7 1.7 35,010 74 339 86f 78f 0.1 0 Hungary 9.8 9 14 -0.4 1 9.6 9.2 3.6 1.5 27,220 71 221 62 54 0.1 0 Moldova 3.5 11 11 0.0 0 3.4 2.9 9 1.3 6,060 43 195 60 42 0.7 0 Poland 38.4 11 11 0.0 0 37.2 34.0 4.0 1.4 28,170 60 353 51 41 — Romania 19.5 10 13 -0.4 -2 17.9 15.1 7.1 1.4 25,150 54 222 70 51 0.2 0 Russia 147.3 12 12 -0.1 2 146.1 137.9 5.5 1.6 24,893 74 120 68 55 1.4 0 Slovakia 5.4 11 10 0.1 1 5.4 5.0 4.5 1.5 31,360 54 394 — — 0.1 0 Ukraine 42.3 9 14 -0.5 0 39.6 35.0 7.7 1.3 8,900 70 130 65 48 1.0 0 SOUTHERN EUROPE 153 8 10 -0.2 2 153 144 3 1.4 34,394 71 546 67 54 0.4 0 Albania 2.9 11 8 0.3 -5 2.8 2.5 8.0 1.6 12,120 60 466 69 11 0.1 0 Andorra 0.08 8 4 0.4 21 0.08 0.08 3.4 1.1 — 88 10,025 — — — Bosnia-Herzegovina 3.5 9 10 -0.2 0 3.7 3.1 6 1.3 12,880 48 340 46 12 — Croatia 4.1 9 12 -0.3 -5 3.9 3.5 4.3 1.4 24,700 57 488 — — — Greece 10.6 9 11 -0.2 -4 10.8 10.0 4.2 1.3 27,820 79 477 76f 46f 0.3 0 Italy 60.6 8 11 -0.3 3 60.1 57.6 2.9 1.3 40,030 70 917 65 52 0.3 0 Kosovoh 1.8 13 5 0.8 0 1.8 1.7 9 1.7 11,050 38 — — — — Macedoniai 2.1 11 10 0.1 1 2.1 1.9 9 1.4 14,590 58 500 40 13 0.1 0 Malta 0.5 10 7 0.3 19 0.5 0.5 7.4 1.4 36,740 95 5,188 — — — Montenegro 0.6 12 11 0.1 -1 0.6 0.7 2.3 1.8 19,150 67 7,153 23 15 0.1 0 Portugal 10.3 8 11 -0.2 0 10.0 9.2 2.6 1.4 31,490 65 908 74 67 0.8 0 San Marino 0.03 7 8 -0.2 5 0.04 0.04 3.8 1.0 — 97 3,336 — — — Serbia 7.0 9 14 -0.5 3 8.1 6.7 5.4 1.5 14,040 60 271 58 18 0.1 0 Slovenia 2.1 10 10 0.0 1 2.1 1.9 1.8 1.6 33,910 55 1,123 — — 0.1 Spain 46.7 8 9 -0.1 4 45.9 44.3 2.8 1.3 38,090 80 379 71f 70f 0.6 0 OCEANIA 41 17 7 1.0 7 50 64 21 2.3 33,668 67 86 57 53 0.3 0 Australia 24.1 13 7 0.6 10 30.1 37.6 3.4 1.7 45,780 86 52 67 65 0.2 Federated States of Micronesia 0.1 22 6 1.6 -13 0.1 0.1 32 3.0 4,210 23 5,288 — — — Fiji 0.9 18 7 1.1 -5 0.9 1.0 14 2.3 9,090 56 539 — — — French Polynesia 0.3 14 5 0.9 -5 0.3 0.3 7.5 1.8 — 62 11,079 — — — Guam 0.2 21 6 1.5 -11 0.2 0.2 13.1 3.2 — 95 16,467 67f 58f — Kiribati 0.1 29 7 2.2 -4 0.1 0.2 44 3.8 3,850 54 5,757 22 18 — Marshall Islands 0.06 27 4 2.3 -18 0.06 0.06 22 4.1 5,560 77 2,754 45 42 — Nauru 0.01 30 8 2.3 -11 0.01 0.01 18 3.9 17,960 100 — 36 25 — New Caledonia 0.3 15 6 1.0 4 0.3 0.3 12 2.1 — 71 4,559 — — — New Zealand 4.9 12 7 0.5 15 5.6 6.1 3.9 1.8 39,560 86 830 — — 0.2 0 Palau 0.02 12 10 0.2 1 0.02 0.03 17 2.0 13,950 80 1,782 33f 30f — Papua New Guinea 8.5 29 7 2.2 -0 10.9 15.4 46 3.8 4,040 13 2,828 32 24 0.7 1 Samoa 0.2 25 4 2.0 -13 0.2 0.3 14 3.8 6,390 19 2,483 27 24 — Solomon Islands 0.7 28 5 2.4 -4 0.8 1.1 25 3.8 2,270 24 3,421 29 24 — Tonga 0.1 24 6 1.8 -10 0.1 0.1 19 3.6 6,050 23 554 34 28 — Tuvalu 0.01 25 9 1.5 -12 0.01 0.01 10 3.6 5,780 62 — 31 22 — Vanuatu 0.3 27 5 2.2 0 0.4 0.6 22 3.5 3,170 25 1,516 49 37 — POPULATION, HEALTH, AND ENVIRONMENT DATA AND ESTIMATES FOR THE COUNTRIES, TERRITORIES, AND REGIONS OF THE WORLD
  • 19.
    © 2018 PopulationReference Bureau 2018 WORLD POPULATION DATA SHEET 18 worldpopdata.orgCHANGING AGE STRUCTURES Acknowledgments This publication is funded by the William and Flora Hewlett Foundation, the U.S. Agency for International Development (USAID) (PACE Project, No. AID- 0AA-A-16-00002), and individual supporters. The contents are the responsibility of Population Reference Bureau and do not necessarily reflect the views of USAID or the United States government. Notes The Data Sheet lists all geopolitical entities with populations of 150,000 or more and all members of the UN, including sovereign states, dependencies, overseas departments, and some territories whose status or boundaries may be undetermined or in dispute. More developed regions, following the UN classification, comprise all of Europe and North America, plus Australia, Japan, and New Zealand. All other regions and countries are classified as less developed. The least developed countries consist of 47 countries with especially low incomes, high economic vulnerability, and poor human development indicators. The criteria and list of countries, as defined by the UN, can be found at http://unohrlls. org/about-ldcs/. World and Regional Totals: Regional population totals are independently rounded and include small countries or areas not shown. Regional and world rates and percentages are weighted averages of countries for which data are available. Regional averages are shown when data or estimates are available for at least three-quarters of the region’s population. World Population Data Sheets from different years should not be used as a time series. Fluctuations in values from year to year often reflect revisions based on new data or estimates rather than actual changes in levels. Sources The rates and figures are primarily compiled from the following sources: national statistical offices’ websites, regional organizations’ websites, online databases, statistical yearbooks, and bulletins from various countries; demographic surveys such as the Demographic and Health Surveys, Multiple Indicator Cluster Surveys, and Performance and Monitoring Accountability 2020 Surveys; the UN Demographic Yearbook 2016 and Population and Vital Statistics Report of the UN Statistics Division; World Population Prospects: The 2017 Revision, World Contraceptive Use 2018, and World Urbanization Prospects: The 2018 Revision of the UN Population Division; the International Data Base of the International Programs Center, U.S. Census Bureau; World Development Indicators online database of the World Bank; AIDSinfo online database of the UNAIDS; and FAOSTAT online database of the Food and Agricultural Organization of the United Nations. The sources also include direct communication with demographers and country experts from around the world. Specific data sources may be obtained by contacting the authors of the 2018 World Population Data Sheet. For countries with complete registration of births and deaths, rates are those most recently reported. For more developed countries, vital rates refer to 2017 or 2016. Definitions MID-2018 POPULATION AND PROJECTED POPULATION, 2030 AND 2050 Current estimates and projections are based on a recent census, official national data, or analyses conducted by national statistical offices, regional organizations, PRB, UN Population Division, or International Programs of the U.S. Census Bureau. The effects of refugee movements, large numbers of foreign workers, and population shifts due to current events are taken into account to the extent possible. Projected populations are based on reasonable assumptions on the future course of fertility, mortality, and migration. BIRTH AND DEATH RATE The annual number of births and deaths per 1,000 total population. RATE OF NATURAL INCREASE The birth rate minus the death rate, expressed as a percentage. This value represents the estimated rate of population growth without regard for migration. NET MIGRATION RATE The estimated net migration (immigration minus emigration) per 1,000 population. For some countries, data are derived as a residual from estimated birth, death, and population growth rates. INFANT MORTALITY RATE The annual number of deaths of infants under age 1 per 1,000 live births. Decimals indicate national statistics reported as completely registered; those without are estimates from the sources cited above. Rates shown in italics are based on fewer than 50 annual infant deaths and, as a result, are subject to considerable yearly variability; rates shown for such countries are estimated from an average of the previous three years. TOTAL FERTILITY RATE The average number of children a woman would have assuming that current age-specific birth rates remain constant throughout her childbearing years (usually considered to be ages 15 to 49). GNI PER CAPITA PPP, 2017 ($ CURRENT INTERNATIONAL) GNI per capita PPP is gross national income in purchasing power parity (PPP) divided by mid-year population. PERCENT URBAN Percentage of the total population living in areas termed “urban” by that country or by the UN. POPULATION PER SQUARE KILOMETER OF ARABLE LAND The mid-year 2018 population divided by the square kilometers of arable land. CONTRACEPTIVE USE The percentage of currently married or “in union” women (unless otherwise indicated) of reproductive age who are currently using any form of contraception. Modern methods comprise clinic and supply methods, including the pill, injectable, implant, IUD, condom, and sterilization. The inclusions of lactational amenorrhea and/or Standard Days Method in modern methods vary across countries. Data are from the most recently available national-level surveys since 2000. Data prior to 2012 are shown in italics. AGES 15-49 WITH HIV/AIDS BY SEX, 2017 The percentage of the population ages 15 to 49 living with HIV/AIDS. LIFE EXPECTANCY AT BIRTH/AGE 65 BY SEX The average number of years a newborn infant or a 65-year-old can expect to live under current mortality rates. POPULATION AGES 15/AGES 65+, 2018 AND 2050 The current percentage estimates and projections of the total population in those age groups, which are often considered the “dependent ages.” POPULATION IN 2050 AGES 15/AGES 65+ AS A MULTIPLE OF 2018 POPULATION A ratio of the projected 2050 population ages 15 or ages 65+ over the 2018 population for corresponding ages. For example, a ratio of 2 for those ages 15 indicates that the 2050 population for that age group is projected to be twice the size of its 2018 population. This indicator was calculated using unrounded numbers. Thus, the numbers may not match the calculation using the rounded population size and percent that appear on the data sheet. For additional notes, see the reverse side. Data prepared by PRB demographers Toshiko Kaneda, Charlotte Greenbaum, and Kaitlyn Patierno. © August 2018. Population Reference Bureau. All rights reserved. ISSN 0085-8315 Cover photo: Seng Kit Loy / EyeEm. Notes A date range indicates the most recent data point during that time period. (—) Indicates data unavailable or inapplicable. a Infant deaths per 1,000 live births. Rates shown with decimals indicate national statistics reported as completely registered, while those with no decimal are estimates from the sources cited on the reverse. Rates shown in italics are based on fewer than 50 annual infant deaths, so the figure is estimated from an average of the previous three years. b Average number of children born to a woman during her lifetime. c In current international dollars. Data prior to 2017 are shown in italics. d Data prior to 2012 are shown in italics. e This indicator is the 2050 population ages 15 or ages 65+ divided by the 2018 population for corresponding ages using unrounded numbers. The indicator value may therefore not match a hand calculation using the rounded population size and percent that appear on the data sheet. f Data refer to sexually active women, ever-married women, or all women. g Special Administrative Region. h Kosovo declared independence from Serbia on Feb. 17, 2008. Serbia has not recognized Kosovo’s independence. i The former Yugoslav Republic.
  • 20.
    PRB’s 2018 WorldPopulation Data Sheet is available in English and French at worldpopdata.org. Also online, find a customized digital data sheet with an interactive map, chart, and table tool. To order PRB publications (discounts available for bulk orders): • Online at www.prb.org • E-mail: [email protected] • Call toll-free: 800-877-9881 • Fax: 202-328-3937 • Mail: 1875 Connecticut Ave., NW, Suite 520, Washington, DC 20009. PRB.ORG 1875 Connecticut Avenue, NW, Suite 520 Washington, D.C. 20009 USA 800-877-9881 [email protected] Stay connected with PRB @prbdata CORE THEMES CHILDREN FAMILIES AGING HEALTH NUTRITION POPULATION CHANGE PEOPLE, HEALTH, PLANET INEQUALITY POVERTY FAMILY PLANNING REPRODUCTIVE HEALTH YOUTHGENDER The Population Reference Bureau informs people around the world about population, health, and the environment, and empowers them to use that information to advance the well-being of current and future generations. U.S. CENSUS THE AMERICAN COMMUNITY SURVEY Please support us. The World Population Data Sheet reaches tens of thousands of people worldwide who count on it for essential data and insights. Please help PRB maintain its commitment to this and other public information products by visiting prb.org and clicking on the “Donate” button at the top right side of the page. View our interactive Annual Report to learn more about PRB’s activities and impact at prb.org/annualreport