SlideShare a Scribd company logo
Debugging applications with the GNU Debugger Presenter: Prakash Varandani
When to use a debugger? Point-in-time debugging When a problem is easily reproducible. When the problem behavior can be predicted When a problem can be localized to a small period of time When system level problem determination tools do not help When the source code is readily available.
When not to use debugger? When causes of a problem span a long history and time. Problem is difficult to predict in nature. Problem is not reproducible at will.
Why gdb? Easily available. Easy installation. Configurable. Support for various Object File Formats. Support for various architectures. Rich feature set. Open Source (Of Course).
Compiling for Debugging. Compiling with the “-g” option:  e.g. gcc –g stack.c –o stack Preprocessor information: e.g. gcc –dwarf-2 –g3 stack.c –o stack
Attaching a process Run a program directly through the debugger. Attach to a running process. Use a core file for post-mortem analysis.
Invoking gdb Executable program: gdb program Executable and core file:  gdb program core. Executable and process:  gdb program <pid>.
Program’s arguments. (gdb) set args abc def (gdb) set args (gdb) run abc def Example 1:
gdb files It is possible to start gdb without any process/executable/core file. Add an executable (gdb) file/exec-file <executable> Attach to a already running process (gdb) attach <pid> Add a core file (gdb) core-file <filename>
Setting breakpoints: (gdb) break  function   (gdb) break +/- offset (gdb) break  linenum (gdb) break  filename : linenum   (gdb) break  filename : function   (gdb) break * address   (gdb) break ... if  cond   Example 2:
Setting breakpoints contd… (gdb) tbreak  args   (gdb) hbreak  args   (gdb) thbreak  args   (gdb) rbreak  regex
Watchpoints (gdb) watch  expr   (gdb) rwatch expr (gdb) awatch  expr   (gdb) info watchpoints   (provides similar information as    for info breakpoints)
Getting information about breakpoints info breakpoints [ n ]  Breakpoint Numbers   Type   Disposition   Enabled or Disabled   Address   What   Example 4:
Breakpoints contd… Simple breakpoints stop the program every time they are hit. (gdb) condition  bnum   expression   (gdb) condition  bnum (gdb) ignore  bnum  count (gdb) commands [ bnum ]  ...  command-list  ...  end  If  bnum  is not provided the commands refer to the last set breakpoint/watchpoint.
Breakpoints contd... (gdb) clear (gdb) clear  function (gdb) clear  linenum (gdb) delete [breakpoints] [range...] (gdb) disable [breakpoints] [range...] (gdb) enable [breakpoints] once range (gdb) enable [breakpoints] delete range
Continuing and Stepping (gdb) continue [ignore-count] (gdb) step [count] (gdb) next [count] (gdb) finish (gdb) until (gdb) until  location (gdb) stepi (gdb) nexti Example 5:
Examining the stack Frames: data associated with each function call like arguments, local variables, ra etc... The most recently created frame is called the innermost frame and the initial one is called the outermost frame. gdb assign numbers to the stack frames, 0 for the innermost and so on..
How we got there?.. backtraces backtrace, bt -> Print a backtrace of the entire stack. backtrace  n , bt  n  -> print n innermost frames. backtrace - n , bt – n ->  print n outermost frames. backtrace full -> Print the values of the local variables also.
Controlling backtrace set backtrace past-main [on/off]  to configure printing of system specific code. set backtrace past-entry [on/off] show backtrace past-entry  set backtrace limit  n   set backtrace limit 0 (unlimited) show backtrace limit
Selecting a frame (gdb) frame n, f n -> select frame n (gdb) frame  addr , f addr -> useful when the program has multiple stacks (highly system specific). (gdb) up [n] -> for positive n move “n” frames towards the outermost frame. (gdb) down [n] -> for positive n move “n” frames towards the innermost frame. If n  is not provided move one frame up or down.
Information about a frame (gdb) info frame This command prints a verbose description of the selected stack frame, including:  the address of the frame  the address of the next frame down (called by this frame)  the address of the next frame up (caller of this frame)  the language in which the source code corresponding to this frame is written  the address of the frame's arguments  the address of the frame's local variables  the program counter saved in it (the address of execution in the caller frame)  which registers were saved in the frame  This information is useful when a stack format fail to fit the usual convention.
Information about a frame ... (gdb) info frame  addr  , info f  addr (gdb) info args  (gdb) info locals
Printing source lines (gdb) list  linenum   (gdb) list  function   (gdb) list  (gdb) list – (gdb) list *address
Searching source files. (gdb) forward-search  regexp following the last line printed, search for a match with regexp and print the first line found. (gdb) search regexp  Same as forward-search. (gdb) reverse-search  regexp   Starting with the line one above the last line printed, search for a match with regexp and print the first line found.
Examining Data (gdb) print expr (gdb) print /f expr (gdb) print  (gdb) print /f
Output formats x -> hexadecimal d -> signed decimal u -> unsigned decimal o -> octal t -> binary c -> character f -> floating point a -> address format
Examining memory (gdb) x /nfu addr (gdb) x addr n -> the repeat count. Default 1. f -> format for printing. Default x    and changes eventually. u -> unit size, can be one of b -> byte h -> half word (2 bytes) w -> word (4 bytes) g -> giant word (8 bytes)
Automatic display (gdb) display expr (gdb) display /f expr (gdb) undisplay  dnums       delete display dnums (gdb) disable display  dnums   (gdb) enable display  dnums (gdb) display (gdb) info display
Assembly Language Disassembling a function: (gdb) disassemble main Dump of assembler code for function main: 0x00010754 <main+0>:  save  %sp, -120, %sp 0x00010758 <main+4>:  mov  3, %o0 0x0001075c <main+8>:  st  %o0, [ %fp + -20 ] 0x00010760 <main+12>:  ld  [ %fp + -20 ], %o0 0x00010764 <main+16>:  call  0x10718 <fun1> 0x00010768 <main+20>:  nop 0x0001076c <main+24>:  clr  %i0  ! 0x0 0x00010770 <main+28>:  b  0x10778 <main+36> 0x00010774 <main+32>:  nop 0x00010778 <main+36>:  ret 0x0001077c <main+40>:  restore End of assembler dump.
Looking into the registers A single register: (gdb) p $eax $4 = 6 (gdb) p $ecx $5 = 1 All of them: (gdb) info registers eax  0x6  6 ecx  0x1  1 edx  0x4015c490  1075168400 ebx  0x4015afd8  1075163096  … …
Signals (gdb) info signals (gdb) info handle (gdb) info signal  sig (gdb) handle  signal keywords keywords  can be stop/nostop print/noprint pass(noignore)/nopass(ignore)
Altering Execution Assigning values to variables at runtime using print/set. Continuing at a different address Sending a signal Cancelling execution of a function Calling program functions
Canning the commands define command can accept upto 10 arguments viz. arg0 to arg9 document command dont-repeat  help user-defined  show user
Command hooks run a sequence of commands when a particular command is executed. hook-<command> runs before <command> is executed. hookpost-<command> runs after command is executed. The pseudo command “stop”

More Related Content

What's hot (20)

PDF
How it's made: C++ compilers (GCC)
Sławomir Zborowski
 
PDF
JCL FOR FRESHERS
Nirmal Pati
 
PDF
系統程式 -- 第 1 章
鍾誠 陳鍾誠
 
PDF
LLVM 總是打開你的心:從電玩模擬器看編譯器應用實例
National Cheng Kung University
 
PDF
GNU Compiler Collection - August 2005
Saleem Ansari
 
PDF
系統程式 -- 第 7 章
鍾誠 陳鍾誠
 
PDF
Grub2 Booting Process
Mike Wang
 
PDF
系統程式 -- 第 8 章
鍾誠 陳鍾誠
 
PDF
系統程式 - 附錄
鍾誠 陳鍾誠
 
PDF
Toolchain
Anil Kumar Pugalia
 
DOCX
系統程式 -- 附錄
鍾誠 陳鍾誠
 
PDF
The Linux Block Layer - Built for Fast Storage
Kernel TLV
 
PPTX
Using gcov and lcov
test test
 
PDF
淺談探索 Linux 系統設計之道
National Cheng Kung University
 
DOCX
系統程式 -- 第 10 章 作業系統
鍾誠 陳鍾誠
 
PDF
Linux basic commands with examples
abclearnn
 
PPT
Android JNI
Siva Ramakrishna kv
 
PPT
Introduction to C++ over CLI
建興 王
 
PDF
系統程式 -- 第 4 章
鍾誠 陳鍾誠
 
How it's made: C++ compilers (GCC)
Sławomir Zborowski
 
JCL FOR FRESHERS
Nirmal Pati
 
系統程式 -- 第 1 章
鍾誠 陳鍾誠
 
LLVM 總是打開你的心:從電玩模擬器看編譯器應用實例
National Cheng Kung University
 
GNU Compiler Collection - August 2005
Saleem Ansari
 
系統程式 -- 第 7 章
鍾誠 陳鍾誠
 
Grub2 Booting Process
Mike Wang
 
系統程式 -- 第 8 章
鍾誠 陳鍾誠
 
系統程式 - 附錄
鍾誠 陳鍾誠
 
系統程式 -- 附錄
鍾誠 陳鍾誠
 
The Linux Block Layer - Built for Fast Storage
Kernel TLV
 
Using gcov and lcov
test test
 
淺談探索 Linux 系統設計之道
National Cheng Kung University
 
系統程式 -- 第 10 章 作業系統
鍾誠 陳鍾誠
 
Linux basic commands with examples
abclearnn
 
Android JNI
Siva Ramakrishna kv
 
Introduction to C++ over CLI
建興 王
 
系統程式 -- 第 4 章
鍾誠 陳鍾誠
 

Viewers also liked (20)

PDF
The Stack Frame
Ivo Marinkov
 
PDF
Smashing The Stack
Daniele Bellavista
 
PPTX
Introduction to Linux Exploit Development
johndegruyter
 
PDF
Exploit techniques and mitigation
Yaniv Shani
 
PPT
Introduction to pointers and memory management in C
Uri Dekel
 
PDF
Low Level Exploits
hughpearse
 
PPTX
How Functions Work
Saumil Shah
 
PDF
Insecure coding in C (and C++)
Olve Maudal
 
PDF
Ctf hello,world!
Hacks in Taiwan (HITCON)
 
PDF
Basic of Exploitation
Jongseok Choi
 
PPTX
OMFW 2012: Analyzing Linux Kernel Rootkits with Volatlity
Andrew Case
 
PPTX
Cybermania Prelims
Divye Kapoor
 
PDF
Kernel Recipes 2015: The stable Linux Kernel Tree - 10 years of insanity
Anne Nicolas
 
PPTX
A particle filter based scheme for indoor tracking on an Android Smartphone
Divye Kapoor
 
PDF
Linux performance
Will Sterling
 
PPTX
Cybermania Mains
Divye Kapoor
 
PDF
Rootkit 102 - Kernel-Based Rootkit
Chia-Hao Tsai
 
ODP
Linux Internals - Kernel/Core
Shay Cohen
 
PDF
The TCP/IP stack in the FreeBSD kernel COSCUP 2014
Kevin Lo
 
PDF
LAS16-403 - GDB Linux Kernel Awareness
Peter Griffin
 
The Stack Frame
Ivo Marinkov
 
Smashing The Stack
Daniele Bellavista
 
Introduction to Linux Exploit Development
johndegruyter
 
Exploit techniques and mitigation
Yaniv Shani
 
Introduction to pointers and memory management in C
Uri Dekel
 
Low Level Exploits
hughpearse
 
How Functions Work
Saumil Shah
 
Insecure coding in C (and C++)
Olve Maudal
 
Ctf hello,world!
Hacks in Taiwan (HITCON)
 
Basic of Exploitation
Jongseok Choi
 
OMFW 2012: Analyzing Linux Kernel Rootkits with Volatlity
Andrew Case
 
Cybermania Prelims
Divye Kapoor
 
Kernel Recipes 2015: The stable Linux Kernel Tree - 10 years of insanity
Anne Nicolas
 
A particle filter based scheme for indoor tracking on an Android Smartphone
Divye Kapoor
 
Linux performance
Will Sterling
 
Cybermania Mains
Divye Kapoor
 
Rootkit 102 - Kernel-Based Rootkit
Chia-Hao Tsai
 
Linux Internals - Kernel/Core
Shay Cohen
 
The TCP/IP stack in the FreeBSD kernel COSCUP 2014
Kevin Lo
 
LAS16-403 - GDB Linux Kernel Awareness
Peter Griffin
 
Ad

Similar to Debugging Applications with GNU Debugger (20)

PDF
Debugger Principle Overview & GDB Tricks
dutor
 
ODP
Отладка в GDB
Anthony Shoumikhin
 
PDF
05-Debug.pdf
KalaiselviDevaraj
 
PDF
gdb-tutorial.pdf
ligi14
 
PDF
Usage of GDB
Jongseok Choi
 
PDF
GDB Rocks!
Kent Chen
 
PDF
Gdb tutorial-handout
Suraj Kumar
 
PPTX
Debug generic process
Vipin Varghese
 
PPTX
Debuging like a pro
Vicente Bolea
 
PDF
lab1-ppt.pdf
AbdelrahmanElewah1
 
PDF
GDB tutorial
Anurag Patel
 
PDF
Experimental dtrace
Matthew Ahrens
 
KEY
淺入淺出 GDB
Jim Chang
 
PDF
Format String Vulnerability
Jian-Yu Li
 
PDF
Neo4j after 1 year in production
Andrew Nikishaev
 
PPTX
Debugging Modern C++ Application with Gdb
SenthilKumar Selvaraj
 
PDF
[系列活動] Data exploration with modern R
台灣資料科學年會
 
PDF
Go 1.10 Release Party - PDX Go
Rodolfo Carvalho
 
PDF
Cram
JamesBonfield
 
PPTX
Wavedigitech gdb
Wave Digitech
 
Debugger Principle Overview & GDB Tricks
dutor
 
Отладка в GDB
Anthony Shoumikhin
 
05-Debug.pdf
KalaiselviDevaraj
 
gdb-tutorial.pdf
ligi14
 
Usage of GDB
Jongseok Choi
 
GDB Rocks!
Kent Chen
 
Gdb tutorial-handout
Suraj Kumar
 
Debug generic process
Vipin Varghese
 
Debuging like a pro
Vicente Bolea
 
lab1-ppt.pdf
AbdelrahmanElewah1
 
GDB tutorial
Anurag Patel
 
Experimental dtrace
Matthew Ahrens
 
淺入淺出 GDB
Jim Chang
 
Format String Vulnerability
Jian-Yu Li
 
Neo4j after 1 year in production
Andrew Nikishaev
 
Debugging Modern C++ Application with Gdb
SenthilKumar Selvaraj
 
[系列活動] Data exploration with modern R
台灣資料科學年會
 
Go 1.10 Release Party - PDX Go
Rodolfo Carvalho
 
Wavedigitech gdb
Wave Digitech
 
Ad

More from Priyank Kapadia (15)

ODP
Ubuntu, Canonical and the release of Feisty
Priyank Kapadia
 
PDF
OLPC and INDIA
Priyank Kapadia
 
PDF
Open Source - Hip not Hype
Priyank Kapadia
 
ODP
How to start an Open Source Project
Priyank Kapadia
 
ODP
Developing Multilingual Applications
Priyank Kapadia
 
PDF
Open Solaris
Priyank Kapadia
 
ODP
How to build Debian packages
Priyank Kapadia
 
ODP
AMANDA
Priyank Kapadia
 
PDF
ASTERISK - Open Source PBS
Priyank Kapadia
 
ODP
C Types - Extending Python
Priyank Kapadia
 
ODP
Applying Security Algorithms Using openSSL crypto library
Priyank Kapadia
 
PDF
Authentication Modules For Linux - PAM Architecture
Priyank Kapadia
 
ODP
Google Web toolkit
Priyank Kapadia
 
PPT
Storage Management using LVM
Priyank Kapadia
 
PPT
Linux Kernel Development
Priyank Kapadia
 
Ubuntu, Canonical and the release of Feisty
Priyank Kapadia
 
OLPC and INDIA
Priyank Kapadia
 
Open Source - Hip not Hype
Priyank Kapadia
 
How to start an Open Source Project
Priyank Kapadia
 
Developing Multilingual Applications
Priyank Kapadia
 
Open Solaris
Priyank Kapadia
 
How to build Debian packages
Priyank Kapadia
 
ASTERISK - Open Source PBS
Priyank Kapadia
 
C Types - Extending Python
Priyank Kapadia
 
Applying Security Algorithms Using openSSL crypto library
Priyank Kapadia
 
Authentication Modules For Linux - PAM Architecture
Priyank Kapadia
 
Google Web toolkit
Priyank Kapadia
 
Storage Management using LVM
Priyank Kapadia
 
Linux Kernel Development
Priyank Kapadia
 

Recently uploaded (20)

PDF
“Scaling i.MX Applications Processors’ Native Edge AI with Discrete AI Accele...
Edge AI and Vision Alliance
 
PDF
Dev Dives: Accelerating agentic automation with Autopilot for Everyone
UiPathCommunity
 
PDF
Darley - FIRST Copenhagen Lightning Talk (2025-06-26) Epochalypse 2038 - Time...
treyka
 
PDF
Understanding AI Optimization AIO, LLMO, and GEO
CoDigital
 
PPTX
Enabling the Digital Artisan – keynote at ICOCI 2025
Alan Dix
 
PDF
Proactive Server and System Monitoring with FME: Using HTTP and System Caller...
Safe Software
 
PDF
Simplify Your FME Flow Setup: Fault-Tolerant Deployment Made Easy with Packer...
Safe Software
 
PDF
Quantum AI Discoveries: Fractal Patterns Consciousness and Cyclical Universes
Saikat Basu
 
PPTX
Smarter Governance with AI: What Every Board Needs to Know
OnBoard
 
PDF
Redefining Work in the Age of AI - What to expect? How to prepare? Why it mat...
Malinda Kapuruge
 
PDF
How to Comply With Saudi Arabia’s National Cybersecurity Regulations.pdf
Bluechip Advanced Technologies
 
PDF
GDG Cloud Southlake #44: Eyal Bukchin: Tightening the Kubernetes Feedback Loo...
James Anderson
 
PPTX
MARTSIA: A Tool for Confidential Data Exchange via Public Blockchain - Poster...
Michele Kryston
 
PDF
Plugging AI into everything: Model Context Protocol Simplified.pdf
Abati Adewale
 
PPSX
Usergroup - OutSystems Architecture.ppsx
Kurt Vandevelde
 
PDF
Optimizing the trajectory of a wheel loader working in short loading cycles
Reno Filla
 
PPTX
Mastering Authorization: Integrating Authentication and Authorization Data in...
Hitachi, Ltd. OSS Solution Center.
 
PDF
Hello I'm "AI" Your New _________________
Dr. Tathagat Varma
 
PDF
99 Bottles of Trust on the Wall — Operational Principles for Trust in Cyber C...
treyka
 
PDF
Understanding The True Cost of DynamoDB Webinar
ScyllaDB
 
“Scaling i.MX Applications Processors’ Native Edge AI with Discrete AI Accele...
Edge AI and Vision Alliance
 
Dev Dives: Accelerating agentic automation with Autopilot for Everyone
UiPathCommunity
 
Darley - FIRST Copenhagen Lightning Talk (2025-06-26) Epochalypse 2038 - Time...
treyka
 
Understanding AI Optimization AIO, LLMO, and GEO
CoDigital
 
Enabling the Digital Artisan – keynote at ICOCI 2025
Alan Dix
 
Proactive Server and System Monitoring with FME: Using HTTP and System Caller...
Safe Software
 
Simplify Your FME Flow Setup: Fault-Tolerant Deployment Made Easy with Packer...
Safe Software
 
Quantum AI Discoveries: Fractal Patterns Consciousness and Cyclical Universes
Saikat Basu
 
Smarter Governance with AI: What Every Board Needs to Know
OnBoard
 
Redefining Work in the Age of AI - What to expect? How to prepare? Why it mat...
Malinda Kapuruge
 
How to Comply With Saudi Arabia’s National Cybersecurity Regulations.pdf
Bluechip Advanced Technologies
 
GDG Cloud Southlake #44: Eyal Bukchin: Tightening the Kubernetes Feedback Loo...
James Anderson
 
MARTSIA: A Tool for Confidential Data Exchange via Public Blockchain - Poster...
Michele Kryston
 
Plugging AI into everything: Model Context Protocol Simplified.pdf
Abati Adewale
 
Usergroup - OutSystems Architecture.ppsx
Kurt Vandevelde
 
Optimizing the trajectory of a wheel loader working in short loading cycles
Reno Filla
 
Mastering Authorization: Integrating Authentication and Authorization Data in...
Hitachi, Ltd. OSS Solution Center.
 
Hello I'm "AI" Your New _________________
Dr. Tathagat Varma
 
99 Bottles of Trust on the Wall — Operational Principles for Trust in Cyber C...
treyka
 
Understanding The True Cost of DynamoDB Webinar
ScyllaDB
 

Debugging Applications with GNU Debugger

  • 1. Debugging applications with the GNU Debugger Presenter: Prakash Varandani
  • 2. When to use a debugger? Point-in-time debugging When a problem is easily reproducible. When the problem behavior can be predicted When a problem can be localized to a small period of time When system level problem determination tools do not help When the source code is readily available.
  • 3. When not to use debugger? When causes of a problem span a long history and time. Problem is difficult to predict in nature. Problem is not reproducible at will.
  • 4. Why gdb? Easily available. Easy installation. Configurable. Support for various Object File Formats. Support for various architectures. Rich feature set. Open Source (Of Course).
  • 5. Compiling for Debugging. Compiling with the “-g” option: e.g. gcc –g stack.c –o stack Preprocessor information: e.g. gcc –dwarf-2 –g3 stack.c –o stack
  • 6. Attaching a process Run a program directly through the debugger. Attach to a running process. Use a core file for post-mortem analysis.
  • 7. Invoking gdb Executable program: gdb program Executable and core file: gdb program core. Executable and process: gdb program <pid>.
  • 8. Program’s arguments. (gdb) set args abc def (gdb) set args (gdb) run abc def Example 1:
  • 9. gdb files It is possible to start gdb without any process/executable/core file. Add an executable (gdb) file/exec-file <executable> Attach to a already running process (gdb) attach <pid> Add a core file (gdb) core-file <filename>
  • 10. Setting breakpoints: (gdb) break function (gdb) break +/- offset (gdb) break linenum (gdb) break filename : linenum (gdb) break filename : function (gdb) break * address (gdb) break ... if cond Example 2:
  • 11. Setting breakpoints contd… (gdb) tbreak args (gdb) hbreak args (gdb) thbreak args (gdb) rbreak regex
  • 12. Watchpoints (gdb) watch expr (gdb) rwatch expr (gdb) awatch expr (gdb) info watchpoints (provides similar information as for info breakpoints)
  • 13. Getting information about breakpoints info breakpoints [ n ] Breakpoint Numbers Type Disposition Enabled or Disabled Address What Example 4:
  • 14. Breakpoints contd… Simple breakpoints stop the program every time they are hit. (gdb) condition bnum expression (gdb) condition bnum (gdb) ignore bnum count (gdb) commands [ bnum ] ... command-list ... end If bnum is not provided the commands refer to the last set breakpoint/watchpoint.
  • 15. Breakpoints contd... (gdb) clear (gdb) clear function (gdb) clear linenum (gdb) delete [breakpoints] [range...] (gdb) disable [breakpoints] [range...] (gdb) enable [breakpoints] once range (gdb) enable [breakpoints] delete range
  • 16. Continuing and Stepping (gdb) continue [ignore-count] (gdb) step [count] (gdb) next [count] (gdb) finish (gdb) until (gdb) until location (gdb) stepi (gdb) nexti Example 5:
  • 17. Examining the stack Frames: data associated with each function call like arguments, local variables, ra etc... The most recently created frame is called the innermost frame and the initial one is called the outermost frame. gdb assign numbers to the stack frames, 0 for the innermost and so on..
  • 18. How we got there?.. backtraces backtrace, bt -> Print a backtrace of the entire stack. backtrace n , bt n -> print n innermost frames. backtrace - n , bt – n -> print n outermost frames. backtrace full -> Print the values of the local variables also.
  • 19. Controlling backtrace set backtrace past-main [on/off] to configure printing of system specific code. set backtrace past-entry [on/off] show backtrace past-entry set backtrace limit n set backtrace limit 0 (unlimited) show backtrace limit
  • 20. Selecting a frame (gdb) frame n, f n -> select frame n (gdb) frame addr , f addr -> useful when the program has multiple stacks (highly system specific). (gdb) up [n] -> for positive n move “n” frames towards the outermost frame. (gdb) down [n] -> for positive n move “n” frames towards the innermost frame. If n is not provided move one frame up or down.
  • 21. Information about a frame (gdb) info frame This command prints a verbose description of the selected stack frame, including: the address of the frame the address of the next frame down (called by this frame) the address of the next frame up (caller of this frame) the language in which the source code corresponding to this frame is written the address of the frame's arguments the address of the frame's local variables the program counter saved in it (the address of execution in the caller frame) which registers were saved in the frame This information is useful when a stack format fail to fit the usual convention.
  • 22. Information about a frame ... (gdb) info frame addr , info f addr (gdb) info args (gdb) info locals
  • 23. Printing source lines (gdb) list linenum (gdb) list function (gdb) list (gdb) list – (gdb) list *address
  • 24. Searching source files. (gdb) forward-search regexp following the last line printed, search for a match with regexp and print the first line found. (gdb) search regexp Same as forward-search. (gdb) reverse-search regexp Starting with the line one above the last line printed, search for a match with regexp and print the first line found.
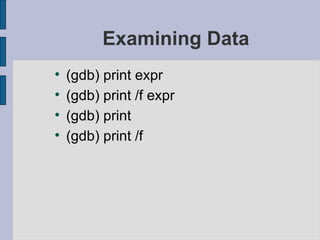
  • 25. Examining Data (gdb) print expr (gdb) print /f expr (gdb) print (gdb) print /f
  • 26. Output formats x -> hexadecimal d -> signed decimal u -> unsigned decimal o -> octal t -> binary c -> character f -> floating point a -> address format
  • 27. Examining memory (gdb) x /nfu addr (gdb) x addr n -> the repeat count. Default 1. f -> format for printing. Default x and changes eventually. u -> unit size, can be one of b -> byte h -> half word (2 bytes) w -> word (4 bytes) g -> giant word (8 bytes)
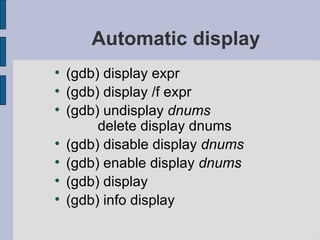
  • 28. Automatic display (gdb) display expr (gdb) display /f expr (gdb) undisplay dnums delete display dnums (gdb) disable display dnums (gdb) enable display dnums (gdb) display (gdb) info display
  • 29. Assembly Language Disassembling a function: (gdb) disassemble main Dump of assembler code for function main: 0x00010754 <main+0>: save %sp, -120, %sp 0x00010758 <main+4>: mov 3, %o0 0x0001075c <main+8>: st %o0, [ %fp + -20 ] 0x00010760 <main+12>: ld [ %fp + -20 ], %o0 0x00010764 <main+16>: call 0x10718 <fun1> 0x00010768 <main+20>: nop 0x0001076c <main+24>: clr %i0 ! 0x0 0x00010770 <main+28>: b 0x10778 <main+36> 0x00010774 <main+32>: nop 0x00010778 <main+36>: ret 0x0001077c <main+40>: restore End of assembler dump.
  • 30. Looking into the registers A single register: (gdb) p $eax $4 = 6 (gdb) p $ecx $5 = 1 All of them: (gdb) info registers eax 0x6 6 ecx 0x1 1 edx 0x4015c490 1075168400 ebx 0x4015afd8 1075163096 … …
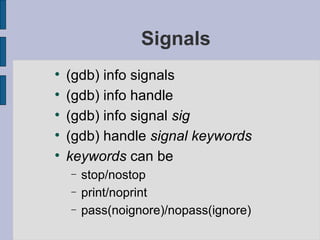
  • 31. Signals (gdb) info signals (gdb) info handle (gdb) info signal sig (gdb) handle signal keywords keywords can be stop/nostop print/noprint pass(noignore)/nopass(ignore)
  • 32. Altering Execution Assigning values to variables at runtime using print/set. Continuing at a different address Sending a signal Cancelling execution of a function Calling program functions
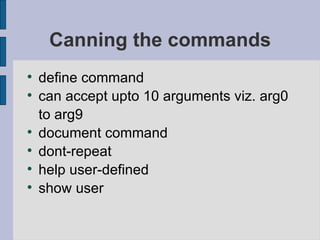
  • 33. Canning the commands define command can accept upto 10 arguments viz. arg0 to arg9 document command dont-repeat help user-defined show user
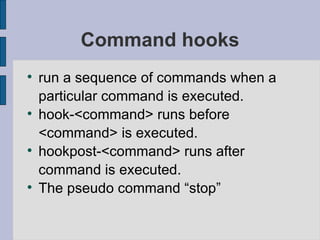
  • 34. Command hooks run a sequence of commands when a particular command is executed. hook-<command> runs before <command> is executed. hookpost-<command> runs after command is executed. The pseudo command “stop”