


![$ ps hf -u postgres -o cmd
/usr/pgsql-9.5/bin/postgres -D /var/lib/pgsql/9.5/data
_ postgres: logger process
_ postgres: checkpointer process
_ postgres: writer process
_ postgres: wal writer process
_ postgres: autovacuum launcher process
_ postgres: stats collector process
_ postgres: postgres pgbench [local] idle in transaction
_ postgres: postgres pgbench [local] idle
_ postgres: postgres pgbench [local] UPDATE
_ postgres: postgres pgbench [local] UPDATE waiting
_ postgres: postgres pgbench [local] UPDATE
Black box](https://image.slidesharecdn.com/deep-dive-into-postgresql-statistics-pgconf-us-2016-160413073045/85/Deep-dive-into-PostgreSQL-statistics-5-320.jpg)


![$ select * from pg_stat_database where datname = 'shop';
-[ RECORD 1 ]--+-------------------------------------------
datid | 16414
datname | shop
numbackends | 34
xact_commit | 51167155051
xact_rollback | 44781878826
blks_read | 7978770895
blks_hit | 9683551077519
tup_returned | 12507331807583
tup_fetched | 3885840966616
tup_inserted | 2898024857
tup_updated | 3082071349
tup_deleted | 2751363323
conflicts | 0
temp_files | 377675
temp_bytes | 4783712399875
deadlocks | 151
blk_read_time | 214344118.089
blk_write_time | 1260880.747
stats_reset | 2015-05-31 11:37:52.017967+03
pg_stat_database](https://image.slidesharecdn.com/deep-dive-into-postgresql-statistics-pgconf-us-2016-160413073045/85/Deep-dive-into-PostgreSQL-statistics-12-320.jpg)


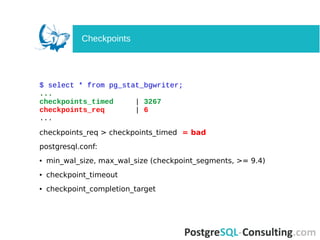
![$ select * from pg_stat_bgwriter;
-[ RECORD 1 ]---------+------------------------------------
checkpoints_timed | 3267
checkpoints_req | 6
checkpoint_write_time | 10416478591
checkpoint_sync_time | 405039
buffers_checkpoint | 2518065526
buffers_clean | 99602799
maxwritten_clean | 157
buffers_backend | 219356924
buffers_backend_fsync | 0
buffers_alloc | 3477374822
stats_reset | 2015-05-31 11:09:48.413185+03
pg_stat_bgwriter](https://image.slidesharecdn.com/deep-dive-into-postgresql-statistics-pgconf-us-2016-160413073045/85/Deep-dive-into-PostgreSQL-statistics-17-320.jpg)

![$ select * from pg_stat_replication;
-[ RECORD 1 ]----+------------------------------------
pid | 26921
usesysid | 15588142
usename | replica
application_name | walreceiver
client_addr | 10.0.0.7
client_hostname |
client_port | 32956
backend_start | 2015-10-01 19:14:42.979377+03
backend_xmin |
state | streaming
sent_location | 1691/EEE65900
write_location | 1691/EEE65900
flush_location | 1691/EEE65900
replay_location | 1691/EEE658D0
sync_priority | 0
sync_state | async
pg_stat_replication](https://image.slidesharecdn.com/deep-dive-into-postgresql-statistics-pgconf-us-2016-160413073045/85/Deep-dive-into-PostgreSQL-statistics-20-320.jpg)


![$ select * from pg_stat_all_tables;
-[ RECORD 1 ]-------+------------------------------------
relid | 98221
schemaname | public
relname | clientsession
seq_scan | 192
seq_tup_read | 364544695
idx_scan | 2691939318
idx_tup_fetch | 2669551448
n_tup_ins | 239532851
n_tup_upd | 736119030
n_tup_del | 239898968
n_tup_hot_upd | 497688344
n_live_tup | 3493472
n_dead_tup | 1606
n_mod_since_analyze | 349526
...
pg_stat_all_tables](https://image.slidesharecdn.com/deep-dive-into-postgresql-statistics-pgconf-us-2016-160413073045/85/Deep-dive-into-PostgreSQL-statistics-24-320.jpg)


![$ select
s.relname,
pg_size_pretty(pg_relation_size(relid)),
coalesce(n_tup_ins,0) + 2 * coalesce(n_tup_upd,0) -
coalesce(n_tup_hot_upd,0) + coalesce(n_tup_del,0) AS total_writes,
(coalesce(n_tup_hot_upd,0)::float * 100 / (case when n_tup_upd > 0
then n_tup_upd else 1 end)::float)::numeric(10,2) AS hot_rate,
(select v[1] FROM regexp_matches(reloptions::text,E'fillfactor=(d+)') as
r(v) limit 1) AS fillfactor
from pg_stat_all_tables s
join pg_class c ON c.oid=relid
order by total_writes desc limit 50;
What is Heap-Only Tuples?
HOT does not cause index update.
HOT is only for non-indexed columns.
Big n_tup_hot_upd = good.
How to increase n_tup_hot_upd?
Write activity](https://image.slidesharecdn.com/deep-dive-into-postgresql-statistics-pgconf-us-2016-160413073045/85/Deep-dive-into-PostgreSQL-statistics-28-320.jpg)


![$ select * from pg_stat_all_indexes where idx_scan = 0;
-[ RECORD 1 ]-+------------------------------------------
relid | 98242
indexrelid | 55732253
schemaname | public
relname | products
indexrelname | products_special2_idx
idx_scan | 0
idx_tup_read | 0
idx_tup_fetch | 0
pg_stat_all_indexes](https://image.slidesharecdn.com/deep-dive-into-postgresql-statistics-pgconf-us-2016-160413073045/85/Deep-dive-into-PostgreSQL-statistics-32-320.jpg)


![$ select * from pg_stat_activity;
-[ RECORD 1 ]----+--------------------------------------------
datid | 16401
datname | ts
pid | 116408
usesysid | 16384
usename | tsagent
application_name | unicorn_rails worker
client_addr | 172.17.0.37
client_hostname |
client_port | 50888
backend_start | 2015-10-14 15:18:03.01039+00
xact_start |
query_start | 2015-10-14 15:21:30.336325+00
state_change | 2015-10-14 15:21:30.33635+00
waiting | f
state | idle
backend_xid |
backend_xmin |
query | COMMIT
pg_stat_activity](https://image.slidesharecdn.com/deep-dive-into-postgresql-statistics-pgconf-us-2016-160413073045/85/Deep-dive-into-PostgreSQL-statistics-35-320.jpg)


![$ select * from pg_stat_statements
where blk_read_time <> 0 order by blk_read_time desc;
-[ RECORD 1 ]-------+---------------------------------------
userid | 25078444
dbid | 16411
query | SELECT "id" FROM run_plan_xact(?)
calls | 11165832
total_time | 11743325.6880088
min_time | 0.581
max_time | 4.298
mean_time | 1.051
stddev_time | 0.142115797855129
rows | 11165832
shared_blks_hit | 351353214
shared_blks_read | 205557
shared_blks_dirtied | 256053
shared_blks_written | 0
local_blks_hit | 0
local_blks_read | 68894
local_blks_dirtied | 68894
local_blks_written | 0
temp_blks_read | 0
temp_blks_written | 0
blk_read_time | 495425.535999976
blk_write_time | 0
pg_stat_statements](https://image.slidesharecdn.com/deep-dive-into-postgresql-statistics-pgconf-us-2016-160413073045/85/Deep-dive-into-PostgreSQL-statistics-46-320.jpg)


![[pgday.Seoul 2022] PostgreSQL구조 - 윤성재](https://cdn.slidesharecdn.com/ss_thumbnails/pgday2022-postgresql-20221112-221114014106-bbfb1955-thumbnail.jpg?width=560&fit=bounds)


More Related Content
What's hot (20)
Viewers also liked (7)


Similar to Deep dive into PostgreSQL statistics. (20)


More from Alexey Lesovsky (14)


Recently uploaded (20)


Deep dive into PostgreSQL statistics.
- 1. Deep dive into PostgreSQL statistics. PGConf US 2016, New York Alexey Lesovsky [email protected]
- 2. What is PostgreSQL activity statistics. How to use statistics effectively. How to solve problems with statistics. http://goo.gl/uDuSvs Agenda
- 3. Nothing about query planner statistics. No tools overview. Don't talk about
- 4. Statistics are useful. Statistics are not scary. Where to use statistics. Goals
- 5. $ ps hf -u postgres -o cmd /usr/pgsql-9.5/bin/postgres -D /var/lib/pgsql/9.5/data _ postgres: logger process _ postgres: checkpointer process _ postgres: writer process _ postgres: wal writer process _ postgres: autovacuum launcher process _ postgres: stats collector process _ postgres: postgres pgbench [local] idle in transaction _ postgres: postgres pgbench [local] idle _ postgres: postgres pgbench [local] UPDATE _ postgres: postgres pgbench [local] UPDATE waiting _ postgres: postgres pgbench [local] UPDATE Black box
- 6. Write Ahead Log Shared Buffers Buffers IO Autovacuum Workers Autovacuum Launcher Background Workers Indexes IO Query Execution Query Planning Client Backends Postmaster Relations IO Logger Process Stats Collector Logical Replication WAL Sender Process Archiver Process Background Writer Checkpointer Process Network Storage Recovery Process WAL Receiver Process Tables/Indexes Data Files Where PostgreSQL spends its time
- 7. Too much information (more than 100 counters in 9.5). Statistics are provided as an online counters. No history (but reset functions are available). No native handy stat tools in PostgreSQL. A lot of 3rd party tools and programs. Problems
- 8. Too much information (more than 100 counters in 9.5). Statistics are provided as an online counters. No history (but reset functions are available). No native handy stat tools in PostgreSQL. A lot of 3rd party tools and programs. Important to use stats directly from PostgreSQL. Basic SQL skills are required. Problems
- 9. Counters in shared memory. Functions. Builtin views. Official extensions in contribs package. Unofficial extensions. Statistics sources
- 11. Write Ahead Log Shared Buffers Buffers IO Autovacuum Workers Autovacuum Launcher Background Workers Indexes IO Query Execution Query Planning Client Backends Postmaster Tables IO Logger Process Stats Collector Logical Replication WAL Sender Process Archiver Process Background Writer Checkpointer Process Network Storage Recovery Process WAL Receiver Process Tables/Indexes Data Files pg_stat_all_tables pg_current_xlog_location pg_replication_slots pg_stat_replication pg_stat_archiver pg_stat_database_conflicts pg_buffercache pg_stat_database pg_stat_activity pg_stat_user_tables pg_stat_database pg_stat_bgwrier pgstattuplepg_table_size pg_database_size pg_index_size pg_stat_activity EXPLAIN pg_stat_statements pg_locks pg_stat_user_functions pg_stat_all_indexes pg_stat_database pg_statio_all_tables pg_xlog_location_diff nicstat* iostat* pg_stat_kcache pg_stat_statements * - system utils
- 12. $ select * from pg_stat_database where datname = 'shop'; -[ RECORD 1 ]--+------------------------------------------- datid | 16414 datname | shop numbackends | 34 xact_commit | 51167155051 xact_rollback | 44781878826 blks_read | 7978770895 blks_hit | 9683551077519 tup_returned | 12507331807583 tup_fetched | 3885840966616 tup_inserted | 2898024857 tup_updated | 3082071349 tup_deleted | 2751363323 conflicts | 0 temp_files | 377675 temp_bytes | 4783712399875 deadlocks | 151 blk_read_time | 214344118.089 blk_write_time | 1260880.747 stats_reset | 2015-05-31 11:37:52.017967+03 pg_stat_database
- 13. $ select * from pg_stat_database; ... blks_read | 7978770895 blks_hit | 9683551077519 ... $ select sum(blks_hit)*100/sum(blks_hit+blks_read) as hit_ratio from pg_stat_database; More is better, and not less than 90% Cache hit ratio
- 14. $ select * from pg_stat_database; ... xact_commit | 51167155051 xact_rollback | 44781878826 conflicts | 0 temp_files | 377675 temp_bytes | 4783712399875 deadlocks | 151 ... $ select datname, (xact_commit*100)/(xact_commit+xact_rollback) as c_ratio, deadlocks, conflicts, temp_file, pg_size_pretty(temp_bytes) as temp_size from pg_stat_database; Anomalies
- 15. $ select * from pg_stat_database; ... xact_commit | 51167155051 < 95 % xact_rollback | 44781878826 > 5 % conflicts | 0 > 10 temp_files | 377675 > 100 temp_bytes | 4783712399875 > 10 GB deadlocks | 151 > 10 ... $ select datname, (xact_commit*100)/(xact_commit+xact_rollback) as c_ratio, deadlocks, conflicts, temp_file, pg_size_pretty(temp_bytes) as temp_size from pg_stat_database; Anomalies
- 16. $ select * from pg_stat_database; ... xact_commit | 51167155051 < 95 % xact_rollback | 44781878826 > 5 % conflicts | 0 > 10 temp_files | 377675 > 100 temp_bytes | 4783712399875 > 10 GB deadlocks | 151 > 10 ... Conflicts: pg_stat_database_conflicts, server logs. Deadlocks: server logs + log_lock_waits. Temp files: server logs + log_temp_files, pg_stat_statements. Anomalies
- 17. $ select * from pg_stat_bgwriter; -[ RECORD 1 ]---------+------------------------------------ checkpoints_timed | 3267 checkpoints_req | 6 checkpoint_write_time | 10416478591 checkpoint_sync_time | 405039 buffers_checkpoint | 2518065526 buffers_clean | 99602799 maxwritten_clean | 157 buffers_backend | 219356924 buffers_backend_fsync | 0 buffers_alloc | 3477374822 stats_reset | 2015-05-31 11:09:48.413185+03 pg_stat_bgwriter
- 18. $ select * from pg_stat_bgwriter; ... checkpoints_timed | 3267 checkpoints_req | 6 ... checkpoints_req > checkpoints_timed = bad postgresql.conf: ● min_wal_size, max_wal_size (checkpoint_segments, >= 9.4) ● checkpoint_timeout ● checkpoint_completion_target Checkpoints
- 19. $ select * from pg_stat_bgwriter; ... buffers_clean | 99602799 maxwritten_clean | 157 > 0 buffers_backend_fsync | 0 > 0 ... Clean dirty pages for backends. Helps checkpointer. postgresql.conf: ● bgwriter_delay ● bgwriter_lru_maxpages ● bgwriter_lru_multiplier Background Writer
- 20. $ select * from pg_stat_replication; -[ RECORD 1 ]----+------------------------------------ pid | 26921 usesysid | 15588142 usename | replica application_name | walreceiver client_addr | 10.0.0.7 client_hostname | client_port | 32956 backend_start | 2015-10-01 19:14:42.979377+03 backend_xmin | state | streaming sent_location | 1691/EEE65900 write_location | 1691/EEE65900 flush_location | 1691/EEE65900 replay_location | 1691/EEE658D0 sync_priority | 0 sync_state | async pg_stat_replication
- 21. $ select * from pg_stat_replication; ... sent_location | 1691/EEE65900 write_location | 1691/EEE65900 flush_location | 1691/EEE65900 replay_location | 1691/EEE658D0 ... 1692/EEE65900 — location in transaction log (WAL) All values are equal = ideal Replication lag
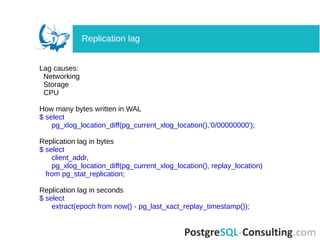
- 22. Lag causes: Networking Storage CPU How many bytes written in WAL $ select pg_xlog_location_diff(pg_current_xlog_location(),'0/00000000'); Replication lag in bytes $ select client_addr, pg_xlog_location_diff(pg_current_xlog_location(), replay_location) from pg_stat_replication; Replication lag in seconds $ select extract(epoch from now() - pg_last_xact_replay_timestamp()); Replication lag
- 23. $ select client_addr as client, pg_size_pretty(pg_xlog_location_diff(pg_current_xlog_location(),sent_location)) as pending, pg_size_pretty(pg_xlog_location_diff(sent_location,write_location)) as write, pg_size_pretty(pg_xlog_location_diff(write_location,flush_location)) as flush, pg_size_pretty(pg_xlog_location_diff(flush_location,replay_location)) as replay, pg _size_pretty(pg_xlog_location_diff(pg_current_xlog_location(),replay_location)) as total from pg_stat_replication; client | pending | network | written | flushed | total -----------+----------+----------+---------+------------+------------ 127.0.0.1 | 0 bytes | 0 bytes | 0 bytes | 48 bytes | 48 bytes 10.1.0.8 | 12 GB | 30 MB | 0 bytes | 156 kB | 12 GB 10.2.0.6 | 0 bytes | 48 bytes | 0 bytes | 551 MB | 552 MB Replication lag
- 24. $ select * from pg_stat_all_tables; -[ RECORD 1 ]-------+------------------------------------ relid | 98221 schemaname | public relname | clientsession seq_scan | 192 seq_tup_read | 364544695 idx_scan | 2691939318 idx_tup_fetch | 2669551448 n_tup_ins | 239532851 n_tup_upd | 736119030 n_tup_del | 239898968 n_tup_hot_upd | 497688344 n_live_tup | 3493472 n_dead_tup | 1606 n_mod_since_analyze | 349526 ... pg_stat_all_tables
- 25. $ select * from pg_stat_all_tables; ... seq_scan | 192 seq_tup_read | 364544695 > 1000 (seq_tup_avg) ... $ select relname, pg_size_pretty(pg_relation_size(relname::regclass)) as size, seq_scan, seq_tup_read, seq_scan / seq_tup_read as seq_tup_avg from pg_stat_user_tables where seq_tup_read > 0 order by 3,4 desc limit 5; Sequential scans
- 26. $ select relname, pg_size_pretty(pg_total_relation_size(relname::regclass)) as full_size, pg_size_pretty(pg_relation_size(relname::regclass)) as table_size, pg_size_pretty(pg_total_relation_size(relname::regclass) - pg_relation_size(relname::regclass)) as index_size from pg_stat_user_tables order by pg_total_relation_size(relname::regclass) desc limit 10; psql meta-commands: dt+ and di+ Tables size
- 27. $ select * from pg_stat_all_tables; ... n_tup_upd | 736119030 n_tup_hot_upd | 497688344 ... UPDATE = DELETE + INSERT UPDATE = TABLE UPDATE + INDEX UPDATE Write activity
- 28. $ select s.relname, pg_size_pretty(pg_relation_size(relid)), coalesce(n_tup_ins,0) + 2 * coalesce(n_tup_upd,0) - coalesce(n_tup_hot_upd,0) + coalesce(n_tup_del,0) AS total_writes, (coalesce(n_tup_hot_upd,0)::float * 100 / (case when n_tup_upd > 0 then n_tup_upd else 1 end)::float)::numeric(10,2) AS hot_rate, (select v[1] FROM regexp_matches(reloptions::text,E'fillfactor=(d+)') as r(v) limit 1) AS fillfactor from pg_stat_all_tables s join pg_class c ON c.oid=relid order by total_writes desc limit 50; What is Heap-Only Tuples? HOT does not cause index update. HOT is only for non-indexed columns. Big n_tup_hot_upd = good. How to increase n_tup_hot_upd? Write activity
- 29. | pg_size_pretty | total_writes | hot_rate | fillfactor -+----------------+--------------+----------+------------ | 9418 MB | 391459091 | 5.03 | | 417 MB | 285948760 | 0.00 | | 76 MB | 232031972 | 87.31 | 70 | 7123 MB | 124281107 | 99.36 | 70 Fillfactor determines page packing ratio (between 10 and 100). Tables (and indexes) size overhead. ALTER TABLE table_name SET (fillfactor = 70); Write activity
- 30. $ select c.relname, current_setting('autovacuum_vacuum_threshold') as av_base_thresh, current_setting('autovacuum_vacuum_scale_factor') as av_scale_factor, (current_setting('autovacuum_vacuum_threshold')::int + (current_setting('autovacuum_vacuum_scale_factor')::float * c.reltuples)) as av_thresh, s.n_dead_tup from pg_stat_user_tables s join pg_class c ON s.relname = c.relname where s.n_dead_tup > (current_setting('autovacuum_vacuum_threshold')::int + (current_setting('autovacuum_vacuum_scale_factor')::float * c.reltuples)); | av_base_thresh | av_scale_factor | av_thresh | n_dead_tup +----------------+-----------------+-----------+------------ | 50 | 0.01 | 60302 | 85445 | 50 | 0.01 | 50 | 1349 | 50 | 0.01 | 55 | 12479 | 50 | 0.01 | 103 | 3134 | 50 | 0.01 | 52716 | 173100 Autovacuum queue
- 31. $ select c.relname, current_setting('autovacuum_vacuum_threshold') as av_base_thresh, current_setting('autovacuum_vacuum_scale_factor') as av_scale_factor, (current_setting('autovacuum_vacuum_threshold')::int + (current_setting('autovacuum_vacuum_scale_factor')::float * c.reltuples)) as av_thresh, s.n_dead_tup from pg_stat_user_tables s join pg_class c ON s.relname = c.relname where s.n_dead_tup > (current_setting('autovacuum_vacuum_threshold')::int + (current_setting('autovacuum_vacuum_scale_factor')::float * c.reltuples)); | av_base_thresh | av_scale_factor | av_thresh | n_dead_tup +----------------+-----------------+-----------+------------ | 50 | 0.01 | 60302 | 60545 | 50 | 0.01 | 50 | 1349 | 50 | 0.01 | 55 | 12479 | 50 | 0.01 | 103 | 3134 | 50 | 0.01 | 52716 | 173100 Avito Experience https://github.com/eshkinkot/avito/blob/master/munin/vacuum_queue Autovacuum queue
- 32. $ select * from pg_stat_all_indexes where idx_scan = 0; -[ RECORD 1 ]-+------------------------------------------ relid | 98242 indexrelid | 55732253 schemaname | public relname | products indexrelname | products_special2_idx idx_scan | 0 idx_tup_read | 0 idx_tup_fetch | 0 pg_stat_all_indexes
- 33. $ select * from pg_stat_all_indexes where idx_scan = 0; ... indexrelname | products_special2_idx idx_scan | 0 0 = bad ... Unused indexes are bad. Uses storage. Slow down UPDATE, DELETE, INSERT operations. Extra work for VACUUM. Unused indexes
- 34. $ select * from pg_stat_all_indexes where idx_scan = 0; ... indexrelname | products_special2_idx idx_scan | 0 0 = bad ... Unused indexes are bad. Uses storage. Slow down UPDATE, DELETE, INSERT operations. Extra work for VACUUM. https://goo.gl/0qXDjl http://goo.gl/5QxTm4 Unused indexes
- 35. $ select * from pg_stat_activity; -[ RECORD 1 ]----+-------------------------------------------- datid | 16401 datname | ts pid | 116408 usesysid | 16384 usename | tsagent application_name | unicorn_rails worker client_addr | 172.17.0.37 client_hostname | client_port | 50888 backend_start | 2015-10-14 15:18:03.01039+00 xact_start | query_start | 2015-10-14 15:21:30.336325+00 state_change | 2015-10-14 15:21:30.33635+00 waiting | f state | idle backend_xid | backend_xmin | query | COMMIT pg_stat_activity
- 36. $ select * from pg_stat_activity; ... datname | ts usename | tsagent client_addr | 172.17.0.37 ... Used connections ratio $ select count(*)*100/(select current_setting('max_connections')::int) from pg_stat_activity; Summary activity
- 37. $ select * from pg_stat_activity; ... datname | ts usename | tsagent client_addr | 172.17.0.37 ... $ select client_addr, usename, datname, count(*) from pg_stat_activity group by 1,2,3 order by 4 desc; client_addr | usename | datname | count -------------+-----------+---------+------- 127.0.0.1 | cron_role | ts | 508 127.0.0.1 | tsagent | ts | 60 127.0.0.1 | postgres | ts | 1 127.0.0.1 | pupkin | ts | 1 Summary activity
- 38. $ select * from pg_stat_activity; ... backend_start | 2015-10-14 15:18:03.01039+00 xact_start | 2015-10-14 15:21:15.336325+00 query_start | 2015-10-14 15:21:30.336325+00 state_change | 2015-10-14 15:21:30.33635+00 ... Long queries and xacts
- 39. $ select * from pg_stat_activity; ... backend_start | 2015-10-14 15:18:03.01039+00 xact_start | 2015-10-14 15:21:15.336325+00 query_start | 2015-10-14 15:21:30.336325+00 state_change | 2015-10-14 15:21:30.33635+00 ... $ select client_addr, usename, datname, clock_timestamp() - xact_start as xact_age, clock_timestamp() - query_start as query_age, query from pg_stat_activity order by xact_start, query_start; Long queries and xacts
- 40. $ select * from pg_stat_activity; ... backend_start | 2015-10-14 15:18:03.01039+00 xact_start | 2015-10-14 15:21:15.336325+00 query_start | 2015-10-14 15:21:30.336325+00 state_change | 2015-10-14 15:21:30.33635+00 ... $ select client_addr, usename, datname, clock_timestamp() - xact_start as xact_age, clock_timestamp() - query_start as query_age, query from pg_stat_activity order by xact_start, query_start; clock_timestamp() for calculating query or transaction age. Long queries: remember, terminate, optimize. Long queries and xacts
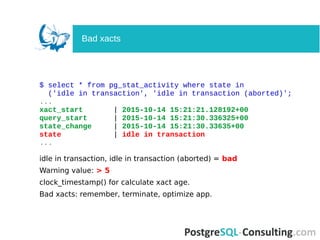
- 41. $ select * from pg_stat_activity where state in ('idle in transaction', 'idle in transaction (aborted)'; ... xact_start | 2015-10-14 15:21:21.128192+00 query_start | 2015-10-14 15:21:30.336325+00 state_change | 2015-10-14 15:21:30.33635+00 state | idle in transaction ... Bad xacts
- 42. $ select * from pg_stat_activity where state in ('idle in transaction', 'idle in transaction (aborted)'; ... xact_start | 2015-10-14 15:21:21.128192+00 query_start | 2015-10-14 15:21:30.336325+00 state_change | 2015-10-14 15:21:30.33635+00 state | idle in transaction ... idle in transaction, idle in transaction (aborted) = bad Warning value: > 5 clock_timestamp() for calculate xact age. Bad xacts: remember, terminate, optimize app. Bad xacts
- 43. $ select * from pg_stat_activity where waiting; ... xact_start | 2015-10-14 15:21:21.128192+00 query_start | 2015-10-14 15:21:30.336325+00 state_change | 2015-10-14 15:21:30.33635+00 waiting | t ... Waiting clients
- 44. $ select * from pg_stat_activity where waiting; ... xact_start | 2015-10-14 15:21:21.128192+00 query_start | 2015-10-14 15:21:30.336325+00 state_change | 2015-10-14 15:21:30.33635+00 waiting | t ... waiting = true = bad. clock_timestamp() for calculating query or xact age. Enable log_lock_waits GUC, examine server logs. Use pg_locks for searching blocking query or xact. Waiting queries: remember, terminate, optimize app. Waiting clients
- 45. https://github.com/lesovsky/uber-scripts/blob/master/postgresql/sql/c4_06_show _locked_queries.sql http://big-elephants.com/2013-09/exploring-query-locks-in-postgres/ locked_item | products waiting | t waiting_query | UPDATE products SET avail = false WHERE id = 154; waiting_mode | RowExclusiveLock waiting_xact_age | 00:00:07.103685 waiting_query_age | 00:00:01.813508 waiting_pid | 5895 waiting_user | app_role waiting_state | active waiting | f locking_query | ALTER TABLE products DROP COLUMN avail; locking_mode | AccessExclusiveLock locking_xact_age | 00:00:16.416441 locking_query_age | 00:00:14.416441 locking_pid | 5844 locking_user | postgres locking_state | idle in transaction Blocked queries
- 46. $ select * from pg_stat_statements where blk_read_time <> 0 order by blk_read_time desc; -[ RECORD 1 ]-------+--------------------------------------- userid | 25078444 dbid | 16411 query | SELECT "id" FROM run_plan_xact(?) calls | 11165832 total_time | 11743325.6880088 min_time | 0.581 max_time | 4.298 mean_time | 1.051 stddev_time | 0.142115797855129 rows | 11165832 shared_blks_hit | 351353214 shared_blks_read | 205557 shared_blks_dirtied | 256053 shared_blks_written | 0 local_blks_hit | 0 local_blks_read | 68894 local_blks_dirtied | 68894 local_blks_written | 0 temp_blks_read | 0 temp_blks_written | 0 blk_read_time | 495425.535999976 blk_write_time | 0 pg_stat_statements
- 47. $ select * from pg_stat_statements; ... query | SELECT "id" FROM run_plan_xact(?) calls | 11165832 total_time | 11743325.6880088 rows | 11165832 blk_read_time | 495425.535999976 blk_write_time | 0 Statements average time in ms $ select (sum(total_time) / sum(calls))::numeric(6,3) from pg_stat_statements; The most writing (to shared_buffers) queries $ select query, shared_blks_dirtied from pg_stat_statements where shared_blks_dirtied > 0 order by 2 desc; pg_stat_statements
- 48. query total time: 15:43:07 (14.9%, CPU: 18.2%, IO: 9.0%) сalls: 476 (0.00%) rows: 476,000 avg_time: 118881.54ms (IO: 21.2%) user: app_user db: ustats query: SELECT filepath, type, deviceuid FROM imvevents WHERE state = ?::eventstate AND servertime BETWEEN $1 AND $2 ORDER BY servertime DESC LIMIT $3 OFFSET $4 https://goo.gl/6025wZ Query reports
- 49. query total time: 15:43:07 (14.9%, CPU: 18.2%, IO: 9.0%) сalls: 476 (0.00%) rows: 476,000 avg_time: 118881.54ms (IO: 21.2%) user: app_user db: ustats query: SELECT filepath, type, deviceuid FROM imvevents WHERE state = ?::eventstate AND servertime BETWEEN $1 AND $2 ORDER BY servertime DESC LIMIT $3 OFFSET $4 Use sum() for calculating totals. Calculate queries «contribution» in totals. Resource usage (CPU, IO). Query reports
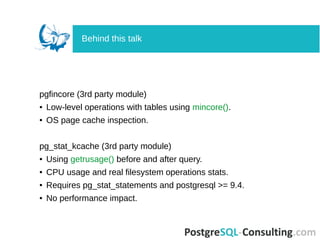
- 50. pg_statio_all_tables, pg_statio_all_indexes. pg_stat_user_functions. Size functions - df *size* pgstattuple (in official contribs package) ● Bloat estimation for tables and indexes. ● Estimation time depends on table (or index) size. pg_buffercache (in official contribs package) ● Shared buffers inspection. ● Heavy performance impact (buffers lock). Behind this talk
- 51. pgfincore (3rd party module) ● Low-level operations with tables using mincore(). ● OS page cache inspection. pg_stat_kcache (3rd party module) ● Using getrusage() before and after query. ● CPU usage and real filesystem operations stats. ● Requires pg_stat_statements and postgresql >= 9.4. ● No performance impact. Behind this talk
- 52. ● The ability to use statistics is useful. ● Statistics are not difficult. ● Statistics help to answer the questions. ● Do experiments. Resume
- 53. Author, write more!! www.blog.postgresql-consulting.com The Statistics Collector http://www.postgresql.org/docs/current/static/monitoring-stats.html System Administration Functions http://www.postgresql.org/docs/current/static/functions-admin.html Contrib modules http://www.postgresql.org/docs/current/static/pgstatstatements.html http://www.postgresql.org/docs/current/static/pgstattuple.html http://www.postgresql.org/docs/current/static/pgbuffercache.html https://github.com/klando/pgfincore https://github.com/dalibo/pg_stat_kcache SQL utils and sql code examples https://github.com/PostgreSQL-Consulting/pg-utils Unused indexes http://goo.gl/5QxTm4 https://goo.gl/0qXDjl Query reports https://goo.gl/6025wZ Links
- 54. Write Ahead Log Shared Buffers Buffers IO Autovacuum Workers Autovacuum Launcher Background Workers Indexes IO Query Execution Query Planning Client Backends Postmaster Tables IO Logger Process Stats Collector Logical Replication WAL Sender Process Archiver Process Background Writer Checkpointer Process Network Storage Recovery Process WAL Receiver Process Tables/Indexes Data Files pg_stat_all_tables pg_current_xlog_location pg_replication_slots pg_stat_replication pg_stat_archiver pg_stat_database_conflicts pg_buffercache pg_stat_database pg_stat_activity pg_stat_user_tables pg_stat_database pg_stat_bgwrier pgstattuplepg_table_size pg_database_size pg_index_size pg_stat_activity EXPLAIN pg_stat_statements pg_locks pg_stat_user_functions pg_stat_all_indexes pg_stat_database pg_statio_all_tables pg_xlog_location_diff nicstat* iostat* pg_stat_kcache pg_stat_statements Questions