SlideShare a Scribd company logo
Design for Testability
Presented by Hari
DFT: Key Areas
• Basics of DFT
• SCAN Design Methodology
• Built in Self Test(BIST)
• Automatic Test Pattern Generation (ATPG)
• ATE Testing
DFT: Goals
Structural Testing
Consider a circuit that implements a Boolean function with 𝑁 inputs.
How to test the fabricated circuit?
Functional Testing:
 Apply all possible 2𝑁
input combinations and check output
 Becomes infeasible for large 𝑁 (say 50 or 100)
Structural Testing:
 Test the components that implements a logic function rather than testing the input–output
functionality
 The paradigm of structural testing is widely employed
 It reduces the number of test patterns required for good test quality
Functional Testing vs. Structural Testing
Structural Testing
Test individual components of the circuit ( G1, G2, G3, G4, and G5)
Each gate will require 24
= 16 input combinations (total 80)
Functional Testing
Will require 2^N, i.e., 216
= 65536 input combinations
Assumptions
Can observe the output pins for all the components
Can write any value at the input pins of all the components
There could be a problem in the integration of components (need to tackle
that also).
DFT techniques tries to make structural testing more effective
by ensuring the above assumptions.
Fault Models
Fault Model
 Represents a defect using a logical or electrical
model
Why do we use a Fault Model?
 Allows us to analyze the impact of a defect using
logic or circuit analysis techniques
 Allows deriving test patterns algorithmically for
detecting a given fault
 Quantitative assessment of testing
effectiveness using fault coverage
 Transforms the problem of defect
detection to the
problem of fault detection
Stuck-at Fault Models
Stuck-at Fault Model
 Assumes that defects cause the signal to be
permanently stuck at a constant logic
 Transforms defects to a logical fault model
 Two types:
 Stuck at logic “0”: stuck-at-0 or SA0 fault
 Stuck at logic “1”: stuck-at-1 or SA1 fault
Single Stuck-at Fault Model
 Assumes that there is only one fault active at a
time
 Reduces the complexity of test pattern generation
significantly
Stuck-at Faults: Fault Site
Fault-site:
The point where a fault exists or we assume it to exist
Emulate a stuck-at fault by first disconnecting the corresponding signal source.
Tie it to the constant logic (either 0 or 1 depending on the fault type)
Multi-fanout net (N>1):
 (N+1) fault sites
Possible Stuck-at Faults: Illustration
Consider the circuit alongside
How many single stuck-at (0/1)
faults are possible in this circuit?
Detecting a Fault: Test Vectors
Test Vectors
Any input pattern, or sequence of input patterns, that produces a different output response
for a faulty circuit and a fault-free circuit
Exhaustive Testing for functionality
 Exponential number of test vectors required (2𝑁
)
to test the functionality
Single stuck-at fault model makes the number of fault linear in the number of circuit elements
Design for Testability: Test Vectors
Stuck-at 0 Stuck-at 1
A B C D Z A/0 B/0 C/0 D/0 Z/0 A/1 B/1 C/1 D/1 Z/1
0 0 0 0 1 1 1 1 1 0 1 1 1 1 1
0 0 0 1 1 1 1 1 1 0 1 1 1 1 1
0 0 1 0 1 1 1 1 1 0 1 1 1 1 1
0 0 1 1 1 1 1 1 1 0 1 1 1 1 1
0 1 0 0 1 1 1 1 1 0 1 1 1 1 1
0 1 0 1 1 1 1 1 1 0 1 1 1 1 1
0 1 1 0 1 1 1 1 1 0 1 1 1 1 1
0 1 1 1 1 1 1 1 1 0 0 1 1 1 1
1 0 0 0 1 1 1 1 1 0 1 1 1 1 1
1 0 0 1 1 1 1 1 1 0 1 1 1 1 1
1 0 1 0 1 1 1 1 1 0 1 1 1 1 1
1 0 1 1 1 1 1 1 1 0 1 1 1 1 1
1 1 0 0 1 1 1 1 1 0 1 0 1 1 1
1 1 0 1 1 1 1 1 1 0 1 1 0 1 1
1 1 1 0 1 1 1 1 1 0 1 1 1 0 1
1 1 1 1 0 1 1 1 1 0 0 0 0 0 1
Combinational Circuit: Controllability and Observability
If the NAND gate was lying too deep in a circuit, it is
difficult to apply the required test vectors at the
inputs
Controllability: ability to set any desired value (0 or 1)
on the internal signals of a circuit by applying an
appropriate test-vector to the primary inputs
Similarly the output of NAND gate will be difficult to
observe at any primary output if the NAND gate is
lying too deep in circuit
Observability: ability to examine any internal signal by
propagating its value to a primary output by applying
appropriate test vector to the primary inputs.
Sequential Circuit: Controllability and Observability
Problem of controllability
Setting a particular value at any pin in a sequential circuit is more
difficult
 Several cycles may be required to write a particular
value
 State traversal required
 Finding such a test sequence is time consuming by
sequential ATPG tool
Problem of observability
Similar difficulty in examining the value at a particular pin in the
sequential circuit (requires state traversal)
SCAN Design Methodology
• Scan Design Flow
 Design Modifications
 Mechanism of Testing
 Tasks
Design Modifications in SCAN Design Flow
Normal Flip Flop Vs SCAN Flip Flop
 Extra primary ports added
 TM (Test Mode)
 SE (Scan Enable)
 SI (Scan In)
 SO (Scan Out)
 D flip-flops replaced with
another memory elements
(scan cells)
 Scan cells are reconnected to
form shift register (scan
chain)
Outcome:
 Dramatically improve controllability and observability of memory elements (flip-flop) in a
sequential circuit
Scan Design Flow: Different Modes
Design works in three modes:
1. Normal Mode: functional mode in which chip
works
2. Shift Mode:
 Memory elements (i.e. scan cells) work as
shift registers
 Test vectors are shifted-in and responses
are shifted-out
3. Capture Mode: response of the fabricated
circuit is captured during testing
Test Mode Scan Enable
Normal Mode 0 0
Shift Mode 1 1
Capture Mode 1 0
Scan Cells:
Different kinds of scan cell can be
used
Most popular is MUXED-D Scan Cell
 D, CLK, Q similar to D flip-flop
 SI ≡ scan input
 SE ≡ scan enable
 Q also works as SO≡ scan out
 The multiplexer selects data between D and SI
using the value at SE pin
 In the normal/capture mode: SE=0
 Value at D is latched
 In the shift mode, SE=1
 Value at SI is latched
 Output pin produces the content of D flip-flop
 Next State could be of D-pin or SI-pin
Scan Chain Formation
Normal D Flip Flops formation
Scan Flip Flops Formation
 The SI pin of the first scan cell is
connected to the SI port
 Q/SO pin of one cell is connected to
SI pin of the next cell to form a chain
 Q/SO pin of the last scan cell is
connected to the SO port
 All SE pins of scan cells are connected
to the SE port
 Form a scan chain consisting of 𝑁 scan
cells
 Any test vector can be shifted-in from SI
port in 𝑁 clock cycles
 Any test response can be shifted-out
to SO port in 𝑁 clock cycles
 Without scan chain, it could take
exponential number of cycles
 No changes made to the
previous connections of D, Q and
CLK pins
Scan Design: Sequential to Combinational
Circuit Testing
 Pins of a flip-flop becomes
controllable/observable from
primary input/output
 Q-pin can be treated as
pseudo-primary input (PPI)
 D-pin can be treated as
pseudo-primary output (PPO)
Scan design eases of testing:
 Effectively transforms the problem of sequential circuit testing to combinational
circuit testing
 Automatic test pattern generation (ATPG) problem effectively changes from sequential to
combinational
Scan Design Flow: Mechanism
Shift Mode: set SE=1.
 Shift in the desired test vector using
port SI to the scan cells F1, F2, F3.
 Apply the required test vector at
input
port also.
Capture Mode: set SE=0 for 1 clock cycle.
 If there was a fault for which test vector was applied, scan cells will capture the result of
fault and receive “fault” output
Shift Mode: switch back to shift mode (SE=1)
 Shift out the captured result to the port SO.
 The result is compared with the expected response
 Simultaneously, apply next test vector at port SI and allow it to scan-in through the scan
chain.
Scan Design Flow: Tasks
Design Preparation: Design becomes testable
Guidelines that must be followed during designing such that scan design flow can be used effectively
Scan Synthesis: Design becomes Scan Design
 Scan Configuration: Design becomes Scan Design
 Decide number of scan chains, scan cells to be used, exclude certain elements from being converted to
scan cells
 Scan Replacement (During Synthesis)
 Replace Flip-Flops with Scan Cells
 Scan Reordering and Stitching (During Physical Design)
 Reorder scan cells based on physical location so that routing becomes easier
 Test Vector Generation
 Scan Verification
 Scan Shift/Capture Operation using logic simulator
 Verify Timing (STA): Hold Violations
Scan Design Flow: Cost
 Area Overhead: Scan Cell, Routing resource
 IO Pin Cost
 Performance degradation: added delay of multiplexor
 Design Effort Cost
BIST: Topics
 Distinguishing Features
 Architecture
 Random Test Pattern Generation
 Test Response Analyzer
Built in Self Test (BIST):
•Drawbacks of ATE-based testing:
 Cost of testing high
 ATE cost
 Voluminous test data: increase test
time
 Can be done only in production test
• environment
 Lacks capability of field testing
 At-speed test difficult
 Probe’s inductance/capacitance
bottleneck
•BIST as a solution:
 Test-oriented additional hardware and
• software features inside a given IC
 Allows IC to test their own operation
 Reducing dependence on an external
ATE for testing
 Repair in the field possible
BIST: Distinguishing Features
1. Contains Pseudo-random pattern generator inside the chip
 Provides Test Vectors Dynamically
 Avoids storing voluminous test vectors
2.Performs signature analysis for detecting failures
 Does not perform comparison of exact response
 Avoids storing voluminous expected response inside the chip
Testability: Fault Coverage vs. Random Test Pattern Count
 Stuck-At Fault coverage rises to 100%
logarithmically
 Reaching 90% coverage is easy using random
patterns
BIST: Architecture
 Test Pattern Generator (TPG)
 Generates pattern for testing
 Can contain ROM
 Test Response Analyzer (TRA)
 Generates signature for the test
response and compare
 ROM stores golden signature
 Compares test signature with the golden
signature
 Test Controller
 Controls all the operations of BIST
 Strategy for overall test control is
most difficult part of BIST
BIST: Test Pattern Generator
 Pseudo-Random Pattern Generator
 Linear Feedback Shift Register
(LFSR)
 Repeatable
 Small hardware can produce large
number of “random” test patterns
 We can tap the output of any flip-flop
to provide feedback.
 If we tap the output 𝑎𝑖 of the i-th
flip- flop, then ℎ𝑖 is taken as 1, else
it is taken as 0.
𝑎𝑘+1 = 𝑎𝑘
0 1
𝑎𝑘+1 = 𝑎𝑘
1 2
….
𝑎𝑘+1 = 𝑎𝑘
−
𝑛 2 −
𝑛 1
𝑎𝑘+1
= 𝑎𝑘
⊕ ℎ1𝑎𝑘
⊕ ℎ2𝑎𝑘
…
⊕ ⊕ ℎ −1
𝑛 𝑎𝑘
−
𝑛 1 0 1 2 −
𝑛 1
Pattern Generator: Illustration
Pattern Generator: Considerations
 LFSR
 Test patterns generated by an LFSR have most of the properties of random numbers
 Desirable to have long sequence so that good fault coverage is achieved
 Some faults may be not covered by random pattern generator
 Use ATPG to get deterministic test-vector and put those test-vectors in ROM
 Helps achieve high fault coverage with small number of test vectors
BIST: Test Response Analyzer
 No. of test patterns can be large (e.g. 1 million) and there can be many outputs (e.g. 100)
 Too voluminous data to store in ROM (100 million bits)
 Compaction: method of reducing the number of bits in the circuit response
 Signature: a statistical property of a circuit, usually a number computed for a circuit from its
responses
 Signature Analysis: signature of a good circuit (“golden signature” ) compared with the
signature of a “potentially” faulty circuit (“test signature”)
 If “golden signature” matches “test signature” then the circuit is assumed to be
good,
else faulty
 Desirable: signature of a good circuit and faulty circuits are different
 Aliasing: During testing, it is possible that the signature of “good” circuit and “faulty” circuit
match
 Due to information loss during compaction
BIST: Test Response Analyzer
 Techniques to compute
Signature
 Ones Counting: count number
of ones across all circuit
responses
Different permutations can
yield same signature
 Modular LFSR: Extra XOR
gate at the input
Single Input Signature
Register (SISR)
Need to start with a
seed value
Built-In Self Test (BIST) Summary:
•Advantages
 Lower cost of test, since the need for
external electrical testing using an ATE
will be reduced
 No need to store test patterns
 At-speed test can be done
 Capability to perform tests outside the
production electrical testing
environment
•Disadvantages
 Additional silicon area
 Yield and Reliability decrease
 Performance loss
 Extra delays
 Additional pin (and possibly
bigger package size)
requirements
Automatic Test Pattern Generation
 Terminologies
 General approach to ATPG
 Redundant Faults
ATPG: Objective, Challenges and Practical Solution
•ATPG: Automatic Test Pattern Generator
 Objective: Generate test patterns (test
• vectors) that can be used to detect faults
 Desired: small set of test vectors that
detect all faults considered for that
circuit
•Challenges
 For generalized sequential circuits,
generating test vectors/sequences is
very difficult
 Reaching certain states may take
• exponential clock cycles
 Finding the test sequence that controls
or observes an internal point in the
circuit is runtime intensive
Practical Solution
 Sequential ATPG problem is transformed to Combinational ATPG problem by Scan
Design Flow
 Combinational ATPG problem, though NP-complete, has efficient algorithms
ATPG: Terminologies
 Path: sequence of pins in topological order
 On-path input or on-input: for a given path, the input pins lying on that path
 Side path inputs or side-inputs: The input pins other than the on-inputs of the instances
lying
on that path
ATPG: Controlling/Non-controlling values
Type of Gate
Controlling
Value
Non-
Controlling
Value
AND 0 1
NAND 0 1
OR 1 0
NOR 1 1
XOR Not Defined Any Value
Controlling value of a multi-input gate
 Value that can be assigned to any input of the
gate such that the output is known irrespective
of values on other inputs
Non-controlling value of a multi-input gate
 Value that can be assigned to any input of the
gate such that the output is decided by the
value on other inputs
ATPG: General Approach
• Path Sensitization Method
Fault Sensitization
Fault Propagation
Line Justification
ATPG: Illustration of Path Sensitization Method
Given: Stuck-at 1 at G4/X1
To Find: A test vector (value of A, B,
C, D) which will be able to detect the
existence of SA1 at G4/X1
Test Vector: (1,1,0,0)
 Fault Sensitization: Find the value at input ports
that will set the value at the fault site opposite of
the fault value
 Find A, B, C, D such that G4/X1=0 (A=1,
B=1)
 Fault Propagation: For the path from the fault
site to the output port, set the value of side-
inputs to non-controlling inputs
 Set G4/X2 to non-controlling value
(G4/X2=1)
 Line Justification: Find the value at input ports
that will set the side-inputs as found in fault
propagation
 Find A, B, C, D such that G4/X2=1 (C=0
D=0)
ATPG: Illustration of Backtracking
•Given: Stuck-at 0 at G3/Y
•To Find: A test vector to detect this fault.
 Fault Sensitization
 Find A, B, C, D such that G3/Y=1 (B=1,
C=0)
 Fault Propagation: Path to Y
 Set G5/X1 to non-controlling value (i.e. 1)
 Line Justification: A=0, B=0
 B=0 is in conflict!
 Must be Backtracked
 Fault Propagation: Path to Z
 Set G6/X2 to non-controlling value (i.e. 0)
 Line Justification: C=0 D=0
ATPG: Illustration of Redundant Fault
Given: Stuck-at 1 at pin G3/X1
To Find: A test vector to detect this fault
 Fault Sensitization
 Find A, B, C such that G3/X1=0 (B=0)
 Fault Propagation:
 For Propagation to Z: Set G3.X2=1
and G4/X1=0
 Line Justification:
 B=1 is in conflict with earlier B=0
 No test vector exists to detect this fault
 This is known as redundant fault
ATPG: Redundant Fault based Optimization
 Redundant faults can be used to reduce the hardware
 Redundant fault means that the behavior of the circuit with/without fault is the same
 Assume that the fault site has constant 0/1 optimize out gates that are not required
 Assume that SA1 at G3/X1 is always present.
 G3/X1=1 implies that G3/Y =C
ATPG : Challenges and Solutions
•Complications
 Primarily due to re-convergent fanouts
 Decisions required to be taken at
a particular point
 Decision leads to implications
 Some decisions can be wrong (leading
to conflicts in decisions)
 Backtracking required
•Backtracking Limit
 Too many backtrack => possible
redundant fault
 User defined Backtrack Limit employed by
tool
 Example Backtrack Limit = 1000
 Abort finding test vector when
backtrack limit is hit, i.e. when 1000
times backtracking has been done
Algorithmic Advancements
 D-algorithm: Roth 1966
 PODEM (Path-oriented Decision Making): Prabhu Goel 1981
 FAN (Fanout-oriented) Algorithm: Fujiwara

More Related Content

PPTX
Atpg flow chart
Minh Anh Nguyen
 
PDF
Loc, los and loes at speed testing methodologies for automatic test pattern g...
eSAT Journals
 
PDF
VLSI Static Timing Analysis Setup And Hold Part 2
Amr Adel
 
PPTX
System verilog coverage
Pushpa Yakkala
 
PDF
Automatic Test Pattern Generation (Testing of VLSI Design)
Usha Mehta
 
PDF
Verification flow and_planning_vlsi_design
Usha Mehta
 
PDF
2019 2 testing and verification of vlsi design_verification
Usha Mehta
 
PPT
01 Transition Fault Detection methods by Swetha
swethamg18
 
Atpg flow chart
Minh Anh Nguyen
 
Loc, los and loes at speed testing methodologies for automatic test pattern g...
eSAT Journals
 
VLSI Static Timing Analysis Setup And Hold Part 2
Amr Adel
 
System verilog coverage
Pushpa Yakkala
 
Automatic Test Pattern Generation (Testing of VLSI Design)
Usha Mehta
 
Verification flow and_planning_vlsi_design
Usha Mehta
 
2019 2 testing and verification of vlsi design_verification
Usha Mehta
 
01 Transition Fault Detection methods by Swetha
swethamg18
 

What's hot (20)

PPT
Chapter 14 - Protection
Wayne Jones Jnr
 
PPTX
Dft (design for testability)
shaik sharief
 
PPTX
An Introduction to Eye Diagram, Phase Noise and Jitter
Dr. Mohieddin Moradi
 
PPTX
Design for testability and automatic test pattern generation
Dilip Mathuria
 
PPTX
System verilog assertions
HARINATH REDDY
 
PDF
Clock Domain Crossing All Parts Combined.pdf
Amr Adel
 
PDF
How to create SystemVerilog verification environment?
Sameh El-Ashry
 
PPT
Topic: Virtual circuit & message switching
Dr Rajiv Srivastava
 
PPSX
System on chip buses
Dr. A. B. Shinde
 
PPTX
PCIe
ChiaYang Tsai
 
PDF
Uvm cookbook-systemverilog-guidelines-verification-academy
Raghavendra Kamath
 
PPTX
Vlsi physical design (Back End Process)
CHENCHU CHANDU PRASANTH NADELLA
 
PDF
Verilog Tasks & Functions
anand hd
 
PPTX
Pipelining of Processors Computer Architecture
Haris456
 
PPT
Behavioral modeling
dennis gookyi
 
PDF
ATPG Methods and Algorithms
Deiptii Das
 
PDF
Data Link Layer Numericals
Manisha Keim
 
DOCX
Pd flow i
Alok Kumar
 
PPTX
Multi mode multi corner (mmmc)
shaik sharief
 
PPTX
Basic CMOS differential pair (qualitative analysis)
shantanu Chutiya begger
 
Chapter 14 - Protection
Wayne Jones Jnr
 
Dft (design for testability)
shaik sharief
 
An Introduction to Eye Diagram, Phase Noise and Jitter
Dr. Mohieddin Moradi
 
Design for testability and automatic test pattern generation
Dilip Mathuria
 
System verilog assertions
HARINATH REDDY
 
Clock Domain Crossing All Parts Combined.pdf
Amr Adel
 
How to create SystemVerilog verification environment?
Sameh El-Ashry
 
Topic: Virtual circuit & message switching
Dr Rajiv Srivastava
 
System on chip buses
Dr. A. B. Shinde
 
Uvm cookbook-systemverilog-guidelines-verification-academy
Raghavendra Kamath
 
Vlsi physical design (Back End Process)
CHENCHU CHANDU PRASANTH NADELLA
 
Verilog Tasks & Functions
anand hd
 
Pipelining of Processors Computer Architecture
Haris456
 
Behavioral modeling
dennis gookyi
 
ATPG Methods and Algorithms
Deiptii Das
 
Data Link Layer Numericals
Manisha Keim
 
Pd flow i
Alok Kumar
 
Multi mode multi corner (mmmc)
shaik sharief
 
Basic CMOS differential pair (qualitative analysis)
shantanu Chutiya begger
 
Ad

Similar to Design for testability for Beginners PPT for FDP.pptx (20)

PDF
VLSI testing and analysis
Surekha PuriGosavi
 
PDF
COMPARATIVE ANALYSIS OF SIMULATION TECHNIQUES: SCAN COMPRESSION AND INTERNAL ...
IJCI JOURNAL
 
PPT
Soc.pptx
Jagu Mounica
 
PPTX
vlsitestingtechniquesand asic flow1.pptx
BEVARAVASUDEVAAP1813
 
PDF
Design for Testability in Timely Testing of Vlsi Circuits
IJERA Editor
 
PPSX
VLSI Testing Techniques
Dr. A. B. Shinde
 
PPT
fpga 3D
Jagathi Velpuri
 
PPT
Level sensitive scan design(LSSD) and Boundry scan(BS)
Praveen Kumar
 
PDF
Design-for-Test (Testing of VLSI Design)
Usha Mehta
 
PDF
On-chip Generation of Functional Tests with Reduced Delay and Power
journalBEEI
 
PDF
Low power test pattern generation for bist applications
eSAT Publishing House
 
PDF
Low power test pattern generation for bist applications
eSAT Journals
 
PDF
Advancing VLSI Design Reliability: A Comprehensive Examination of Embedded De...
IRJET Journal
 
DOCX
Certificates for bist including index
Prabhu Kiran
 
PDF
Jr3417541760
IJERA Editor
 
PDF
Reduced Test Pattern Generation of Multiple SIC Vectors with Input and Output...
IJERA Editor
 
PPTX
Unit 3 testing of logic circuits
swagatkarve
 
PPT
Test generation in VLSI design and Testing
Manjunath852579
 
PPT
VLSI TESTING.ppt
JashwanthReddy26
 
PPTX
1.Week1.pptx
sathisha36
 
VLSI testing and analysis
Surekha PuriGosavi
 
COMPARATIVE ANALYSIS OF SIMULATION TECHNIQUES: SCAN COMPRESSION AND INTERNAL ...
IJCI JOURNAL
 
Soc.pptx
Jagu Mounica
 
vlsitestingtechniquesand asic flow1.pptx
BEVARAVASUDEVAAP1813
 
Design for Testability in Timely Testing of Vlsi Circuits
IJERA Editor
 
VLSI Testing Techniques
Dr. A. B. Shinde
 
Level sensitive scan design(LSSD) and Boundry scan(BS)
Praveen Kumar
 
Design-for-Test (Testing of VLSI Design)
Usha Mehta
 
On-chip Generation of Functional Tests with Reduced Delay and Power
journalBEEI
 
Low power test pattern generation for bist applications
eSAT Publishing House
 
Low power test pattern generation for bist applications
eSAT Journals
 
Advancing VLSI Design Reliability: A Comprehensive Examination of Embedded De...
IRJET Journal
 
Certificates for bist including index
Prabhu Kiran
 
Jr3417541760
IJERA Editor
 
Reduced Test Pattern Generation of Multiple SIC Vectors with Input and Output...
IJERA Editor
 
Unit 3 testing of logic circuits
swagatkarve
 
Test generation in VLSI design and Testing
Manjunath852579
 
VLSI TESTING.ppt
JashwanthReddy26
 
1.Week1.pptx
sathisha36
 
Ad

More from ssuser13dc7d (7)

PPTX
Microprocessor and Microcontrollers LAB-PP.pptx
ssuser13dc7d
 
PPTX
Applications of satellite based remote sensing data and methods for forestry ...
ssuser13dc7d
 
PPTX
AI TOOLS AND TECHNIQUES FOR IMAGE PROCESSING
ssuser13dc7d
 
PPTX
FDP_Aritificial Intelligence _Agriculture_Water_Raghavendra.pptx
ssuser13dc7d
 
PPTX
Internet of things - architectureand Design principles.pptx
ssuser13dc7d
 
PPTX
DISASSEMBLER-DECOMPILER.pptx
ssuser13dc7d
 
PPTX
Day 3 - Protocols.pptx
ssuser13dc7d
 
Microprocessor and Microcontrollers LAB-PP.pptx
ssuser13dc7d
 
Applications of satellite based remote sensing data and methods for forestry ...
ssuser13dc7d
 
AI TOOLS AND TECHNIQUES FOR IMAGE PROCESSING
ssuser13dc7d
 
FDP_Aritificial Intelligence _Agriculture_Water_Raghavendra.pptx
ssuser13dc7d
 
Internet of things - architectureand Design principles.pptx
ssuser13dc7d
 
DISASSEMBLER-DECOMPILER.pptx
ssuser13dc7d
 
Day 3 - Protocols.pptx
ssuser13dc7d
 

Recently uploaded (20)

PPT
Ppt for engineering students application on field effect
lakshmi.ec
 
PDF
오픈소스 LLM, vLLM으로 Production까지 (Instruct.KR Summer Meetup, 2025)
Hyogeun Oh
 
PPTX
Color Model in Textile ( RGB, CMYK).pptx
auladhossain191
 
PPT
1. SYSTEMS, ROLES, AND DEVELOPMENT METHODOLOGIES.ppt
zilow058
 
PPTX
22PCOAM21 Session 1 Data Management.pptx
Guru Nanak Technical Institutions
 
PDF
2010_Book_EnvironmentalBioengineering (1).pdf
EmilianoRodriguezTll
 
PPTX
database slide on modern techniques for optimizing database queries.pptx
aky52024
 
PDF
67243-Cooling and Heating & Calculation.pdf
DHAKA POLYTECHNIC
 
PDF
Cryptography and Information :Security Fundamentals
Dr. Madhuri Jawale
 
PDF
dse_final_merit_2025_26 gtgfffffcjjjuuyy
rushabhjain127
 
DOCX
SAR - EEEfdfdsdasdsdasdasdasdasdasdasdasda.docx
Kanimozhi676285
 
PDF
Chad Ayach - A Versatile Aerospace Professional
Chad Ayach
 
PDF
settlement FOR FOUNDATION ENGINEERS.pdf
Endalkazene
 
PDF
Principles of Food Science and Nutritions
Dr. Yogesh Kumar Kosariya
 
PPTX
Inventory management chapter in automation and robotics.
atisht0104
 
PPTX
Victory Precisions_Supplier Profile.pptx
victoryprecisions199
 
PDF
67243-Cooling and Heating & Calculation.pdf
DHAKA POLYTECHNIC
 
PPTX
Information Retrieval and Extraction - Module 7
premSankar19
 
PDF
Top 10 read articles In Managing Information Technology.pdf
IJMIT JOURNAL
 
PPTX
unit 3a.pptx material management. Chapter of operational management
atisht0104
 
Ppt for engineering students application on field effect
lakshmi.ec
 
오픈소스 LLM, vLLM으로 Production까지 (Instruct.KR Summer Meetup, 2025)
Hyogeun Oh
 
Color Model in Textile ( RGB, CMYK).pptx
auladhossain191
 
1. SYSTEMS, ROLES, AND DEVELOPMENT METHODOLOGIES.ppt
zilow058
 
22PCOAM21 Session 1 Data Management.pptx
Guru Nanak Technical Institutions
 
2010_Book_EnvironmentalBioengineering (1).pdf
EmilianoRodriguezTll
 
database slide on modern techniques for optimizing database queries.pptx
aky52024
 
67243-Cooling and Heating & Calculation.pdf
DHAKA POLYTECHNIC
 
Cryptography and Information :Security Fundamentals
Dr. Madhuri Jawale
 
dse_final_merit_2025_26 gtgfffffcjjjuuyy
rushabhjain127
 
SAR - EEEfdfdsdasdsdasdasdasdasdasdasdasda.docx
Kanimozhi676285
 
Chad Ayach - A Versatile Aerospace Professional
Chad Ayach
 
settlement FOR FOUNDATION ENGINEERS.pdf
Endalkazene
 
Principles of Food Science and Nutritions
Dr. Yogesh Kumar Kosariya
 
Inventory management chapter in automation and robotics.
atisht0104
 
Victory Precisions_Supplier Profile.pptx
victoryprecisions199
 
67243-Cooling and Heating & Calculation.pdf
DHAKA POLYTECHNIC
 
Information Retrieval and Extraction - Module 7
premSankar19
 
Top 10 read articles In Managing Information Technology.pdf
IJMIT JOURNAL
 
unit 3a.pptx material management. Chapter of operational management
atisht0104
 

Design for testability for Beginners PPT for FDP.pptx

  • 2. DFT: Key Areas • Basics of DFT • SCAN Design Methodology • Built in Self Test(BIST) • Automatic Test Pattern Generation (ATPG) • ATE Testing
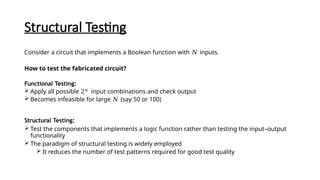
  • 4. Structural Testing Consider a circuit that implements a Boolean function with 𝑁 inputs. How to test the fabricated circuit? Functional Testing:  Apply all possible 2𝑁 input combinations and check output  Becomes infeasible for large 𝑁 (say 50 or 100) Structural Testing:  Test the components that implements a logic function rather than testing the input–output functionality  The paradigm of structural testing is widely employed  It reduces the number of test patterns required for good test quality
  • 5. Functional Testing vs. Structural Testing Structural Testing Test individual components of the circuit ( G1, G2, G3, G4, and G5) Each gate will require 24 = 16 input combinations (total 80) Functional Testing Will require 2^N, i.e., 216 = 65536 input combinations Assumptions Can observe the output pins for all the components Can write any value at the input pins of all the components There could be a problem in the integration of components (need to tackle that also). DFT techniques tries to make structural testing more effective by ensuring the above assumptions.
  • 6. Fault Models Fault Model  Represents a defect using a logical or electrical model Why do we use a Fault Model?  Allows us to analyze the impact of a defect using logic or circuit analysis techniques  Allows deriving test patterns algorithmically for detecting a given fault  Quantitative assessment of testing effectiveness using fault coverage  Transforms the problem of defect detection to the problem of fault detection
  • 7. Stuck-at Fault Models Stuck-at Fault Model  Assumes that defects cause the signal to be permanently stuck at a constant logic  Transforms defects to a logical fault model  Two types:  Stuck at logic “0”: stuck-at-0 or SA0 fault  Stuck at logic “1”: stuck-at-1 or SA1 fault Single Stuck-at Fault Model  Assumes that there is only one fault active at a time  Reduces the complexity of test pattern generation significantly
  • 8. Stuck-at Faults: Fault Site Fault-site: The point where a fault exists or we assume it to exist Emulate a stuck-at fault by first disconnecting the corresponding signal source. Tie it to the constant logic (either 0 or 1 depending on the fault type) Multi-fanout net (N>1):  (N+1) fault sites
  • 9. Possible Stuck-at Faults: Illustration Consider the circuit alongside How many single stuck-at (0/1) faults are possible in this circuit?
  • 10. Detecting a Fault: Test Vectors Test Vectors Any input pattern, or sequence of input patterns, that produces a different output response for a faulty circuit and a fault-free circuit Exhaustive Testing for functionality  Exponential number of test vectors required (2𝑁 ) to test the functionality Single stuck-at fault model makes the number of fault linear in the number of circuit elements
  • 11. Design for Testability: Test Vectors Stuck-at 0 Stuck-at 1 A B C D Z A/0 B/0 C/0 D/0 Z/0 A/1 B/1 C/1 D/1 Z/1 0 0 0 0 1 1 1 1 1 0 1 1 1 1 1 0 0 0 1 1 1 1 1 1 0 1 1 1 1 1 0 0 1 0 1 1 1 1 1 0 1 1 1 1 1 0 0 1 1 1 1 1 1 1 0 1 1 1 1 1 0 1 0 0 1 1 1 1 1 0 1 1 1 1 1 0 1 0 1 1 1 1 1 1 0 1 1 1 1 1 0 1 1 0 1 1 1 1 1 0 1 1 1 1 1 0 1 1 1 1 1 1 1 1 0 0 1 1 1 1 1 0 0 0 1 1 1 1 1 0 1 1 1 1 1 1 0 0 1 1 1 1 1 1 0 1 1 1 1 1 1 0 1 0 1 1 1 1 1 0 1 1 1 1 1 1 0 1 1 1 1 1 1 1 0 1 1 1 1 1 1 1 0 0 1 1 1 1 1 0 1 0 1 1 1 1 1 0 1 1 1 1 1 1 0 1 1 0 1 1 1 1 1 0 1 1 1 1 1 0 1 1 1 0 1 1 1 1 1 0 1 1 1 1 0 0 0 0 0 1
  • 12. Combinational Circuit: Controllability and Observability If the NAND gate was lying too deep in a circuit, it is difficult to apply the required test vectors at the inputs Controllability: ability to set any desired value (0 or 1) on the internal signals of a circuit by applying an appropriate test-vector to the primary inputs Similarly the output of NAND gate will be difficult to observe at any primary output if the NAND gate is lying too deep in circuit Observability: ability to examine any internal signal by propagating its value to a primary output by applying appropriate test vector to the primary inputs.
  • 13. Sequential Circuit: Controllability and Observability Problem of controllability Setting a particular value at any pin in a sequential circuit is more difficult  Several cycles may be required to write a particular value  State traversal required  Finding such a test sequence is time consuming by sequential ATPG tool Problem of observability Similar difficulty in examining the value at a particular pin in the sequential circuit (requires state traversal)
  • 14. SCAN Design Methodology • Scan Design Flow  Design Modifications  Mechanism of Testing  Tasks
  • 15. Design Modifications in SCAN Design Flow Normal Flip Flop Vs SCAN Flip Flop  Extra primary ports added  TM (Test Mode)  SE (Scan Enable)  SI (Scan In)  SO (Scan Out)  D flip-flops replaced with another memory elements (scan cells)  Scan cells are reconnected to form shift register (scan chain) Outcome:  Dramatically improve controllability and observability of memory elements (flip-flop) in a sequential circuit
  • 16. Scan Design Flow: Different Modes Design works in three modes: 1. Normal Mode: functional mode in which chip works 2. Shift Mode:  Memory elements (i.e. scan cells) work as shift registers  Test vectors are shifted-in and responses are shifted-out 3. Capture Mode: response of the fabricated circuit is captured during testing Test Mode Scan Enable Normal Mode 0 0 Shift Mode 1 1 Capture Mode 1 0
  • 17. Scan Cells: Different kinds of scan cell can be used Most popular is MUXED-D Scan Cell  D, CLK, Q similar to D flip-flop  SI ≡ scan input  SE ≡ scan enable  Q also works as SO≡ scan out  The multiplexer selects data between D and SI using the value at SE pin  In the normal/capture mode: SE=0  Value at D is latched  In the shift mode, SE=1  Value at SI is latched  Output pin produces the content of D flip-flop  Next State could be of D-pin or SI-pin
  • 18. Scan Chain Formation Normal D Flip Flops formation Scan Flip Flops Formation  The SI pin of the first scan cell is connected to the SI port  Q/SO pin of one cell is connected to SI pin of the next cell to form a chain  Q/SO pin of the last scan cell is connected to the SO port  All SE pins of scan cells are connected to the SE port  Form a scan chain consisting of 𝑁 scan cells  Any test vector can be shifted-in from SI port in 𝑁 clock cycles  Any test response can be shifted-out to SO port in 𝑁 clock cycles  Without scan chain, it could take exponential number of cycles  No changes made to the previous connections of D, Q and CLK pins
  • 19. Scan Design: Sequential to Combinational Circuit Testing  Pins of a flip-flop becomes controllable/observable from primary input/output  Q-pin can be treated as pseudo-primary input (PPI)  D-pin can be treated as pseudo-primary output (PPO) Scan design eases of testing:  Effectively transforms the problem of sequential circuit testing to combinational circuit testing  Automatic test pattern generation (ATPG) problem effectively changes from sequential to combinational
  • 20. Scan Design Flow: Mechanism Shift Mode: set SE=1.  Shift in the desired test vector using port SI to the scan cells F1, F2, F3.  Apply the required test vector at input port also. Capture Mode: set SE=0 for 1 clock cycle.  If there was a fault for which test vector was applied, scan cells will capture the result of fault and receive “fault” output Shift Mode: switch back to shift mode (SE=1)  Shift out the captured result to the port SO.  The result is compared with the expected response  Simultaneously, apply next test vector at port SI and allow it to scan-in through the scan chain.
  • 21. Scan Design Flow: Tasks Design Preparation: Design becomes testable Guidelines that must be followed during designing such that scan design flow can be used effectively Scan Synthesis: Design becomes Scan Design  Scan Configuration: Design becomes Scan Design  Decide number of scan chains, scan cells to be used, exclude certain elements from being converted to scan cells  Scan Replacement (During Synthesis)  Replace Flip-Flops with Scan Cells  Scan Reordering and Stitching (During Physical Design)  Reorder scan cells based on physical location so that routing becomes easier  Test Vector Generation  Scan Verification  Scan Shift/Capture Operation using logic simulator  Verify Timing (STA): Hold Violations
  • 22. Scan Design Flow: Cost  Area Overhead: Scan Cell, Routing resource  IO Pin Cost  Performance degradation: added delay of multiplexor  Design Effort Cost
  • 23. BIST: Topics  Distinguishing Features  Architecture  Random Test Pattern Generation  Test Response Analyzer
  • 24. Built in Self Test (BIST): •Drawbacks of ATE-based testing:  Cost of testing high  ATE cost  Voluminous test data: increase test time  Can be done only in production test • environment  Lacks capability of field testing  At-speed test difficult  Probe’s inductance/capacitance bottleneck •BIST as a solution:  Test-oriented additional hardware and • software features inside a given IC  Allows IC to test their own operation  Reducing dependence on an external ATE for testing  Repair in the field possible
  • 25. BIST: Distinguishing Features 1. Contains Pseudo-random pattern generator inside the chip  Provides Test Vectors Dynamically  Avoids storing voluminous test vectors 2.Performs signature analysis for detecting failures  Does not perform comparison of exact response  Avoids storing voluminous expected response inside the chip
  • 26. Testability: Fault Coverage vs. Random Test Pattern Count  Stuck-At Fault coverage rises to 100% logarithmically  Reaching 90% coverage is easy using random patterns
  • 27. BIST: Architecture  Test Pattern Generator (TPG)  Generates pattern for testing  Can contain ROM  Test Response Analyzer (TRA)  Generates signature for the test response and compare  ROM stores golden signature  Compares test signature with the golden signature  Test Controller  Controls all the operations of BIST  Strategy for overall test control is most difficult part of BIST
  • 28. BIST: Test Pattern Generator  Pseudo-Random Pattern Generator  Linear Feedback Shift Register (LFSR)  Repeatable  Small hardware can produce large number of “random” test patterns  We can tap the output of any flip-flop to provide feedback.  If we tap the output 𝑎𝑖 of the i-th flip- flop, then ℎ𝑖 is taken as 1, else it is taken as 0. 𝑎𝑘+1 = 𝑎𝑘 0 1 𝑎𝑘+1 = 𝑎𝑘 1 2 …. 𝑎𝑘+1 = 𝑎𝑘 − 𝑛 2 − 𝑛 1 𝑎𝑘+1 = 𝑎𝑘 ⊕ ℎ1𝑎𝑘 ⊕ ℎ2𝑎𝑘 … ⊕ ⊕ ℎ −1 𝑛 𝑎𝑘 − 𝑛 1 0 1 2 − 𝑛 1
  • 30. Pattern Generator: Considerations  LFSR  Test patterns generated by an LFSR have most of the properties of random numbers  Desirable to have long sequence so that good fault coverage is achieved  Some faults may be not covered by random pattern generator  Use ATPG to get deterministic test-vector and put those test-vectors in ROM  Helps achieve high fault coverage with small number of test vectors
  • 31. BIST: Test Response Analyzer  No. of test patterns can be large (e.g. 1 million) and there can be many outputs (e.g. 100)  Too voluminous data to store in ROM (100 million bits)  Compaction: method of reducing the number of bits in the circuit response  Signature: a statistical property of a circuit, usually a number computed for a circuit from its responses  Signature Analysis: signature of a good circuit (“golden signature” ) compared with the signature of a “potentially” faulty circuit (“test signature”)  If “golden signature” matches “test signature” then the circuit is assumed to be good, else faulty  Desirable: signature of a good circuit and faulty circuits are different  Aliasing: During testing, it is possible that the signature of “good” circuit and “faulty” circuit match  Due to information loss during compaction
  • 32. BIST: Test Response Analyzer  Techniques to compute Signature  Ones Counting: count number of ones across all circuit responses Different permutations can yield same signature  Modular LFSR: Extra XOR gate at the input Single Input Signature Register (SISR) Need to start with a seed value
  • 33. Built-In Self Test (BIST) Summary: •Advantages  Lower cost of test, since the need for external electrical testing using an ATE will be reduced  No need to store test patterns  At-speed test can be done  Capability to perform tests outside the production electrical testing environment •Disadvantages  Additional silicon area  Yield and Reliability decrease  Performance loss  Extra delays  Additional pin (and possibly bigger package size) requirements
  • 34. Automatic Test Pattern Generation  Terminologies  General approach to ATPG  Redundant Faults
  • 35. ATPG: Objective, Challenges and Practical Solution •ATPG: Automatic Test Pattern Generator  Objective: Generate test patterns (test • vectors) that can be used to detect faults  Desired: small set of test vectors that detect all faults considered for that circuit •Challenges  For generalized sequential circuits, generating test vectors/sequences is very difficult  Reaching certain states may take • exponential clock cycles  Finding the test sequence that controls or observes an internal point in the circuit is runtime intensive Practical Solution  Sequential ATPG problem is transformed to Combinational ATPG problem by Scan Design Flow  Combinational ATPG problem, though NP-complete, has efficient algorithms
  • 36. ATPG: Terminologies  Path: sequence of pins in topological order  On-path input or on-input: for a given path, the input pins lying on that path  Side path inputs or side-inputs: The input pins other than the on-inputs of the instances lying on that path
  • 37. ATPG: Controlling/Non-controlling values Type of Gate Controlling Value Non- Controlling Value AND 0 1 NAND 0 1 OR 1 0 NOR 1 1 XOR Not Defined Any Value Controlling value of a multi-input gate  Value that can be assigned to any input of the gate such that the output is known irrespective of values on other inputs Non-controlling value of a multi-input gate  Value that can be assigned to any input of the gate such that the output is decided by the value on other inputs
  • 38. ATPG: General Approach • Path Sensitization Method Fault Sensitization Fault Propagation Line Justification
  • 39. ATPG: Illustration of Path Sensitization Method Given: Stuck-at 1 at G4/X1 To Find: A test vector (value of A, B, C, D) which will be able to detect the existence of SA1 at G4/X1 Test Vector: (1,1,0,0)  Fault Sensitization: Find the value at input ports that will set the value at the fault site opposite of the fault value  Find A, B, C, D such that G4/X1=0 (A=1, B=1)  Fault Propagation: For the path from the fault site to the output port, set the value of side- inputs to non-controlling inputs  Set G4/X2 to non-controlling value (G4/X2=1)  Line Justification: Find the value at input ports that will set the side-inputs as found in fault propagation  Find A, B, C, D such that G4/X2=1 (C=0 D=0)
  • 40. ATPG: Illustration of Backtracking •Given: Stuck-at 0 at G3/Y •To Find: A test vector to detect this fault.  Fault Sensitization  Find A, B, C, D such that G3/Y=1 (B=1, C=0)  Fault Propagation: Path to Y  Set G5/X1 to non-controlling value (i.e. 1)  Line Justification: A=0, B=0  B=0 is in conflict!  Must be Backtracked  Fault Propagation: Path to Z  Set G6/X2 to non-controlling value (i.e. 0)  Line Justification: C=0 D=0
  • 41. ATPG: Illustration of Redundant Fault Given: Stuck-at 1 at pin G3/X1 To Find: A test vector to detect this fault  Fault Sensitization  Find A, B, C such that G3/X1=0 (B=0)  Fault Propagation:  For Propagation to Z: Set G3.X2=1 and G4/X1=0  Line Justification:  B=1 is in conflict with earlier B=0  No test vector exists to detect this fault  This is known as redundant fault
  • 42. ATPG: Redundant Fault based Optimization  Redundant faults can be used to reduce the hardware  Redundant fault means that the behavior of the circuit with/without fault is the same  Assume that the fault site has constant 0/1 optimize out gates that are not required  Assume that SA1 at G3/X1 is always present.  G3/X1=1 implies that G3/Y =C
  • 43. ATPG : Challenges and Solutions •Complications  Primarily due to re-convergent fanouts  Decisions required to be taken at a particular point  Decision leads to implications  Some decisions can be wrong (leading to conflicts in decisions)  Backtracking required •Backtracking Limit  Too many backtrack => possible redundant fault  User defined Backtrack Limit employed by tool  Example Backtrack Limit = 1000  Abort finding test vector when backtrack limit is hit, i.e. when 1000 times backtracking has been done Algorithmic Advancements  D-algorithm: Roth 1966  PODEM (Path-oriented Decision Making): Prabhu Goel 1981  FAN (Fanout-oriented) Algorithm: Fujiwara