SlideShare a Scribd company logo
Digital Image Processing
DAY 2- 22/6/2020
TODAYS TOPICS:
• Elements of Visual Perception
• Image Sensing and Acquisition
• Image Sampling and Quantization
• Relationships between pixels
Elements of visual perception
Human Eye,
a 3D
view
2
Elements of visual perception
Human Eye,
a 2D
view 3
1. A human eye, nearly a sphere with an average diameter of
approximately 20 mm, is enclosed by three membranes: cornea
and sclera, choroid and retina.
2. The Cornea is a tough & transparent tissue, covering the
anterior surface of the eye.
3. The Sclera is an opaque membrane, enclosing the remainder of
the eye globe.
4. The Choroid contains blood vessels to supply nutrients to the
eye. It is heavily pigmented stopping external light and is
divided into ciliary body and iris.
4
Elements of visual perception
5. Center opening of iris, known as pupil, is about 2-8 mm in
diameter. The front of iris is filled with visible pigments and its
back with black pigments.
6. The lens, layers of fiberous cells, is having 60% to 70% H2O, 6%
fat and rest protein. It is lightly yellowishly pigmented.
7. The retina is rich with cones and rods which are light receptors.
8. The cones, 6 to 7 millions in count are primarily located in the
center of retina, known as fovea. They are responsible for
photopic (bright light) vision-colour vision.
5
Elements of visual perception
9. The rods, 75 to 150 millions in count, are distributed all over the
retina. They are responsible for scotopic (dim light) vision-
contrast.
10. An individual cone is connected to an individual optical nerve and
hence accounts for perception of finer details.
11. Group of rods is connected to group of optical nerves and hence
accounts for overall perception.
12. The blind spot in the eye is
entirely deprived of the light receptors, rods
and cones.
6
Elements of visual perception
Image Formation in Human Eye
H
h
D F
The distance between the center of the lens and
the retina, called the
focal length, varies from approximately 17 mm to
about 14 mm.
The height, h of an object of height, H perceived
by an observer, having a focal length, F, from a
distance, D is given by the principle of similar
triangle.
D
F
7
 
D

H

h
 h   H F
Brightness Adaptation of Human
Eye
Subjective brightness is a logarithmic function of incident
light intensity.
8
Brightness Adaptation of Human
Eye
9
The brightness adaptation is a phenomenon which describes the
ability of the human eye in simultaneously discriminating
distinct intensity levels.
The brightness adaptation level is the current sensitivity level of
the visual system for any given set of conditions.
The simultaneous contrast is a phenomenon which describes that
the perceived brightness of a region in an image is not a simple
function of its intensity rather it depends on the intensities of
neighboring regions.
Brightness Adaptation of Human
Eye
The match bands are the adjacently
spaced rectangular stripes of
constant intensities
to demonstrate
the phenomenon of simultaneous
contrast.
Examples of simultaneous
contrast. All the inner
squares have the same
10
intensity, but
theyprogressively
darke
r
appear
as
the
background becomes
lighter.
Illusion
of a
white
square
Illusion of a
white
circle
Illusion of a
white
circle
11
Illusion of loss of parallelism &
co- planarity
12
A “color” of a light is determined by its wavelength.
Any object absorbs and reflects
light energy wavelengths.
13
at
particula
r
The perceived color of an object is determined by the wavelength
of the light reflected from it.
The object that absorbs the light energy at all wavelength “looks”
black to the perceiver while the object that reflects the light
energy at all wavelengths “looks” white to the perceiver.
Color
Fundamentals
Achromatic light – Black and White (and their shades, gray shades).
Chromatic light – Colors (and their shades).
Three basic quantities are used to describe the quality of a
chromatic light source: radiance, luminance, and brightness.
Radiance is the total amount of energy
that flows from the light source, and it
is usually measured in watts (W).
Luminance, measured in lumens (lm), gives a measure of the amount
of energy an observer perceives from a light source.
Brightness is a subjective descriptor that is practically impossible
to measure.
14
Color
Fundamentals
Cones are the sensors in the eye responsible for color vision.
Approximately 65% of all cones are sensitive to red light, 33%
are sensitive to green light, and only about 2% are sensitive to
blue. Due to these absorption characteristics of the human eye,
colors arc seen as variable combinations of the so-called primary
colors red (R), green (G), and blue (B).
The characteristics generally used to distinguish one color from
another are brightness, hue, and saturation. Brightness embodies
the chromatic notion of intensity. Hue is an attribute associated
with the dominant wavelength in a mixture of light waves.
Saturation refers to the relative purity or the amount of white
light mixed with a hue.
Hue and saturation taken together are called Chromaticity.
15
Color
Fundamentals
The amounts of red, green, and blue needed to form any particular
color are called the tristimidus values and are denoted, X, Y,
and Z, respectively.
A color is then specified by its trichromatic coefficients, defined
as
Color Fundamentals
16
A color model (also called color space or color system) is a
specification of a coordinate system and a subspace within that
system where each color is represented by a single point.
The RGB color model: In the RGB model, each color appears in its
primary spectral components of red, green, and blue. This model
is based on a Cartesian coordinate system. The color subspace
is the cube in which RGB values are at three corners; cyan,
magenta, and yellow are at three other corners; black is at the
origin; and white is at the corner farthest from the origin.
The gray scale (points of equal RGB values) extends from black to
white along the diagonal line joining these two points.
The different colors are points on or inside the cube, and are
defined by vectors extending from the origin.
All values of R, G. and B are assumed to be in the range [0, 1].
17
Color Models
Color Models
The RGB color
model
18
Merits of RGB color model: (i) Well suited for hardware
implementations and (ii) Matches nicely with the fact that the
human eye is strongly perceptive to red, green, and blue primary
colors.
Demerits of RGB color model: Not well suited for describing
colors in terms that are practical for human interpretation.
The HSI color model: A color perceived by a human eye is
described by its Hue, Saturation and Intensity. HSI (Hue,
Saturation and Intensity) color model thus decouples the
intensity component from the color-carrying information (hue
and saturation).
19
Color Models
Forming the HSI color
model from the RGB color
model
23
The HSI coordinate system and
corresponding color subspace is
obtained as follows: The RGB color
cube rotated such that the cube is
standing on its black vertex with
the white vertex directly above and
the cyan, blue, green, red, yellow
and magenta vertices forming a
hexagon as shown below.
The dot is an arbitrary color point.
The angle from the red axis gives
the hue, and the length of the
vector is the saturation. The
intensity of all colors in any of
these planes is given by the position
of the plane on the vertical
intensity axis.
Color Models
Color Models
The HSI color
model
21
Principle of Video Camera:
Vidicon
Vidicon Camera Tube – Cross Sectional
View
22
Construction
The Vidicon came into general use in the early 50’s and gained
immediate popularity because of its small size and ease of
operation. It functions on the principle of photoconductivity,
where the resistance of the target material shows a marked
decrease when exposed to light.
The target consists of a thin photo conductive layer of either
selenium or anti-mony compounds. This is deposited on a
transparent conducting film, coated on the inner surface of the
face plate. This conductive coating is known as signal electrode or
plate. Image side of the photolayer, which is in contact with the
signal electrode, is connected to DC supply through the load
resistance RL.
23
Principle of Video Camera:
Vidicon
The beam that emerges from the electron gun is focused on
surface of the photo conductive layer by combined action of
uniform magnetic field of an external coil.
The electrostatic field of grid No 3. Grid No. 4 provides a uniform
decelerating field between itself, and the photo conductive
layer, so that the electron beam approaches the layer with a
low velocity to prevent any secondary emission.
Deflection of the beam, for scanning the target, is obtained by
vertical and horizontal deflecting coils, placed around the tube.
24
Principle of Video Camera:
Vidicon
Principle of Video Camera:
Vidicon
Circuit for output current for
Vidicon Camera
25
Charge Image
The photolayer has a thickness of about 0.0001 cm, and behaves
like an insulator with a resistance of approximately 20 M when in
dark.
When bright light falls on any area of the photoconductive coating,
resistance across the thickness of that portion gets reduces to
about 2 M. Thus, with an image on the target, each point on the
gun side of the photolayer assumes a certain potential with respect
to the DC supply, depending on its resistance to the signal plate.
A pattern of positive potentials appears, on the gun side of the
photolayer, producing a charge image, that corresponds to the
incident optical image.
26
Principle of Video Camera:
Vidicon
Another way of explaining the development of ‘charge image’ on the
photolayer is to consider it as an array of individual target
elements, each consisting of a capacitor paralleled with a light
dependent resistor. One end of these target elements is
connected to the signal electrode and the other end is
unterminated facing the beam.
Storage Action
Each element of the photocoating is scanned at intervals equal to
the frame time. This results in storage action and the net
change in resistance, at any point or element on the
photoconductive layer, depends on the time, which elapses
between two successive scannings and the intensity of incident
light. Since storage time for all points on the target plate is
same, the net change in resistance of all elementary areas is
proportional to light intensity variations in the scene being
televised.
27
Principle of Video Camera:
Vidicon
Signal Current
As the beam scans the target plate, it encounters different
positive potentials on the side of the photolayer that faces the
gun.
Sufficient number of electrons from the beam is then deposited on
the photolayer surface to reduce the potential of each element
towards the zero cathode potential. The remaining electrons, not
deposited on the target, return back and are not utilized in the
vidicon.
The sudden change in potential on each element while the beam
scans, causes a current flow in the signal electrode circuit
producing a varying voltage across the load resistance RL. The
amplitude of current and the consequent output voltage across RL
are directly proportional to the light intensity variations on the
scene.
28
Principle of Video Camera:
Vidicon
Principle of Still Camera: Charge
Coupled Devices:
A MOS capacitor as a light sensitive
device
1
SiO2
n-
channel
p-
substrate
Polysilico
n
Gate
Polysilicon 3
Gate
Polysilicon

2
Gate
Potential
well
made by
depletion
layer
Photon
s
Photonicall
y
liberated
electrons
29
Principle of Still Camera: Charge
Coupled Devices:
A MOS capacitor as a light sensitive
device
1 2 3 1 2 3 1 2 3
p-substrate p-substrate
SiO2
n-
channel
Polysilico
n
Gate
30
Charge Coupled Devices (CCD)
The operation of solid state image scanners is based on the
functioning of charge coupled devices (CCDs) which is a new concept
in metal- oxide-semiconductor (MOS) circuitry. The CCD may be
thought of to be a shift register formed by a string of very closely
spaced MOS capacitors. It can store and transfer analog charge
signals— either electrons or holes—that may be introduced
electrically or optically.
Construction
The chip consists of a p-type substrate, the one side of which is
oxidized to form a film of silicon dioxide, which is an insulator. Then
by photolithographic processes, similar to those used in miniature
integrated circuits an array of metal electrodes, known as gates,
are deposited on the insulator film. This results in the creation of a
very large number of tiny MOS capacitors on the entire surface of
the chip.
31
Principle of Still Camera: Charge
Coupled Devices:
Principle of Operation
The application of small positive potentials to the gate electrodes
results in the development of depletion regions just below them.
These are called potential wells. The depth of each well (depletion
region) varies with the magnitude of the applied potential.
The gate electrodes operate in groups of three, with every third
electrode connected to a common conductor. The spots under them
serve as light sensitive elements.
When any image is focused onto the silicon chip, electrons are
generated within it, but very close to the surface. The number of
electrons depends on the intensity of incident light. Once produced
they collect in the nearby potential wells. As a result the pattern of
collected charges represents the optical image.
32
Principle of Still Camera: Charge
Coupled Devices:
Principle of Operation Charge Transfer
The charge of one element is transferred to another along the
surface of the silicon chip by applying a more positive voltage to
the adjacent electrode or gate, while reducing the voltage on it.
The manner in which the transition takes place from potential wells
is illustrated in the figure. This is achieved with the influence of
continuing clock pulses.
The clocking sequence continues and the charge finally reaches the
end of the array where it is collected to form the signal current.
33
Principle of Still Camera: Charge
Coupled Devices:
Principle of Still Camera: Charge
Coupled Devices:
CCD
Readout 34
Principle of Operation CCD Readout
The two-dimensional array of potential wells is generally referred
to as parallel register.
A one-dimensional CCD array acts as a serial register and plays an
important role during the CCD readout operation.
A programmed sequence of changing gate potentials causes all
charge packets stored in the parallel register to be shifted in
parallel one row toward the serial register. The charge stored in
the top row is shifted from the parallel register to the serial
register. Once in the serial register, the charge packets are
individually shifted toward the output amplifier.
35
Principle of Still Camera: Charge
Coupled Devices:
An (monochrome or black & white) image is a 2-D light-
intensity function denoted as f(x,y).
The value or amplitude, f of the function at any spatial coordinates
(x,y) is the intensity of the image at that point.
As light is energy, this value is non-zero and finite i.e., 0  f  
f(x,y) has two components: (i) i(x,y), the amount of light incident on
the scene being viewed and (ii) r(x,y), the reflectance relating
to the amount of light reflected by the objects in the scene
i.e., f(x,y) = i(x,y) r(x,y) where 0  i   & 0  r  1
36
(Monochrome) Image
model
For a monochrome image the intensity of the image, f at any
coordinates (x,y) is termed as gray level, l of the image at
that point, i.e.,
Lmin  l  Lmax  0  l  L, 0  black & L  white
Intermediate values  shades of gray or gray shades
37
(Monochrome) Image
model
To obtain a digital image, f(x,y) must be digitized both in space and
amplitude.
-digitization of spatial coordinates - image sampling
-digitization of amplitude - gray-level quantization
The image sampling is viewed as partitioning an image plane into a
grid with coordinates of center of each grid from an integer
set ZZ.
The (gray-level) quantization is viewed as assigning a value from a
real number set R as gray level to each grid.
Hence resulting digital image is a MN matrix in which each matrix
element represents a image element or picture element or pixel
and its value represents the gray level of that pixel.
38
Sampling and
quantization
Sampling and
quantization
39






f(0,N1)









f
f(0,0)
f(1,0)

f(0,1)
f(1,1)

f(0,2)
f(1,2)

 

 


   
   
(M1,0)f(M1,1)f(M1,2)



f(M1,N1)

f(1,N1)

The number of samples or pixels, MN required to approximate an
image is known as spatial resolution of the image.
The low or insufficient spatial resolution results in pixel replication
causing a checkerboard effect.
Sampling and
quantization
Effect of spatial resolution
– checkerboard effect
40
The number of discrete gray levels, G allowed for a pixel in a
digital image is known as gray-level resolution of the image.
The low or insufficient gray-level
resolution results in ridge-like
structures in smooth areas causing false contouring.
41
Sampling and
quantization
Effect of gray-level resolution – false contouring:
Original 8-bit image
42
Effect of gray-level resolution – false contouring:
Original 4-bit image
43
Effect of gray-level resolution – false contouring:
Original 2-bit image
44
Effect of gray-level resolution – false contouring:
Original 1-bit image, binary image
45
•
DIGITAL IMAGE PROCESSING - Visual perception - DAY 2
48
• The eye is nearly a sphere, with an average
diameter of approximately 20mm.
• Three membranes enclose the eye:
• The cornea and sclera outer cover the choroid the
retina.
49
Cornea
• The cornea is a tough, transparent tissue that covers
the anterior surface of the eye.
• Continuous with the cornea,the sclera is an opaque
membrane that encloses the remainder of the optic
globe.
50
Choroid
• The choroid lies directly below the sclera.
• This membrane contains a net- work of blood vessels that
serve as the major source of nutrition to the eye.
• The choroid coat is heavily pigmented and hence helps to
reduce the amount of extraneous light entering the eye
and the backscatter within the optical globe.
51
• At its anterior extreme, the choroid is divided into the
ciliary body and the iris diaphragm.
• The latter contracts or expands to control the amount
of light that enters the eye
• Thefront of the iris contains the visible
pigment of the eye, whereas the back contains a
black pigment.
52
• The lens is made up of concentric layers of fibrous
cells and is suspended by fibers that attach to the
ciliary body.
• It contains 60 to 70% water, about 6% fat, and more
protein than any other tissue in the eye.
53
Retina
• The innermost membrane of the eye is the retina,
which lines the Inside of the ǁall’s entire posterior
portion.
• When the eye is properly focused, light from an object
outside the eye is imaged on the retina.
• Pattern vision is afforded by the distribution of discrete
light receptors over the surface of the retina.
54
• There are two classes of receptors: cones and rods.
• The cones in each eye number between 6 and 7
million.
• They are located primarily in the central portion of
the retina, called the fovea, and are highly sensitive
to color.
55
• Muscles controlling the eye rotate the eyeball until
the image of an object of interest falls on the fovea.
• Cone vision is called photopic or bright-light vision.
• The number of rods is much larger:
Some 75 to 150 million are distributed over
the retinal surface.
• Figure shows the density of rods and cones for a
cross section of the right eye passing through the
region of emergence of the optic nerve from the
eye.
56
57
• The absence of receptors in this area results in the
so-called blind spot.
• Fig. shows that cones are most dense in the center
of the retina (in the center area of the fovea)
Image Formation in the Eye
• The principal difference between the lens of the eye
and an ordinary optical lens is that the former is
flexible.
• The shape of the lens is controlled by tension in the
fibers of the ciliary body.
• To focus on distant objects, the controlling muscles
cause the lens to be relatively flattened.
• Similarly, these muscles allow the lens to
becomethicker in order to focus on objects near the eye. 24
59
• The distance between the center of the lens and the
approximately 17 mm to about 14
retina called the focal length varies
mm,
from
as
t
he
refractive power of the lens increases from its
minimum to its maximum.
• When the eye focuses on an object farther away the
lens exhibits its lowest refractive power.
• When the eye focuses on a nearby object, the lens is
most strongly refractive.
• For example, the observer is looking at a tree 15 m
high at a distance of 100 m.
• If h is the height in mm of that object in the
retinal image,the geometry of Fig. yields
15/100 = h/17 or h=2.55mm.
60
61
Light and the Electromagnetic
Spectrum
• Sir Isaac Newton discovered that when a beam of
sunlight is passed through a glass prism,
• The emerging beam of light is not white but consists
instead of a continuous spectrum of colors ranging
from violet at one end to red at the other.
The electromagnetic spectrum
62
63
• The electromagnetic spectrum can be expressed in
terms of wavelength, frequency, or energy.
• Wavelength (l)and frequency (n)are related by the
expression
• where c is the speed of light (2.998*108 m s)
• The energy of the electromagnetic spectrum is given by
the expression E = hv
• where h is Plank”s constant
64
A Simple Image Formation Model
• Images by two-dimensional functions of the form f(x, y).
• The value or amplitude of f at spatial coordinates (x, y)
gives the intensity (brightness) of the image at that
point.
• As light is a form of energy, f(x,y) must be non zero and
finite.
65
• The function f(x, y) may be characterized by two
components:
(1)the amount of source illumination incident on the
scene being viewed
(2)the amount of illumination reflected by the objects
in the scene.
• These are called the illumination and reflectance
components and are denoted by i(x, y) and r(x, y),
respectively.
66
• The two functions combine as a product to
form f(x, y):
f(x, y) = i(x, y) r(x, y)
r(x, y) = 0 --- total absorption
1 --- total reflection
• The intensity of a monochrome image f at any
coordinates (x, y) the gray level (l) of the image at
that point.
That is, l = f(x0 , y0 ) L lies in the range
67
68
GRAY SCALE
• The interval [Lmin , Lmax ] is called thegray scale.
• Common practice is to shift this interval numerically to
the interval [0, L-1],
• where L = 0 is considered black and
L = L-1 is considered white on the gray scale.
All intermediate values are shades of gray varying from
black to white.
69
Basic Relationships Between Pixels
• 1. Neighbors of a Pixel :-
A pixel p at coordinates (x, y) has four horizontal and vertical neighbors
whose coordinates are given by (x+1, y), (x-1, y), (x, y+1), (x, y-1)
• This set of pixels, called the 4-neighbors of p, is denoted by
N4(p).
• Each pixel is a unit distance from (x, y), and some of the
neighbors of p lie outside the digital image if (x, y) is on
the border of the image.
70
ND(p) and N8(p)
• The four diagonal neighbors of p have coordinates
(x+1, y+1), (x+1, y-1), (x-1, y+1), (x-1, y-1)
and are denoted by ND(p).
• These points, together with the 4-neighbors, arecalled the 8-
neighbors of p, denoted by N8(p).
• If some of the points in ND(p) and N8(p) fall outside the image if
(x, y) is on the border of theimage.
71
Adjacency, Connectivity,
Regions, and
Boundaries•To establish whether two pixels are connected, it
must be determined if they are neighbors and
•if their gray levels satisfy a specified criterion of
similarity (say, if their gray levels are equal).
•For instance, in a binary image with values 0 and 1,
two pixels may be 4-neighbors,
•but they are said to be connected only if they have
the same value
72
• Let V be the set of gray-level values used todefine
connectivity. In a binary image, V={1} for the connectivity
of pixels with value 1.
• In a grayscale image, for connectivity of pixels with a
range of intensity values of say 32, 64 V typically contains
more elements.
• For example,
• In the adjacency of pixels with a range of possible gray-
level values 0 to 255,
• set V could be any subset of these 256 values.We consider
three types of adjacency:
• We consider three types of adjacency:
(a) 4-adjacency.
Two pixels p and q with values from V are 4-adjacent if q is in the
set N4(p).
(b) 8-adjacency.
Two pixels p and q with values from V are 8-adjacent if q is in the
set N8(p).
(c) m-adjacency (mixed adjacency).
(d) Two pixels p and q with values from V are m-adjacent if
• (i) q is in N4(p), or
• (ii) q is in ND(p) and theset whose values are from V.
73
• A path from pixel p with coordinates (x, y) to
pixel q with coordinates (s, t) is a sequence of
distinct pixels with coordinates
• where (xϬ’ y0) = (x, y) and (xŶ’ yn) = (s, t),
(xi’ yi) and (xi-ϭ’ yi-1) pixels and are adjacent for ϭ ч i ч
Ŷ. IŶ this Đase, Ŷ is the length of the path.
• If (xϬ’ y0) = (xŶ’ yn) the path is a closedpath.
74
.
•Two pixels p and q are said to be connected in S if
there exists a path between them consisting entirely
of pixels in S.
•For any pixel p in S, the set of pixels that are
connected to it in S is called a connected component
of S.
75
76
Relations, equivalence
• A binary relation R on a set A is a set of pairs of
elements from A. If the pair (a, b) is in R, the notation
used is aRb ( ie a is related to b)
• Ex:- the set of points A = { p1,p2,p3,p4} arranged as
P1p2 P3
p4
77
• In this case R is set of pairs of points from A that are 4-
connected that is R = {(p1,p2), (p2,p1), (p1,p3),
(p3,p1)} .
thus p1 is related to p2 and p1 is related to p3 and vice
versa but p4 is not related to any other point under
the relation .
78
Reflective - Symmetric - Transitive
• Reflective
if for each a in A, aRb
• Symmetric
if for each a and b in A, aRb implies bRa
• Transitive
if for a, b and c in A, aRb and bRc implies aRc
A relation satisfying the three properties is called an
equivalence relation.
Distance Measures
• For pixels p, q,and z,with coordinates (x, y), (s, t),and
(u, v) respectively, D is a distance function or metric if
(a) D(p, q)D;p, if p = q ),
(b) D(p, q) = D(q, p)
The Euclidean distance between p and q is defined as
79
.
• The D4 distance (also called city-block distance)
between p and q is defined as
D4 (p, q) = | x - s | + | y – t |
•For example, the pixels with D4 distance ч Ϯ
from (x, y) (the center point) form the
following contours of constant distance:
• The pixels with D4=1 are the 4-neighbors of (x, y).
80
.
•The D8 distance (also called chess board
distance)between p and q is defined as
D8 (p, q) = max ( | x - s | , | y – t | )
•For example, the pixels with D8 distance ≤ 2 froŵ ( x,
y) (the center point) form the following contours of
constant distance:
• The pixels with D8=1 are the 8-neighbors of (x, y).
81
82
• The Dm distance between two points is defined as the
shortest m-path between the points.
• In this case, the distance between two pixels will depend
on the values of the pixels along the path, as well as the
values of their neighbors.
• For instance, consider the following arrangement of pixels
and assume that p, p2 and p4 have value 1 and that p1
and p3 can have a value of 0 or 1:
p3 p4
p2P1
p
83
.
• If only connectivity of pixels valued 1 is allowed, and
p1 and p3 are 0 then the m distance between p and
p4 is 2.
• If either p1 or p3 is 1, the distance is 3
• If both pi and p2 are 1, the distance is 4

More Related Content

What's hot (20)

PPT
Chapter 5 Image Processing: Fourier Transformation
Varun Ojha
 
ODP
image compression ppt
Shivangi Saxena
 
PPTX
Unit3 dip
Imran Khan
 
PPTX
Digital image processing
kavitha muneeshwaran
 
PPTX
Introduction to Image Compression
Kalyan Acharjya
 
PPTX
Digital Image restoration
Md Shabir Alam
 
PPTX
Color image processing Presentation
Revanth Chimmani
 
PPT
Interpixel redundancy
Naveen Kumar
 
PPT
Chapter10 image segmentation
asodariyabhavesh
 
PPTX
Chapter 6 color image processing
asodariyabhavesh
 
PPT
Spatial filtering
shabanam tamboli
 
PPTX
Chapter 8 image compression
asodariyabhavesh
 
PPTX
Image compression standards
kirupasuchi1996
 
PPSX
Edge Detection and Segmentation
Dr. A. B. Shinde
 
PPTX
Module 31
UllasSS1
 
PPTX
Digital Image Processing
lalithambiga kamaraj
 
PPTX
Color Image Processing
kiruthiammu
 
PPT
Multimedia color in image and video
Mazin Alwaaly
 
PPT
Spatial domain and filtering
University of Potsdam
 
Chapter 5 Image Processing: Fourier Transformation
Varun Ojha
 
image compression ppt
Shivangi Saxena
 
Unit3 dip
Imran Khan
 
Digital image processing
kavitha muneeshwaran
 
Introduction to Image Compression
Kalyan Acharjya
 
Digital Image restoration
Md Shabir Alam
 
Color image processing Presentation
Revanth Chimmani
 
Interpixel redundancy
Naveen Kumar
 
Chapter10 image segmentation
asodariyabhavesh
 
Chapter 6 color image processing
asodariyabhavesh
 
Spatial filtering
shabanam tamboli
 
Chapter 8 image compression
asodariyabhavesh
 
Image compression standards
kirupasuchi1996
 
Edge Detection and Segmentation
Dr. A. B. Shinde
 
Module 31
UllasSS1
 
Digital Image Processing
lalithambiga kamaraj
 
Color Image Processing
kiruthiammu
 
Multimedia color in image and video
Mazin Alwaaly
 
Spatial domain and filtering
University of Potsdam
 

Similar to DIGITAL IMAGE PROCESSING - Visual perception - DAY 2 (20)

PDF
DIGITAL IMAGE PROCESSING - LECTURE NOTES
Ezhilya venkat
 
PPT
digital image processing cresent ppt slides
ssuserf35ac9
 
PPT
digitalimagefundamentals.ppt
University of Sindh
 
PPT
DIGITAL IMAGE FUNDAS.ppt
Hari M
 
PDF
06 color image processing
Jaiverdhan .
 
PPT
Color image processing.ppt
Papajuvvanapudi
 
PPTX
Lect 06
Moe Moe Myint
 
PDF
Displays and color system in computer graphics(Computer graphics tutorials)
Daroko blog(www.professionalbloggertricks.com)
 
PPTX
Colormodels
arunaranishanmugaman
 
PPT
L8 Human Computer Interaction - Lecture 08 (3).ppt
UsamaKhan987353
 
PDF
Video Compression Part 1 Video Principles
Dr. Mohieddin Moradi
 
PDF
Images and Information
adil raja
 
PPTX
Elements of Visual Perceptions Structure
Harmanjot5678
 
PPTX
Color image processing
Madhuri Sachane
 
PDF
Color theorykareemebrahim
Kareem .
 
PDF
PPT s03-machine vision-s2
Binus Online Learning
 
PPT
Digital Image Processing: Image Colors
Basra University, Iraq
 
PDF
VIDEO CODECS
Vinayagam Mariappan
 
PDF
The Importance of Terminology and sRGB Uncertainty - Notes - 0.4
Thomas Mansencal
 
PPT
Image formation
Syed Zaid Irshad
 
DIGITAL IMAGE PROCESSING - LECTURE NOTES
Ezhilya venkat
 
digital image processing cresent ppt slides
ssuserf35ac9
 
digitalimagefundamentals.ppt
University of Sindh
 
DIGITAL IMAGE FUNDAS.ppt
Hari M
 
06 color image processing
Jaiverdhan .
 
Color image processing.ppt
Papajuvvanapudi
 
Lect 06
Moe Moe Myint
 
Displays and color system in computer graphics(Computer graphics tutorials)
Daroko blog(www.professionalbloggertricks.com)
 
L8 Human Computer Interaction - Lecture 08 (3).ppt
UsamaKhan987353
 
Video Compression Part 1 Video Principles
Dr. Mohieddin Moradi
 
Images and Information
adil raja
 
Elements of Visual Perceptions Structure
Harmanjot5678
 
Color image processing
Madhuri Sachane
 
Color theorykareemebrahim
Kareem .
 
PPT s03-machine vision-s2
Binus Online Learning
 
Digital Image Processing: Image Colors
Basra University, Iraq
 
VIDEO CODECS
Vinayagam Mariappan
 
The Importance of Terminology and sRGB Uncertainty - Notes - 0.4
Thomas Mansencal
 
Image formation
Syed Zaid Irshad
 
Ad

More from vijayanand Kandaswamy (11)

PDF
Convolution linear and circular using z transform day 5
vijayanand Kandaswamy
 
PDF
Difference equation using z transform day 4
vijayanand Kandaswamy
 
PDF
Inverse z tranform day 3
vijayanand Kandaswamy
 
PDF
Properties of z transform day 2
vijayanand Kandaswamy
 
PDF
Z transform Day 1
vijayanand Kandaswamy
 
PDF
DIGITAL IMAGE PROCESSING - Day 5 Applications of DIP
vijayanand Kandaswamy
 
PDF
DIGITAL IMAGE PROCESSING - Day 4 Image Transform
vijayanand Kandaswamy
 
PDF
DIGITAL SIGNAL PROCESSING - Day 3 colour Image processing
vijayanand Kandaswamy
 
PDF
Introduction to DIGITAL IMAGE PROCESSING - DAY 1
vijayanand Kandaswamy
 
PPT
Changing world of work
vijayanand Kandaswamy
 
Convolution linear and circular using z transform day 5
vijayanand Kandaswamy
 
Difference equation using z transform day 4
vijayanand Kandaswamy
 
Inverse z tranform day 3
vijayanand Kandaswamy
 
Properties of z transform day 2
vijayanand Kandaswamy
 
Z transform Day 1
vijayanand Kandaswamy
 
DIGITAL IMAGE PROCESSING - Day 5 Applications of DIP
vijayanand Kandaswamy
 
DIGITAL IMAGE PROCESSING - Day 4 Image Transform
vijayanand Kandaswamy
 
DIGITAL SIGNAL PROCESSING - Day 3 colour Image processing
vijayanand Kandaswamy
 
Introduction to DIGITAL IMAGE PROCESSING - DAY 1
vijayanand Kandaswamy
 
Changing world of work
vijayanand Kandaswamy
 
Ad

Recently uploaded (20)

PPTX
Lecture 1 Shell and Tube Heat exchanger-1.pptx
mailforillegalwork
 
PDF
GTU Civil Engineering All Semester Syllabus.pdf
Vimal Bhojani
 
DOCX
CS-802 (A) BDH Lab manual IPS Academy Indore
thegodhimself05
 
PDF
Basic_Concepts_in_Clinical_Biochemistry_2018كيمياء_عملي.pdf
AdelLoin
 
PPTX
Heart Bleed Bug - A case study (Course: Cryptography and Network Security)
Adri Jovin
 
PPTX
265587293-NFPA 101 Life safety code-PPT-1.pptx
chandermwason
 
PPTX
Green Building & Energy Conservation ppt
Sagar Sarangi
 
PDF
AI TECHNIQUES FOR IDENTIFYING ALTERATIONS IN THE HUMAN GUT MICROBIOME IN MULT...
vidyalalltv1
 
PPTX
Solar Thermal Energy System Seminar.pptx
Gpc Purapuza
 
PPT
Carmon_Remote Sensing GIS by Mahesh kumar
DhananjayM6
 
PPTX
GitOps_Without_K8s_Training_detailed git repository
DanialHabibi2
 
PDF
Water Industry Process Automation & Control Monthly July 2025
Water Industry Process Automation & Control
 
PDF
International Journal of Information Technology Convergence and services (IJI...
ijitcsjournal4
 
PPTX
Introduction to Design of Machine Elements
PradeepKumarS27
 
PPTX
Arduino Based Gas Leakage Detector Project
CircuitDigest
 
PDF
Set Relation Function Practice session 24.05.2025.pdf
DrStephenStrange4
 
PPTX
What is Shot Peening | Shot Peening is a Surface Treatment Process
Vibra Finish
 
PPTX
Server Side Web Development Unit 1 of Nodejs.pptx
sneha852132
 
PPTX
Depth First Search Algorithm in 🧠 DFS in Artificial Intelligence (AI)
rafeeqshaik212002
 
PDF
Reasons for the succes of MENARD PRESSUREMETER.pdf
majdiamz
 
Lecture 1 Shell and Tube Heat exchanger-1.pptx
mailforillegalwork
 
GTU Civil Engineering All Semester Syllabus.pdf
Vimal Bhojani
 
CS-802 (A) BDH Lab manual IPS Academy Indore
thegodhimself05
 
Basic_Concepts_in_Clinical_Biochemistry_2018كيمياء_عملي.pdf
AdelLoin
 
Heart Bleed Bug - A case study (Course: Cryptography and Network Security)
Adri Jovin
 
265587293-NFPA 101 Life safety code-PPT-1.pptx
chandermwason
 
Green Building & Energy Conservation ppt
Sagar Sarangi
 
AI TECHNIQUES FOR IDENTIFYING ALTERATIONS IN THE HUMAN GUT MICROBIOME IN MULT...
vidyalalltv1
 
Solar Thermal Energy System Seminar.pptx
Gpc Purapuza
 
Carmon_Remote Sensing GIS by Mahesh kumar
DhananjayM6
 
GitOps_Without_K8s_Training_detailed git repository
DanialHabibi2
 
Water Industry Process Automation & Control Monthly July 2025
Water Industry Process Automation & Control
 
International Journal of Information Technology Convergence and services (IJI...
ijitcsjournal4
 
Introduction to Design of Machine Elements
PradeepKumarS27
 
Arduino Based Gas Leakage Detector Project
CircuitDigest
 
Set Relation Function Practice session 24.05.2025.pdf
DrStephenStrange4
 
What is Shot Peening | Shot Peening is a Surface Treatment Process
Vibra Finish
 
Server Side Web Development Unit 1 of Nodejs.pptx
sneha852132
 
Depth First Search Algorithm in 🧠 DFS in Artificial Intelligence (AI)
rafeeqshaik212002
 
Reasons for the succes of MENARD PRESSUREMETER.pdf
majdiamz
 

DIGITAL IMAGE PROCESSING - Visual perception - DAY 2

  • 1. Digital Image Processing DAY 2- 22/6/2020 TODAYS TOPICS: • Elements of Visual Perception • Image Sensing and Acquisition • Image Sampling and Quantization • Relationships between pixels
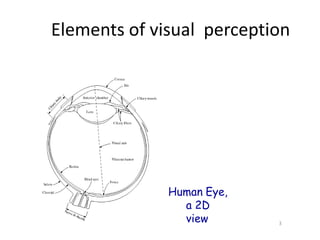
  • 2. Elements of visual perception Human Eye, a 3D view 2
  • 3. Elements of visual perception Human Eye, a 2D view 3
  • 4. 1. A human eye, nearly a sphere with an average diameter of approximately 20 mm, is enclosed by three membranes: cornea and sclera, choroid and retina. 2. The Cornea is a tough & transparent tissue, covering the anterior surface of the eye. 3. The Sclera is an opaque membrane, enclosing the remainder of the eye globe. 4. The Choroid contains blood vessels to supply nutrients to the eye. It is heavily pigmented stopping external light and is divided into ciliary body and iris. 4 Elements of visual perception
  • 5. 5. Center opening of iris, known as pupil, is about 2-8 mm in diameter. The front of iris is filled with visible pigments and its back with black pigments. 6. The lens, layers of fiberous cells, is having 60% to 70% H2O, 6% fat and rest protein. It is lightly yellowishly pigmented. 7. The retina is rich with cones and rods which are light receptors. 8. The cones, 6 to 7 millions in count are primarily located in the center of retina, known as fovea. They are responsible for photopic (bright light) vision-colour vision. 5 Elements of visual perception
  • 6. 9. The rods, 75 to 150 millions in count, are distributed all over the retina. They are responsible for scotopic (dim light) vision- contrast. 10. An individual cone is connected to an individual optical nerve and hence accounts for perception of finer details. 11. Group of rods is connected to group of optical nerves and hence accounts for overall perception. 12. The blind spot in the eye is entirely deprived of the light receptors, rods and cones. 6 Elements of visual perception
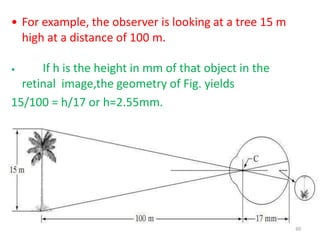
  • 7. Image Formation in Human Eye H h D F The distance between the center of the lens and the retina, called the focal length, varies from approximately 17 mm to about 14 mm. The height, h of an object of height, H perceived by an observer, having a focal length, F, from a distance, D is given by the principle of similar triangle. D F 7   D  H  h  h   H F
  • 8. Brightness Adaptation of Human Eye Subjective brightness is a logarithmic function of incident light intensity. 8
  • 9. Brightness Adaptation of Human Eye 9 The brightness adaptation is a phenomenon which describes the ability of the human eye in simultaneously discriminating distinct intensity levels. The brightness adaptation level is the current sensitivity level of the visual system for any given set of conditions. The simultaneous contrast is a phenomenon which describes that the perceived brightness of a region in an image is not a simple function of its intensity rather it depends on the intensities of neighboring regions.
  • 10. Brightness Adaptation of Human Eye The match bands are the adjacently spaced rectangular stripes of constant intensities to demonstrate the phenomenon of simultaneous contrast. Examples of simultaneous contrast. All the inner squares have the same 10 intensity, but theyprogressively darke r appear as the background becomes lighter.
  • 11. Illusion of a white square Illusion of a white circle Illusion of a white circle 11
  • 12. Illusion of loss of parallelism & co- planarity 12
  • 13. A “color” of a light is determined by its wavelength. Any object absorbs and reflects light energy wavelengths. 13 at particula r The perceived color of an object is determined by the wavelength of the light reflected from it. The object that absorbs the light energy at all wavelength “looks” black to the perceiver while the object that reflects the light energy at all wavelengths “looks” white to the perceiver. Color Fundamentals
  • 14. Achromatic light – Black and White (and their shades, gray shades). Chromatic light – Colors (and their shades). Three basic quantities are used to describe the quality of a chromatic light source: radiance, luminance, and brightness. Radiance is the total amount of energy that flows from the light source, and it is usually measured in watts (W). Luminance, measured in lumens (lm), gives a measure of the amount of energy an observer perceives from a light source. Brightness is a subjective descriptor that is practically impossible to measure. 14 Color Fundamentals
  • 15. Cones are the sensors in the eye responsible for color vision. Approximately 65% of all cones are sensitive to red light, 33% are sensitive to green light, and only about 2% are sensitive to blue. Due to these absorption characteristics of the human eye, colors arc seen as variable combinations of the so-called primary colors red (R), green (G), and blue (B). The characteristics generally used to distinguish one color from another are brightness, hue, and saturation. Brightness embodies the chromatic notion of intensity. Hue is an attribute associated with the dominant wavelength in a mixture of light waves. Saturation refers to the relative purity or the amount of white light mixed with a hue. Hue and saturation taken together are called Chromaticity. 15 Color Fundamentals
  • 16. The amounts of red, green, and blue needed to form any particular color are called the tristimidus values and are denoted, X, Y, and Z, respectively. A color is then specified by its trichromatic coefficients, defined as Color Fundamentals 16
  • 17. A color model (also called color space or color system) is a specification of a coordinate system and a subspace within that system where each color is represented by a single point. The RGB color model: In the RGB model, each color appears in its primary spectral components of red, green, and blue. This model is based on a Cartesian coordinate system. The color subspace is the cube in which RGB values are at three corners; cyan, magenta, and yellow are at three other corners; black is at the origin; and white is at the corner farthest from the origin. The gray scale (points of equal RGB values) extends from black to white along the diagonal line joining these two points. The different colors are points on or inside the cube, and are defined by vectors extending from the origin. All values of R, G. and B are assumed to be in the range [0, 1]. 17 Color Models
  • 18. Color Models The RGB color model 18
  • 19. Merits of RGB color model: (i) Well suited for hardware implementations and (ii) Matches nicely with the fact that the human eye is strongly perceptive to red, green, and blue primary colors. Demerits of RGB color model: Not well suited for describing colors in terms that are practical for human interpretation. The HSI color model: A color perceived by a human eye is described by its Hue, Saturation and Intensity. HSI (Hue, Saturation and Intensity) color model thus decouples the intensity component from the color-carrying information (hue and saturation). 19 Color Models
  • 20. Forming the HSI color model from the RGB color model 23 The HSI coordinate system and corresponding color subspace is obtained as follows: The RGB color cube rotated such that the cube is standing on its black vertex with the white vertex directly above and the cyan, blue, green, red, yellow and magenta vertices forming a hexagon as shown below. The dot is an arbitrary color point. The angle from the red axis gives the hue, and the length of the vector is the saturation. The intensity of all colors in any of these planes is given by the position of the plane on the vertical intensity axis. Color Models
  • 21. Color Models The HSI color model 21
  • 22. Principle of Video Camera: Vidicon Vidicon Camera Tube – Cross Sectional View 22
  • 23. Construction The Vidicon came into general use in the early 50’s and gained immediate popularity because of its small size and ease of operation. It functions on the principle of photoconductivity, where the resistance of the target material shows a marked decrease when exposed to light. The target consists of a thin photo conductive layer of either selenium or anti-mony compounds. This is deposited on a transparent conducting film, coated on the inner surface of the face plate. This conductive coating is known as signal electrode or plate. Image side of the photolayer, which is in contact with the signal electrode, is connected to DC supply through the load resistance RL. 23 Principle of Video Camera: Vidicon
  • 24. The beam that emerges from the electron gun is focused on surface of the photo conductive layer by combined action of uniform magnetic field of an external coil. The electrostatic field of grid No 3. Grid No. 4 provides a uniform decelerating field between itself, and the photo conductive layer, so that the electron beam approaches the layer with a low velocity to prevent any secondary emission. Deflection of the beam, for scanning the target, is obtained by vertical and horizontal deflecting coils, placed around the tube. 24 Principle of Video Camera: Vidicon
  • 25. Principle of Video Camera: Vidicon Circuit for output current for Vidicon Camera 25
  • 26. Charge Image The photolayer has a thickness of about 0.0001 cm, and behaves like an insulator with a resistance of approximately 20 M when in dark. When bright light falls on any area of the photoconductive coating, resistance across the thickness of that portion gets reduces to about 2 M. Thus, with an image on the target, each point on the gun side of the photolayer assumes a certain potential with respect to the DC supply, depending on its resistance to the signal plate. A pattern of positive potentials appears, on the gun side of the photolayer, producing a charge image, that corresponds to the incident optical image. 26 Principle of Video Camera: Vidicon
  • 27. Another way of explaining the development of ‘charge image’ on the photolayer is to consider it as an array of individual target elements, each consisting of a capacitor paralleled with a light dependent resistor. One end of these target elements is connected to the signal electrode and the other end is unterminated facing the beam. Storage Action Each element of the photocoating is scanned at intervals equal to the frame time. This results in storage action and the net change in resistance, at any point or element on the photoconductive layer, depends on the time, which elapses between two successive scannings and the intensity of incident light. Since storage time for all points on the target plate is same, the net change in resistance of all elementary areas is proportional to light intensity variations in the scene being televised. 27 Principle of Video Camera: Vidicon
  • 28. Signal Current As the beam scans the target plate, it encounters different positive potentials on the side of the photolayer that faces the gun. Sufficient number of electrons from the beam is then deposited on the photolayer surface to reduce the potential of each element towards the zero cathode potential. The remaining electrons, not deposited on the target, return back and are not utilized in the vidicon. The sudden change in potential on each element while the beam scans, causes a current flow in the signal electrode circuit producing a varying voltage across the load resistance RL. The amplitude of current and the consequent output voltage across RL are directly proportional to the light intensity variations on the scene. 28 Principle of Video Camera: Vidicon
  • 29. Principle of Still Camera: Charge Coupled Devices: A MOS capacitor as a light sensitive device 1 SiO2 n- channel p- substrate Polysilico n Gate Polysilicon 3 Gate Polysilicon  2 Gate Potential well made by depletion layer Photon s Photonicall y liberated electrons 29
  • 30. Principle of Still Camera: Charge Coupled Devices: A MOS capacitor as a light sensitive device 1 2 3 1 2 3 1 2 3 p-substrate p-substrate SiO2 n- channel Polysilico n Gate 30
  • 31. Charge Coupled Devices (CCD) The operation of solid state image scanners is based on the functioning of charge coupled devices (CCDs) which is a new concept in metal- oxide-semiconductor (MOS) circuitry. The CCD may be thought of to be a shift register formed by a string of very closely spaced MOS capacitors. It can store and transfer analog charge signals— either electrons or holes—that may be introduced electrically or optically. Construction The chip consists of a p-type substrate, the one side of which is oxidized to form a film of silicon dioxide, which is an insulator. Then by photolithographic processes, similar to those used in miniature integrated circuits an array of metal electrodes, known as gates, are deposited on the insulator film. This results in the creation of a very large number of tiny MOS capacitors on the entire surface of the chip. 31 Principle of Still Camera: Charge Coupled Devices:
  • 32. Principle of Operation The application of small positive potentials to the gate electrodes results in the development of depletion regions just below them. These are called potential wells. The depth of each well (depletion region) varies with the magnitude of the applied potential. The gate electrodes operate in groups of three, with every third electrode connected to a common conductor. The spots under them serve as light sensitive elements. When any image is focused onto the silicon chip, electrons are generated within it, but very close to the surface. The number of electrons depends on the intensity of incident light. Once produced they collect in the nearby potential wells. As a result the pattern of collected charges represents the optical image. 32 Principle of Still Camera: Charge Coupled Devices:
  • 33. Principle of Operation Charge Transfer The charge of one element is transferred to another along the surface of the silicon chip by applying a more positive voltage to the adjacent electrode or gate, while reducing the voltage on it. The manner in which the transition takes place from potential wells is illustrated in the figure. This is achieved with the influence of continuing clock pulses. The clocking sequence continues and the charge finally reaches the end of the array where it is collected to form the signal current. 33 Principle of Still Camera: Charge Coupled Devices:
  • 34. Principle of Still Camera: Charge Coupled Devices: CCD Readout 34
  • 35. Principle of Operation CCD Readout The two-dimensional array of potential wells is generally referred to as parallel register. A one-dimensional CCD array acts as a serial register and plays an important role during the CCD readout operation. A programmed sequence of changing gate potentials causes all charge packets stored in the parallel register to be shifted in parallel one row toward the serial register. The charge stored in the top row is shifted from the parallel register to the serial register. Once in the serial register, the charge packets are individually shifted toward the output amplifier. 35 Principle of Still Camera: Charge Coupled Devices:
  • 36. An (monochrome or black & white) image is a 2-D light- intensity function denoted as f(x,y). The value or amplitude, f of the function at any spatial coordinates (x,y) is the intensity of the image at that point. As light is energy, this value is non-zero and finite i.e., 0  f   f(x,y) has two components: (i) i(x,y), the amount of light incident on the scene being viewed and (ii) r(x,y), the reflectance relating to the amount of light reflected by the objects in the scene i.e., f(x,y) = i(x,y) r(x,y) where 0  i   & 0  r  1 36 (Monochrome) Image model
  • 37. For a monochrome image the intensity of the image, f at any coordinates (x,y) is termed as gray level, l of the image at that point, i.e., Lmin  l  Lmax  0  l  L, 0  black & L  white Intermediate values  shades of gray or gray shades 37 (Monochrome) Image model
  • 38. To obtain a digital image, f(x,y) must be digitized both in space and amplitude. -digitization of spatial coordinates - image sampling -digitization of amplitude - gray-level quantization The image sampling is viewed as partitioning an image plane into a grid with coordinates of center of each grid from an integer set ZZ. The (gray-level) quantization is viewed as assigning a value from a real number set R as gray level to each grid. Hence resulting digital image is a MN matrix in which each matrix element represents a image element or picture element or pixel and its value represents the gray level of that pixel. 38 Sampling and quantization
  • 39. Sampling and quantization 39       f(0,N1)          f f(0,0) f(1,0)  f(0,1) f(1,1)  f(0,2) f(1,2)                 (M1,0)f(M1,1)f(M1,2)    f(M1,N1)  f(1,N1) 
  • 40. The number of samples or pixels, MN required to approximate an image is known as spatial resolution of the image. The low or insufficient spatial resolution results in pixel replication causing a checkerboard effect. Sampling and quantization Effect of spatial resolution – checkerboard effect 40
  • 41. The number of discrete gray levels, G allowed for a pixel in a digital image is known as gray-level resolution of the image. The low or insufficient gray-level resolution results in ridge-like structures in smooth areas causing false contouring. 41 Sampling and quantization
  • 42. Effect of gray-level resolution – false contouring: Original 8-bit image 42
  • 43. Effect of gray-level resolution – false contouring: Original 4-bit image 43
  • 44. Effect of gray-level resolution – false contouring: Original 2-bit image 44
  • 45. Effect of gray-level resolution – false contouring: Original 1-bit image, binary image 45
  • 46.
  • 48. 48 • The eye is nearly a sphere, with an average diameter of approximately 20mm. • Three membranes enclose the eye: • The cornea and sclera outer cover the choroid the retina.
  • 49. 49 Cornea • The cornea is a tough, transparent tissue that covers the anterior surface of the eye. • Continuous with the cornea,the sclera is an opaque membrane that encloses the remainder of the optic globe.
  • 50. 50 Choroid • The choroid lies directly below the sclera. • This membrane contains a net- work of blood vessels that serve as the major source of nutrition to the eye. • The choroid coat is heavily pigmented and hence helps to reduce the amount of extraneous light entering the eye and the backscatter within the optical globe.
  • 51. 51 • At its anterior extreme, the choroid is divided into the ciliary body and the iris diaphragm. • The latter contracts or expands to control the amount of light that enters the eye • Thefront of the iris contains the visible pigment of the eye, whereas the back contains a black pigment.
  • 52. 52 • The lens is made up of concentric layers of fibrous cells and is suspended by fibers that attach to the ciliary body. • It contains 60 to 70% water, about 6% fat, and more protein than any other tissue in the eye.
  • 53. 53 Retina • The innermost membrane of the eye is the retina, which lines the Inside of the ǁall’s entire posterior portion. • When the eye is properly focused, light from an object outside the eye is imaged on the retina. • Pattern vision is afforded by the distribution of discrete light receptors over the surface of the retina.
  • 54. 54 • There are two classes of receptors: cones and rods. • The cones in each eye number between 6 and 7 million. • They are located primarily in the central portion of the retina, called the fovea, and are highly sensitive to color.
  • 55. 55 • Muscles controlling the eye rotate the eyeball until the image of an object of interest falls on the fovea. • Cone vision is called photopic or bright-light vision. • The number of rods is much larger: Some 75 to 150 million are distributed over the retinal surface.
  • 56. • Figure shows the density of rods and cones for a cross section of the right eye passing through the region of emergence of the optic nerve from the eye. 56
  • 57. 57 • The absence of receptors in this area results in the so-called blind spot. • Fig. shows that cones are most dense in the center of the retina (in the center area of the fovea)
  • 58. Image Formation in the Eye • The principal difference between the lens of the eye and an ordinary optical lens is that the former is flexible. • The shape of the lens is controlled by tension in the fibers of the ciliary body. • To focus on distant objects, the controlling muscles cause the lens to be relatively flattened. • Similarly, these muscles allow the lens to becomethicker in order to focus on objects near the eye. 24
  • 59. 59 • The distance between the center of the lens and the approximately 17 mm to about 14 retina called the focal length varies mm, from as t he refractive power of the lens increases from its minimum to its maximum. • When the eye focuses on an object farther away the lens exhibits its lowest refractive power. • When the eye focuses on a nearby object, the lens is most strongly refractive.
  • 60. • For example, the observer is looking at a tree 15 m high at a distance of 100 m. • If h is the height in mm of that object in the retinal image,the geometry of Fig. yields 15/100 = h/17 or h=2.55mm. 60
  • 61. 61 Light and the Electromagnetic Spectrum • Sir Isaac Newton discovered that when a beam of sunlight is passed through a glass prism, • The emerging beam of light is not white but consists instead of a continuous spectrum of colors ranging from violet at one end to red at the other.
  • 63. 63 • The electromagnetic spectrum can be expressed in terms of wavelength, frequency, or energy. • Wavelength (l)and frequency (n)are related by the expression • where c is the speed of light (2.998*108 m s) • The energy of the electromagnetic spectrum is given by the expression E = hv • where h is Plank”s constant
  • 64. 64 A Simple Image Formation Model • Images by two-dimensional functions of the form f(x, y). • The value or amplitude of f at spatial coordinates (x, y) gives the intensity (brightness) of the image at that point. • As light is a form of energy, f(x,y) must be non zero and finite.
  • 65. 65 • The function f(x, y) may be characterized by two components: (1)the amount of source illumination incident on the scene being viewed (2)the amount of illumination reflected by the objects in the scene. • These are called the illumination and reflectance components and are denoted by i(x, y) and r(x, y), respectively.
  • 66. 66 • The two functions combine as a product to form f(x, y): f(x, y) = i(x, y) r(x, y) r(x, y) = 0 --- total absorption 1 --- total reflection
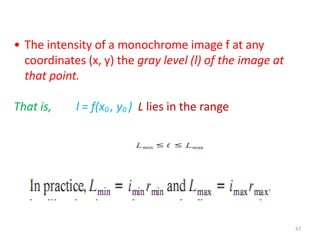
  • 67. • The intensity of a monochrome image f at any coordinates (x, y) the gray level (l) of the image at that point. That is, l = f(x0 , y0 ) L lies in the range 67
  • 68. 68 GRAY SCALE • The interval [Lmin , Lmax ] is called thegray scale. • Common practice is to shift this interval numerically to the interval [0, L-1], • where L = 0 is considered black and L = L-1 is considered white on the gray scale. All intermediate values are shades of gray varying from black to white.
  • 69. 69 Basic Relationships Between Pixels • 1. Neighbors of a Pixel :- A pixel p at coordinates (x, y) has four horizontal and vertical neighbors whose coordinates are given by (x+1, y), (x-1, y), (x, y+1), (x, y-1) • This set of pixels, called the 4-neighbors of p, is denoted by N4(p). • Each pixel is a unit distance from (x, y), and some of the neighbors of p lie outside the digital image if (x, y) is on the border of the image.
  • 70. 70 ND(p) and N8(p) • The four diagonal neighbors of p have coordinates (x+1, y+1), (x+1, y-1), (x-1, y+1), (x-1, y-1) and are denoted by ND(p). • These points, together with the 4-neighbors, arecalled the 8- neighbors of p, denoted by N8(p). • If some of the points in ND(p) and N8(p) fall outside the image if (x, y) is on the border of theimage.
  • 71. 71 Adjacency, Connectivity, Regions, and Boundaries•To establish whether two pixels are connected, it must be determined if they are neighbors and •if their gray levels satisfy a specified criterion of similarity (say, if their gray levels are equal). •For instance, in a binary image with values 0 and 1, two pixels may be 4-neighbors, •but they are said to be connected only if they have the same value
  • 72. 72 • Let V be the set of gray-level values used todefine connectivity. In a binary image, V={1} for the connectivity of pixels with value 1. • In a grayscale image, for connectivity of pixels with a range of intensity values of say 32, 64 V typically contains more elements. • For example, • In the adjacency of pixels with a range of possible gray- level values 0 to 255, • set V could be any subset of these 256 values.We consider three types of adjacency:
  • 73. • We consider three types of adjacency: (a) 4-adjacency. Two pixels p and q with values from V are 4-adjacent if q is in the set N4(p). (b) 8-adjacency. Two pixels p and q with values from V are 8-adjacent if q is in the set N8(p). (c) m-adjacency (mixed adjacency). (d) Two pixels p and q with values from V are m-adjacent if • (i) q is in N4(p), or • (ii) q is in ND(p) and theset whose values are from V. 73
  • 74. • A path from pixel p with coordinates (x, y) to pixel q with coordinates (s, t) is a sequence of distinct pixels with coordinates • where (xϬ’ y0) = (x, y) and (xŶ’ yn) = (s, t), (xi’ yi) and (xi-ϭ’ yi-1) pixels and are adjacent for ϭ ч i ч Ŷ. IŶ this Đase, Ŷ is the length of the path. • If (xϬ’ y0) = (xŶ’ yn) the path is a closedpath. 74
  • 75. . •Two pixels p and q are said to be connected in S if there exists a path between them consisting entirely of pixels in S. •For any pixel p in S, the set of pixels that are connected to it in S is called a connected component of S. 75
  • 76. 76 Relations, equivalence • A binary relation R on a set A is a set of pairs of elements from A. If the pair (a, b) is in R, the notation used is aRb ( ie a is related to b) • Ex:- the set of points A = { p1,p2,p3,p4} arranged as P1p2 P3 p4
  • 77. 77 • In this case R is set of pairs of points from A that are 4- connected that is R = {(p1,p2), (p2,p1), (p1,p3), (p3,p1)} . thus p1 is related to p2 and p1 is related to p3 and vice versa but p4 is not related to any other point under the relation .
  • 78. 78 Reflective - Symmetric - Transitive • Reflective if for each a in A, aRb • Symmetric if for each a and b in A, aRb implies bRa • Transitive if for a, b and c in A, aRb and bRc implies aRc A relation satisfying the three properties is called an equivalence relation.
  • 79. Distance Measures • For pixels p, q,and z,with coordinates (x, y), (s, t),and (u, v) respectively, D is a distance function or metric if (a) D(p, q)D;p, if p = q ), (b) D(p, q) = D(q, p) The Euclidean distance between p and q is defined as 79
  • 80. . • The D4 distance (also called city-block distance) between p and q is defined as D4 (p, q) = | x - s | + | y – t | •For example, the pixels with D4 distance ч Ϯ from (x, y) (the center point) form the following contours of constant distance: • The pixels with D4=1 are the 4-neighbors of (x, y). 80
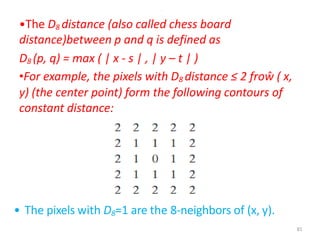
  • 81. . •The D8 distance (also called chess board distance)between p and q is defined as D8 (p, q) = max ( | x - s | , | y – t | ) •For example, the pixels with D8 distance ≤ 2 froŵ ( x, y) (the center point) form the following contours of constant distance: • The pixels with D8=1 are the 8-neighbors of (x, y). 81
  • 82. 82 • The Dm distance between two points is defined as the shortest m-path between the points. • In this case, the distance between two pixels will depend on the values of the pixels along the path, as well as the values of their neighbors. • For instance, consider the following arrangement of pixels and assume that p, p2 and p4 have value 1 and that p1 and p3 can have a value of 0 or 1: p3 p4 p2P1 p
  • 83. 83 . • If only connectivity of pixels valued 1 is allowed, and p1 and p3 are 0 then the m distance between p and p4 is 2. • If either p1 or p3 is 1, the distance is 3 • If both pi and p2 are 1, the distance is 4