


![DSPLAB
Dept ECE Page 9
n=0:1:N;
x=sin(n);
stem(x);
xlabel('time');
ylabel('amplitude');
title('sinusoidal sequence');
% unit ramp signals%
clc;
clear all;
close all;
disp('unit ramp signals');
N=input('enter the no of samples');
n=0:1:N;
x=n;
stem(x);
xlabel('time');
ylabel('amplitude');
title('unit ramp sequence');
% unit impulse signal %
clc;
clear all;
close all;
disp('unit impuse signal');
N=input ('enter the no of samples');
n=-N:1:N;
x=[zeros(1,N) 1 zeros(1,N)];
stem(n,x);
xlabel('time');
ylabel('amplitude');
tittle('impulse sequence');
% exponentialsignals%
clc;
clear all;
close all;
disp('exponential signals');
N=input('enter the no of samples');
n=0:1:N;
n=-N:1:N;
a=0.5;
x=a.^n;
stem(x);](https://image.slidesharecdn.com/dsplabpdf-180416054226/85/Dsp-lab-pdf-9-320.jpg)


![DSPLAB
Dept ECE Page 16
EXPERMENT NO-2
DFT/IDFT OF A SEQUENCE WITHOUT USING THE INBUILT FUNCTIONS
AIM:-
To find the DFT& IDFT of a sequence without using the inbuilt functions.
SOFTWARE REQURIED:-
1. MATLAB R2010a.
2. Windows XP SP2.
THEORY:-
Given a sequence of N samples f(n), indexed by n = 0..N-1, the Discrete Fourier
Transform (DFT) is defined as F(k), where k=0..N-1:
F(k) are often called the 'Fourier Coefficients' or 'Harmonics'.
The sequence f(n) can be calculated from F(k) using the Inverse Discrete Fourier Transform
(IDFT):
In general, both f(n) and F(k) are complex.
The DFT is the most important discrete transform, used to perform Fourier analysis in
many practical applications.[1]
In digital signal processing, the function is any quantity or
signal that varies over time, such as the pressure of a sound wave, a radio signal, or daily
temperature readings, sampled over a finite time interval (often defined by a window
function). In image processing, the samples can be the values of pixels along a row or column
of a raster image. The DFT is also used to efficiently solve partial differential equations, and
to perform other operations such as convolutions or multiplying large integers.](https://image.slidesharecdn.com/dsplabpdf-180416054226/85/Dsp-lab-pdf-16-320.jpg)

![DSPLAB
Dept ECE Page 19
OUTPUT:-
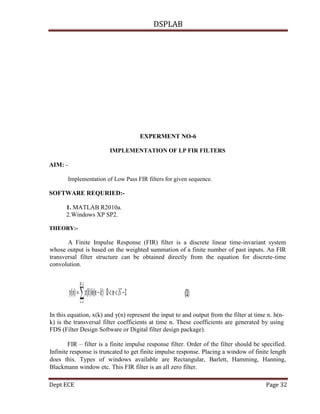
enter the input sequence[1 2 3 4]
length of input sequence is
N =
4
the output is
ans =
10.0000 -2.0000 + 2.0000i -2.0000 - 0.0000i -2.0000 - 2.0000i
1 1.5 2 2.5 3 3.5 4
0
5
10
discrete frequency
magnitude
magnitude response of dft
1 1.5 2 2.5 3 3.5 4
-200
-100
0
100
200
discrete frequency
phaseangle
phase response of dft](https://image.slidesharecdn.com/dsplabpdf-180416054226/85/Dsp-lab-pdf-19-320.jpg)
![DSPLAB
Dept ECE Page 20
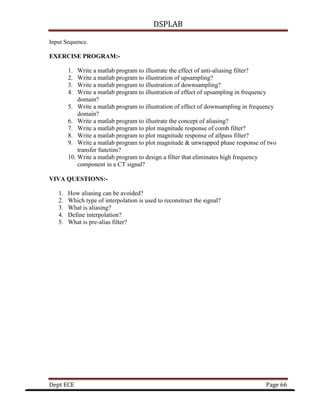
enter the input sequence[10 -2+2j -2 -2-2j]
the length of input sequence is
N =
4
the output is
ans =
1.0000 2.0000 + 0.0000i 3.0000 - 0.0000i 4.0000 - 0.0000i
1 1.5 2 2.5 3 3.5 4
0
0.5
1
1.5
2
2.5
3
3.5
4
discrete time
magnitude
magnitude response of the idft](https://image.slidesharecdn.com/dsplabpdf-180416054226/85/Dsp-lab-pdf-20-320.jpg)


![DSPLAB
Dept ECE Page 23
PROGRAM:-
%frequency response of differential equation %
clc ;
clear all;
b=[1,4];
a=[1,-5];
w=-2*pi:pi/8:2*pi;
[h]=freqz(b,a,w);
subplot(2,1,1);
stem(w,abs(h));
xlabel('freq/w');
ylabel('magnitude');
grid;
title('magnitude response of diffenrtial equataion');
subplot(2,1,2);
stem(w,angle(h));
xlabel('freq/w');
ylabel('phase in rad');
grid;
title('phase response of diffenrtial equataion');](https://image.slidesharecdn.com/dsplabpdf-180416054226/85/Dsp-lab-pdf-23-320.jpg)


![DSPLAB
Dept ECE Page 27
ylabel('magnitude');
title('magnitude response of fft');
subplot(2,1,2);
stem(k,angle(xk));
xlabel('frq/w');
ylabel('phase');
title('phase response of fft');
OUTPUT:-
enter the input sequence[1 2 3 4]
enter the number of samples8
0 1 2 3 4 5 6 7
0
5
10
frq/w
magnitude
magnitude response of fft
0 1 2 3 4 5 6 7
-4
-2
0
2
4
frq/w
phase
phase response of fft](https://image.slidesharecdn.com/dsplabpdf-180416054226/85/Dsp-lab-pdf-27-320.jpg)


![DSPLAB
Dept ECE Page 34
disp('kaiser window filter response');
end;
% low pass filter %
b=fir1(n,wp,y);
[n,o]=freqz(b,1,256);
m=20*log10(abs(n));
plot(o/pi,m);
xlabel('normalised freq output i');
ylabel('gain in db');
title('low pass filter');
OUTPUT:-
enter the pass band ripple:rp=0.02
enter the stop band ripple:rs=0.01
enter the pass band freq :fp=1000
enter the stop band freq:fp=1500
enter the sampling freq:f=10000
enter the type of window function 1.rectangular 2.trangular 3.kaiser:n=1
rectangular window filter response
0 0.1 0.2 0.3 0.4 0.5 0.6 0.7 0.8 0.9 1
-90
-80
-70
-60
-50
-40
-30
-20
-10
0
10
normalised freq output i
gainindb
low pass filter](https://image.slidesharecdn.com/dsplabpdf-180416054226/85/Dsp-lab-pdf-34-320.jpg)


![DSPLAB
Dept ECE Page 40
disp('triangular window filter response');
end;
if(c==3);
alpha=input('enter the alpha value=');
y=kaiser(n1,alpha);
disp('kaiser window filter response');
end;
% high pass filter %
b=fir1(n,wp,'high',y);
[n,o]=freqz(b,1,256);
m=20*log10(abs(n));
plot(o/pi,m);
xlabel('normalised freq output i');
ylabel('gain in db');
title('high pass filter');
OUTPUT:-
enter the pass band ripple:rp=0.02
enter the stop band ripple:rs=0.01
enter the pass band freq :fp=1000
enter the stop band freq:fp=1500
enter the sampling freq:f=10000
enter the type of window function 1.rectangular 2.trangular 3.kaiser:n=1
rectangular window filter response](https://image.slidesharecdn.com/dsplabpdf-180416054226/85/Dsp-lab-pdf-40-320.jpg)


![DSPLAB
Dept ECE Page 45
AIM: -
Implementation of Low Pass IIR filters for given sequence.
SOFTWARE REQURIED:-
1. MATLAB R2010a.
2. Windows XP SP2.
THEORY:-
Infinite impulse response (IIR) is a property applying to many linear time-invariant
systems. Common examples of linear time-invariant systems are most electronic and digital
filters. Systems with this property are known as IIR systems or IIR filters, and are
distinguished by having an impulse response which does not become exactly zero past a
certain point, but continues indefinitely. This is in contrast to a finite impulse response in
which the impulse response h(t) does become exactly zero at times t > T for some finite T,
thus being of finite duration.
PROCEDURE:-
Open MATLAB
Open new M-file
Type the program
Save in current directory
Compile and Run the program
For the output see command window Figure window
PROGRAM:-
% IIR LOW PASS FILTER %
clc;
clear all;
close all;
rp=input('enter the pass band ripple:rp=');
rs=input('enter the stop band ripple:rs=');
fp=input('enter the pass band frequency:fp=');
fs=input('enter the stop band frequency:fs=');
f=input('enter the sampling frequency:f=');
wp=2*fp/f;
ws=2*fs/f;
[N,wc]=buttord(wp,ws,rp,rs,'s');
[b,a]=butter(N,wc,'low','s');
w=0:0.01:pi;[n,o]=freqz(b,1,256);
[n,omega]=freq(b,a,w);
m=20*log10(abs(n));
subplot(2,1,1);](https://image.slidesharecdn.com/dsplabpdf-180416054226/85/Dsp-lab-pdf-45-320.jpg)


![DSPLAB
Dept ECE Page 49
AIM: -
To implement the analog & digital High Pass IIR filter.
SOFTWARE REQURIED:-
1. MATLAB R2010a.
2. Windows XP SP2.
THEORY:-
Infinite impulse response (IIR) is a property applying to many linear time-invariant
systems. Common examples of linear time-invariant systems are most electronic and digital
filters. Systems with this property are known as IIR systems or IIR filters, and are
distinguished by having an impulse response which does not become exactly zero past a
certain point, but continues indefinitely. This is in contrast to a finite impulse response in
which the impulse response h(t) does become exactly zero at times t > T for some finite T,
thus being of finite duration.
PROCEDURE:-
Open MATLAB
Open new M-file
Type the program
Save in current directory
Compile and Run the program
For the output see command window Figure window
PROGRAM:-
clc;
clear all;
close all;
disp('enter the sepecifications of iir filter');
rp=input('enter the pass band ripple:rp=');
rs=input('enter the stop band ripple:rs=');
wp=input('enter the pass band freq:wp=');
ws=input('enter the stop band freq:ws=');
fs=input('enter the sampling freq fs=');
w1=2*wp/fs;
w2=2*ws/fs;
[N,wc]=buttord(w1,w2,rp,rs,'s');
disp('freq resp of iir high pass filter is:');
[b,a]=butter(N,wc,'high','s');
w=0:0.001:pi;
[n,omega]=freqs(b,a,w);
m=20*log10(abs(n));
subplot(2,1,1);](https://image.slidesharecdn.com/dsplabpdf-180416054226/85/Dsp-lab-pdf-49-320.jpg)


![DSPLAB
Dept ECE Page 54
clc;
t =
0:0.0005:1; a
= 10
f = 13;
xa =
a*sin(2*pi*f*t);
subplot(2,1,1)
plot(t,xa);grid
xlabel('Time,
msec');
ylabel('Amplitude')
;
title('Continuous-time signal
x_{a}(t)'); axis([0 1 -10.2 10.2])
subplot(2,1,2
); T = 0.01;
n = 0:T:1;
xs =
a*sin(2*pi*f*n); k
= 0:length(n)-1;
stem(k,xs);
grid
xlabel('Time index n');
ylabel('Amplitude');
title('Discrete-time signal
x[n]'); axis([0 (length(n)-1) -
10.2 10.2])
OUTPUT:-](https://image.slidesharecdn.com/dsplabpdf-180416054226/85/Dsp-lab-pdf-54-320.jpg)


![DSPLAB
Dept ECE Page 57
AIM: -
The objective of this program is To Generate Dual Tone Multiple Frequency (DTMF)
Signals.
SOFTWARE REQURIED:-
1. MATLAB R2010a.
2. Windows XP SP2.
THEORY:-
Dual Tone Multiple Frequency (DTMF) Signals.
PROCEDURE:-
Open MATLAB
Open new M-file
Type the program
Save in current directory
Compile and Run the program
For the output see command window Figure window
PROGRAM:-
% Dual Tone Multiple Frequency (DTMF) Signals.
clc;
clearall;
closeall;
number=input('enter a phone number with no
spaces','s'); %number=1;
fs=8192; % fs is the sampling Frequency
T=0.5; % T stores how for how long a tone will be played
x= 2*pi*[697 770 852 941];
y= 2*pi*[1209 1336 1477
1633]; t=[0:1/fs:T]'
tx=[sin(x(1)*t),sin(x(2)*t),sin(x(3)*t),sin(x(4)*t)]/2;](https://image.slidesharecdn.com/dsplabpdf-180416054226/85/Dsp-lab-pdf-57-320.jpg)
![DSPLAB
Dept ECE Page 58
ty=[sin(y(1)*t),sin(y(2)*t),sin(y(3)*t),sin(y(4)*t)
]/2; for k=1:length(number)
switch
number(k)
case '1'
tone =
tx(:,1)+ty(:,1);
sound(tone);
stem(tone);
case '2'
tone =
tx(:,1)+ty(:,2);
sound(tone);
stem(tone);
case '3'
tone =
tx(:,1)+ty(:,3);
sound(tone);
stem(tone);
case '4'
tone = tx(:,2)+ty(:,1); sound(tone); stem(tone); otherwise
disp('invalid number');
end
pause(2.70
)
end;
OUTPUT:-
Input: 01234](https://image.slidesharecdn.com/dsplabpdf-180416054226/85/Dsp-lab-pdf-58-320.jpg)


![DSPLAB
Dept ECE Page 74
EXPERMENT NO-15
AUDIO APPLICATIONS
AIM: -
To perform audio applications such as to plot a time & frequency display of microphone plus a
cosine using DSP.
EQUIPMENTS:-
1. Operating system-windows XP.
2. Software –cc studio 3.
3. Software-mat lab 6.5.
4. DSK 6713DSP Trainer kit.
5. USB cable.
6. Power Supply.
PROGRAM:-
Spectrogram-rdts-mtl-frequency analysis of signals using RDTX-MATLAB
#include”dsk6713-aic23.h” //code-DSK support file
Unit32fs=dsk6713-aic23freq-8Khz; //set sampling rate
#include<rtdh.h> //RTDX support file
#include<math.h>
#include”hamming.cof” //Hamming window coefficients
#define pts256 //# of points for FFT
#define pi3.1415926538979
typedef struct {flot real,imag;}COMPLEX;
Void FFT(COMPLEX*Y,int n); //FFT protype
float iobuffer{PTS],iobuffer 1[PTS],a[PTS]; //input and output buffer
float x[PTS]; // intermediate buffer
short I; //general purpose index variable
int j,k,l,curr_block=0; // index variables
short buffercount=0; //number of new samples in iobuffer
short flag=0; //set to 1 by ISR when buffer is full
COMPLEX w[PTS]; //twiddle constants stored in w
COMPLEX samples [PTS]; //primary working buffer
RTDX_ Create output Channel(ochan); //create output channel C6x->PC
Main()
{
For(i=0;i<PTS;i++) //set up twiddle constants in w
{
w[i].real=cos(2*PI*i/512.0); //Re component of twiddle constants
w[i].imagl=sin(2*PI*i/512.0); //Im component of twiddle constants
}
Comm._intr(); //init DSK,code,McBSP
While (!RTDX_is Outpu Enabled(&ochan)) //wait forPC to enable RTDX](https://image.slidesharecdn.com/dsplabpdf-180416054226/85/Dsp-lab-pdf-74-320.jpg)
![DSPLAB
Dept ECE Page 75
Puts(“nn Wating…”); //while waiting
for(1=0;1<256;I++)
a[I]=cos(2*3.14*1500*1/8000);
for (k=0;k<5000;k++) //infinite loop
{
While (flag==0); //wait until iobuffer is full
Flag=0; //reset flag
For(i=0;I<PTS;i++) //swap buffer
{iobuffer1[i]=iobuffer[i]+a[i];
Samples[i].real=h[i]*iobuffer1[i]; //multiply by Hamming window coeffs
iobuffer 1[i]=x[i]; // process frame to iobuffer
}
For(i=0;i<PTS;i++)
Samples[i].imag=0.0 //imag components=0
FFT(samples,PTS); //call C-coded FFT function
For(i=0;i<PTS;i++) //compute square of FFT magnitude
{
X[i]=(samples[i].real*samp0les[i].real
+samples[i].imag*samples[i].imag)/16;//FFT data scaling
}
RTDX_write(&ochan,x1,sizeof(x1)/2); //send 128 samples to PC
} //end of infinite loop
} // end of main
Interrupt void c_int11() //ISR
{
Output_ sample ((short)(iobuffer[buffercount])); //out fromiobuffer
Iobuffer[[buffercount++]=(short)(input_sample()); //input to iobuffer
If(buffercount>=PTS) //if iobuffer full
{
Buffercount=0; /reinit buffercount
Flag=1; //reset flag
RESULT:-
Thus audio application is performed & spectrogram of an input signal is plotted using
MATLAB.](https://image.slidesharecdn.com/dsplabpdf-180416054226/85/Dsp-lab-pdf-75-320.jpg)
![DSPLAB
Dept ECE Page 76
EXPERMENT NO-16
NOISE REMOVAL
AIM: -
To add noise above 3kHz &then remove.
EQUIPMENTS:-
1. Operating system-windows XP.
2. Software –cc studio 3.
3. Software-mat lab 6.5.
4. DSK 6713DSP Trainer kit.
5. USB cable.
6. Power Supply.
7. CRO.
8. Function Generator.
THEORY:-
Adaptive filters are best used in cases where signal conditions or system parameters are slowly
Changing and the filter are to be adjusted to compensate for the change. The least mean squares
(LMS) criterion is such algorithm that can be used to provide the strategy for adjusting the filter
coefficient.
.
PROGRAM:-
#include “NCefg.h”
#include”dsk6713.h”
#include” dsk6713_aic23.h”
#define beta IE-13 //rate of convergence
#define N 30 //adaptive FIR filter length-vary this parameter & observe
float delay [N];
float w[N};
DSK6713_AIC23_Config config={
0x0017, /*0 DSK6713_AIC23_LEFTINVOL Left line input channel volume*/
0x0017, /*1 DSK6713_AIC23_RIGHTINVOL Right line input channel volume*/
0x00d8, /*2 DSK6713_AIC23_LEFTINVOL Left channel headphone volume*/
0x00d8, /*3 DSK6713_AIC23_RIGHTINVOL Right channel headphone volume*/
0x0011, /*4 DSK6713_AIC23_ANAPATH Analog audio path control*/
0x0000, /*5 DSK6713_AIC23_DIGPATH Digital audio path control*/
0x0000, /*6 DSK6713_AIC23_POWERDOWN Power down control */
0x0043, /*7DSK6713_AIC23_DIGIF Digital audio interface format*/
0x0081, /*8DSK6713_AIC23_SAMPLERATE Sample rate control*/
0x0001, /*9DSK6713_AIC23_DIGACT Digital interface activation */
};
/*main()-Main code routine, Initializes BSL and generates tone*/](https://image.slidesharecdn.com/dsplabpdf-180416054226/85/Dsp-lab-pdf-76-320.jpg)
![DSPLAB
Dept ECE Page 77
Void main()
{
DSK6713_AIC23_codecHandle hCodec;
Int I_input,r_input,I_output,r_output,T;
/*Initialize the board support library,must be called first*/
DSK6713_init();
hCodec=DSK6713_AIC23_openCodec(0,&config); /*start the code C*/
DSK6713_AIC23_setfreq(hCOde c,1);
For(T=0:T<30:T++) //Initialize the adaptive FIR Coeffs=0
{ w[T]=0; //init buffer for weights
Delay[T]=0; ////init buffer for delay samples
}
While(1)
{/*Read a sample to the left channel */
While(!DSK6713_AIC23_read(hCodec.&l_input));
{/*Read a sample to the right channel */
While(!DSK6713_AIC23_read(hCodec.&r_input));
l_output=(short int) adaptive_filter(l_input,r_input);
l_output=r_output;
While(!DSK6713_AIC23_write (hCodec.&l_output)); /*send output to the Left channel*/
While(!DSK6713_AIC23_write(hCodec.&r_output)); /*send output to the Right channel*/
}
DSK6713_AIC23_closecodec(hcodec); /*close the codec*/
}
RESULT:-
Thus noise signal cancellation using adaptive filters is verified.](https://image.slidesharecdn.com/dsplabpdf-180416054226/85/Dsp-lab-pdf-77-320.jpg)

![DSPLAB
Dept ECE Page 79
subplot(2,1,2);
zplane(b,a);
xlabel('real axis');
ylabel('imaginary axis');
title('pole zero in z-plane');
OUTPUT:-
Enter the coefficeints of x(n):b=[1]
Enter the coefficeints of x(n):a=[1 -1 .9]
Enter the order of N =2
0 0.1 0.2 0.3 0.4 0.5 0.6 0.7 0.8 0.9 1
0
0.5
1
discrete time
amplitude
Impulse Response
-3 -2 -1 0 1 2 3
-1
-0.5
0
0.5
1
2
real axis
imaginaryaxis
pole zero in z-plane
RESULT:-](https://image.slidesharecdn.com/dsplabpdf-180416054226/85/Dsp-lab-pdf-79-320.jpg)


![DSPLAB
Dept ECE Page 86
2. VERIFY LINEAR CONVOLUTION
AIM: -
To perform linear convolution of two sequences
EQUIPMENT REQUIRED:-
Operating System – Windows XP
Constructor - Simulator
Software - CCStudio 3.3 & MATLAB 7.5
THEORY:-
Convolution is a formal mathematical operation, just as multiplication, addition, and
integration. Addition takes two numbers and produces a third number, while convolution takes two
signals and produces a third signal. Convolution is used in the mathematics of many fields, such as
probability and statistics. In linear systems, convolution is used to describe the relationship between
three signals of interest: the input signal, the impulse response, and the output signal.
In this equation, x1(k), x2(n-k) and y(n) represent the input to and output from the system at
time n. Here we could see that one of the input is shifted in time by a value every time it is
multiplied with the other input signal. Linear Convolution is quite often used as a method of
implementing filters of various types.
PROCEDURE:
1) Generate the first input sequence ‘x’.
2) Plot the sequence in discrete form. [Make use of stem( )]
3) Give some relevant names to x-axis and y-axis.
4) Generate second input sequence ‘y’.
5) Repeat steps (2) and (3) for second sequence ‘y’.
6) Use the inbuilt function ‘conv( )’ to compute linear convolution of ‘x’ and ‘y’.
z = conv(x,y)
7) Plot the output sequence ‘z’. [Repeat steps 2 and 3]
8) Make use of subplot ( ) to plot the inputs and output sequences in a single window.](https://image.slidesharecdn.com/dsplabpdf-180416054226/85/Dsp-lab-pdf-86-320.jpg)
![DSPLAB
Dept ECE Page 87
PROGRAM:
// Linear convolution program in c language using CCStudio
#include<stdio.h>
int x[15],h[15],y[15];
main()
{
int i,j,m,n;
printf("n enter value for m");
scanf("%d",&m);
printf("n enter value for n");
scanf("%d",&n);
printf("Enter values for i/p x(n):n");
for(i=0;i<m;i++)
scanf("%d",&x[i]);
printf("Enter Values for i/p h(n)
n"); for(i=0;i<n; i++)
scanf("%d",&h[i]);
// padding of zeros
for(i=m;i<=m+n-1;i++)
x[i]=0; for(i=n;i<=m+n-
1;i++)
h[i]=0;
/* convolution operation
*/ for(i=0;i<m+n-1;i++)
{
y[i]=0;
for(j=0;j<=i;j++)
{
y[i]=y[i]+(x[j]*h[i-j]);
}
}
//displaying the o/p
for(i=0;i<m+n-1;i++)
printf("n The Value of output y[%d]=%d",i,y[i]);](https://image.slidesharecdn.com/dsplabpdf-180416054226/85/Dsp-lab-pdf-87-320.jpg)
![DSPLAB
Dept ECE Page 88
OUTPUT:
Enter value for m 4
Enter value for n 4
Enter values for i/p
1 2 3
4
Enter Values for n
1 2 3
4
The Value of output y[0]=1
The Value of output y[1]=4
The Value of output y[2]=10
The Value of output y[3]=20
The Value of output y[4]=25
The Value of output y[5]=24
The Value of output y[6]=16](https://image.slidesharecdn.com/dsplabpdf-180416054226/85/Dsp-lab-pdf-88-320.jpg)

![DSPLAB
Dept ECE Page 90
3. VERIFY CIRCULAR CONVOLUTION.
AIM:-
To perform circular convolution of two sequences using MATLAB & Code
Composer Studio3.1.
EQUIPMENT REQUIRED:-
Operating System – Windows XP
Constructor - Simulator
Software - CCStudio 3.3 & MATLAB 7.5
THEORY:-
Circular convolution is another way of finding the convolution sum of two input signals. It
resembles the linear convolution, except that the sample values of one of the input signals is folded
and right shifted before the convolution sum is found. Also note that circular convolution could
also be found by taking the DFT of the two input signals and finding the product of the two
frequency domain signals. The Inverse DFT of the product would give the output of the signal in
the time domain which is the circular convolution output. The two input signals could have been of
varying sample lengths. But we take the DFT of higher point, which ever signals levels to. For eg.
If one of the signal is of length 256 and the other spans 51 samples, then we could only take
256 point DFT. So the output of IDFT would be containing 256 samples instead of 306
samples, which follows N1+N2 – 1 where N1 & N2 are the lengths 256 and 51 respectively of the
two inputs. Thus the output which should have been 306 samples long is fitted into 256 samples.
The
256 points end up being a distorted version of the correct signal. This process is called circular
convolution.
PROCEDURE:-
1. Generate the first input sequence „x‟.
2. Plot the sequence in discrete form. [Make use of stem( )]
3. Give some relavent names to x-axis and y-axis.
4. Generate second input sequence „h‟.
5. Repeat steps (2) and (3) for second sequence „h‟.
6. Find out the length of first sequence and store it in variable „n1‟. [Make use of length ( )]
7. Similarly find out the length of second sequence and store it in variable „n2‟.
9. Make the length of smaller sequence equal to the larger sequence by padding zeros to it.
11. Display and plot the convolved sequence. [Repeat steps (2) and (3)]
12. Make use of subplot to plot the inputs and output sequences in a single window.
13. Compare theoretical and practical values.](https://image.slidesharecdn.com/dsplabpdf-180416054226/85/Dsp-lab-pdf-90-320.jpg)
![DSPLAB
Dept ECE Page 91
PROGRAM USING CODE COMPOSER STUDIO 3.3
/* program to implement
circular convolution */
#include<stdio.h>
int
m,n,x[30],h[30],y[30],i,j,
k,x2[30],a[30]; void
main()
{
printf(" Enter the length of the
first sequencen");
scanf("%d",&m);
printf(" Enter the length of the second sequencen");
scanf("%d",&n);
printf(" Enter the first sequencen");
for(i=0;i<m;i++)
scanf("%d",&x[i]);
printf(" Enter the second sequencen");
for(j=0;j<n;j++)
scanf("%d",&h[j]);
if(m-n!=0) /*If length of both sequences are not equal*/
{
if(m>n) /* Pad the smaller sequence with zero*/
{
for(i=n;i<m;i++)
h[i]=0;
n=m;
}
for(i=m;i<n;i++)
x[i]=0;
m=n;
}
y[0]=0;
a[0]=h[0];](https://image.slidesharecdn.com/dsplabpdf-180416054226/85/Dsp-lab-pdf-91-320.jpg)
![DSPLAB
Dept ECE Page 92
for(j=1;j<n;j++) /*folding h(n) to h(-n)*/
a[j]=h[n-j];
/*Circular convolution*/
for(i=0;i<n;i++)
y[0]+=x[i]*a[i];
for(k=1;k<n;k++)
{
y[k]=0
;
/*circular shift*/
for(j=1;j<n;j++)
x2[j]=a[j-1];
x2[0]=a[n-1];
for(i=0;i<n;i++)
{
a[i]=x2[i];
y[k]+=x[i]*x2[i];
}
} /*displaying the result*/
printf(" The circular convolution isn");
for(i=0;i<n;i++)
printf("%d t",y[i]);
}](https://image.slidesharecdn.com/dsplabpdf-180416054226/85/Dsp-lab-pdf-92-320.jpg)

![DSPLAB
Dept ECE Page 94
RESULT:-
Circular Convolution of two sequences using CC Studio3.3 is obtained.
VIVA QUESTIONS:-
1. What is the different between Circular and Linear convolution?
2. What is the function in MATLAB used for padding zeros to a sequence? If your sequence
is, x = [1 2 3 4] and you want to pad zeros to it. How can you do that in MATLAB?
3. What is the use of following functions in MATLAB:
i. length( )
ii. max( )
iii. min( )
4. Give the steps to get the result of linear convolution from the method of
circular convolution?
5. What is the circular convolution?](https://image.slidesharecdn.com/dsplabpdf-180416054226/85/Dsp-lab-pdf-94-320.jpg)
![DSPLAB
Dept ECE Page 95
4. DESIGN FIR FILTER (LP/HP) USING WINDOWING TECHNIQUE
FIR FILTERS (LP/HP) USING WINDOWING TECHNIQUE
a) Using Rectangular Window b) Using Bartlett Window c) Using Kaiser Window
AIM:-
To design of FIR( LP/HP) filters using rectangular window.
EQUIPMENT REQUIRED:-
Operating System – Windows XP Constructor
- Simulator
Software - CCStudio 3 & MATLAB 7.5
THEORY:
A Finite Impulse Response (FIR) filter is a discrete linear time-invariant system whose
output is based on the weighted summation of a finite number of past inputs. An FIR transversal
filter structure can be obtained directly from the equation for discrete-time convolution.
In this equation, x(k) and y(n) represent the input to and output from the filter at time n.
h(n-k) is the transversal filter coefficients at time n. These coefficients are generated by using FDS
(Filter Design Software or Digital filter design package).
FIR – filter is a finite impulse response filter. Order of the filter should be specified. Infinite
response is truncated to get finite impulse response. placing a window of finite length does this.
Types of windows available are Rectangular, Barlett, Hamming, Hanning, Blackmann window etc.
This FIR filter is an all zero filter.
PROCEDURE:-
1. Enter the passband ripple (rp) and stopband ripple (rs).
2. Enter the passband frequency (fp) and stopband frequency (fs).
3. Enter the sampling frequency (f).
4. Calculate the analog passband edge frequency (wp) and stop band edge frequency (ws)
wp=2*fp/f ws=2*fs/f
5. Calculate the order of the filter using the following
formula, (-20log10 (rp.rs) –13)
n=
(14.6 (fs-fp)/f).
[Use „ceil( )‟ for rounding off the value of „n‟ to the nearest integer] if „n‟ is
an odd number, then reduce its value by „1‟.
6. Generate (n+1)th point window coefficients.For example boxcar(n+1) generates a rectangular
window. y=boxcar(n+1)
7. Design an nth order FIR filter using the previously generated (n+1) length window
function. b=fir1(n,wp,y)](https://image.slidesharecdn.com/dsplabpdf-180416054226/85/Dsp-lab-pdf-95-320.jpg)
![DSPLAB
Dept ECE Page 96
8. Find the frequency response of the filter by using „freqz( )‟ function. [h,o]=freqz(b,a,k) This
function returns k-point complex frequency response vector „h‟ and k-point frequency vector „o‟
in radians/samples of the filter.
H(eiw
)= B(ejw
) = b(1)+b(2)e-jw
+…………..b(m+1)e-jmw
A(ejw
) a(1)+a(2)e-jw
+………….a(n+1)e-jnw
Where a, b are vectors containing the denominator and numerator
coefficients. Here a=1.
9. Calculate the magnitude of the frequency response in decibels (dB). m= 20*log10(abs(h))
10. Plot the magnitude response [magnitude in dB Vs normalized frequency (o/pi)]
11. Give relevant names to x- and y- axes and give an appropriate title for the plot.
PROGRAM USING CODE COMPOSER STUDIO 3.3:
#include<stdio.h>
#include<math.h>
#define pi 3.1415 int
n,N,c; float
wr[64],wt[64];
void main()
{
printf("n enter no. of
samples,N= :");
scanf("%d",&N);
printf("n enter choice of window functionn 1.rect n 2. triang
n c= :"); scanf("%d",&c);
printf("n elements of window function
are:"); switch(c)
{
case 1:
for(n=0;n<=N-
1;n++)
{
wr[n]=1;
printf(" n wr[%d]=%f",n,wr[n]);
}
break
; case
2:
for(n=0;n<=N-1;n++)
{
wt[n]=1-(2*(float)n/(N-1));
printf("n
wt[%d]=%f",n,wt[n]);
}
break;
}
}](https://image.slidesharecdn.com/dsplabpdf-180416054226/85/Dsp-lab-pdf-96-320.jpg)

![DSPLAB
Dept ECE Page 98
5. IMPLEMENT IIR FILTER (LOW PASS & HIGH PASS)
IIR FILTER (LP/HP) USING BUTTER WORTH (ANLOG & DIGITAL) FILTERS &
CHEBYSHEV (DIGITAL) TYPE – I & II FILTERS
AIM:-
To design of Butterworth Digital (low pass & high pass) filter.
EQUIPMENTS:-
Operating System – Windows XP Constructor
- Simulator
Software - CCStudio 3 & MATLAB 7.5
THEORY:-
The IIR filter can realize both the poles and zeroes of a system because it has a rational transfer
function, described by polynomials in z in both the numerator and the denominator:
Eq.2
The difference equation for such a system is described by the following:
Eq .3
M and N are order of the two polynomials bk and ak are the filter coefficients. These
filter coefficients are generated using FDS (Filter Design software or Digital Filter design
package).
IIR filters can be expanded as infinite impulse response filters. In designing IIR filters, cutoff
frequencies of the filters should be mentioned. The order of the filter can be estimated using butter
worth polynomial. That’s why the filters are named as butter worth filters. Filter coefficients can be
found and the response can be plotted.
PROCEDURE:
1. Enter the pass band ripple (rp) and stop band ripple (rs).
2. Enter the pass band frequency (fp) and stop band frequency (fs).
3. Get the sampling frequency (f).
4. Calculate the analog pass band edge frequencies, w1 and w2.
w1 = 2*fp/f w2 = 2*fs/f
5. Calculate the order and 3dB cutoff frequency of the analog filter. [Make use of the following
function] [n,wn]=buttord(w1,w2,rp,rs,’s’)
6. Design an nth order analog lowpass Butter worth filter using the following
statement.
[b,a]=butter(n,wn,’s’)
7. Find the complex frequency response of the filter by using ‘freqs( )’
function](https://image.slidesharecdn.com/dsplabpdf-180416054226/85/Dsp-lab-pdf-98-320.jpg)
![DSPLAB
Dept ECE Page 99
PROGRAM USING CODE COMPOSER STUDIO 3.3:
//iirfilters
#include<stdio.h>
#include<math.h>
int
i,w,wc,c,N
; float
H[100];
float
mul(float,
int);
void main()
{
printf("n
enter order of
filter ");
scanf("%d",&
N);
printf("n enter
the cutoff freq
");
scanf("%d",&
wc);
printf("n enter the choice for IIR
filter 1. LPF 2.HPF ");
scanf("%d",&c);
switch(c)
{
case 1:
for(w=0;w<100;w++)
{
H[w]=1/sqrt(1+mul((w/(float)wc),2*N));
printf("H[%d]=%fn",w,H[w]);
}
break;](https://image.slidesharecdn.com/dsplabpdf-180416054226/85/Dsp-lab-pdf-99-320.jpg)
![DSPLAB
Dept ECE Page 100
case 2:
for(w=0;w<=100;w++)
{
H[w]=1/sqrt(1+mul((float)wc/w,2*N));
printf("H[%d]=%fn",w,H[w]);
}
break;
}
}
float mul(float a,int x)
{
for(i=0;i<x-1;i++)
a*=a;
return(a);
}
OUTPUT:-](https://image.slidesharecdn.com/dsplabpdf-180416054226/85/Dsp-lab-pdf-100-320.jpg)

Dsp lab pdf
- 1. DSPLAB Dept ECE Page 1 LABORATORY MANUAL DIGITAL SIGNAL PROCESSING III B.TECH -II Semester (ECE) A.Y 2014-2015 Prepared by J.NARENDER Asst Professor ECE Dept MARRI EDUCATIONAL SOCIETY’S GROUP OF INSTITUTIONS MARRI LAXMAN REDDY INSTITUTE OF TECHNOLOGY & MANAGEMENT (Approved by AICTE, New Delhi & Affiliated JNTU, Hyderabad
- 2. DSPLAB Dept ECE Page 2 MARRI EDUCATIONAL SOCIETY’S GROUP OF INSTITUTIONS MARRI LAXMAN REDDY INSTITUTE OF TECHNOLOGY & MANAGEMENT (Approved by AICTE, New Delhi & Affiliated JNTU, Hyderabad) Dundigal, Quthbullapur (M), Hyderabad – 43 DEPARTMENT OF ELECTRONICS & COMMUNICATION ENGINEERING DIGITAL SIGNAL PROCESSING LAB List of Experiments: 1. Generation of sinusoidal waveform /signal based on recursive difference equations. 2. To find DFT/IDFT of given DT signal. 3. To find frequency response of a given system (Transfer function /Differential equation form). 4. Implementation of FFT of given sequence. 5. Determination of power spectrum of a given signal. 6. Implementation of LP FIR filter for a given sequence. 7. Implementation of HP FIR filter for a given sequence. 8. Implementation of LP IIR filter for a given sequence. 9. Implementation of HP IIR filter for a given sequence. 10. Generation of sinusoidal signal through filtering. 11. Generation of DTMF signals. 12. Implementation of Decimation process. 13. Implementation of Interpolation process. 14 Implementation of I/D sampling rate converters. 15. Removal of noise by autocorrelation / cross correlation. 16. Extraction of periodic signal masked by noise using correlation. 17. Verification of winer-khinchine relations. 18. Checking a random process for stationary in wide sense. FG
- 3. DSPLAB Dept ECE Page 3 INSTRUCTIONS TO THE STUDENT FJHINSTRUCTIONS TO THE STUDENT S TO THE STUDENT 1. Students are required to attend all labs. 2. Students will work individually in hardware laboratories and in computer laboratories. 3. While coming to the lab bring the lab manual cum observation book, record etc. 4. Take only the lab manual, calculator (if needed) and a pen or pencil to the work area. 5. Before coming to the lab, prepare the pre-lab questions. Read through the lab experiment to familiarize yourself with the components and assembly sequence. 6. Utilize 3 hours time properly to perform the experiment (both in software and hardware) and note down the readings properly. Do the calculations, draw the graph and take signature from the instructor. 7. If the experiment is not completed in the prescribed time, the pending work has to be done in the leisure hour or extended hours. 8. You have to submit the completed record book according to the deadlines set up by your instructor. 9. For practical subjects there shall be a continuous evaluation during the semester for 25 sessional marks and 50 end examination marks. 10. Of the 25 marks for internal, 15 marks shall be awarded for day-to-day work and 10 marks to be awarded by conducting an internal laboratory test.
- 4. DSPLAB Dept ECE Page 4 INDEX SL.NO. EXPERIMENT NAME PAGENO. 1 Generation of sinusoidal waveform /signal based on recursive difference equations. 5 2 To find DFT/IDFT of given DT signal. 16 3 To find frequency response of a given system (Transfer function /Differential equation form). 22 4 Implementation of FFT of given sequence. . 26 5 Determination of power spectrum of a given signal. 29 6 Implementation of LP FIR filters for a given sequence. 32 7 Implementation of HP FIR filters for a given sequence. 38 8 Implementation of LP IIR filters for a given sequence. 44 9 Implementation of HP IIR filters for a given sequence. 48 10 Generation of sinusoidal signal through filtering. 52 11 Generation of DTMF signals. . 56 12 Implementation of Decimation process. 62 13 Implementation of Interpolation process. 63 14 Implementation of I/D sampling rate converters. 69 15 Removal of noise by autocorrelation / cross correlation. 73 16 Extraction of periodic signal masked by noise using correlation. 75 17 Impulse response of first order and second order systems. 77 DSP Processor 80
- 5. DSPLAB Dept ECE Page 5 EXPERMENT NO-1 GENERATION OF BASIC SIGNALS USING MATLAB AIM: - To write a “MATLAB” Program to generate various signals such as unit impulse, unit step, unit ramp, sinusoidal, exponential growing signal, exponential decaying signal, cosine signal. SOFTWARE REQURIED:- 1. MATLAB R2010a. 2. Windows XP SP2. THEORY:- One of the more useful functions in the study of linear systems is the "unit impulse function." An ideal impulse function is a function that is zero everywhere but at the origin, where it is infinitely high. However, the area of the impulse is finite. This is, at first hard to visualize but we can do so by using the graphs shown below.
- 6. DSPLAB Dept ECE Page 6 Key Concept: Sifting Property of the Impulse If b>a, then Example: Another integral problem Assume a<b, and evaluate the integral Solution: We now that the impulse is zero except at t=0 so And Unit Step Function The unit step function and the impulse function are considered to be fundamental functions in engineering, and it is strongly recommended that the reader becomes very familiar with both of these functions. The unit step function, also known as the Heaviside function, is defined as such:
- 7. DSPLAB Dept ECE Page 7 Sometimes, u(0) is given other values, usually either 0 or 1. For many applications, it is irrelevant what the value at zero is. u(0) is generally written as undefined. Derivative The unit step function is level in all places except for a discontinuity at t = 0. For this reason, the derivative of the unit step function is 0 at all points t, except where t = 0. Where t = 0, the derivative of the unit step function is infinite. The derivative of a unit step function is called an impulse function. The impulse function will be described in more detail next. Integral The integral of a unit step function is computed as such:
- 8. DSPLAB Dept ECE Page 8 Sinusoidal Signal Generation The sine wave or sinusoid is a mathematical function that describes a smooth repetitive oscillation. It occurs often in pure mathematics, as well as physics, signal processing, electrical engineering and many other fields. Its most basic form as a function of time (t) Where: • A, the amplitude, is the peak deviation of the function from its center position. • ω, the angular frequency, specifies how many oscillations occur in a unit time interval, in radians per second • φ, the phase, specifies where in its cycle the oscillation begins at t = 0. A sampled sinusoid may be written as: PROCEDURE:- Open MATLAB Open new M-file Type the program Save in current directory Compile and Run the program For the output see command window Figure window PROGRAM:- %unit step signals% clc; clear all; close all; disp('unit step signals'); N=input('enter the no of samples'); x=ones(1,N); stem(x); xlabel('time'); ylabel('amplitude'); title('unit step sequence'); % sinusoidal signals% clc; clear all; close all; disp('sinusoidal signals'); N=input('enter the no of samples');
- 9. DSPLAB Dept ECE Page 9 n=0:1:N; x=sin(n); stem(x); xlabel('time'); ylabel('amplitude'); title('sinusoidal sequence'); % unit ramp signals% clc; clear all; close all; disp('unit ramp signals'); N=input('enter the no of samples'); n=0:1:N; x=n; stem(x); xlabel('time'); ylabel('amplitude'); title('unit ramp sequence'); % unit impulse signal % clc; clear all; close all; disp('unit impuse signal'); N=input ('enter the no of samples'); n=-N:1:N; x=[zeros(1,N) 1 zeros(1,N)]; stem(n,x); xlabel('time'); ylabel('amplitude'); tittle('impulse sequence'); % exponentialsignals% clc; clear all; close all; disp('exponential signals'); N=input('enter the no of samples'); n=0:1:N; n=-N:1:N; a=0.5; x=a.^n; stem(x);
- 10. DSPLAB Dept ECE Page 10 xlabel('time'); ylabel('amplitude'); title('exponential sequence'); OUTPUT:- unit step signals enter the no of samples6 1 1.5 2 2.5 3 3.5 4 4.5 5 5.5 6 0 0.1 0.2 0.3 0.4 0.5 0.6 0.7 0.8 0.9 1 time amplitude unit step sequence
- 11. DSPLAB Dept ECE Page 11 sinusoidal signals enter the no of samples6 1 2 3 4 5 6 7 -1 -0.8 -0.6 -0.4 -0.2 0 0.2 0.4 0.6 0.8 1 time amplitude sinusoidal sequence
- 12. DSPLAB Dept ECE Page 12 unit ramp signals enter the no of samples6 1 2 3 4 5 6 7 0 1 2 3 4 5 6 time amplitude unit ramp sequence
- 13. DSPLAB Dept ECE Page 13 unit impuse signal enter the no of samples6 -6 -4 -2 0 2 4 6 0 0.1 0.2 0.3 0.4 0.5 0.6 0.7 0.8 0.9 1 time amplitude impulse sequence
- 14. DSPLAB Dept ECE Page 14 exponential signals enter the no of samples6 0 2 4 6 8 10 12 14 0 10 20 30 40 50 60 70 time amplitude exponential sequence
- 15. DSPLAB Dept ECE Page 15 RESULT:- Thus the MATLAB program for generation of all signals was performed and the output was verified. EXERCISE PROGRAM:- 1. Write program to get Discrete time Sinusoidal Signal? 2. Write program to get Fourier Transform of Sinusoidal Signal? 3. Write program to get Inverse Fourier Transform of Sinusoidal Signal? 4. Write Program for the following Function Y=exp (-2*∏*f*t)+exp(-8*∏*f*) Y= ((exp (-1.56∏f)*Sin(2∏f)+cos(2∏f)? 5. Write a matlab program for generating u(n)-u(n-1)? 6. Write program to get Discrete time co-Sinusoidal Signal? 7. Write program to get Discrete time saw tooth Signal? 8. Write program to get Discrete time triangular Signal? 9. Write program to get addition of two sinusoidal sequences? 10. Write program to get exponential sequence? VIVA QUESTIONS:- 1. Define Signal? 2. Define determistic and Random Signal? 3. Define Delta Function? 4. What is Signal Modeling? 5. Define Periodic and a periodic Signal?
- 16. DSPLAB Dept ECE Page 16 EXPERMENT NO-2 DFT/IDFT OF A SEQUENCE WITHOUT USING THE INBUILT FUNCTIONS AIM:- To find the DFT& IDFT of a sequence without using the inbuilt functions. SOFTWARE REQURIED:- 1. MATLAB R2010a. 2. Windows XP SP2. THEORY:- Given a sequence of N samples f(n), indexed by n = 0..N-1, the Discrete Fourier Transform (DFT) is defined as F(k), where k=0..N-1: F(k) are often called the 'Fourier Coefficients' or 'Harmonics'. The sequence f(n) can be calculated from F(k) using the Inverse Discrete Fourier Transform (IDFT): In general, both f(n) and F(k) are complex. The DFT is the most important discrete transform, used to perform Fourier analysis in many practical applications.[1] In digital signal processing, the function is any quantity or signal that varies over time, such as the pressure of a sound wave, a radio signal, or daily temperature readings, sampled over a finite time interval (often defined by a window function). In image processing, the samples can be the values of pixels along a row or column of a raster image. The DFT is also used to efficiently solve partial differential equations, and to perform other operations such as convolutions or multiplying large integers.
- 17. DSPLAB Dept ECE Page 17 PROCEDURE:- Open MATLAB Open new M-file Type the program Save in current directory Compile and Run the program For the output see command window Figure window PROGRAM:- %DFT% clc; clear all; close all; a=input ('enter the input sequence'); N=length(a); disp('length of input sequence is '); N for k=1:N; x(k)=0; for i=1:N; x(k)=x(k)+a(i)*exp((-j*pi*2/N)*((i-1)*(k-1))); end; end; k=1:N; disp('the output is'); x(k) subplot(2,1,1); stem(k,abs(x(k))); grid; xlabel ('discrete frequency'); ylabel('magnitude'); title('magnitude response of dft'); subplot(2,1,2); stem(angle(x(k))*180/(pi)); grid; xlabel('discrete frequency'); ylabel('phase angle'); title('phase response of dft'); %IDFT% clc; clear all; close all; a=input('enter the input sequence');
- 18. DSPLAB Dept ECE Page 18 disp('the length of input sequence is'); N=length(a); N for n=1:N; x(n)=0; for k=1:N; x(n)=x(n)+a(k)*exp((j*pi*2*(n-1)*(k-1)/N)); end; end; n=1:N; x=1/N*x(n); disp('the output is'); x(n) stem(n,abs(x)); grid; xlabel('discrete time'); ylabel('magnitude'); title('magnitude response of the idft'); grid;
- 19. DSPLAB Dept ECE Page 19 OUTPUT:- enter the input sequence[1 2 3 4] length of input sequence is N = 4 the output is ans = 10.0000 -2.0000 + 2.0000i -2.0000 - 0.0000i -2.0000 - 2.0000i 1 1.5 2 2.5 3 3.5 4 0 5 10 discrete frequency magnitude magnitude response of dft 1 1.5 2 2.5 3 3.5 4 -200 -100 0 100 200 discrete frequency phaseangle phase response of dft
- 20. DSPLAB Dept ECE Page 20 enter the input sequence[10 -2+2j -2 -2-2j] the length of input sequence is N = 4 the output is ans = 1.0000 2.0000 + 0.0000i 3.0000 - 0.0000i 4.0000 - 0.0000i 1 1.5 2 2.5 3 3.5 4 0 0.5 1 1.5 2 2.5 3 3.5 4 discrete time magnitude magnitude response of the idft
- 21. DSPLAB Dept ECE Page 21 RESULT:- DFT&IDFT of a given discrete time signal are executed using mat lab software. EXERCISE PROGRAM:- 1. Write a matlab program to find the circular convolution of two sequences? 2. Write a matlab program to find the circular convolution of x1(n)={2,3,-1,2};x2(n)={-1,2,-1,2}? 3. Write a matlab program to find the circular convolution of x1(n)={1,-1,2,3}; x2(n)={2,0,1,1}? 4. Write a matlab program to find the circular convolution of x1(n)={1,1,-1,2}; x2(n)={0,1,2,3}? 5. Write a matlab program to find the DFT of x(n) ={1 1 1 1 0 0 0 0}? 6. Write a matlab program to find the DFT of x(n) ={1 2 1 2}? 7. Write a matlab program to find the DFT of x(n) ={1 0 -1 0}? 8. Write a matlab program to find the IDFT of X(k) ={1,1,-2j,- 1,1+2j }? 9. Write a matlab program to find the IDFT of X(k) ={1 0 1 0}? 10. Write a matlab program to find the to compare circular and linear convolution of two sequences? VIVA QUESTIONS:- 1. Define Symmetric and Anti-Symmetric Signals? 2. Define Continuous and Discrete Time Signals? 3. What are the Different types of representation of discrete time signals? 4. What are the Different types of Operation performed on signals? 5. Define DFT .How DFT can be calculated in matrix form?
- 22. DSPLAB Dept ECE Page 22 EXPERMENT NO-3 STUDY FREQUENCY RESPONSE OF SECOND ORDER SYSTEM AIM: - To study frequency response of second order system using MATLAB. SOFTWARE REQURIED:- 1. MATLAB R2010a. 2. Windows XP SP2. THEORY:- Second order systems are the systems or networks which contain two or more storage elements and have describing equations that are second order differential equations. The frequency response of second order filters is characterised by three filter parameters: the gain k, the corner frequency and the quality factor Q. A second order filter is a circuit that has a transfer function of the form: PROCEDURE:- Open MATLAB Open new M-file Type the program Save in current directory Compile and Run the program For the output see command window Figure window
- 23. DSPLAB Dept ECE Page 23 PROGRAM:- %frequency response of differential equation % clc ; clear all; b=[1,4]; a=[1,-5]; w=-2*pi:pi/8:2*pi; [h]=freqz(b,a,w); subplot(2,1,1); stem(w,abs(h)); xlabel('freq/w'); ylabel('magnitude'); grid; title('magnitude response of diffenrtial equataion'); subplot(2,1,2); stem(w,angle(h)); xlabel('freq/w'); ylabel('phase in rad'); grid; title('phase response of diffenrtial equataion');
- 24. DSPLAB Dept ECE Page 24 OUTPUT:- -8 -6 -4 -2 0 2 4 6 8 0 0.5 1 1.5 freq/w magnitude magnitude response of diffenrtial equataion -8 -6 -4 -2 0 2 4 6 8 -4 -2 0 2 4 freq/w phaseinrad phase response of diffenrtial equataion
- 25. DSPLAB Dept ECE Page 25 RESULT:- Hence the frequency response is executed by using MATLAB. EXERCISE PROGRAM:- 1. Write a matlab program to find the frequency response of the following difference equation y(n)-7y(n-1)+9y(n-2)=3x(n)-2x(n-1)? 2. Write a matlab program to find the frequency response of the following difference equation 3y(n)+5y(n-1)=9x(n)? 3. Write a matlab program to find the frequency response of the following difference equation 9 y(n)-2y(n-1)+7y(n-2)-3y(n-3)=6x(n)+x(n-1)? 4. Write a matlab program to find the frequency response of the following difference equation 8y(n)+6y(n-1)=4x(n)+2x(n-1)? 5. Write a matlab program to find the frequency response of the following difference equation 3y(n)-8y(n-1)+9y(n-2)=9x(n)+5x(n-1) ? 6. Write a matlab program to find the frequency response of the following difference equation 6y(n)-5y(n-1)=9x(n)+5x(n-1) -7x(n-2)? 7. Write a matlab program to find the frequency response of the following difference equation 9y(n)-8y(n-1)+2y(n-2)=9x(n)-3x(n-1) ? 8. Write a matlab program to find the frequency response of the following difference equation 2y(n)-8y(n-1)=9x(n)+5x(n-1) ? 9. Write a matlab program to find the frequency response of the following difference equation 9y(n)-8y(n-1)+9y(n-2)=9x(n)+5x(n-1)-x(n-2) ? 10. Write a matlab program to find the frequency response of the following difference equation 3y(n)-8y(n-1)=7x(n)-3x(n-1) ? VIVA QUESTIONS:- 1. What is the commend to find phase angle? 2. What is the commend to find frequency response? 3. What is transition band? 4. What is the formula for Z-transform? 5. What is the relationship b/w impulse response& frequency response?
- 26. DSPLAB Dept ECE Page 26 EXPERMENT NO-4 IMPLEMENTATION OF FFT OF GIVEN SEQUENCE AIM: - Implementation of FFT of given sequence. SOFTWARE REQURIED:- 1. MATLAB R2010a. 2. Windows XP SP2. THEORY:- A fast Fourier transform (FFT) is an algorithm to compute the discrete Fourier transform (DFT) and its inverse. Fourier analysis converts time (or space) to frequency and vice versa; an FFT rapidly computes such transformations by factorizing the DFT matrix into a product of sparse (mostly zero) factors. PROCEDURE:- Open MATLAB Open new M-file Type the program Save in current directory Compile and Run the program For the output see command window Figure window PROGRAM:- %fft% clc; clear all; close all; xn=input('enter the input sequence'); N=input('enter the number of samples'); n=0:1:N-1; xk=fft(xn,N); k=0:1:N-1; subplot(2,1,1); stem(k,abs(xk)); xlabel('frq/w');
- 27. DSPLAB Dept ECE Page 27 ylabel('magnitude'); title('magnitude response of fft'); subplot(2,1,2); stem(k,angle(xk)); xlabel('frq/w'); ylabel('phase'); title('phase response of fft'); OUTPUT:- enter the input sequence[1 2 3 4] enter the number of samples8 0 1 2 3 4 5 6 7 0 5 10 frq/w magnitude magnitude response of fft 0 1 2 3 4 5 6 7 -4 -2 0 2 4 frq/w phase phase response of fft
- 28. DSPLAB Dept ECE Page 28 RESULT:- Hence the FFT of a given input sequence is performed & executed by using MATLAB. EXERCISE PROGRAM:- 1. Write a matlab program to find the cross correlation using FFT? 2. Write a matlab program to find the DFT of x(n) ={1 1 0 0 0 0 0 0}? 3. Write a matlab program to find the DFT of x(n) ={1 1 1 1 1 0 0 0}? 4. Write a matlab program to find the DFT of x(n) ={1 0 1 0 1 0 1 0}? 5. Write a matlab program to find the IDFT of X(k) ={1,1+j,-2j,1+2j ,-j, +j}? 6. Write a matlab program to find the IDFT of X(k) ={1,0,-2j,-1,+2j,-7j }? 7. Write a matlab program to find the IDFT of X(k) ={1,1,-2j,-1,1+2j }? 8. Write a matlab program to find the IDFT of X(k) ={1,1+j,-2j,-1+-j,1+2j }? 9. Write a matlab program to find the DFT of x(n) ={1 1 0 0 1 1 0 0}? 10. Write a matlab program to find the DFT of x(n) ={1 0 0 0 1 0 0 0}? VIVA QUESTIONS:- 1. Whether linear convolution equation is a difference equation? 2. Whether DFT is a linear transform? 3. What is the difference between circular convolution & linear convolution? 4. Can you implement linear convolution using circular convolution? 5. How FFT algorithms are classified?
- 29. DSPLAB Dept ECE Page 29 EXPERMENT NO-5 DETERMINATION OF POWER SPECTRUM AIM: - To obtain power spectrum of given signal using MATLAB. SOFTWARE REQURIED:- 1. MATLAB R2010a. 2. Windows XP SP2. THEORY:- The power spectrum of a time-series x(t) describes how the variance of the data x(t) is distributed over the frequency components into which x(t) may be decomposed. This distribution of the variance may be described either by a measure µ or by a statistical cumulative distribution function S(f) = the power contributed by frequencies from 0 up to f. PROCEDURE:- Open MATLAB Open new M-file Type the program Save in current directory Compile and Run the program For the output see command window Figure window PROGRAM:- % power spectrum % clc; clear all; close all; f1=input('enter the first frequencey f1='); f2=input('enter the second frequencey f2='); fs=input('enter the sampling frequencey fs='); t=0:1/fs:1; x=2*sin(2*pi*f1*t)+3*sin(2*pi*f2*t)+rand(size(t)); psd1=abs(fft(x).^2); subplot(2,1,1); plot(t*fs,10*log(psd1));
- 30. DSPLAB Dept ECE Page 30 xlabel('frequency'); ylabel('magnitude'); title('psd using square magnitude method'); psd2=abs(fft(xcorr(x),length(t))); subplot(2,1,2); plot(t*fs,10*log(psd2)); xlabel('frequency'); ylabel('magnitude'); title('psd using auto corelation method'); OUTPUT:- enter the first frequencey f1=200 enter the second frequencey f2=400 enter the sampling frequencey fs=1000 0 100 200 300 400 500 600 700 800 900 1000 0 50 100 150 frequency magnitude psd using square magnitude method 0 100 200 300 400 500 600 700 800 900 1000 80 100 120 140 frequency magnitude psd using auto corelation method
- 31. DSPLAB Dept ECE Page 31 RESULT:- Hence the power spectral density is performed & executed by using MATLAB. EXERCISE PROGRAM:- 1. Write a matlab program for power spectrum estimate using Welch method? 2. Write a matlab program to plot the frequency response of a first order system? 3. Write a matlab program to plot the frequency response of the system? 4. Write a matlab program to generate the periodic and aperiodic sequences? 5. Write a matlab program to demonstrate the property of digital frequency? 6. Write a matlab program to illustrate the concept of aliasing? 7. Write a matlab program to plot magnitude and phase response of first order lowpass filter? 8. Write a matlab program to plot magnitude and phase response of first order highpass filter? 9. Write a matlab program to plot magnitude and phase response of second order bandpass filter? 10. Write a matlab program to plot magnitude and phase response of second order bandstop filter? VIVA QUESTIONS:- 1. Give the expressions for finding the Average power of a signal/sequence? 2. Give the expressions for finding the energy of a signal/sequence? 3. What is power spectrum? 4. Why there are two peaks in the magnitude spectrum of sine wave? 5. What is spectogram?
- 32. DSPLAB Dept ECE Page 32 EXPERMENT NO-6 IMPLEMENTATION OF LP FIR FILTERS AIM: - Implementation of Low Pass FIR filters for given sequence. SOFTWARE REQURIED:- 1. MATLAB R2010a. 2.Windows XP SP2. THEORY:- A Finite Impulse Response (FIR) filter is a discrete linear time-invariant system whose output is based on the weighted summation of a finite number of past inputs. An FIR transversal filter structure can be obtained directly from the equation for discrete-time convolution. In this equation, x(k) and y(n) represent the input to and output from the filter at time n. h(n- k) is the transversal filter coefficients at time n. These coefficients are generated by using FDS (Filter Design Software or Digital filter design package). FIR – filter is a finite impulse response filter. Order of the filter should be specified. Infinite response is truncated to get finite impulse response. Placing a window of finite length does this. Types of windows available are Rectangular, Barlett, Hamming, Hanning, Blackmann window etc. This FIR filter is an all zero filter.
- 33. DSPLAB Dept ECE Page 33 PROCEDURE:- Open MATLAB Open new M-file Type the program Save in current directory Compile and Run the program For the output see command window Figure window PROGRAM:- % LOW PASS FILTER % clc; clear all; close all; rp=input('enter the pass band ripple:rp='); rs=input('enter the stop band ripple:rs='); fp=input('enter the pass band freq :fp='); fs=input('enter the stop band freq:fp='); f=input('enter the sampling freq:f='); wp=2*fp/f; ws=2*fs/f; num=-20*log10(sqrt(rp*rs))-13; den=14.6*(fs-fp)/f; n=ceil(num/den); n1=n+1; if(rem(n,2)~=0); n1=n; n=n-1; end; c=input('enter the type of window function 1.rectangular 2.trangular 3.kaiser:n='); if(c==1); y=rectwin(n1); disp('rectangular window filter response'); end; if(c==2); y=triang(n1); disp('triangular window filter response'); end; if(c==3); y=kaiser(n1);
- 34. DSPLAB Dept ECE Page 34 disp('kaiser window filter response'); end; % low pass filter % b=fir1(n,wp,y); [n,o]=freqz(b,1,256); m=20*log10(abs(n)); plot(o/pi,m); xlabel('normalised freq output i'); ylabel('gain in db'); title('low pass filter'); OUTPUT:- enter the pass band ripple:rp=0.02 enter the stop band ripple:rs=0.01 enter the pass band freq :fp=1000 enter the stop band freq:fp=1500 enter the sampling freq:f=10000 enter the type of window function 1.rectangular 2.trangular 3.kaiser:n=1 rectangular window filter response 0 0.1 0.2 0.3 0.4 0.5 0.6 0.7 0.8 0.9 1 -90 -80 -70 -60 -50 -40 -30 -20 -10 0 10 normalised freq output i gainindb low pass filter
- 35. DSPLAB Dept ECE Page 35 enter the pass band ripple:rp=0.02 enter the stop band ripple:rs=0.01 enter the pass band freq :fp=1000 enter the stop band freq:fp=1500 enter the sampling freq:f=10000 enter the type of window function 1.rectangular 2.trangular 3.kaiser:n=2 triangular window filter response 0 0.1 0.2 0.3 0.4 0.5 0.6 0.7 0.8 0.9 1 -45 -40 -35 -30 -25 -20 -15 -10 -5 0 normalised freq output i gainindb low pass filter
- 36. DSPLAB Dept ECE Page 36 enter the pass band ripple:rp=0.02 enter the stop band ripple:rs=0.01 enter the pass band freq :fp=1000 enter the stop band freq:fp=1500 enter the sampling freq:f=10000 enter the type of window function 1.rectangular 2.trangular 3.kaiser:n=3 kaiser window filter response 0 0.1 0.2 0.3 0.4 0.5 0.6 0.7 0.8 0.9 1 -90 -80 -70 -60 -50 -40 -30 -20 -10 0 10 normalised freq output i gainindb low pass filter
- 37. DSPLAB Dept ECE Page 37 RESULT:- The implementation of Butterworth Low passes FIR Filters Completed. EXERCISE PROGRAM:- 1. Write a matlab program to design FIR low pass filter using hamming/hanning window? 2. Write a matlab program to design FIR low pass filter using hamming& blackman window? 3. Write a matlab program to design FIR low pass filter with cutoff frequency .5pi using frequency sampling method? 4. Write a matlab program to plot the frequency response of low pass filter using Kaiser window for different values of beeta? 5. Write a matlab program to design FIR low pass filter for the given specifications using Kaiser window? 6. Write a matlab program to design a 25-tap Hilbert transformer using Bartlett and hamming windows and plot their frequency response? 7. Write a matlab program to design a 25-tap lowpass filter with cutoff frequency .5pi radians using rectangular and hamming windows and plot their frequency response? 8. Write a matlab program to design a 25-tap highpass filter with cutoff frequency .5pi radians using rectangular and Blackman windows and plot their frequency response? 9. Write a matlab program to design a 25-tap bandpass filter with cutoff frequency .25pi & .75pi radians using rectangular and hamming windows and plot their frequency response? 10. Write a matlab program to design a 25-tap bandstop filter with cutoff frequency .25pi & .75pi radians using rectangular and hamming windows and plot their frequency response? VIVA QUESTIONS:-
- 38. DSPLAB Dept ECE Page 38 1. Give the expression for finding the magnitude & phase response of FIR filter? 2. Compare different windows & their characteristics? 3. How FIR filters are designed using rectangular window? 4. What is Gibbs phenomenon? How it can be reduced? 5. Compare FIR&IIR filters? EXPERMENT NO-7 IMPLEMENTATION OF HP FIR FILTERS AIM: - Implementation of High Pass FIR filter for given sequence. SOFTWARE REQURIED:- 1. MATLAB R2010a. 2. Windows XP SP2. THEORY:- A Finite Impulse Response (FIR) filter is a discrete linear time-invariant system whose output is based on the weighted summation of a finite number of past inputs. An FIR transversal filter structure can be obtained directly from the equation for discrete-time convolution. In this equation, x(k) and y(n) represent the input to and output from the filter at time n. h(n- k) is the transversal filter coefficients at time n. These coefficients are generated by using FDS (Filter Design Software or Digital filter design package). FIR – filter is a finite impulse response filter. Order of the filter should be specified. Infinite response is truncated to get finite impulse response. Placing a window of finite length does this. Types of windows available are Rectangular, Barlett, Hamming, Hanning,
- 39. DSPLAB Dept ECE Page 39 Blackmann window etc. This FIR filter is an all zero filter. PROCEDURE:- Open MATLAB Open new M-file Type the program Save in current directory Compile and Run the program For the output see command window Figure window PROGRAM:- % high pass filter % clc; clear all; close all; rp=input('enter the pass band ripple:rp='); rs=input('enter the stop band ripple:rs='); fp=input('enter the pass band freq :fp='); fs=input('enter the stop band freq:fp='); f=input('enter the sampling freq:f='); wp=2*fp/f; ws=2*fs/f; num=-20*log10(sqrt(rp*rs))-13; den=14.6*(fs-fp)/f; n=ceil(num/den); n1=n+1; if(rem(n,2)~=0); n1=n; n=n-1; end; c=input('enter the type of window function 1.rectangular 2.trangular 3.kaiser:n='); if(c==1); y=rectwin(n1); disp('rectangular window filter response'); end; if(c==2); y=triang(n1);
- 40. DSPLAB Dept ECE Page 40 disp('triangular window filter response'); end; if(c==3); alpha=input('enter the alpha value='); y=kaiser(n1,alpha); disp('kaiser window filter response'); end; % high pass filter % b=fir1(n,wp,'high',y); [n,o]=freqz(b,1,256); m=20*log10(abs(n)); plot(o/pi,m); xlabel('normalised freq output i'); ylabel('gain in db'); title('high pass filter'); OUTPUT:- enter the pass band ripple:rp=0.02 enter the stop band ripple:rs=0.01 enter the pass band freq :fp=1000 enter the stop band freq:fp=1500 enter the sampling freq:f=10000 enter the type of window function 1.rectangular 2.trangular 3.kaiser:n=1 rectangular window filter response
- 41. DSPLAB Dept ECE Page 41 0 0.1 0.2 0.3 0.4 0.5 0.6 0.7 0.8 0.9 1 -60 -50 -40 -30 -20 -10 0 10 normalised freq output i gainindb high pass filter enter the pass band ripple:rp=0.02 enter the stop band ripple:rs=0.01 enter the pass band freq :fp=1000 enter the stop band freq:fp=1500 enter the sampling freq:f=10000 enter the type of window function 1.rectangular 2.trangular 3.kaiser:n=2 triangular window filter response
- 42. DSPLAB Dept ECE Page 42 0 0.1 0.2 0.3 0.4 0.5 0.6 0.7 0.8 0.9 1 -30 -25 -20 -15 -10 -5 0 normalised freq output i gainindb high pass filter enter the pass band ripple:rp=0.02 enter the stop band ripple:rs=0.01 enter the pass band freq :fp=1000 enter the stop band freq:fp=1500 enter the sampling freq:f=10000 enter the type of window function 1.rectangular 2.trangular 3.kaiser:n=3 enter the alpha value=5
- 43. DSPLAB Dept ECE Page 43 kaiser window filter response 0 0.1 0.2 0.3 0.4 0.5 0.6 0.7 0.8 0.9 1 -90 -80 -70 -60 -50 -40 -30 -20 -10 0 10 normalised freq output i gainindb high pass filter RESULT:- The implementation of Butterworth High passes FIR Filters Completed. EXERCISE PROGRAM:-
- 44. DSPLAB Dept ECE Page 44 1. Write a matlab program to design FIR high pass filter using hamming/hanning window? 2. Write a matlab program to design FIR high pass filter using hamming& blackman window? 3. Write a matlab program to design FIR high pass filter with cutoff frequency .5pi using frequency sampling method? 4. Write a matlab program to plot the frequency response of high pass filter using Kaiser window for different values of beeta? 5. Write a matlab program to design FIR high pass filter for the given specifications using Kaiser window? 6. Write a matlab program to design a 25-tap Hilbert transformer using Bartlett and hamming windows and plot their frequency response? 7. Write a matlab program to design a 25-tap high pass filter with cutoff frequency .5pi radians using rectangular and hamming windows and plot their frequency response? 8. Write a matlab program to design a 25-tap high pass filter with cutoff frequency .5pi radians using rectangular and Blackman windows and plot their frequency response? 9. Write a matlab program to design a 25-tap band pass filter with cutoff frequency .25pi & .75pi radians using rectangular and hamming windows and plot their frequency response? 10. Write a matlab program to design a 25-tap bands top filter with cutoff frequency .25pi & .75pi radians using rectangular and hamming windows and plot their frequency response? VIVA QUESTIONS:- 1. What is FIR filter? 2. State properties of FIR filters? 3. Why FIR filters are inherently stable? 4. How linear phase is achieved in FIR filters? 5. Given an approximate formula for order of FIR filter? EXPERMENT NO-8 IMPLEMENTATION OF LP IIR FILTERS
- 45. DSPLAB Dept ECE Page 45 AIM: - Implementation of Low Pass IIR filters for given sequence. SOFTWARE REQURIED:- 1. MATLAB R2010a. 2. Windows XP SP2. THEORY:- Infinite impulse response (IIR) is a property applying to many linear time-invariant systems. Common examples of linear time-invariant systems are most electronic and digital filters. Systems with this property are known as IIR systems or IIR filters, and are distinguished by having an impulse response which does not become exactly zero past a certain point, but continues indefinitely. This is in contrast to a finite impulse response in which the impulse response h(t) does become exactly zero at times t > T for some finite T, thus being of finite duration. PROCEDURE:- Open MATLAB Open new M-file Type the program Save in current directory Compile and Run the program For the output see command window Figure window PROGRAM:- % IIR LOW PASS FILTER % clc; clear all; close all; rp=input('enter the pass band ripple:rp='); rs=input('enter the stop band ripple:rs='); fp=input('enter the pass band frequency:fp='); fs=input('enter the stop band frequency:fs='); f=input('enter the sampling frequency:f='); wp=2*fp/f; ws=2*fs/f; [N,wc]=buttord(wp,ws,rp,rs,'s'); [b,a]=butter(N,wc,'low','s'); w=0:0.01:pi;[n,o]=freqz(b,1,256); [n,omega]=freq(b,a,w); m=20*log10(abs(n)); subplot(2,1,1);
- 46. DSPLAB Dept ECE Page 46 plot(omega/pi,m); xlabel('normalised frequency 0/pi'); ylabel('gain frequency in db'); title('magnitude response'); subplot(2,1,2); plot(angle,(n)); xlabel('normalised frequency '); ylabel('phase'); title('phase response'); OUTPUT:- enter the pass band ripple:rp=0.15
- 47. DSPLAB Dept ECE Page 47 enter the stop band ripple:rs=60 enter the pass band frequency:fp=1500 enter the stop band frequency:fs=3000 enter the sampling frequency:f=7000 0 0.1 0.2 0.3 0.4 0.5 0.6 0.7 0.8 0.9 1 -300 -200 -100 0 100 normalised frequency 0/pi gainfrequencyindb magnitude response 0 50 100 150 200 250 300 350 -4 -2 0 2 4 normalised frequency phase phase response RESULT:- Thus IIR lowpass filter is designed using MATLAB.
- 48. DSPLAB Dept ECE Page 48 EXERCISE PROGRAM:- 1. Write a matlab program to generate IIR chebyshev analog lowpass filter? 2. Write a matlab program to design a Butterworth lowpass filter for the specifications? 3. Write a matlab program to design a Butterworth bandpass filter for the specifications? 4. Write a matlab program to design a Butterworth highpass filter for the specifications? 5. Write a matlab program to design a Butterworth bandreject filter for the specifications? 6. Write a matlab program to design a chebyshev -I lowpass filter for the specifications? 7. Write a matlab program to design a chebyshev -II lowpass filter for the specifications? 8. Write a matlab program to design a chebyshev -I bandpass filter for the specifications? 9. Write a matlab program to design a chebyshev -II bandpass filter for the specifications? 10. Write a matlab program to design a chebyshev -I high pass filter for the specifications? VIVA QUESTIONS:- 1. What is the difference b/w analog and digital filter? 2. State the advantages & disadvantages of digital filters? 3. What are the different types of digital filters? 4. What are the characteristics of Butterworth filters? 5. How the s-plane is mapped to z-plane in impulse invariant transformation? EXPERMENT NO-9 IMPLEMENTATION OF HP IIR FILTERS
- 49. DSPLAB Dept ECE Page 49 AIM: - To implement the analog & digital High Pass IIR filter. SOFTWARE REQURIED:- 1. MATLAB R2010a. 2. Windows XP SP2. THEORY:- Infinite impulse response (IIR) is a property applying to many linear time-invariant systems. Common examples of linear time-invariant systems are most electronic and digital filters. Systems with this property are known as IIR systems or IIR filters, and are distinguished by having an impulse response which does not become exactly zero past a certain point, but continues indefinitely. This is in contrast to a finite impulse response in which the impulse response h(t) does become exactly zero at times t > T for some finite T, thus being of finite duration. PROCEDURE:- Open MATLAB Open new M-file Type the program Save in current directory Compile and Run the program For the output see command window Figure window PROGRAM:- clc; clear all; close all; disp('enter the sepecifications of iir filter'); rp=input('enter the pass band ripple:rp='); rs=input('enter the stop band ripple:rs='); wp=input('enter the pass band freq:wp='); ws=input('enter the stop band freq:ws='); fs=input('enter the sampling freq fs='); w1=2*wp/fs; w2=2*ws/fs; [N,wc]=buttord(w1,w2,rp,rs,'s'); disp('freq resp of iir high pass filter is:'); [b,a]=butter(N,wc,'high','s'); w=0:0.001:pi; [n,omega]=freqs(b,a,w); m=20*log10(abs(n)); subplot(2,1,1);
- 50. DSPLAB Dept ECE Page 50 plot(omega/pi,m); xlabel('normalised freq'); ylabel('gain'); title('magnitude response'); subplot(2,1,2); plot(angle(n)); xlabel('normalised freq'); ylabel('phase'); title('phase response'); OUTPUT:- enter the sepecifications of iir filter enter the pass band ripple:rp=0.15
- 51. DSPLAB Dept ECE Page 51 enter the stop band ripple:rs=60 enter the pass band freq:wp=1500 enter the stop band freq:ws=3000 enter the sampling freq fs=7000 freq resp of iir high pass filter is: 0 0.1 0.2 0.3 0.4 0.5 0.6 0.7 0.8 0.9 1 -1000 -500 0 500 normalised freq gain magnitude response 0 500 1000 1500 2000 2500 3000 3500 -4 -2 0 2 4 normalised freq phase phase response RESULT:- Thus IIR lowpass filter is designed using MATLAB.
- 52. DSPLAB Dept ECE Page 52 EXERCISE PROGRAM:- 1. Write a matlab program to generate IIR chebyshev analog highpass filter? 2. Write a matlab program to design a Butterworth highpass filter for the specifications? 3. Write a matlab program to design a Butterworth bandpass filter for the specifications? 4. Write a matlab program to design a Butterworth highpass filter for the specifications? 5. Write a matlab program to design a Butterworth bandreject filter for the specifications? 6. Write a matlab program to design a chebyshev -I highpass filter for the specifications? 7. Write a matlab program to design a chebyshev -II highpass filter for the specifications? 8. Write a matlab program to design a chebyshev -I highpass filter for the specifications? 9. Write a matlab program to design a chebyshev -II highpass filter for the specifications? 10. Write a matlab program to design a chebyshev -I high pass filter for the specifications? VIVA QUESTIONS:- 1. What are the steps in designing the IIR filters? 2. State the disadvantages of impulse invariant transformation? 3. Why impulse invariant transformation is not suitable for design of high pass filters? 4. What is frequency relationship for bilinear transformation? 5. What is the frequency relationship for bilinear transformation? EXPERMENT NO-10 SINUSOIDAL SIGNAL THROUGH FILTERING
- 53. DSPLAB Dept ECE Page 53 AIM: - Generation of Sine Wave & Illustration of the Sampling Process in the Time Domain. SOFTWARE REQURIED:- 1. MATLAB R2010a. 2. Windows XP SP2. THEORY:- Sinusoidal Signal Generation The sine wave or sinusoid is a mathematical function that describes a smooth repetitive oscillation. It occurs often in pure mathematics, as well as physics, signal processing, electrical engineering and many other fields. Its most basic form as a function of time (t) where: • A, the amplitude, is the peak deviation of the function from its center position. • ω, the angular frequency, specifies how many oscillations occur in a unit time interval, in radians per second • φ, the phase, specifies where in its cycle the oscillation begins at t = 0. A sampled sinusoid may be written as: PROCEDURE:- Open MATLAB Open new M-file Type the program Save in current directory Compile and Run the program For the output see command window Figure window PROGRAM:- % Generation of Sine Wave & Illustration of the Sampling Process in the Time Domain
- 54. DSPLAB Dept ECE Page 54 clc; t = 0:0.0005:1; a = 10 f = 13; xa = a*sin(2*pi*f*t); subplot(2,1,1) plot(t,xa);grid xlabel('Time, msec'); ylabel('Amplitude') ; title('Continuous-time signal x_{a}(t)'); axis([0 1 -10.2 10.2]) subplot(2,1,2 ); T = 0.01; n = 0:T:1; xs = a*sin(2*pi*f*n); k = 0:length(n)-1; stem(k,xs); grid xlabel('Time index n'); ylabel('Amplitude'); title('Discrete-time signal x[n]'); axis([0 (length(n)-1) - 10.2 10.2]) OUTPUT:-
- 55. DSPLAB Dept ECE Page 55 RESULT:- Sinusoidal signal is generated by using MATLAB.
- 56. DSPLAB Dept ECE Page 56 EXERCISE PROGRAM:- 1. Write program to get Discrete time Sinusoidal Signal? 2. Write program to get Fourier Transform of Sinusoidal Signal? 3. Write program to get Inverse Fourier Transform of Sinusoidal Signal? 4. Write a matlab program for generating u(n)-u(n-1)? 5. Write program to get Discrete time co-Sinusoidal Signal? 6. Write program to get Discrete time saw tooth Signal? 7. Write program to get Discrete time triangular Signal? 8. Write program to get addition of two sinusoidal sequences? 9. Write program to get exponential sequence? 10. Write program to get Discrete time Co-Sinusoidal Signal? VIVA QUESTIONS:- 1.Define sinusoidal signal? 2.Define C.T.S? 3.Define D.T.S? 4.Compare C.T.S & D.T.S? 5.. Draw the C.T.S & D.T.S diagrams? EXPERMENT NO-11 DTMF SIGNAL GENERATION
- 57. DSPLAB Dept ECE Page 57 AIM: - The objective of this program is To Generate Dual Tone Multiple Frequency (DTMF) Signals. SOFTWARE REQURIED:- 1. MATLAB R2010a. 2. Windows XP SP2. THEORY:- Dual Tone Multiple Frequency (DTMF) Signals. PROCEDURE:- Open MATLAB Open new M-file Type the program Save in current directory Compile and Run the program For the output see command window Figure window PROGRAM:- % Dual Tone Multiple Frequency (DTMF) Signals. clc; clearall; closeall; number=input('enter a phone number with no spaces','s'); %number=1; fs=8192; % fs is the sampling Frequency T=0.5; % T stores how for how long a tone will be played x= 2*pi*[697 770 852 941]; y= 2*pi*[1209 1336 1477 1633]; t=[0:1/fs:T]' tx=[sin(x(1)*t),sin(x(2)*t),sin(x(3)*t),sin(x(4)*t)]/2;
- 58. DSPLAB Dept ECE Page 58 ty=[sin(y(1)*t),sin(y(2)*t),sin(y(3)*t),sin(y(4)*t) ]/2; for k=1:length(number) switch number(k) case '1' tone = tx(:,1)+ty(:,1); sound(tone); stem(tone); case '2' tone = tx(:,1)+ty(:,2); sound(tone); stem(tone); case '3' tone = tx(:,1)+ty(:,3); sound(tone); stem(tone); case '4' tone = tx(:,2)+ty(:,1); sound(tone); stem(tone); otherwise disp('invalid number'); end pause(2.70 ) end; OUTPUT:- Input: 01234
- 59. DSPLAB Dept ECE Page 59
- 60. DSPLAB Dept ECE Page 60
- 61. DSPLAB Dept ECE Page 61 RESULT:- Dual Tone Multiple Frequency (DTMF) Signals are generated by using MAT LAB.
- 62. DSPLAB Dept ECE Page 62 EXERCISE PROGRAM:- 1. Write a matlab program to generate a sine wave with amplitude = 3, frequency 20Hz? 2. Write a matlab program to generate a cos wave with amplitude = 3, frequency 20Hz? 3. Write a matlab program to generate a triangular wave with amplitude = 8, frequency 10Hz? 4. Write a matlab program to generate a square wave with amplitude = 2, frequency 10kHz? 5. Write a matlab program to generate a sinc wave with amplitude = -8, frequency5Khz? 6. Write a matlab program to generate a sine wave with amplitude = 7, frequency 29Hz. 7. Write a matlab program to generate a cos wave with amplitude = 9, frequency 50Hz. 8. Write a matlab program to generate a triangular wave with amplitude = 24, frequency 100Hz. 9. Write a matlab program to generate a square wave with amplitude = 12, frequency 10kHz. 10. Write a matlab program to generate a sinc wave with amplitude = 5, frequency5Khz. VIVA QUESTIONS:- 1. Define Signal? 2. Define determistic and Random Signal? 3. Define Delta Function? 4. What is Signal Modeling? 5. Define Periodic and a periodic Signal? EXPERMENT NO-12 INTERPOLATION
- 63. DSPLAB Dept ECE Page 63 AIM: - The objective of this program is To Perform up sampling on the Given Input Sequence. SOFTWARE REQURIED:- 1. MATLAB R2010a. 2. Windows XP SP2. THEORY:- Up sampling is interpolation, applied in the context of digital signal processing and sample rate conversion. When up sampling is performed on a sequence of samples of a continuous function or signal, it produces an approximation of the sequence that would have been obtained by sampling the signal at a higher rate (or density, as in the case of a photograph). For example, if compact disc audio is up sampled by a factor of 5/4, the resulting sample-rate increases from 44,100 Hz to 55,125 Hz. PROCEDURE:- Open MATLAB Open new M-file Type the program Save in current directory Compile and Run the program For the output see command window Figure window PROGRAM:- %interpolation% clc; clear all; close all; N=input('enter sample value'); n=0:N-1; L=input('enter up sampling factor'); x=sin(2*pi*0.043*n)+sin(2*pi*0.031*n); y=interp(x,L); subplot(2,1,1); stem(n,x(1:N)); xlabel('time'); ylabel('amp'); title('input sequence'); t=0:(N*L)-1; subplot(2,1,2); stem(t,y(1:N*L)); xlabel('time');
- 64. DSPLAB Dept ECE Page 64 ylabel('amp'); title('output sequence'); OUTPUT:- enter sample value50
- 65. DSPLAB Dept ECE Page 65 enter up sampling factor 0 5 10 15 20 25 30 35 40 45 50 -2 -1 0 1 2 time amp input sequence 0 50 100 150 200 250 -2 -1 0 1 2 time amp output sequence RESULT:- This MATLAB program has been written to perform interpolation on the Given
- 66. DSPLAB Dept ECE Page 66 Input Sequence. EXERCISE PROGRAM:- 1. Write a matlab program to illustrate the effect of anti-aliasing filter? 2. Write a matlab program to illustration of upsampling? 3. Write a matlab program to illustration of downsampling? 4. Write a matlab program to illustration of effect of upsampling in frequency domain? 5. Write a matlab program to illustration of effect of downsampling in frequency domain? 6. Write a matlab program to illustrate the concept of aliasing? 7. Write a matlab program to plot magnitude response of comb filter? 8. Write a matlab program to plot magnitude response of allpass filter? 9. Write a matlab program to plot magnitude & unwrapped phase response of two transfer functins? 10. Write a matlab program to design a filter that eliminates high frequency component in a CT signal? VIVA QUESTIONS:- 1. How aliasing can be avoided? 2. Which type of interpolation is used to reconstruct the signal? 3. What is aliasing? 4. Define interpolation? 5. What is pre-alias filter?
- 67. DSPLAB Dept ECE Page 67 EXPERMENT NO-13 DECIMATION AIM: - The objective of this program is To Perform Decimation on the Given Input Sequence. SOFTWARE REQURIED:- 1. MATLAB R2010a. 2. Windows XP SP2. THEORY:- In digital signal processing, decimation is the process of reducing the sampling rate of a signal. Complementary to interpolation, which increases sampling rate, it is a specific case of sample rate conversion in a multi-rate digital signal processing system. Decimation utilizes filtering to mitigate aliasing distortion, which can occur when simply down sampling a signal. A system component that performs decimation is called a decimator. PROCEDURE:- Open MATLAB Open new M-file Type the program Save in current directory Compile and Run the program For the output see command window Figure window PROGRAM:- %decimation% clc; clear all; close all; N=input('enter sample value'); n=0:N-1; m=input('enter down sampling factor'); x=sin(2*pi*0.043*n)+sin(2*pi*0.031*n); y=decimate(x,m,'fir'); subplot(2,1,1); stem(n,x(1:N)); xlabel('time'); ylabel('amp'); title('input sequence'); t=0:(N/m)-1; subplot(2,1,2); stem(t,y(1:N/m)); xlabel('time'); ylabel('amp'); title('output sequence');
- 68. DSPLAB Dept ECE Page 68 OUTPUT:- enter sample value65 enter down sampling factor3 0 10 20 30 40 50 60 70 -2 -1 0 1 2 time amp input sequence 0 2 4 6 8 10 12 14 16 18 20 -2 -1 0 1 2 time amp output sequence
- 69. DSPLAB Dept ECE Page 69 RESULT:- This MATLAB program has been written to perform Decimation on the Given Input Sequence. EXERCISE PROGRAM:- 1. Write a matlab program to illustrate the effect of anti-aliasing filter? 2. Write a matlab program to illustration of upsampling? 3. Write a matlab program to illustration of downsampling? 4. Write a matlab program to illustration of effect of upsampling in frequency domain? 5. Write a matlab program to illustration of effect of downsampling in frequency domain? 6. Write a matlab program to illustrate the concept of aliasing? 7. Write a matlab program to plot magnitude response of comb filter? 8. Write a matlab program to plot magnitude response of allpass filter? 9. Write a matlab program to plot magnitude & unwrapped phase response of two transfer functins? 10. Write a matlab program to design a filter that eliminates high frequency component in a CT signal? VIVA QUESTIONS:- 1. Define decimation? 2. Define multi rate signal processing? 3. What are the effects of coefficient quantization in FIR filters? 4. What is quantization process? 5. What is transmultiplexer? What is its use?
- 70. DSPLAB Dept ECE Page 70 EXPERMENT NO-14 IMPLEMENTATION OF I/D SAMPLING RATE CONVERTERS AIM: - To study sampling rate conversion by a rational form using MATLAB. SOFTWARE REQURIED:- 1. MATLAB R2010a. 2. Windows XP SP2. THEORY:- "Up sampling" is the process of inserting zero-valued samples between original samples to increase the sampling rate. (This is called "zero-stuffing".) Up sampling adds to the original signal undesired spectral images which are centered on multiples of the original sampling rate. "Interpolation", in the DSP sense, is the process of up sampling followed by filtering. (The filtering removes the undesired spectral images.) As a linear process, the DSP sense of interpolation is somewhat different from the "math" sense of interpolation, but the result is conceptually similar: to create "in-between" samples from the original samples. The result is as if you had just originally sampled your signal at the higher rate. PROCEDURE:- Open MATLAB Open new M-file Type the program Save in current directory Compile and Run the program For the output see command window Figure window PROGRAM:- % interpolation/dismation sampling % clc; clear all;close all; N=input('enter the sample value'); n=0:N-1; l=input('enter up sampling factor'); m=input('enter down sampling factor'); x=sin(2*pi*0.043*n)+sin(2*pi*0.03*n); y=resample(x,l,m); subplot(2,1,1); stem(n,x(1:N)); xlabel('time'); ylabel('amplitude'); title('input sequence'); t=0:(N*l/m)-1;
- 71. DSPLAB Dept ECE Page 71 subplot(2,1,2); stem(t,y(1:N*l/m)); xlabel('time'); ylabel('amplitude'); title('input sampling sequence');
- 72. DSPLAB Dept ECE Page 72 OUTPUT:- enter the sample value30 enter up sampling factor7 enter down sampling factor2 0 5 10 15 20 25 30 -2 -1 0 1 2 time amplitude input sequence 0 20 40 60 80 100 120 -2 -1 0 1 2 time amplitude input sampling sequence
- 73. DSPLAB Dept ECE Page 73 RESULT:- Thus sampling rate conversion by a rational form is performed using MATLAB. EXERCISE PROGRAM:- 1. Write a matlab program to illustrate the effect of anti-aliasing filter? 2. Write a matlab program to illustration of upsampling? 3. Write a matlab program to illustration of downsampling? 4. Write a matlab program to illustration of effect of upsampling in frequency domain? 5. Write a matlab program to illustration of effect of downsampling in frequency domain? 6. Write a matlab program to illustrate the concept of aliasing? 7. Write a matlab program to plot magnitude response of comb filter? 8. Write a matlab program to plot magnitude response of allpass filter? 9. Write a matlab program to plot magnitude & unwrapped phase response of two transfer functins? 10. Write a matlab program to design a filter that eliminates high frequency component in a CT signal? VIVA QUESTIONS:- 1. What is multi rate signal processing? 2. What is the need for anti-imaging filter after up sampling a signal? 3. What is the need for anti-imaging filter prior to down sampling? 4. Define down sampling? 5. What is meant by up sampling?
- 74. DSPLAB Dept ECE Page 74 EXPERMENT NO-15 AUDIO APPLICATIONS AIM: - To perform audio applications such as to plot a time & frequency display of microphone plus a cosine using DSP. EQUIPMENTS:- 1. Operating system-windows XP. 2. Software –cc studio 3. 3. Software-mat lab 6.5. 4. DSK 6713DSP Trainer kit. 5. USB cable. 6. Power Supply. PROGRAM:- Spectrogram-rdts-mtl-frequency analysis of signals using RDTX-MATLAB #include”dsk6713-aic23.h” //code-DSK support file Unit32fs=dsk6713-aic23freq-8Khz; //set sampling rate #include<rtdh.h> //RTDX support file #include<math.h> #include”hamming.cof” //Hamming window coefficients #define pts256 //# of points for FFT #define pi3.1415926538979 typedef struct {flot real,imag;}COMPLEX; Void FFT(COMPLEX*Y,int n); //FFT protype float iobuffer{PTS],iobuffer 1[PTS],a[PTS]; //input and output buffer float x[PTS]; // intermediate buffer short I; //general purpose index variable int j,k,l,curr_block=0; // index variables short buffercount=0; //number of new samples in iobuffer short flag=0; //set to 1 by ISR when buffer is full COMPLEX w[PTS]; //twiddle constants stored in w COMPLEX samples [PTS]; //primary working buffer RTDX_ Create output Channel(ochan); //create output channel C6x->PC Main() { For(i=0;i<PTS;i++) //set up twiddle constants in w { w[i].real=cos(2*PI*i/512.0); //Re component of twiddle constants w[i].imagl=sin(2*PI*i/512.0); //Im component of twiddle constants } Comm._intr(); //init DSK,code,McBSP While (!RTDX_is Outpu Enabled(&ochan)) //wait forPC to enable RTDX
- 75. DSPLAB Dept ECE Page 75 Puts(“nn Wating…”); //while waiting for(1=0;1<256;I++) a[I]=cos(2*3.14*1500*1/8000); for (k=0;k<5000;k++) //infinite loop { While (flag==0); //wait until iobuffer is full Flag=0; //reset flag For(i=0;I<PTS;i++) //swap buffer {iobuffer1[i]=iobuffer[i]+a[i]; Samples[i].real=h[i]*iobuffer1[i]; //multiply by Hamming window coeffs iobuffer 1[i]=x[i]; // process frame to iobuffer } For(i=0;i<PTS;i++) Samples[i].imag=0.0 //imag components=0 FFT(samples,PTS); //call C-coded FFT function For(i=0;i<PTS;i++) //compute square of FFT magnitude { X[i]=(samples[i].real*samp0les[i].real +samples[i].imag*samples[i].imag)/16;//FFT data scaling } RTDX_write(&ochan,x1,sizeof(x1)/2); //send 128 samples to PC } //end of infinite loop } // end of main Interrupt void c_int11() //ISR { Output_ sample ((short)(iobuffer[buffercount])); //out fromiobuffer Iobuffer[[buffercount++]=(short)(input_sample()); //input to iobuffer If(buffercount>=PTS) //if iobuffer full { Buffercount=0; /reinit buffercount Flag=1; //reset flag RESULT:- Thus audio application is performed & spectrogram of an input signal is plotted using MATLAB.
- 76. DSPLAB Dept ECE Page 76 EXPERMENT NO-16 NOISE REMOVAL AIM: - To add noise above 3kHz &then remove. EQUIPMENTS:- 1. Operating system-windows XP. 2. Software –cc studio 3. 3. Software-mat lab 6.5. 4. DSK 6713DSP Trainer kit. 5. USB cable. 6. Power Supply. 7. CRO. 8. Function Generator. THEORY:- Adaptive filters are best used in cases where signal conditions or system parameters are slowly Changing and the filter are to be adjusted to compensate for the change. The least mean squares (LMS) criterion is such algorithm that can be used to provide the strategy for adjusting the filter coefficient. . PROGRAM:- #include “NCefg.h” #include”dsk6713.h” #include” dsk6713_aic23.h” #define beta IE-13 //rate of convergence #define N 30 //adaptive FIR filter length-vary this parameter & observe float delay [N]; float w[N}; DSK6713_AIC23_Config config={ 0x0017, /*0 DSK6713_AIC23_LEFTINVOL Left line input channel volume*/ 0x0017, /*1 DSK6713_AIC23_RIGHTINVOL Right line input channel volume*/ 0x00d8, /*2 DSK6713_AIC23_LEFTINVOL Left channel headphone volume*/ 0x00d8, /*3 DSK6713_AIC23_RIGHTINVOL Right channel headphone volume*/ 0x0011, /*4 DSK6713_AIC23_ANAPATH Analog audio path control*/ 0x0000, /*5 DSK6713_AIC23_DIGPATH Digital audio path control*/ 0x0000, /*6 DSK6713_AIC23_POWERDOWN Power down control */ 0x0043, /*7DSK6713_AIC23_DIGIF Digital audio interface format*/ 0x0081, /*8DSK6713_AIC23_SAMPLERATE Sample rate control*/ 0x0001, /*9DSK6713_AIC23_DIGACT Digital interface activation */ }; /*main()-Main code routine, Initializes BSL and generates tone*/
- 77. DSPLAB Dept ECE Page 77 Void main() { DSK6713_AIC23_codecHandle hCodec; Int I_input,r_input,I_output,r_output,T; /*Initialize the board support library,must be called first*/ DSK6713_init(); hCodec=DSK6713_AIC23_openCodec(0,&config); /*start the code C*/ DSK6713_AIC23_setfreq(hCOde c,1); For(T=0:T<30:T++) //Initialize the adaptive FIR Coeffs=0 { w[T]=0; //init buffer for weights Delay[T]=0; ////init buffer for delay samples } While(1) {/*Read a sample to the left channel */ While(!DSK6713_AIC23_read(hCodec.&l_input)); {/*Read a sample to the right channel */ While(!DSK6713_AIC23_read(hCodec.&r_input)); l_output=(short int) adaptive_filter(l_input,r_input); l_output=r_output; While(!DSK6713_AIC23_write (hCodec.&l_output)); /*send output to the Left channel*/ While(!DSK6713_AIC23_write(hCodec.&r_output)); /*send output to the Right channel*/ } DSK6713_AIC23_closecodec(hcodec); /*close the codec*/ } RESULT:- Thus noise signal cancellation using adaptive filters is verified.
- 78. DSPLAB Dept ECE Page 78 EXPERMENT NO-17 IMPULSE RESPONSE AIM: - To find the impulse response of the given equation y(n)-y(n-1+0.9y(n-2)=x(n) SOFTWARE REQURIED:- 1.MATLAB R2010a. 2.Windows XP SP2. THEORY:- Second order systems are the systems or networks which contain two or more storage elements and have describing equations that are second order differential equations. The frequency response of second order filters is characterised by three filter parameters: the gain k, the corner frequency and the quality factor Q. PROCEDURE:- Open MATLAB Open new M-file Type the program Save in current directory Compile and Run the program For the output see command window Figure window PROGRAM:- %To find the impulse response of discrete time system %y(n)-y(n-1)+0.9y(n-2)=xn)% clc; clear all; close all; b=input('Enter the coefficeints of x(n):b='); a=input('Enter the coefficeints of x(n):a='); N=input('Enter the order of N ='); h=impz(b,a,N); n=0:N-1; subplot(2,1,1); stem(n,h); xlabel('discrete time'); ylabel('amplitude'); title('Impulse Response');
- 79. DSPLAB Dept ECE Page 79 subplot(2,1,2); zplane(b,a); xlabel('real axis'); ylabel('imaginary axis'); title('pole zero in z-plane'); OUTPUT:- Enter the coefficeints of x(n):b=[1] Enter the coefficeints of x(n):a=[1 -1 .9] Enter the order of N =2 0 0.1 0.2 0.3 0.4 0.5 0.6 0.7 0.8 0.9 1 0 0.5 1 discrete time amplitude Impulse Response -3 -2 -1 0 1 2 3 -1 -0.5 0 0.5 1 2 real axis imaginaryaxis pole zero in z-plane RESULT:-
- 80. DSPLAB Dept ECE Page 80 Hence the impulse response of the given system is performed. EXERCISE PROGRAM:- 1. Write a matlab program to find the frequency response of the following difference equation y(n)-7y(n-1)+9y(n-2)=3x(n)-2x(n-1)? 2. Write a matlab program to find the frequency response of the following difference equation 3y(n)+5y(n-1)=9x(n)? 3. Write a matlab program to find the frequency response of the following difference equation 9 y(n)-2y(n-1)+7y(n-2)-3y(n-3)=6x(n)+x(n-1)? 4. Write a matlab program to find the frequency response of the following difference equation 8y(n)+6y(n-1)=4x(n)+2x(n-1)? 5. Write a matlab program to find the frequency response of the following difference equation 3y(n)-8y(n-1)+9y(n-2)=9x(n)+5x(n-1) ? 6. Write a matlab program to find the frequency response of the following difference equation 6y(n)-5y(n-1)=9x(n)+5x(n-1) -7x(n-2)? 7. Write a matlab program to find the frequency response of the following difference equation 9y(n)-8y(n-1)+2y(n-2)=9x(n)-3x(n-1) ? 8. Write a matlab program to find the frequency response of the following difference equation 2y(n)-8y(n-1)=9x(n)+5x(n-1) ? 9. Write a matlab program to find the frequency response of the following difference equation 9y(n)-8y(n-1)+9y(n-2)=9x(n)+5x(n-1)-x(n-2) ? 10. Write a matlab program to find the frequency response of the following difference equation 3y(n)-8y(n-1)=7x(n)-3x(n-1) ? VIVA QUESTIONS:- 6. What is the commend to find phase angle? 7. What is the commend to find frequency response? 8. What is transition band? 9. What is the formula for Z-transform? 10. What is the relationship b/w impulse response& frequency response?
- 81. DSPLAB Dept ECE Page 81 1. INTRODUCTION TO DSP PROCESSORS A signal can be defined as a function that conveys information, generally about the state or behavior of a physical system. There are two basic types of signals viz Analog (continuous time signals which are defined along a continuum of times) and Digital (discrete-time). Remarkably, under reasonable constraints, a continuous time signal can be adequately represented by samples, obtaining discrete time signals. Thus digital signal processing is an ideal choice for anyone who needs the performance advantage of digital manipulation along with today‟s analog reality. Hence a processor which is designed to perform the special operations(digital manipulations) on the digital signal within very less time can be called as a Digital signal processor. The difference between a DSP processor, conventional microprocessor and a microcontroller are listed below. Microprocessor or General Purpose Processor such as Intel xx86 or Motorola 680xx family Contains - only CPU -No RAM -No ROM - No I/O ports -No Timer Microcontroller such as 8051 family Contains - CPU - RAM - ROM -I/O ports - Timer & - Interrupt circuitry Some Micro Controllers also contain A/D, D/A and Flash Memory DSP Processors such as Texas instruments and Analog Devices Contains - CPU - RAM - ROM - I/O ports - Timer Optimized for - Fast - Extended - Dual operand - Zero - Circular arithmetic precision fetch overhead loop buffering
- 82. DSPLAB Dept ECE Page 82 The basic features of a DSP Processor are Feature Use Fast-Multiply accumulate Most DSP algorithms, including filtering, transforms, etc. are multiplication- intensive Multiple – access Many data-intensive DSP operations require reading a memory program instruction and multiple data items during each architecture instruction cycle for best performance Specialized addressing modes Efficient handling of data arrays and first-in, first-out buffers in memory Specialized program control Efficient control of loops for many iterative DSP algorithms. Fast interrupt handling for frequent I/O operations. On-chip peripherals and I/O On-chip peripherals like A/D converters allow for small interfaces low cost system designs. Similarly I/O interfaces tailored for common peripherals allow clean interfaces to off- chip I/O devices. ARCHITECTUREOF6713 DSPPROCESSOR This chapter provides an overview of the architectural structure of the TMS320C67xx DSP, which comprises the central processing unit (CPU), memory, and on-chip peripherals. The C67xE DSPs use an advanced modified Harvard architecture that maximizes processing power with eight buses. Separate program and data spaces allow simultaneous access to program instructions and data, providing a high degree of parallelism. For example, three reads and one write can be performed in a single cycle. Instructions with parallel store and application-specific instructions fully utilize this architecture. In addition, data can be transferred between data and program spaces. Such Parallelism supports a powerful set of arithmetic, logic, and bit-manipulation operations that can all be performed in a single machine cycle. Also, the C67xx DSP includes the control mechanisms to manage interrupts, repeated operations, and function calling.
- 83. DSPLAB Dept ECE Page 83
- 84. DSPLAB Dept ECE Page 84 Bus Structure The C67xx DSP architecture is built around eight major 16-bit buses (four program/data buses and four address buses): _ The program bus (PB) carries the instruction code and immediate operands from program memory. _ Three data buses (CB, DB, and EB) interconnect to various elements, such as the CPU, data address generation logic, program address generation logic, on-chip peripherals, and data memory. _ The CB and DB carry the operands that are read from data memory. _ The EB carries the data to be written to memory. _ Four address buses (PAB, CAB, DAB, and EAB) carry the addresses needed for instruction execution. The C67xx DSP can generate up to two data-memory addresses per cycle using the two auxiliary register arithmetic units (ARAU0 and ARAU1). The PB can carry data operands stored in program space (for instance, a coefficient table) to the multiplier and adder for multiply/accumulate operations or to a destination in data space for data move instructions (MVPD and READA). This capability, in conjunction with the feature of dual-operand read, supports the execution of single- cycle, 3-operand instructions such as the FIRS instruction. The C67xx DSP also has an on-chip bidirectional bus for accessing on-chip peripherals. This bus is connected to DB and EB through the bus exchanger in the CPU interface. Accesses that use this bus can require two or more cycles for reads and writes, depending on the peripheral’s structure. Central Processing Unit (CPU) The CPU is common to all C67xE devices. The C67x CPU contains: _ 40-bit arithmetic logic unit (ALU) _ Two 40-bit accumulators _ Barrel shifter _ 17 × 17-bit multiplier _ 40-bit adder _ Compare, select, and store unit (CSSU) _ Data address generation unit _ Program address generation unit Arithmetic Logic Unit (ALU) The C67x DSP performs 2s-complement arithmetic with a 40-bit arithmetic logic unit (ALU) and two 40-bit accumulators (accumulators A and B). The ALU can also perform Boolean operations. The ALU uses these inputs: _ 16-bit immediate value _ 16-bit word from data memory _ 16-bit value in the temporary register, _ Two 16-bit words from data memory _ 32-bit word from data memory _ 40-bit word from either accumulator
- 85. DSPLAB Dept ECE Page 85 Accumulators Accumulators A and B store the output from the ALU or the multiplier/adder block. They can also provide a second input to the ALU; accumulator A can be an input to the multiplier/adder. Each accumulator is divided into three parts: Guard bits (bits 39–32) High- order word (bits 31–16) Low- order word (bits 15–0) Instructions are provided for storing the guard bits, for storing the high- and the low- order accumulator words in data memory, and for transferring 32-bit accumulator words in or out of data memory. Also, either of the accumulators can be used as temporary storage for the other. Barrel Shifter The C67x DSP barrel shifter has a 40-bit input connected to the accumulators or to data memory (using CB or DB), and a 40-bit output connected to the ALU or to data memory (using EB). The barrel shifter can produce a left shift of 0 to 31 bits and a right shift of 0 to 16 bits on the input data. The shift requirements are defined in the shift count field of the instruction, the shift count field (ASM) of status register ST1, or in temporary register T (when it is designated as a shift count register).The barrel shifter and the exponent encoder normalize the values in an accumulator in a single cycle. The LSBs of the output are filled with 0s, and the MSBs can be either zero filled or sign extended, depending on the state of the sign-extension mode bit (SXM) in ST1. Additional shift capabilities enable the processor to perform numerical scaling, bit extraction, extended arithmetic, and overflow prevention operations. Multiplier/Adder Unit The multiplier/adder unit performs 17 _ 17-bit 2s-complement multiplication with a 40- bit addition in a single instruction cycle. The multiplier/adder block consists of several elements: a multiplier, an adder, signed/unsigned input control logic, fractional control logic, a zero detector, a rounder (2s complement), overflow/saturation logic, and a 16-bit temporary storage register (T).
- 86. DSPLAB Dept ECE Page 86 2. VERIFY LINEAR CONVOLUTION AIM: - To perform linear convolution of two sequences EQUIPMENT REQUIRED:- Operating System – Windows XP Constructor - Simulator Software - CCStudio 3.3 & MATLAB 7.5 THEORY:- Convolution is a formal mathematical operation, just as multiplication, addition, and integration. Addition takes two numbers and produces a third number, while convolution takes two signals and produces a third signal. Convolution is used in the mathematics of many fields, such as probability and statistics. In linear systems, convolution is used to describe the relationship between three signals of interest: the input signal, the impulse response, and the output signal. In this equation, x1(k), x2(n-k) and y(n) represent the input to and output from the system at time n. Here we could see that one of the input is shifted in time by a value every time it is multiplied with the other input signal. Linear Convolution is quite often used as a method of implementing filters of various types. PROCEDURE: 1) Generate the first input sequence ‘x’. 2) Plot the sequence in discrete form. [Make use of stem( )] 3) Give some relevant names to x-axis and y-axis. 4) Generate second input sequence ‘y’. 5) Repeat steps (2) and (3) for second sequence ‘y’. 6) Use the inbuilt function ‘conv( )’ to compute linear convolution of ‘x’ and ‘y’. z = conv(x,y) 7) Plot the output sequence ‘z’. [Repeat steps 2 and 3] 8) Make use of subplot ( ) to plot the inputs and output sequences in a single window.
- 87. DSPLAB Dept ECE Page 87 PROGRAM: // Linear convolution program in c language using CCStudio #include<stdio.h> int x[15],h[15],y[15]; main() { int i,j,m,n; printf("n enter value for m"); scanf("%d",&m); printf("n enter value for n"); scanf("%d",&n); printf("Enter values for i/p x(n):n"); for(i=0;i<m;i++) scanf("%d",&x[i]); printf("Enter Values for i/p h(n) n"); for(i=0;i<n; i++) scanf("%d",&h[i]); // padding of zeros for(i=m;i<=m+n-1;i++) x[i]=0; for(i=n;i<=m+n- 1;i++) h[i]=0; /* convolution operation */ for(i=0;i<m+n-1;i++) { y[i]=0; for(j=0;j<=i;j++) { y[i]=y[i]+(x[j]*h[i-j]); } } //displaying the o/p for(i=0;i<m+n-1;i++) printf("n The Value of output y[%d]=%d",i,y[i]);
- 88. DSPLAB Dept ECE Page 88 OUTPUT: Enter value for m 4 Enter value for n 4 Enter values for i/p 1 2 3 4 Enter Values for n 1 2 3 4 The Value of output y[0]=1 The Value of output y[1]=4 The Value of output y[2]=10 The Value of output y[3]=20 The Value of output y[4]=25 The Value of output y[5]=24 The Value of output y[6]=16
- 89. DSPLAB Dept ECE Page 89 RESULT:- linear convolution of two sequences using CCStudio 3.3 is obtained. VIVA QUESTIONS:- 1. What is the purpose of using convolution? 2. Give the formula for calculating linear convolution? 3. What are the properties of convolution? 4. What is meant by discrete convolution? 5. Define linear system and give example?
- 90. DSPLAB Dept ECE Page 90 3. VERIFY CIRCULAR CONVOLUTION. AIM:- To perform circular convolution of two sequences using MATLAB & Code Composer Studio3.1. EQUIPMENT REQUIRED:- Operating System – Windows XP Constructor - Simulator Software - CCStudio 3.3 & MATLAB 7.5 THEORY:- Circular convolution is another way of finding the convolution sum of two input signals. It resembles the linear convolution, except that the sample values of one of the input signals is folded and right shifted before the convolution sum is found. Also note that circular convolution could also be found by taking the DFT of the two input signals and finding the product of the two frequency domain signals. The Inverse DFT of the product would give the output of the signal in the time domain which is the circular convolution output. The two input signals could have been of varying sample lengths. But we take the DFT of higher point, which ever signals levels to. For eg. If one of the signal is of length 256 and the other spans 51 samples, then we could only take 256 point DFT. So the output of IDFT would be containing 256 samples instead of 306 samples, which follows N1+N2 – 1 where N1 & N2 are the lengths 256 and 51 respectively of the two inputs. Thus the output which should have been 306 samples long is fitted into 256 samples. The 256 points end up being a distorted version of the correct signal. This process is called circular convolution. PROCEDURE:- 1. Generate the first input sequence „x‟. 2. Plot the sequence in discrete form. [Make use of stem( )] 3. Give some relavent names to x-axis and y-axis. 4. Generate second input sequence „h‟. 5. Repeat steps (2) and (3) for second sequence „h‟. 6. Find out the length of first sequence and store it in variable „n1‟. [Make use of length ( )] 7. Similarly find out the length of second sequence and store it in variable „n2‟. 9. Make the length of smaller sequence equal to the larger sequence by padding zeros to it. 11. Display and plot the convolved sequence. [Repeat steps (2) and (3)] 12. Make use of subplot to plot the inputs and output sequences in a single window. 13. Compare theoretical and practical values.
- 91. DSPLAB Dept ECE Page 91 PROGRAM USING CODE COMPOSER STUDIO 3.3 /* program to implement circular convolution */ #include<stdio.h> int m,n,x[30],h[30],y[30],i,j, k,x2[30],a[30]; void main() { printf(" Enter the length of the first sequencen"); scanf("%d",&m); printf(" Enter the length of the second sequencen"); scanf("%d",&n); printf(" Enter the first sequencen"); for(i=0;i<m;i++) scanf("%d",&x[i]); printf(" Enter the second sequencen"); for(j=0;j<n;j++) scanf("%d",&h[j]); if(m-n!=0) /*If length of both sequences are not equal*/ { if(m>n) /* Pad the smaller sequence with zero*/ { for(i=n;i<m;i++) h[i]=0; n=m; } for(i=m;i<n;i++) x[i]=0; m=n; } y[0]=0; a[0]=h[0];
- 92. DSPLAB Dept ECE Page 92 for(j=1;j<n;j++) /*folding h(n) to h(-n)*/ a[j]=h[n-j]; /*Circular convolution*/ for(i=0;i<n;i++) y[0]+=x[i]*a[i]; for(k=1;k<n;k++) { y[k]=0 ; /*circular shift*/ for(j=1;j<n;j++) x2[j]=a[j-1]; x2[0]=a[n-1]; for(i=0;i<n;i++) { a[i]=x2[i]; y[k]+=x[i]*x2[i]; } } /*displaying the result*/ printf(" The circular convolution isn"); for(i=0;i<n;i++) printf("%d t",y[i]); }
- 93. DSPLAB Dept ECE Page 93 OUTPUT:- Enter the length of the first sequence 4 Enter the length of the second sequence 3 Enter the first sequence 1 2 3 4 Enter the second sequence 1 2 3 The circular convolution is 18 16 10 16
- 94. DSPLAB Dept ECE Page 94 RESULT:- Circular Convolution of two sequences using CC Studio3.3 is obtained. VIVA QUESTIONS:- 1. What is the different between Circular and Linear convolution? 2. What is the function in MATLAB used for padding zeros to a sequence? If your sequence is, x = [1 2 3 4] and you want to pad zeros to it. How can you do that in MATLAB? 3. What is the use of following functions in MATLAB: i. length( ) ii. max( ) iii. min( ) 4. Give the steps to get the result of linear convolution from the method of circular convolution? 5. What is the circular convolution?
- 95. DSPLAB Dept ECE Page 95 4. DESIGN FIR FILTER (LP/HP) USING WINDOWING TECHNIQUE FIR FILTERS (LP/HP) USING WINDOWING TECHNIQUE a) Using Rectangular Window b) Using Bartlett Window c) Using Kaiser Window AIM:- To design of FIR( LP/HP) filters using rectangular window. EQUIPMENT REQUIRED:- Operating System – Windows XP Constructor - Simulator Software - CCStudio 3 & MATLAB 7.5 THEORY: A Finite Impulse Response (FIR) filter is a discrete linear time-invariant system whose output is based on the weighted summation of a finite number of past inputs. An FIR transversal filter structure can be obtained directly from the equation for discrete-time convolution. In this equation, x(k) and y(n) represent the input to and output from the filter at time n. h(n-k) is the transversal filter coefficients at time n. These coefficients are generated by using FDS (Filter Design Software or Digital filter design package). FIR – filter is a finite impulse response filter. Order of the filter should be specified. Infinite response is truncated to get finite impulse response. placing a window of finite length does this. Types of windows available are Rectangular, Barlett, Hamming, Hanning, Blackmann window etc. This FIR filter is an all zero filter. PROCEDURE:- 1. Enter the passband ripple (rp) and stopband ripple (rs). 2. Enter the passband frequency (fp) and stopband frequency (fs). 3. Enter the sampling frequency (f). 4. Calculate the analog passband edge frequency (wp) and stop band edge frequency (ws) wp=2*fp/f ws=2*fs/f 5. Calculate the order of the filter using the following formula, (-20log10 (rp.rs) –13) n= (14.6 (fs-fp)/f). [Use „ceil( )‟ for rounding off the value of „n‟ to the nearest integer] if „n‟ is an odd number, then reduce its value by „1‟. 6. Generate (n+1)th point window coefficients.For example boxcar(n+1) generates a rectangular window. y=boxcar(n+1) 7. Design an nth order FIR filter using the previously generated (n+1) length window function. b=fir1(n,wp,y)
- 96. DSPLAB Dept ECE Page 96 8. Find the frequency response of the filter by using „freqz( )‟ function. [h,o]=freqz(b,a,k) This function returns k-point complex frequency response vector „h‟ and k-point frequency vector „o‟ in radians/samples of the filter. H(eiw )= B(ejw ) = b(1)+b(2)e-jw +…………..b(m+1)e-jmw A(ejw ) a(1)+a(2)e-jw +………….a(n+1)e-jnw Where a, b are vectors containing the denominator and numerator coefficients. Here a=1. 9. Calculate the magnitude of the frequency response in decibels (dB). m= 20*log10(abs(h)) 10. Plot the magnitude response [magnitude in dB Vs normalized frequency (o/pi)] 11. Give relevant names to x- and y- axes and give an appropriate title for the plot. PROGRAM USING CODE COMPOSER STUDIO 3.3: #include<stdio.h> #include<math.h> #define pi 3.1415 int n,N,c; float wr[64],wt[64]; void main() { printf("n enter no. of samples,N= :"); scanf("%d",&N); printf("n enter choice of window functionn 1.rect n 2. triang n c= :"); scanf("%d",&c); printf("n elements of window function are:"); switch(c) { case 1: for(n=0;n<=N- 1;n++) { wr[n]=1; printf(" n wr[%d]=%f",n,wr[n]); } break ; case 2: for(n=0;n<=N-1;n++) { wt[n]=1-(2*(float)n/(N-1)); printf("n wt[%d]=%f",n,wt[n]); } break; } }
- 97. DSPLAB Dept ECE Page 97 RESULT: - By using windowing techniques (Bartlett, Rectangular, Blackman) the filters are designed. VIVA QUESTIONS:- 1. What are the uses of function ceil and for? 2. Define boxcar 3. Define Kaiser 4. Define Bartlett 5. What is an FIR system? Compare FIR and IIR system?
- 98. DSPLAB Dept ECE Page 98 5. IMPLEMENT IIR FILTER (LOW PASS & HIGH PASS) IIR FILTER (LP/HP) USING BUTTER WORTH (ANLOG & DIGITAL) FILTERS & CHEBYSHEV (DIGITAL) TYPE – I & II FILTERS AIM:- To design of Butterworth Digital (low pass & high pass) filter. EQUIPMENTS:- Operating System – Windows XP Constructor - Simulator Software - CCStudio 3 & MATLAB 7.5 THEORY:- The IIR filter can realize both the poles and zeroes of a system because it has a rational transfer function, described by polynomials in z in both the numerator and the denominator: Eq.2 The difference equation for such a system is described by the following: Eq .3 M and N are order of the two polynomials bk and ak are the filter coefficients. These filter coefficients are generated using FDS (Filter Design software or Digital Filter design package). IIR filters can be expanded as infinite impulse response filters. In designing IIR filters, cutoff frequencies of the filters should be mentioned. The order of the filter can be estimated using butter worth polynomial. That’s why the filters are named as butter worth filters. Filter coefficients can be found and the response can be plotted. PROCEDURE: 1. Enter the pass band ripple (rp) and stop band ripple (rs). 2. Enter the pass band frequency (fp) and stop band frequency (fs). 3. Get the sampling frequency (f). 4. Calculate the analog pass band edge frequencies, w1 and w2. w1 = 2*fp/f w2 = 2*fs/f 5. Calculate the order and 3dB cutoff frequency of the analog filter. [Make use of the following function] [n,wn]=buttord(w1,w2,rp,rs,’s’) 6. Design an nth order analog lowpass Butter worth filter using the following statement. [b,a]=butter(n,wn,’s’) 7. Find the complex frequency response of the filter by using ‘freqs( )’ function
- 99. DSPLAB Dept ECE Page 99 PROGRAM USING CODE COMPOSER STUDIO 3.3: //iirfilters #include<stdio.h> #include<math.h> int i,w,wc,c,N ; float H[100]; float mul(float, int); void main() { printf("n enter order of filter "); scanf("%d",& N); printf("n enter the cutoff freq "); scanf("%d",& wc); printf("n enter the choice for IIR filter 1. LPF 2.HPF "); scanf("%d",&c); switch(c) { case 1: for(w=0;w<100;w++) { H[w]=1/sqrt(1+mul((w/(float)wc),2*N)); printf("H[%d]=%fn",w,H[w]); } break;
- 100. DSPLAB Dept ECE Page 100 case 2: for(w=0;w<=100;w++) { H[w]=1/sqrt(1+mul((float)wc/w,2*N)); printf("H[%d]=%fn",w,H[w]); } break; } } float mul(float a,int x) { for(i=0;i<x-1;i++) a*=a; return(a); } OUTPUT:-
- 101. MLRITM DSP LAB Department of Electronics and Communication Engineering Page 101 RESULT: - Thus IIR (LP/HP) filter is designed using low pass Butterworth and chebyshev filters technique and verified using the DSP processor. VIVA QUESTIONS:- 1. What are the properties of chebyshev filter? 2. Define signal flow graph? 3. Draw the signal flow graph of first order digital filter? 4. What is advantage of cascade realization? 5. What is the main disadvantage of direct-form realization?