SlideShare a Scribd company logo
ECTOPIC FAT:
AN IMPORTANT FEATURE OF INTRA-
  ABDOMINAL OBESITY IN TYPE 2
          DIABETES
         Marja-Riitta Taskinen, MD, PhD
    Professor of Medicine, Division of Cardiology
            Helsinki University Hospital
                  Helsinki, Finland
What Is Ectopic Fat Accumulation?
                                 and/
       Caloric intake             or    Energy expenditure


                  Positive energy balance                  Lipid overflow into liver,
                                                         pancreas, muscle and heart


                                             FFA
     Inflamed
     adipose
     tissue

                     Imbalance between loading and export of lipids results
                             in ectopic fat accumulation at organs

                                                                          FFA: free fatty acids
Source: www.myhealthywaist.org
Why Is the Fatty Liver Dangerous for Cardiovascular Health Risk?

                                     Glucose
                                                       VLDL
                                                                            HDL
                                                                                            ALT
                                  The fatty liver :
                                  overproduction of
                                  cardiometabolic
                                                                             Fibrinogen
                                  risk factors
        Obesity                                          CRP
 Genetic predisposition
    Fat in the diet?                          PAI-1
       Fructose?
                                        FVII

                                                         ALT: alanine aminotransferase
                                                         CRP: C-reactive protein
                                                         FVII: factor VII
                                                         PAI-1: plasminogen activator inhibitor-1
 Source: www.myhealthywaist.org
Determination of Liver Fat Content Using Magnetic Resonance
          Spectroscopy
                                       Water peak


                                 Liver fat 6%                     Liver fat 28%


          Triglyceride peak


                                                Reproduced by permission of the American Diabetes Association. Copyright© 2000
                                                    American Diabetes Association. From Ryysy L et al. Diabetes 2000;49:749-58

Source: www.myhealthywaist.org
Regulation of Lipid Metabolism in the Liver


Free fatty
                                  De novo
acid flux                          lipogenesis
                                  Fatty acid
                                   oxidation
Dietary                           VLDL assembly
fatty acids


                                                   VLDL
                                                   secretion

Source: www.myhealthywaist.org
The Atherogenic Lipoprotein Triad


Lifestyle                                          Insulin resistance
                                                   Type 2 diabetes
                                        Large      FCH subjects
                                                   Low HDL subjects
                                        VLDL
Genes


                             Small,
                             dense    Increased                   HDL
                             LDL      CAD Risk

                                                  CAD: coronary artery disease
                                                  FCH: familial combined hyperlipidemia
  Source: www.myhealthywaist.org
Relationship Between VLDL1 Production Rate and Plasma
          VLDL1 Triglyceride (TG) Pools


                       VLDL1 TG production   600
                           (mg/kg/day)                 r=0.62, p<0.001

                                             400


                                             200


                                              0
                                                   0       10      20          30           40          50          60

                                                                VLDL1 TG pool (mg/kg)


              VLDL1 TG production rate is the predictor for VLDL1 TG pool size


                                                                        Adapted from Adiels M et al. Arterioscler Thromb Vasc Biol 2005;25:1697-703

Source: www.myhealthywaist.org
VLDL1 Triglyceride (TG) Production Is Linked With Detrimental
                                               Changes of LDL Size and HDL Cholesterol
VLDL1 TG production (mg/kg/day)


                                                                                                     VLDL1 TG production (mg/kg/day)
                                  600                                                                                                  600
                                                                             r=-0.56, p<0.005                                                                                    r=-0.64, p<0.001
                                  500                                                                                                  500

                                  400                                                                                                  400

                                  300                                                                                                  300

                                  200                                                                                                  200

                                  100                                                                                                  100

                                      0                                                                                                 0
                                          22     23       24       25   26   27    28   29      30                                       0.7          0.9       1.1        1.3        1.5        1.7

                                                                   LDL size (nm)                                                                          HDL cholesterol (mmol/l)


                                                                                                                                             Adapted from Adiels M et al. Diabetologia 2006;49:755-65

                                  Source: www.myhealthywaist.org
Relationship Between VLDL1 Triglyceride (TG) Production and
          Liver Fat Assessed Using Proton Spectroscopy


                                        600
                  VLDL1 TG production

                                                  r=0.58, p<0.01
                      (mg/kg/day)


                                        400


                                        200


                                         0
                                              0          5          10       15              20              25
                                                                   Liver fat (%)

              Liver fat content is the driving force for VLDL-TG overproduction

                                                                                   Adapted from Adiels M et al. Diabetologia 2006;49:755-65

Source: www.myhealthywaist.org
Defective Regulation of VLDL Metabolism by Insulin in Type 2
              Diabetic Patients
                                                                                  1000
                                                                                             VLDL1 apo B production
               FFA                    Oxidation


                                                                              mg/day
                                                  De novo lipogenesis
                                                                                       500          -51%
                              FA
Remnants                               TG
                                                                                        0
                    CE                                                                         Controls             Type 2
                                                                                                                    diabetes
Degradation
                          MTP                                                    VLDL1
                                                                        LPL
                                                           VLDL2                                       Apo B: apolipoprotein B
                    Apo B                                                                              CE: cholesteryl ester
                                                                                              LPL
                                                          LPL      VLDL2                               FA: fatty acid
                                                                                                       FFA: free fatty acids
                                              IDL          HL                                          HL: hepatic lipase
  Insulin fails to                                                                                    LPL: lipoprotein lipase
  suppress VLDL1 apo                                    IDL                                            MTP: microsomal triglyceride
  B production.                      LDL
                                             HL                                                              transfer protein
                                                                                                       TG: triglycerides
  Accumulation of
  VLDL1 particles.                          LDL

                                                    Small, dense                                Adapted from Malmströn R et al.
                                                    LDL                         Arterioscler Thromb Vasc Biol 1997;17:1454-64

    Source: www.myhealthywaist.org
Characteristics of the Subjects

                                                 Low liver fat                  High liver fat
                                                   (n=10)                          (n=10)

Body mass index (kg/m2)               26.0  2.9                                  28.4         3.6
Subcutaneous fat (cm3)               2150  730                                  2420          520
Intra-abdominal (visceral) fat (cm3) 1600  880                                  2480          860*
Liver fat (%)                          2.1  1.5                                  11.4         4.5***
M value (mg/kg/min)                    6.4  1.8                                   4.0         2.1*
Fasting triglycerides (mmol/l)         1.4  0.5                                   2.0         0.8
HDL cholesterol (mmol/l)               1.4  0.2                                   1.1         0.3**
LDL size (nm)                         26.6  0.8                                  25.3         1.1**

* p<0.05           ** p<0.01       *** p<0.001


                                                        Adapted from Adiels M et al. Diabetologia 2007;50:2356-65

  Source: www.myhealthywaist.org
High Liver Fat: Lack of VLDL1 Suppression in Response to Insulin


                                                       VLDL1 triglyceride production rate
                       % of total VLDL at baseline

                                                     100
                                                                        61%, p<0.01                     Low liver fat <5.5%
                                                     75                                                  High liver fat >5.5%


                                                     50


                                                     25


                                                       0
                                                           0    200       400        600
                                                                Time (minutes)


                                                                                 Adapted from Adiels M et al. Diabetologia 2007;50:2356-65

Source: www.myhealthywaist.org
Normal Production and Suppression of VLDL1 Particles
          in Normal Healthy Subjects by Insulin

Low liver fat                                  Insulin             Apo B: apolipoprotein B
                                                                   MTP: microsomal triglyceride transfer protein
                                                                   TG: triglycerides


                                          TG

                                    MTP

                                                                                           VLDL1
                                 Apo B
                                                         VLDL2
                                                                      VLDL2


                                                         Adapted from Adiels M et al. Diabetologia 2007;50:2356-65

Source: www.myhealthywaist.org
Overproduction and Dysregulation of VLDL1 Particles in Type 2
           Diabetes

 High liver fat                        Insulin
                                                                                Apo B: apolipoprotein B
                                                                                TG: triglycerides


                                  TG


                                                                                  VLDL1
                         Apo B
                                                 VLDL2

                                                             VLDL2


High liver fat is linked with hepatic insulin resistance and
overproduction of large VLDL particles

                                                     Adapted from Adiels M et al. Diabetologia 2007;50:2356-65

 Source: www.myhealthywaist.org
Why People With a Big Waist do not all Have Dyslipidemia?


                                            Metabolic
                                           syndrome?


                                                                                 Elevated VLDL1
                                                                                  concentrations


                         Insulin resistance?            Insulin resistance
   Normal                                                                             The
    lipid                                                                         atherogenic
   profile                  Intra-abdominal             Intra-abdominal              triad
                            (visceral) obesity          (visceral) obesity
                                                                             Low HDL        Small, dense
                                                                                            LDL particles


Source: www.myhealthywaist.org
Sources of Fatty Acids for Liver and VLDL Triglycerides (TG)

                                 FFA
                                               1
                                 POOL

                                                   STORAGE?
                                              FA
                         CM               2                                β-ox
                                     TG
                                                                          4
                                 2             LIVER
                                                 TG

                                 DNL          Apo B
                                                               5              VLDL               Apo B: apolipoprotein B
                                      3                                        TG                -ox: -oxidation
             GLUCOSE
                                                                                                 CM: chylomicron

                INSULIN                                                                          DNL: de novo lipogenesis
                                                                                                 FA: fatty acids
                                                                                                 FFA: free fatty acids


                                                    Adapted from Adiels M et al. Arterioscler Thromb Vasc Biol 2008;28:1225-36

Source: www.myhealthywaist.org
Whole-Body Palmitate Rate of Appearance in Obese Subjects
              Without and With Nonalcoholic Fatty Liver Disease (NAFLD)

                    Palmitate rate of appearence                                           *
                                                                                                                  Normal IHTG
                                                                                                                  NAFLD
                           (µmol/minute)


                                                                 n=14                   n=14


                                                   Liver fat (%) 3.4    0.4         22.7        2.0
                                                   BMI (kg/m2) 35.3     1.3         36.8        1.2
*Significantly different from the normal IHGT group, p<0.05                                                IHTG: intrahepatic triglycerides


                  The rate of the release of fatty acids from adipose tissue is increased
                  in obese subjects with NAFLD

                                                                              Adapted from Fabbrini E et al. Gastroenterology 2008;134:424-31

    Source: www.myhealthywaist.org
VLDL Triglyceride (TG) Secretion Rate Is Increased in Obese
           Subjects With Nonalcoholic Fatty Liver Disease (NAFLD)

                                  30
                                                                     *                    Systemic plasma FFA
                                  25
                                                                                          Nonsystemic fatty acids
                                                                     *
                  (µmol/minute)

                                  20

                                  15

                                  10

                                  5
                                                                     *
                                  0     Normal IHGT             NAFLD
                                                                                               BMI: body mass index
                        Liver fat (%) 3.4        0.4          22.7       2.0
                        BMI (kg/m2) 35.3         1.3          36.8       1.2                   FFA: free fatty acids
                                                                                               IHTG: intrahepatic triglycerides
*Significantly different from the normal IHGT group, p<0.05

               Fatty acids derived from nonsystemic sources are the major factors
               responsible for the increase in VLDL TG secretion

                                                                Adapted from Fabbrini E et al. Gastroenterology 2008;134:424-31

 Source: www.myhealthywaist.org
Sources of Fatty Acids for Liver Fat and VLDL Triglycerides

 Increased rate of free fatty acid flux from adipose tissue
  results in increased rate of hepatic free fatty acid uptake.

 Intrahepatic de novo lipogenesis is enhanced in subjects
  with nonalcoholic fatty liver disease (NAFLD).

 The production and secretion of large VLDL particles
  correlate with liver fat content.

 Basal hepatic lipid oxidation seems to be unaltered in
  subjects with NAFLD.

           Overproduction of VLDL particles is NOT able to
           adequately compensate for increase of hepatic
           triglyceride production liver fat accumulation
Regulation of DNL by SREBP1-C, ChREBP and LXRs in Liver


                                              ACC: acetyl-CoA carboxylase
                                              ChREBP: carbohydrate-responsive element-binding protein
                                              DGAT: diacylglycerol acyltransferase
                                              DNL: de novo lipogenesis
                                              ELOVL6: long-chain elongase
                                              FAS: fatty acid synthase
                                              GK: glucokinase
                                              GPAT: mitochondrial glycerol 3-phosphate acyltransferase
                                              L-PK: liver-pyruvate kinase
                                              LXR: liver X receptors
                                              SCD1: stearoyl-CoA desaturase
                                              SREBP-1: sterol regulatory element-binding protein 1
                                              TG: triglycerides


                                        Adapted from Postic C and Girard J. J Clin Invest 2008;118:829-38

Source: www.myhealthywaist.org
Mechanisms Leading to Insulin Resistance in the Liver
                                                                                       Akt: protein kinase B
                                                                                       DAG: diacylglycerol
                                                                                       FA: fatty acids

                                                      Acylcarnitine                    LPA: lysophosphatidic acid
                                                                                       mTOR: mammalian target of rapamycin
FA         TG                                                                          NFkB: nuclear factor-kappa B
                                                       Fatty acyl-CoA
                                                                                       PA: phosphatidic acid
                                                                β-oxidation            PKC: protein kinase C
                                                         Acetyl-CoA                    TG: triglycerides
     FA
                                                CO2
                   Fatty acyl-CoA                                                    Ketones
                                              Ceramide
                                                                                   Acylcarnitines
                 G-3-P

                             LPA                                  Akt
                   Fatty
                 acyl-CoA
                                               NFĸB
                                               PKC
                                                                                               ?
                                  PA           mTOR


                                       DAG                       Insulin resistance

                                     Fatty      TG
                                   acyl-CoA


                                                                 Adapted from Fabbrini E et al. Hepatology 2010;51:679-89

 Source: www.myhealthywaist.org
Consequences of Ectopic Fat Accumulation: Insulin Resistance,
          Dyslipidemia, NAFLD and Left Ventricular Dysfunction
                                      FFA                Glucose production                                Glucose
Subcutaneous
     fat
                                                          Oxidation
                                                                                             ChREBP
                                                                                             SREBP-1c
                                 Intra-abdominal    FFA           DNL
                                   (visceral) fat


                                                             TG
                                    FFA             TG
                                                                                                   Insulin
                                                                                      Atherogenic
                                                                   VLDL               dyslipidemia
                                                              CAD: coronary artery disease
         LV dysfunction
                                                              ChREBP-1c: carbohydrate-responsive element-binding protein-1c
         CAD risk factor?               Glucose uptake        DNL: de novo lipogenesis
                                                              FFA: free fatty acids
                                                              NAFLD: nonalcoholic fatty liver disease
                                                              SREBP-1: sterol regulatory element-binding protein 1
                                                              TG: triglycerides

                                                                  Adapted from Fabbrini E et al. Hepatology 2010;51:679-89

Source: www.myhealthywaist.org
Fat in Cardiomyocyte

Low myocardial                                        High myocardial
TG content                                            TG content              CH2

                H2O
                                                               H2O

                                                                                          CH3

                   • Adapted from McGavock JM et al.
                     Circulation 2007; 116: 1170-5 x 50
                                  CH2 + CH3


            6        5        4   3     2     1   0        6    5    4    3   2     1     0
                              ppm                                     ppm
                                                                                    TG: triglycerides


 Source: www.myhealthywaist.org
Cardiac Steatosis – a Component of Ectopic Fat

                                               Lean   Obese   Impaired glucose tolerance        Type 2 diabetes


                                             1.2                                                          *
                  Myocardial triglycerides


                                                                                      *
                                             1.0
                       (fat/water )


                                             0.8

                                             0.6

                                             0.4

                                             0.2

                                             0.0
     Intra-abdominal 54 ± 39                                  120 ± 53*      132 ± 36*          160 ± 65*
  (visceral) fat (cm2)
Hepatic fat (fat/water) 1.1 ± 0.9                             4.3 ± 5.2      8.3 ± 11.1*         8.9 ± 8.8*
                                                                                                                     *p<0.05 vs. lean

                                                                              Adapted from McGavock JM et al. Circulation 2007;116:1170-5

Source: www.myhealthywaist.org
Myocardial Fat and Coronary Heart Disease


 Proton magnetic resonance spectroscopy is technically
  challenging but a powerful research tool.

 Is accumulation of myocardial triglycerides related to diastolic
  dysfunction?
  - More rigorous characterization of diastolic function needed.

 No data available on the relationship between myocardial fat
  and coronary heart disease.

 Determinants of myocardial triglyceride accumulation are
  largely unknown.

 Data on responses of myocardial triglycerides to
  pharmacological interventions are non-existing.
Why Is Ectopic Fat Accumulation a Health Hazard?
                                 and/
       Caloric intake             or    Energy expenditure


                  Positive energy balance                    Lipid overflow into liver,
                                                        pancreas, muscle and epicardium


                                             FFA
     Inflamed
     adipose
     tissue

                    Ectopic fat accumulation results in lipotoxicity at organ levels
                    with deleterious consequences at cardiovascular disease health.

                                                                            FFA: free fatty acids

Source: www.myhealthywaist.org
My Warmest Thanks to my Collaborators


  "Current players"              Gothenburg
  Anne Hiukka                    Martin Adiels
  Eeva Leinonen                  Jan Boren
  Sakari Mänttäri                Sven-Olof Olofsson
  Aino Soro-Paavonen
  Sanni Söderlund                Glasgow
  Jukka Westerbacka              Muriel Caslake
  Hannele Yki-Järvinen           Chris J. Packard
                                 Philip Steward

  "The ladies of the lab"        Imaging team
  Hannele Hilden                 Nina Lundbom
  Virve Naatti                   Jesper Lundbom
  Helinä Perttunen-Nio           Antti Hakkarainen
Ectopic Fat: An Important Feature of Intra-Abdominal Obesity in Type 2 Diabetes

More Related Content

PPT
ueda2012 ectopic fat-d.mohamed
PPTX
Imeglimin a new class a new approach for diabetes management
PDF
Medical Nutrition Therapy for Diabetes
PPTX
hypocalcemia endocrinology and metabolism.pptx
PPTX
PPTX
Ketogenic diets
PDF
Tips in a Diabetic Diet
PDF
Ueda2016 symposium - glimepiride journey in management of type 2 dm - megahe...
ueda2012 ectopic fat-d.mohamed
Imeglimin a new class a new approach for diabetes management
Medical Nutrition Therapy for Diabetes
hypocalcemia endocrinology and metabolism.pptx
Ketogenic diets
Tips in a Diabetic Diet
Ueda2016 symposium - glimepiride journey in management of type 2 dm - megahe...

What's hot (20)

PPT
Glycaemic Index- A key Factor in Diabetes Management
PPTX
Carbohydrate Counting
PDF
Renal nutrition
PPTX
Glp1 clinical view
PPTX
Carbohydrate Counting
PPT
CHO COUNTING
PPTX
Dyslipidemia
PPT
Importance Of Nutrition In Diabetes
PPTX
GLP1 Role : DM type 2
PPTX
Dpp4i earlier the better ! (1)
PPTX
Nutrient drug interaction
PPTX
SGLT2 inhibitor -A boon in uncontrolled dm
PPTX
Case Study Presentation
PPTX
Diabetes and nutritional managemant
PPTX
SGLT2 Endocrine CME Grand Rounds Final
PPT
Update on Management of Atherogenic Dyslipidemia of Insulin Resistance, Obesi...
PDF
The Role of SGLT 2 Inhibitors and GLP 1 Receptor Agonists and DPP 4 Inhibitors
PPTX
Glycemic index
PDF
Hyperlipidaemia
PPT
obesity diabetes and metabolic syndrome
Glycaemic Index- A key Factor in Diabetes Management
Carbohydrate Counting
Renal nutrition
Glp1 clinical view
Carbohydrate Counting
CHO COUNTING
Dyslipidemia
Importance Of Nutrition In Diabetes
GLP1 Role : DM type 2
Dpp4i earlier the better ! (1)
Nutrient drug interaction
SGLT2 inhibitor -A boon in uncontrolled dm
Case Study Presentation
Diabetes and nutritional managemant
SGLT2 Endocrine CME Grand Rounds Final
Update on Management of Atherogenic Dyslipidemia of Insulin Resistance, Obesi...
The Role of SGLT 2 Inhibitors and GLP 1 Receptor Agonists and DPP 4 Inhibitors
Glycemic index
Hyperlipidaemia
obesity diabetes and metabolic syndrome
Ad

Viewers also liked (9)

PPT
Dm &amp; liver
PPTX
Clinical, laboratory and histological associations in clinical, laboratory an...
PPTX
Using nutrigenomics to study ranges and plasticity in homeostasis
PPTX
Diabetes and liver
PPTX
Nanjing 3 2013 Lecture "Nutrigenomics part 3"
PDF
Ueda2016 diabetes&amp;liver - ashraf talaat
PPTX
Nutrigenomics of the two hits: non-resolving metabolic and pro-inflammatory s...
PPTX
Fatty liver disease with Diabetes Mellitus [BANGLADESH]
PPTX
Non alcoholic fatty liver disease(NAFLD)
Dm &amp; liver
Clinical, laboratory and histological associations in clinical, laboratory an...
Using nutrigenomics to study ranges and plasticity in homeostasis
Diabetes and liver
Nanjing 3 2013 Lecture "Nutrigenomics part 3"
Ueda2016 diabetes&amp;liver - ashraf talaat
Nutrigenomics of the two hits: non-resolving metabolic and pro-inflammatory s...
Fatty liver disease with Diabetes Mellitus [BANGLADESH]
Non alcoholic fatty liver disease(NAFLD)
Ad

Similar to Ectopic Fat: An Important Feature of Intra-Abdominal Obesity in Type 2 Diabetes (20)

PDF
Dyslipidemia [Compatibility Mode]
PPT
Hyperlipidemia
PDF
The Metabolic Syndrome and Cardiovascular Risk
DOCX
Biochem 18.01.55(เช้า)
PDF
42 Lipids Diagram
KEY
Sindrome Metabolica
PPSX
Management Overview
PDF
Treatment dm dyslipidemia
PDF
Atglance
PDF
Disorders of lipid metabolism | Hypercholesterolemia | Atherosclerosis | Fatt...
PPTX
PPSX
Atorvastatin & dyslipidemia
PDF
HDL: Where are we and where are we going?
PPTX
Salter Aberystwyth 2011
PPT
Barterv1 12b01-110223082825-phpapp01 (1)
KEY
Metabolismo Intermedio
PPT
Telmisartan+statin
PDF
Analysis of Metabolism Research
PPT
Plasma lipid transport - Role of HDL
PDF
Correlations between Some Anthropometric Parameters, the Lipid Profile and Gl...
Dyslipidemia [Compatibility Mode]
Hyperlipidemia
The Metabolic Syndrome and Cardiovascular Risk
Biochem 18.01.55(เช้า)
42 Lipids Diagram
Sindrome Metabolica
Management Overview
Treatment dm dyslipidemia
Atglance
Disorders of lipid metabolism | Hypercholesterolemia | Atherosclerosis | Fatt...
Atorvastatin & dyslipidemia
HDL: Where are we and where are we going?
Salter Aberystwyth 2011
Barterv1 12b01-110223082825-phpapp01 (1)
Metabolismo Intermedio
Telmisartan+statin
Analysis of Metabolism Research
Plasma lipid transport - Role of HDL
Correlations between Some Anthropometric Parameters, the Lipid Profile and Gl...

More from My Healthy Waist (19)

PPTX
Global Sugar-Sweetened Beverage Sale Barometer
PPTX
Targeting abdominal obesity in diabetology: What can we do about it?
PPTX
Lifestyle modification in the prevention of type 2 diabetes: The experience w...
PPTX
Hypertrophic obesity is associated with type 2 diabetes and impaired adipogen...
PPTX
Clinical Management of CVD Risk in Abdominal Obesity and Type 2 Diabetes Targ...
PPTX
Global dimensions of sugary beverages in programmatic and policy solutions.
PPT
Physical Activity in the Management of Abdominal Obesity
PPT
Managing cardiometabolic risk
PPT
Fatty acid metabolism in humans
PPT
Metabolic syndrome and adipose tissue
PPT
Role of the dysregulated endocannabinoid system in determining cardiometaboli...
PPT
Abdominal obesity, intra-abdominal adiposity and related cardiometabolic risk...
PPT
The concept of cardiometabolic risk
PPT
A simplified view of Victor Dzau´s cardiovascular continuum
PPT
Evaluating cardiometabolic risk
PPT
Raising HDL with drugs - does it work?
PPT
Sugar-sweetened beverage consumption in relation to diabetes and cardiovascul...
PPT
Metabolic syndrome: an Asian perspective
PPT
Impact of obesity on cardiometabolic risk: Will we lose the battle?
Global Sugar-Sweetened Beverage Sale Barometer
Targeting abdominal obesity in diabetology: What can we do about it?
Lifestyle modification in the prevention of type 2 diabetes: The experience w...
Hypertrophic obesity is associated with type 2 diabetes and impaired adipogen...
Clinical Management of CVD Risk in Abdominal Obesity and Type 2 Diabetes Targ...
Global dimensions of sugary beverages in programmatic and policy solutions.
Physical Activity in the Management of Abdominal Obesity
Managing cardiometabolic risk
Fatty acid metabolism in humans
Metabolic syndrome and adipose tissue
Role of the dysregulated endocannabinoid system in determining cardiometaboli...
Abdominal obesity, intra-abdominal adiposity and related cardiometabolic risk...
The concept of cardiometabolic risk
A simplified view of Victor Dzau´s cardiovascular continuum
Evaluating cardiometabolic risk
Raising HDL with drugs - does it work?
Sugar-sweetened beverage consumption in relation to diabetes and cardiovascul...
Metabolic syndrome: an Asian perspective
Impact of obesity on cardiometabolic risk: Will we lose the battle?

Ectopic Fat: An Important Feature of Intra-Abdominal Obesity in Type 2 Diabetes

  • 1. ECTOPIC FAT: AN IMPORTANT FEATURE OF INTRA- ABDOMINAL OBESITY IN TYPE 2 DIABETES Marja-Riitta Taskinen, MD, PhD Professor of Medicine, Division of Cardiology Helsinki University Hospital Helsinki, Finland
  • 2. What Is Ectopic Fat Accumulation? and/ Caloric intake or Energy expenditure Positive energy balance Lipid overflow into liver, pancreas, muscle and heart FFA Inflamed adipose tissue Imbalance between loading and export of lipids results in ectopic fat accumulation at organs FFA: free fatty acids Source: www.myhealthywaist.org
  • 3. Why Is the Fatty Liver Dangerous for Cardiovascular Health Risk? Glucose VLDL HDL ALT The fatty liver : overproduction of cardiometabolic Fibrinogen risk factors  Obesity CRP  Genetic predisposition  Fat in the diet? PAI-1  Fructose? FVII ALT: alanine aminotransferase CRP: C-reactive protein FVII: factor VII PAI-1: plasminogen activator inhibitor-1 Source: www.myhealthywaist.org
  • 4. Determination of Liver Fat Content Using Magnetic Resonance Spectroscopy Water peak Liver fat 6% Liver fat 28% Triglyceride peak Reproduced by permission of the American Diabetes Association. Copyright© 2000 American Diabetes Association. From Ryysy L et al. Diabetes 2000;49:749-58 Source: www.myhealthywaist.org
  • 5. Regulation of Lipid Metabolism in the Liver Free fatty  De novo acid flux lipogenesis  Fatty acid oxidation Dietary  VLDL assembly fatty acids VLDL secretion Source: www.myhealthywaist.org
  • 6. The Atherogenic Lipoprotein Triad Lifestyle  Insulin resistance  Type 2 diabetes Large  FCH subjects  Low HDL subjects VLDL Genes Small, dense Increased HDL LDL CAD Risk CAD: coronary artery disease FCH: familial combined hyperlipidemia Source: www.myhealthywaist.org
  • 7. Relationship Between VLDL1 Production Rate and Plasma VLDL1 Triglyceride (TG) Pools VLDL1 TG production 600 (mg/kg/day) r=0.62, p<0.001 400 200 0 0 10 20 30 40 50 60 VLDL1 TG pool (mg/kg) VLDL1 TG production rate is the predictor for VLDL1 TG pool size Adapted from Adiels M et al. Arterioscler Thromb Vasc Biol 2005;25:1697-703 Source: www.myhealthywaist.org
  • 8. VLDL1 Triglyceride (TG) Production Is Linked With Detrimental Changes of LDL Size and HDL Cholesterol VLDL1 TG production (mg/kg/day) VLDL1 TG production (mg/kg/day) 600 600 r=-0.56, p<0.005 r=-0.64, p<0.001 500 500 400 400 300 300 200 200 100 100 0 0 22 23 24 25 26 27 28 29 30 0.7 0.9 1.1 1.3 1.5 1.7 LDL size (nm) HDL cholesterol (mmol/l) Adapted from Adiels M et al. Diabetologia 2006;49:755-65 Source: www.myhealthywaist.org
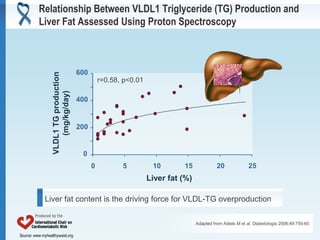
  • 9. Relationship Between VLDL1 Triglyceride (TG) Production and Liver Fat Assessed Using Proton Spectroscopy 600 VLDL1 TG production r=0.58, p<0.01 (mg/kg/day) 400 200 0 0 5 10 15 20 25 Liver fat (%) Liver fat content is the driving force for VLDL-TG overproduction Adapted from Adiels M et al. Diabetologia 2006;49:755-65 Source: www.myhealthywaist.org
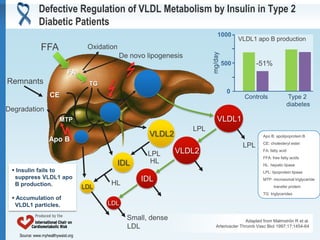
  • 10. Defective Regulation of VLDL Metabolism by Insulin in Type 2 Diabetic Patients 1000 VLDL1 apo B production FFA Oxidation mg/day De novo lipogenesis 500 -51% FA Remnants TG 0 CE Controls Type 2 diabetes Degradation MTP VLDL1 LPL VLDL2 Apo B: apolipoprotein B Apo B CE: cholesteryl ester LPL LPL VLDL2 FA: fatty acid FFA: free fatty acids IDL HL HL: hepatic lipase  Insulin fails to LPL: lipoprotein lipase suppress VLDL1 apo IDL MTP: microsomal triglyceride B production. LDL HL transfer protein TG: triglycerides  Accumulation of VLDL1 particles. LDL Small, dense Adapted from Malmströn R et al. LDL Arterioscler Thromb Vasc Biol 1997;17:1454-64 Source: www.myhealthywaist.org
  • 11. Characteristics of the Subjects Low liver fat High liver fat (n=10) (n=10) Body mass index (kg/m2) 26.0  2.9 28.4  3.6 Subcutaneous fat (cm3) 2150  730 2420  520 Intra-abdominal (visceral) fat (cm3) 1600  880 2480  860* Liver fat (%) 2.1  1.5 11.4  4.5*** M value (mg/kg/min) 6.4  1.8 4.0  2.1* Fasting triglycerides (mmol/l) 1.4  0.5 2.0  0.8 HDL cholesterol (mmol/l) 1.4  0.2 1.1  0.3** LDL size (nm) 26.6  0.8 25.3  1.1** * p<0.05 ** p<0.01 *** p<0.001 Adapted from Adiels M et al. Diabetologia 2007;50:2356-65 Source: www.myhealthywaist.org
  • 12. High Liver Fat: Lack of VLDL1 Suppression in Response to Insulin VLDL1 triglyceride production rate % of total VLDL at baseline 100  61%, p<0.01 Low liver fat <5.5% 75 High liver fat >5.5% 50 25 0 0 200 400 600 Time (minutes) Adapted from Adiels M et al. Diabetologia 2007;50:2356-65 Source: www.myhealthywaist.org
  • 13. Normal Production and Suppression of VLDL1 Particles in Normal Healthy Subjects by Insulin Low liver fat Insulin Apo B: apolipoprotein B MTP: microsomal triglyceride transfer protein TG: triglycerides TG MTP VLDL1 Apo B VLDL2 VLDL2 Adapted from Adiels M et al. Diabetologia 2007;50:2356-65 Source: www.myhealthywaist.org
  • 14. Overproduction and Dysregulation of VLDL1 Particles in Type 2 Diabetes High liver fat Insulin Apo B: apolipoprotein B TG: triglycerides TG VLDL1 Apo B VLDL2 VLDL2 High liver fat is linked with hepatic insulin resistance and overproduction of large VLDL particles Adapted from Adiels M et al. Diabetologia 2007;50:2356-65 Source: www.myhealthywaist.org
  • 15. Why People With a Big Waist do not all Have Dyslipidemia? Metabolic syndrome? Elevated VLDL1 concentrations Insulin resistance? Insulin resistance Normal The lipid atherogenic profile Intra-abdominal Intra-abdominal triad (visceral) obesity (visceral) obesity Low HDL Small, dense LDL particles Source: www.myhealthywaist.org
  • 16. Sources of Fatty Acids for Liver and VLDL Triglycerides (TG) FFA 1 POOL STORAGE? FA CM 2 β-ox TG 4 2 LIVER TG DNL Apo B 5 VLDL Apo B: apolipoprotein B 3 TG -ox: -oxidation GLUCOSE CM: chylomicron INSULIN DNL: de novo lipogenesis FA: fatty acids FFA: free fatty acids Adapted from Adiels M et al. Arterioscler Thromb Vasc Biol 2008;28:1225-36 Source: www.myhealthywaist.org
  • 17. Whole-Body Palmitate Rate of Appearance in Obese Subjects Without and With Nonalcoholic Fatty Liver Disease (NAFLD) Palmitate rate of appearence * Normal IHTG NAFLD (µmol/minute) n=14 n=14 Liver fat (%) 3.4 0.4 22.7 2.0 BMI (kg/m2) 35.3 1.3 36.8 1.2 *Significantly different from the normal IHGT group, p<0.05 IHTG: intrahepatic triglycerides The rate of the release of fatty acids from adipose tissue is increased in obese subjects with NAFLD Adapted from Fabbrini E et al. Gastroenterology 2008;134:424-31 Source: www.myhealthywaist.org
  • 18. VLDL Triglyceride (TG) Secretion Rate Is Increased in Obese Subjects With Nonalcoholic Fatty Liver Disease (NAFLD) 30 * Systemic plasma FFA 25 Nonsystemic fatty acids * (µmol/minute) 20 15 10 5 * 0 Normal IHGT NAFLD BMI: body mass index Liver fat (%) 3.4 0.4 22.7 2.0 BMI (kg/m2) 35.3 1.3 36.8 1.2 FFA: free fatty acids IHTG: intrahepatic triglycerides *Significantly different from the normal IHGT group, p<0.05 Fatty acids derived from nonsystemic sources are the major factors responsible for the increase in VLDL TG secretion Adapted from Fabbrini E et al. Gastroenterology 2008;134:424-31 Source: www.myhealthywaist.org
  • 19. Sources of Fatty Acids for Liver Fat and VLDL Triglycerides  Increased rate of free fatty acid flux from adipose tissue results in increased rate of hepatic free fatty acid uptake.  Intrahepatic de novo lipogenesis is enhanced in subjects with nonalcoholic fatty liver disease (NAFLD).  The production and secretion of large VLDL particles correlate with liver fat content.  Basal hepatic lipid oxidation seems to be unaltered in subjects with NAFLD. Overproduction of VLDL particles is NOT able to adequately compensate for increase of hepatic triglyceride production liver fat accumulation
  • 20. Regulation of DNL by SREBP1-C, ChREBP and LXRs in Liver ACC: acetyl-CoA carboxylase ChREBP: carbohydrate-responsive element-binding protein DGAT: diacylglycerol acyltransferase DNL: de novo lipogenesis ELOVL6: long-chain elongase FAS: fatty acid synthase GK: glucokinase GPAT: mitochondrial glycerol 3-phosphate acyltransferase L-PK: liver-pyruvate kinase LXR: liver X receptors SCD1: stearoyl-CoA desaturase SREBP-1: sterol regulatory element-binding protein 1 TG: triglycerides Adapted from Postic C and Girard J. J Clin Invest 2008;118:829-38 Source: www.myhealthywaist.org
  • 21. Mechanisms Leading to Insulin Resistance in the Liver Akt: protein kinase B DAG: diacylglycerol FA: fatty acids Acylcarnitine LPA: lysophosphatidic acid mTOR: mammalian target of rapamycin FA TG NFkB: nuclear factor-kappa B Fatty acyl-CoA PA: phosphatidic acid β-oxidation PKC: protein kinase C Acetyl-CoA TG: triglycerides FA CO2 Fatty acyl-CoA Ketones Ceramide Acylcarnitines G-3-P LPA Akt Fatty acyl-CoA NFĸB PKC ? PA mTOR DAG Insulin resistance Fatty TG acyl-CoA Adapted from Fabbrini E et al. Hepatology 2010;51:679-89 Source: www.myhealthywaist.org
  • 22. Consequences of Ectopic Fat Accumulation: Insulin Resistance, Dyslipidemia, NAFLD and Left Ventricular Dysfunction FFA Glucose production Glucose Subcutaneous fat Oxidation ChREBP SREBP-1c Intra-abdominal FFA DNL (visceral) fat TG FFA TG Insulin Atherogenic VLDL dyslipidemia CAD: coronary artery disease LV dysfunction ChREBP-1c: carbohydrate-responsive element-binding protein-1c CAD risk factor? Glucose uptake DNL: de novo lipogenesis FFA: free fatty acids NAFLD: nonalcoholic fatty liver disease SREBP-1: sterol regulatory element-binding protein 1 TG: triglycerides Adapted from Fabbrini E et al. Hepatology 2010;51:679-89 Source: www.myhealthywaist.org
  • 23. Fat in Cardiomyocyte Low myocardial High myocardial TG content TG content CH2 H2O H2O CH3 • Adapted from McGavock JM et al. Circulation 2007; 116: 1170-5 x 50 CH2 + CH3 6 5 4 3 2 1 0 6 5 4 3 2 1 0 ppm ppm TG: triglycerides Source: www.myhealthywaist.org
  • 24. Cardiac Steatosis – a Component of Ectopic Fat Lean Obese Impaired glucose tolerance Type 2 diabetes 1.2 * Myocardial triglycerides * 1.0 (fat/water ) 0.8 0.6 0.4 0.2 0.0 Intra-abdominal 54 ± 39 120 ± 53* 132 ± 36* 160 ± 65* (visceral) fat (cm2) Hepatic fat (fat/water) 1.1 ± 0.9 4.3 ± 5.2 8.3 ± 11.1* 8.9 ± 8.8* *p<0.05 vs. lean Adapted from McGavock JM et al. Circulation 2007;116:1170-5 Source: www.myhealthywaist.org
  • 25. Myocardial Fat and Coronary Heart Disease  Proton magnetic resonance spectroscopy is technically challenging but a powerful research tool.  Is accumulation of myocardial triglycerides related to diastolic dysfunction? - More rigorous characterization of diastolic function needed.  No data available on the relationship between myocardial fat and coronary heart disease.  Determinants of myocardial triglyceride accumulation are largely unknown.  Data on responses of myocardial triglycerides to pharmacological interventions are non-existing.
  • 26. Why Is Ectopic Fat Accumulation a Health Hazard? and/ Caloric intake or Energy expenditure Positive energy balance Lipid overflow into liver, pancreas, muscle and epicardium FFA Inflamed adipose tissue Ectopic fat accumulation results in lipotoxicity at organ levels with deleterious consequences at cardiovascular disease health. FFA: free fatty acids Source: www.myhealthywaist.org
  • 27. My Warmest Thanks to my Collaborators "Current players" Gothenburg Anne Hiukka Martin Adiels Eeva Leinonen Jan Boren Sakari Mänttäri Sven-Olof Olofsson Aino Soro-Paavonen Sanni Söderlund Glasgow Jukka Westerbacka Muriel Caslake Hannele Yki-Järvinen Chris J. Packard Philip Steward "The ladies of the lab" Imaging team Hannele Hilden Nina Lundbom Virve Naatti Jesper Lundbom Helinä Perttunen-Nio Antti Hakkarainen