Customer Intelligence: Using the ELK Stack to Analyze ForgeRock OpenAM Audit Data
Download as PPTX, PDF6 likes7,974 views

Warren Strange, Principal Systems Engineer, ForgeRock, presents a Breakout Session on the ELK Stack at the 2014 IRM Summit in Phoenix, Arizona.
1 of 20
Downloaded 170 times


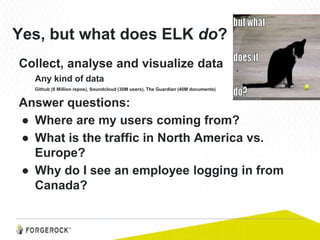


![filter {
if [type] == "amAccess" {
csv {
columns => [time,Data,LoginID,ContextID, IPAddr, LogLevel,
Domain, LoggedBy, MessageID, ModuleName, NameID,
HostName]
separator => " "
}
date {
match => ["time", "yyyy-MM-dd HH:mm:ss"]
}
geoip {
database => "/usr/share/GeoIP/GeoIP.dat"
source => ["IPAddr"]
}
}
}
Filter apply to type
Parse the data
as csv
Normalize the date to
a common format
Enrich the record
with GEO location](https://image.slidesharecdn.com/elkstack-elasticsearch-forgerock-summit-140611171357-phpapp02/85/Customer-Intelligence-Using-the-ELK-Stack-to-Analyze-ForgeRock-OpenAM-Audit-Data-14-320.jpg)


Ad
Recommended
Introduction to ELK
Introduction to ELKHarshakumar Ummerpillai This document introduces the ELK stack, which consists of Elasticsearch, Logstash, and Kibana. It provides instructions on setting up each component and using them together. Elasticsearch is a search engine that stores and searches data in JSON format. Logstash is an agent that collects logs from various sources, applies filters, and outputs to Elasticsearch. Kibana visualizes and explores the logs stored in Elasticsearch. The document demonstrates setting up each component and running a proof of concept to analyze sample log data.
ELK Stack
ELK StackPhuc Nguyen The document provides an introduction to the ELK stack, which is a collection of three open source products: Elasticsearch, Logstash, and Kibana. It describes each component, including that Elasticsearch is a search and analytics engine, Logstash is used to collect, parse, and store logs, and Kibana is used to visualize data with charts and graphs. It also provides examples of how each component works together in processing and analyzing log data.
Elk 
Elk Caleb Wang This document discusses the ELK stack, which consists of Elasticsearch, Logstash, and Kibana. It provides an overview of each component, including that Elasticsearch is a search and analytics engine, Logstash is a data collection engine, and Kibana is a data visualization platform. The document then discusses setting up an ELK stack to index and visualize application logs.
Elastic - ELK, Logstash & Kibana
Elastic - ELK, Logstash & KibanaSpringPeople ELK Stack workshop covers real-world use cases and works with the participants to - implement them. This includes Elastic overview, Logstash configuration, creation of dashboards in Kibana, guidelines and tips on processing custom log formats, designing a system to scale, choosing hardware, and managing the lifecycle of your logs.
Elk devops
Elk devopsIdeato La gestione dei log è da sempre un argomento complesso e nel tempo si sono cercate varie soluzioni più o meno complesse, spesso difficili da integrare nel proprio stack applicativo. Daremo un’ overview generale dei principali sistemi di aggregazione evoluta dei log in realtime (Fluentd, Greylog, eccetera) e illustreremo del motivo ci ha spinto a scegliere ELK per risolvere un’esigenza del nostro cliente; ovvero di consultare i log in modo piu comprensibile da persone non tecniche.
Lo stack ELK (Elasticsearch Logstash Kibana) permette agli sviluppatori di consultare i log in fase di debug / produzione senza avvalersi dello staff sistemistico. Dimostreremo come abbiamo eseguito il deployment dello stack ELK e lo abbiamo implementato per interpretare e strutturare
i log applicativi di Magento.
ELK Elasticsearch Logstash and Kibana Stack for Log Management
ELK Elasticsearch Logstash and Kibana Stack for Log ManagementEl Mahdi Benzekri Initiation to the powerful Elasticsearch Logstash and Kibana stack, it has many use cases, the popular one is the server and application log management.
What Is ELK Stack | ELK Tutorial For Beginners | Elasticsearch Kibana | ELK S...
What Is ELK Stack | ELK Tutorial For Beginners | Elasticsearch Kibana | ELK S...Edureka! ( ELK Stack Training - https://www.edureka.co/elk-stack-trai... )
This Edureka tutorial on What Is ELK Stack will help you in understanding the fundamentals of Elasticsearch, Logstash, and Kibana together and help you in building a strong foundation in ELK Stack. Below are the topics covered in this ELK tutorial for beginners:
1. Need for Log Analysis
2. Problems with Log Analysis
3. What is ELK Stack?
4. Features of ELK Stack
5. Companies Using ELK Stack
Logging with Elasticsearch, Logstash & Kibana
Logging with Elasticsearch, Logstash & KibanaAmazee Labs This document discusses logging with the ELK stack (Elasticsearch, Logstash, Kibana). It provides an overview of each component, how they work together, and demos their use. Elasticsearch is for search and indexing, Logstash centralizes and parses logs, and Kibana provides visualization. Tools like Curator help manage time-series data in Elasticsearch. The speaker demonstrates collecting syslog data with Logstash and viewing it in Kibana. The ELK stack provides centralized logging and makes queries like "check errors from yesterday between times" much easier.
Elastic Stack Introduction
Elastic Stack IntroductionVikram Shinde Getting Started with Elastic Stack.
Detailed blog for the same
http://vikshinde.blogspot.co.uk/2017/08/elastic-stack-introduction.html
Elk - An introduction
Elk - An introductionHossein Shemshadi So, what is the ELK Stack? "ELK" is the acronym for three open source projects: Elasticsearch, Logstash, and Kibana. Elasticsearch is a search and analytics engine. Logstash is a server‑side data processing pipeline that ingests data from multiple sources simultaneously, transforms it, and then sends it to a "stash" like Elasticsearch. Kibana lets users visualize data with charts and graphs in Elasticsearch.
Log analysis with the elk stack
Log analysis with the elk stackVikrant Chauhan This document discusses using the ELK stack (Elasticsearch, Logstash, Kibana) for log analysis. It describes the author's experience using Splunk and alternatives like Graylog and Elasticsearch before settling on the ELK stack. The key components - Logstash for input, Elasticsearch for storage and searching, and Kibana for the user interface - are explained. Troubleshooting tips are provided around checking that the components are running and communicating properly.
Elastic stack Presentation
Elastic stack PresentationAmr Alaa Yassen The document introduces the ELK stack, which consists of Elasticsearch, Logstash, Kibana, and Beats. Beats ship log and operational data to Elasticsearch. Logstash ingests, transforms, and sends data to Elasticsearch. Elasticsearch stores and indexes the data. Kibana allows users to visualize and interact with data stored in Elasticsearch. The document provides descriptions of each component and their roles. It also includes configuration examples and demonstrates how to access Elasticsearch via REST.
Introduction to Kibana
Introduction to KibanaVineet . The document discusses various components of the ELK stack including Elasticsearch, Logstash, Kibana, and how they work together. It provides descriptions of each component, what they are used for, and key features of Kibana such as its user interface, visualization capabilities, and why it is used.
Log analytics with ELK stack
Log analytics with ELK stackAWS User Group Bengaluru Log Analytics with ELK Stack describes optimizing an ELK stack implementation for a mobile gaming company to reduce costs and scale data ingestion. Key optimizations included moving to spot instances, separating logs into different indexes based on type and retention needs, tuning Elasticsearch and Logstash configurations, and implementing a hot-warm architecture across different EBS volume types. These changes reduced overall costs by an estimated 80% while maintaining high availability and scalability.
ELK introduction
ELK introductionWaldemar Neto This document discusses the ELK stack, which consists of Elasticsearch, Logstash, and Kibana. It describes each component and how they work together to parse, index, and visualize log data. Logstash is used to parse logs from various sources and apply filters before indexing the data into Elasticsearch. Kibana then allows users to visualize the indexed data through interactive dashboards and charts. The document also covers production deployments, monitoring, and security options for the ELK stack.
Centralized log-management-with-elastic-stack
Centralized log-management-with-elastic-stackRich Lee Centralized log management is implemented using the Elastic Stack including Filebeat, Logstash, Elasticsearch, and Kibana. Filebeat ships logs to Logstash which transforms and indexes the data into Elasticsearch. Logs can then be queried and visualized in Kibana. For large volumes of logs, Kafka may be used as a buffer between the shipper and indexer. Backups are performed using Elasticsearch snapshots to a shared file system or cloud storage. Logs are indexed into time-based indices and a cron job deletes old indices to control storage usage.
Introducing ELK
Introducing ELKAllBits BVBA (freelancer) This document introduces the (B)ELK stack, which consists of Beats, Elasticsearch, Logstash, and Kibana. It describes each component and how they work together. Beats are lightweight data shippers that collect data from logs and systems. Logstash processes and transforms data from inputs like Beats. Elasticsearch stores and indexes the data. Kibana provides visualization and analytics capabilities. The document provides examples of using each tool and tips for working with the ELK stack.
Log analysis using elk
Log analysis using elkRushika Shah Log Management
Log Monitoring
Log Analysis
Need for Log Analysis
Problem with Log Analysis
Some of Log Management Tool
What is ELK Stack
ELK Stack Working
Beats
Different Types of Server Logs
Example of Winlog beat, Packetbeat, Apache2 and Nginx Server log analysis
Mimikatz
Malicious File Detection using ELK
Practical Setup
Conclusion
The Elastic ELK Stack
The Elastic ELK Stackenterprisesearchmeetup The ELK stack is an open source toolset for data analysis that includes Logstash, Elasticsearch, and Kibana. Logstash collects and parses data from various sources, Elasticsearch stores and indexes the data for fast searching and analytics, and Kibana visualizes the data. The ELK stack can handle large volumes of time-series data in real-time and provides actionable insights. Commercial plugins are also available for additional functionality like monitoring, security, and support.
Elastic Stack ELK, Beats, and Cloud
Elastic Stack ELK, Beats, and CloudJoe Ryan Elastic Stack is a suite of open source tools for log analytics and data processing including Beats, Logstash, Elasticsearch, Kibana, Curator, and hosted cloud solutions.
Beats are lightweight data shippers that collect data from endpoints and send to Logstash or Elasticsearch. Logstash is used for data collection, transformation, and transport to Elasticsearch for storage and search. Kibana provides data visualization and dashboards. Curator manages Elasticsearch indices. The Elastic Stack can be self-hosted or used via cloud offerings.
Elk stack
Elk stackJilles van Gurp Jilles van Gurp presents on the ELK stack and how it is used at Linko to analyze logs from applications servers, Nginx, and Collectd. The ELK stack consists of Elasticsearch for storage and search, Logstash for processing and transporting logs, and Kibana for visualization. At Linko, Logstash collects logs and sends them to Elasticsearch for storage and search. Logs are filtered and parsed by Logstash using grok patterns before being sent to Elasticsearch. Kibana dashboards then allow users to explore and analyze logs in real-time from Elasticsearch. While the ELK stack is powerful, there are some operational gotchas to watch out for like node restarts impacting availability and field data caching
Fleet and elastic agent
Fleet and elastic agentIsmaeel Enjreny Elastic Agent is a single, unified way to add monitoring to systems and services through integrations. It is managed through Fleet, which provides a centralized UI for defining Elastic Agent policies that specify which integrations to run on which hosts. Fleet Server connects Elastic Agents to Fleet and handles distributing policies and collecting states. The Elastic Package Registry hosts integrations that can be used by Elastic Agent.
Redis + Apache Spark = Swiss Army Knife Meets Kitchen Sink
Redis + Apache Spark = Swiss Army Knife Meets Kitchen SinkDatabricks We want to present multiple anti patterns utilizing Redis in unconventional ways to get the maximum out of Apache Spark.All examples presented are tried and tested in production at Scale at Adobe. The most common integration is spark-redis which interfaces with Redis as a Dataframe backing Store or as an upstream for Structured Streaming. We deviate from the common use cases to explore where Redis can plug gaps while scaling out high throughput applications in Spark.
Niche 1 : Long Running Spark Batch Job – Dispatch New Jobs by polling a Redis Queue
· Why?
o Custom queries on top a table; We load the data once and query N times
· Why not Structured Streaming
· Working Solution using Redis
Niche 2 : Distributed Counters
· Problems with Spark Accumulators
· Utilize Redis Hashes as distributed counters
· Precautions for retries and speculative execution
· Pipelining to improve performance
HTTP Analytics for 6M requests per second using ClickHouse, by Alexander Boc...
HTTP Analytics for 6M requests per second using ClickHouse, by Alexander Boc...Altinity Ltd This document summarizes Cloudflare's use of ClickHouse to analyze over 6 million HTTP requests per second. Some key points:
- Cloudflare previously used PostgreSQL, Citus, and Flink but these did not scale sufficiently.
- ClickHouse was chosen as it is fast, scalable, fault tolerant, and Cloudflare had existing expertise in it.
- Cloudflare designed ClickHouse schemas to aggregate HTTP data into totals, breakdowns by category, and unique counts into two tables using different engines.
- Tuning ClickHouse index granularity improved query latency by 50% and throughput by 3x.
- The new ClickHouse pipeline is more scalable, fault tolerant
Introduction to elasticsearch
Introduction to elasticsearchhypto An introduction to elasticsearch with a short demonstration on Kibana to present the search API. The slide covers:
- Quick overview of the Elastic stack
- indexation
- Analysers
- Relevance score
- One use case of elasticsearch
The query used for the Kibana demonstration can be found here:
https://github.com/melvynator/elasticsearch_presentation
LDAP
LDAPChandanapriya Sathavalli LDAP (Lightweight Directory Access Protocol) is a protocol for accessing specialized databases called directories. LDAP is designed to be a standard way of providing access to directory services. Directories store information about entities in a hierarchical tree structure, with each entry having a unique distinguished name (DN) and attributes. The basic LDAP operations allow clients to authenticate, search, retrieve, add, modify and delete directory entries.
Kibana Tutorial | Kibana Dashboard Tutorial | Kibana Elasticsearch | ELK Stac...
Kibana Tutorial | Kibana Dashboard Tutorial | Kibana Elasticsearch | ELK Stac...Edureka! ( ELK Stack Training - https://www.edureka.co/elk-stack-trai... )
This Kibana tutorial by Edureka will give you an introduction to the Kibana 5 Dashboard and help you get started with working on the ELK Stack. Below are the topics covered in this Kibana tutorial video:
1. Introduction To ELK Stack
2. Role Of Kibana In ELK
3. Kibana 5 Dashboard
4. Demo: Kibana For Visualization & Analytics
Processing Large Datasets for ADAS Applications using Apache Spark
Processing Large Datasets for ADAS Applications using Apache SparkDatabricks Semantic segmentation is the classification of every pixel in an image/video. The segmentation partitions a digital image into multiple objects to simplify/change the representation of the image into something that is more meaningful and easier to analyze [1][2]. The technique has a wide variety of applications ranging from perception in autonomous driving scenarios to cancer cell segmentation for medical diagnosis.
Exponential growth in the datasets that require such segmentation is driven by improvements in the accuracy and quality of the sensors generating the data extending to 3D point cloud data. This growth is further compounded by exponential advances in cloud technologies enabling the storage and compute available for such applications. The need for semantically segmented datasets is a key requirement to improve the accuracy of inference engines that are built upon them.
Streamlining the accuracy and efficiency of these systems directly affects the value of the business outcome for organizations that are developing such functionalities as a part of their AI strategy.
This presentation details workflows for labeling, preprocessing, modeling, and evaluating performance/accuracy. Scientists and engineers leverage domain-specific features/tools that support the entire workflow from labeling the ground truth, handling data from a wide variety of sources/formats, developing models and finally deploying these models. Users can scale their deployments optimally on GPU-based cloud infrastructure to build accelerated training and inference pipelines while working with big datasets. These environments are optimized for engineers to develop such functionality with ease and then scale against large datasets with Spark-based clusters on the cloud.
Logstash-Elasticsearch-Kibana
Logstash-Elasticsearch-Kibanadknx01 This document describes how to use the ELK (Elasticsearch, Logstash, Kibana) stack to centrally manage and analyze logs from multiple servers and applications. It discusses setting up Logstash to ship logs from files and servers to Redis, then having a separate Logstash process read from Redis and index the logs to Elasticsearch. Kibana is then used to visualize and analyze the logs indexed in Elasticsearch. The document provides configuration examples for Logstash to parse different log file types like Apache access/error logs and syslog.
Sumo Logic QuickStart Webinar - Jan 2016
Sumo Logic QuickStart Webinar - Jan 2016Sumo Logic QuickStart your Sumo Logic service with this exclusive webinar. At these monthly live events you will learn how to capitalize on critical capabilities that can amplify your log analytics and monitoring experience while providing you with meaningful business and IT insights
Ad
More Related Content
What's hot (20)
Elastic Stack Introduction
Elastic Stack IntroductionVikram Shinde Getting Started with Elastic Stack.
Detailed blog for the same
http://vikshinde.blogspot.co.uk/2017/08/elastic-stack-introduction.html
Elk - An introduction
Elk - An introductionHossein Shemshadi So, what is the ELK Stack? "ELK" is the acronym for three open source projects: Elasticsearch, Logstash, and Kibana. Elasticsearch is a search and analytics engine. Logstash is a server‑side data processing pipeline that ingests data from multiple sources simultaneously, transforms it, and then sends it to a "stash" like Elasticsearch. Kibana lets users visualize data with charts and graphs in Elasticsearch.
Log analysis with the elk stack
Log analysis with the elk stackVikrant Chauhan This document discusses using the ELK stack (Elasticsearch, Logstash, Kibana) for log analysis. It describes the author's experience using Splunk and alternatives like Graylog and Elasticsearch before settling on the ELK stack. The key components - Logstash for input, Elasticsearch for storage and searching, and Kibana for the user interface - are explained. Troubleshooting tips are provided around checking that the components are running and communicating properly.
Elastic stack Presentation
Elastic stack PresentationAmr Alaa Yassen The document introduces the ELK stack, which consists of Elasticsearch, Logstash, Kibana, and Beats. Beats ship log and operational data to Elasticsearch. Logstash ingests, transforms, and sends data to Elasticsearch. Elasticsearch stores and indexes the data. Kibana allows users to visualize and interact with data stored in Elasticsearch. The document provides descriptions of each component and their roles. It also includes configuration examples and demonstrates how to access Elasticsearch via REST.
Introduction to Kibana
Introduction to KibanaVineet . The document discusses various components of the ELK stack including Elasticsearch, Logstash, Kibana, and how they work together. It provides descriptions of each component, what they are used for, and key features of Kibana such as its user interface, visualization capabilities, and why it is used.
Log analytics with ELK stack
Log analytics with ELK stackAWS User Group Bengaluru Log Analytics with ELK Stack describes optimizing an ELK stack implementation for a mobile gaming company to reduce costs and scale data ingestion. Key optimizations included moving to spot instances, separating logs into different indexes based on type and retention needs, tuning Elasticsearch and Logstash configurations, and implementing a hot-warm architecture across different EBS volume types. These changes reduced overall costs by an estimated 80% while maintaining high availability and scalability.
ELK introduction
ELK introductionWaldemar Neto This document discusses the ELK stack, which consists of Elasticsearch, Logstash, and Kibana. It describes each component and how they work together to parse, index, and visualize log data. Logstash is used to parse logs from various sources and apply filters before indexing the data into Elasticsearch. Kibana then allows users to visualize the indexed data through interactive dashboards and charts. The document also covers production deployments, monitoring, and security options for the ELK stack.
Centralized log-management-with-elastic-stack
Centralized log-management-with-elastic-stackRich Lee Centralized log management is implemented using the Elastic Stack including Filebeat, Logstash, Elasticsearch, and Kibana. Filebeat ships logs to Logstash which transforms and indexes the data into Elasticsearch. Logs can then be queried and visualized in Kibana. For large volumes of logs, Kafka may be used as a buffer between the shipper and indexer. Backups are performed using Elasticsearch snapshots to a shared file system or cloud storage. Logs are indexed into time-based indices and a cron job deletes old indices to control storage usage.
Introducing ELK
Introducing ELKAllBits BVBA (freelancer) This document introduces the (B)ELK stack, which consists of Beats, Elasticsearch, Logstash, and Kibana. It describes each component and how they work together. Beats are lightweight data shippers that collect data from logs and systems. Logstash processes and transforms data from inputs like Beats. Elasticsearch stores and indexes the data. Kibana provides visualization and analytics capabilities. The document provides examples of using each tool and tips for working with the ELK stack.
Log analysis using elk
Log analysis using elkRushika Shah Log Management
Log Monitoring
Log Analysis
Need for Log Analysis
Problem with Log Analysis
Some of Log Management Tool
What is ELK Stack
ELK Stack Working
Beats
Different Types of Server Logs
Example of Winlog beat, Packetbeat, Apache2 and Nginx Server log analysis
Mimikatz
Malicious File Detection using ELK
Practical Setup
Conclusion
The Elastic ELK Stack
The Elastic ELK Stackenterprisesearchmeetup The ELK stack is an open source toolset for data analysis that includes Logstash, Elasticsearch, and Kibana. Logstash collects and parses data from various sources, Elasticsearch stores and indexes the data for fast searching and analytics, and Kibana visualizes the data. The ELK stack can handle large volumes of time-series data in real-time and provides actionable insights. Commercial plugins are also available for additional functionality like monitoring, security, and support.
Elastic Stack ELK, Beats, and Cloud
Elastic Stack ELK, Beats, and CloudJoe Ryan Elastic Stack is a suite of open source tools for log analytics and data processing including Beats, Logstash, Elasticsearch, Kibana, Curator, and hosted cloud solutions.
Beats are lightweight data shippers that collect data from endpoints and send to Logstash or Elasticsearch. Logstash is used for data collection, transformation, and transport to Elasticsearch for storage and search. Kibana provides data visualization and dashboards. Curator manages Elasticsearch indices. The Elastic Stack can be self-hosted or used via cloud offerings.
Elk stack
Elk stackJilles van Gurp Jilles van Gurp presents on the ELK stack and how it is used at Linko to analyze logs from applications servers, Nginx, and Collectd. The ELK stack consists of Elasticsearch for storage and search, Logstash for processing and transporting logs, and Kibana for visualization. At Linko, Logstash collects logs and sends them to Elasticsearch for storage and search. Logs are filtered and parsed by Logstash using grok patterns before being sent to Elasticsearch. Kibana dashboards then allow users to explore and analyze logs in real-time from Elasticsearch. While the ELK stack is powerful, there are some operational gotchas to watch out for like node restarts impacting availability and field data caching
Fleet and elastic agent
Fleet and elastic agentIsmaeel Enjreny Elastic Agent is a single, unified way to add monitoring to systems and services through integrations. It is managed through Fleet, which provides a centralized UI for defining Elastic Agent policies that specify which integrations to run on which hosts. Fleet Server connects Elastic Agents to Fleet and handles distributing policies and collecting states. The Elastic Package Registry hosts integrations that can be used by Elastic Agent.
Redis + Apache Spark = Swiss Army Knife Meets Kitchen Sink
Redis + Apache Spark = Swiss Army Knife Meets Kitchen SinkDatabricks We want to present multiple anti patterns utilizing Redis in unconventional ways to get the maximum out of Apache Spark.All examples presented are tried and tested in production at Scale at Adobe. The most common integration is spark-redis which interfaces with Redis as a Dataframe backing Store or as an upstream for Structured Streaming. We deviate from the common use cases to explore where Redis can plug gaps while scaling out high throughput applications in Spark.
Niche 1 : Long Running Spark Batch Job – Dispatch New Jobs by polling a Redis Queue
· Why?
o Custom queries on top a table; We load the data once and query N times
· Why not Structured Streaming
· Working Solution using Redis
Niche 2 : Distributed Counters
· Problems with Spark Accumulators
· Utilize Redis Hashes as distributed counters
· Precautions for retries and speculative execution
· Pipelining to improve performance
HTTP Analytics for 6M requests per second using ClickHouse, by Alexander Boc...
HTTP Analytics for 6M requests per second using ClickHouse, by Alexander Boc...Altinity Ltd This document summarizes Cloudflare's use of ClickHouse to analyze over 6 million HTTP requests per second. Some key points:
- Cloudflare previously used PostgreSQL, Citus, and Flink but these did not scale sufficiently.
- ClickHouse was chosen as it is fast, scalable, fault tolerant, and Cloudflare had existing expertise in it.
- Cloudflare designed ClickHouse schemas to aggregate HTTP data into totals, breakdowns by category, and unique counts into two tables using different engines.
- Tuning ClickHouse index granularity improved query latency by 50% and throughput by 3x.
- The new ClickHouse pipeline is more scalable, fault tolerant
Introduction to elasticsearch
Introduction to elasticsearchhypto An introduction to elasticsearch with a short demonstration on Kibana to present the search API. The slide covers:
- Quick overview of the Elastic stack
- indexation
- Analysers
- Relevance score
- One use case of elasticsearch
The query used for the Kibana demonstration can be found here:
https://github.com/melvynator/elasticsearch_presentation
LDAP
LDAPChandanapriya Sathavalli LDAP (Lightweight Directory Access Protocol) is a protocol for accessing specialized databases called directories. LDAP is designed to be a standard way of providing access to directory services. Directories store information about entities in a hierarchical tree structure, with each entry having a unique distinguished name (DN) and attributes. The basic LDAP operations allow clients to authenticate, search, retrieve, add, modify and delete directory entries.
Kibana Tutorial | Kibana Dashboard Tutorial | Kibana Elasticsearch | ELK Stac...
Kibana Tutorial | Kibana Dashboard Tutorial | Kibana Elasticsearch | ELK Stac...Edureka! ( ELK Stack Training - https://www.edureka.co/elk-stack-trai... )
This Kibana tutorial by Edureka will give you an introduction to the Kibana 5 Dashboard and help you get started with working on the ELK Stack. Below are the topics covered in this Kibana tutorial video:
1. Introduction To ELK Stack
2. Role Of Kibana In ELK
3. Kibana 5 Dashboard
4. Demo: Kibana For Visualization & Analytics
Processing Large Datasets for ADAS Applications using Apache Spark
Processing Large Datasets for ADAS Applications using Apache SparkDatabricks Semantic segmentation is the classification of every pixel in an image/video. The segmentation partitions a digital image into multiple objects to simplify/change the representation of the image into something that is more meaningful and easier to analyze [1][2]. The technique has a wide variety of applications ranging from perception in autonomous driving scenarios to cancer cell segmentation for medical diagnosis.
Exponential growth in the datasets that require such segmentation is driven by improvements in the accuracy and quality of the sensors generating the data extending to 3D point cloud data. This growth is further compounded by exponential advances in cloud technologies enabling the storage and compute available for such applications. The need for semantically segmented datasets is a key requirement to improve the accuracy of inference engines that are built upon them.
Streamlining the accuracy and efficiency of these systems directly affects the value of the business outcome for organizations that are developing such functionalities as a part of their AI strategy.
This presentation details workflows for labeling, preprocessing, modeling, and evaluating performance/accuracy. Scientists and engineers leverage domain-specific features/tools that support the entire workflow from labeling the ground truth, handling data from a wide variety of sources/formats, developing models and finally deploying these models. Users can scale their deployments optimally on GPU-based cloud infrastructure to build accelerated training and inference pipelines while working with big datasets. These environments are optimized for engineers to develop such functionality with ease and then scale against large datasets with Spark-based clusters on the cloud.
Similar to Customer Intelligence: Using the ELK Stack to Analyze ForgeRock OpenAM Audit Data (20)
Logstash-Elasticsearch-Kibana
Logstash-Elasticsearch-Kibanadknx01 This document describes how to use the ELK (Elasticsearch, Logstash, Kibana) stack to centrally manage and analyze logs from multiple servers and applications. It discusses setting up Logstash to ship logs from files and servers to Redis, then having a separate Logstash process read from Redis and index the logs to Elasticsearch. Kibana is then used to visualize and analyze the logs indexed in Elasticsearch. The document provides configuration examples for Logstash to parse different log file types like Apache access/error logs and syslog.
Sumo Logic QuickStart Webinar - Jan 2016
Sumo Logic QuickStart Webinar - Jan 2016Sumo Logic QuickStart your Sumo Logic service with this exclusive webinar. At these monthly live events you will learn how to capitalize on critical capabilities that can amplify your log analytics and monitoring experience while providing you with meaningful business and IT insights
Sumo Logic "How to" Webinar: Advanced Analytics
Sumo Logic "How to" Webinar: Advanced AnalyticsSumo Logic So you've got the search and parsing basics down? Ready to learn more advanced operators? Join us and learn about:
LogReduce, LogCompare, Outlier, Predict, Join, Transaction and many more.
Elk with Openstack
Elk with OpenstackArun prasath Log analysis challenges include searching logs across multiple services and servers. The ELK stack provides a solution with Logstash to centralize log collection, Elasticsearch for storage and search, and Kibana for visualization. Logstash uses input, filter, and output plugins to collect, parse, and forward logs. Example configurations show using stdin and filters to parse OpenStack logs before outputting to Elasticsearch and Kibana for analysis and dashboards.
Elk presentation 2#3
Elk presentation 2#3uzzal basak This document provides an overview of the ELK stack architecture and its components. It discusses Elasticsearch for search and analytics, Logstash for data processing, and Kibana for data visualization. Beats are lightweight data shippers that send data from sources to Logstash or Elasticsearch. The document then focuses on Logstash, explaining that it ingests data from various sources, transforms it through filters like grok and mutate, and outputs it to destinations like Elasticsearch. It provides examples of Logstash configuration with Beats as the input, grok and lowercase filters, and Elasticsearch as the output.
How ElasticSearch lives in my DevOps life
How ElasticSearch lives in my DevOps life琛琳 饶 ElasticSearch is a flexible and powerful open source, distributed real-time search and analytics engine for the cloud. It is JSON-oriented, uses a RESTful API, and has a schema-free design. Logstash is a tool for collecting, parsing, and storing logs and events in ElasticSearch for later use and analysis. It has many input, filter, and output plugins to collect data from various sources, parse it, and send it to destinations like ElasticSearch. Kibana works with ElasticSearch to visualize and explore stored logs and data.
Strata Presentation: One Billion Objects in 2GB: Big Data Analytics on Small ...
Strata Presentation: One Billion Objects in 2GB: Big Data Analytics on Small ...randyguck Slides from my Strata+Hadoop 2015 Conference session titled: One Billion Objects in 2GB: Big Data Analytics on Small Clusters with Doradus OLAP. This talk describes the Doradus OLAP query/storage engine, which is an open source module that runs on top of the Cassandra NoSQL DB. Among the benefits of this service is fast data loading, a rich query language with full text and graph query features, and very dense data storage. See the Notes section for details on each slide.
Fluentd and Docker - running fluentd within a docker container
Fluentd and Docker - running fluentd within a docker containerTreasure Data, Inc. Fluentd is a data collection tool for unified logging that allows for extensible and reliable data collection. It uses a simple core with plugins to provide buffering, high availability, load balancing, and streaming data transfer based on JSON. Fluentd can collect log data from various sources and output to different destinations in a flexible way using its plugin architecture and configuration files. It is widely used in production for tasks like log aggregation, filtering, and forwarding.
Fluentd and Docker - running fluentd within a docker container
Fluentd and Docker - running fluentd within a docker containerTreasure Data, Inc. Walks through the basics of Fluentd, as run on Docker. Introduces a demo where fluentd is run in a docker container.
Azure Stream Analytics : Analyse Data in Motion
Azure Stream Analytics : Analyse Data in MotionRuhani Arora The document discusses evolving approaches to data warehousing and analytics using Azure Data Factory and Azure Stream Analytics. It provides an example scenario of analyzing game usage logs to create a customer profiling view. Azure Data Factory is presented as a way to build data integration and analytics pipelines that move and transform data between on-premises and cloud data stores. Azure Stream Analytics is introduced for analyzing real-time streaming data using a declarative query language.
What is going on?
Application Diagnostics on Azure - Copenhagen .NET User Group
What is going on?
Application Diagnostics on Azure - Copenhagen .NET User GroupMaarten Balliauw
We all like building and deploying cloud applications. But what happens once that’s done? How do we know if our application behaves like we expect it to behave? Of course, logging! But how do we get that data off of our machines? How do we sift through a bunch of seemingly meaningless diagnostics? In this session, we’ll look at how we can keep track of our Azure application using structured logging, AppInsights and AppInsights analytics to make all that data more meaningful.
Elk scilifelab
Elk scilifelabGuillermo Carrasco Hernández Presentation given on 2014-09-22 at Science For Life Laboratory in Stockholm, Sweden, about ELK stack.
«Что такое serverless-архитектура и как с ней жить?» Николай Марков, Aligned ...
«Что такое serverless-архитектура и как с ней жить?» Николай Марков, Aligned ...it-people The document discusses what serverless computing is and how it can be used for building applications. Serverless applications rely on third party services to manage server infrastructure and are event-triggered. Popular serverless frameworks like AWS Lambda, Google Cloud Functions, Microsoft Azure Functions, and Zappa allow developers to write code that runs in a serverless environment and handle events and triggers without having to manage servers.
Visualizing Big Data in Realtime
Visualizing Big Data in RealtimeDataWorks Summit This document provides an overview of Apache Apex and real-time data visualization. Apache Apex is a platform for developing scalable streaming applications that can process billions of events per second with millisecond latency. It uses YARN for resource management and includes connectors, compute operators, and integrations. The document discusses using Apache Apex to build real-time dashboards and widgets using the App Data Framework, which exposes application data sources via topics. It also covers exporting and packaging dashboards to include in Apache Apex application packages.
Data saturday malta - ADX Azure Data Explorer overview
Data saturday malta - ADX Azure Data Explorer overviewRiccardo Zamana This is a step-by-step approach the entire ecosystem of features driven by Azure Data eXplorer. You can find many examples using Kusto dialect, in order to acquire data, process and build up complete web interfaces using only one service: ADX.
Using Sumo Logic - Apr 2018
Using Sumo Logic - Apr 2018Sumo Logic Get Certified as a Sumo Power User!
Video: Video: https://www.sumologic.com/online-training/#Start
Designed for users, this series deep-dives into every aspect of analyzing your data. Run as a "how-to" webinar, this session walks viewers through data searching, filtering, parsing, and advanced analytics. This series concludes with "how to"details to create dashboards and alerts to monitor your data and get Sumo Logic to work for you.
ELK-Stack-Grid-KA-School.pptx
ELK-Stack-Grid-KA-School.pptxabenyeung1 The ELK stack consists of the three open source tools Elasticsearch, Logstash, and Kibana. Elasticsearch is a highly scalable search and analytics engine, Logstash is used to collect, process, and transport data, and Kibana provides visualization and exploration of data stored in Elasticsearch. The document discusses using the ELK stack for log data management, system monitoring, and other big data analysis tasks by centralized collection, normalization, and exploration of large datasets.
Berlin Buzz Words - Apache Drill by Ted Dunning & Michael Hausenblas
Berlin Buzz Words - Apache Drill by Ted Dunning & Michael HausenblasMapR Technologies An implementation Deep Dive on Apache Drill with use-cases and an Apache Drill demo. Given by Ted Dunning & Michael Hausenblas on June 2013.
Elasticsearch an overview
Elasticsearch an overviewAmit Juneja This document discusses Elasticsearch and provides examples of its real-world uses and basic functionality. It contains:
1) An overview of Elasticsearch and how it can be used for full-text search, analytics, and structured querying of large datasets. Dell and The Guardian are discussed as real-world use cases.
2) Explanations of basic Elasticsearch concepts like indexes, types, mappings, and inverted indexes. Examples of indexing, updating, and deleting documents.
3) Details on searching and filtering documents through queries, filters, aggregations, and aliases. Query DSL and examples of common queries like term, match, range are provided.
4) A discussion of potential data modeling designs for indexing user
Sherlock: an anomaly detection service on top of Druid 
Sherlock: an anomaly detection service on top of Druid DataWorks Summit Sherlock is an anomaly detection service built on top of Druid. It leverages EGADS (Extensible Generic Anomaly Detection System; github.com/yahoo/egads) to detect anomalies in time-series data. Users can schedule jobs on an hourly, daily, weekly, or monthly basis, view anomaly reports from Sherlock's interface, or receive them via email.
Sherlock has four major components: timeseries generation, EGADS anomaly detection, Redis backend and Spark Java UI. Timeseries generation involves building, validating, querying, parsing the Druid query. Parsed Druid response is then fed to EGADS anomaly detection component which detects and generates the anomaly reports for each input time-series data. Sherlock uses Redis backend to store jobs metadata, generated anomaly reports and persistent job queue for scheduling jobs, etc. Users can choose to have a clustered Redis or standalone Redis. Sherlock provides user interface built with Spark Java. The UI enables users to submit instant anomaly analysis, create, and launch detection jobs, view anomalies on a heatmap and on a graph. Jigarkumar Patel, Software Development Engineer I, Oath Inc. and, David Servose, Software Systems Engineer, Oath
Ad
More from ForgeRock (20)
Digital Identities in the Internet of Things - Securely Manage Devices at Scale
Digital Identities in the Internet of Things - Securely Manage Devices at ScaleForgeRock In this webcast, KuppingerCole´s Principal Analyst Martin Kuppinger will introduce the concept of Identity Management for the Internet of Things. Following Martin's opening talk, ForgeRock´s Gerhard Zehethofer will discuss how ForgeRock is now extending these capabilities into the areas of managed and unmanaged devices, enhancing the customer experience as well as security and privacy at scale for people, services, and things.
Get the Exact Identity Solution You Need - In the Cloud - AWS and Beyond
Get the Exact Identity Solution You Need - In the Cloud - AWS and BeyondForgeRock Containerized IAM on AWS and Beyond
The do’s and don’ts of running containerized Identity systems in the cloud and what it’s like to run and operate this type of solution
Identity Live Sydney: Identity Management - A Strategic Opportunity
Identity Live Sydney: Identity Management - A Strategic OpportunityForgeRock This document discusses identity management as a strategic opportunity. It identifies three concurrent imperatives: fixing today's issues with identity platforms and user experiences, enabling digital-first customer journeys, and embracing the future of consumer control and a connected society. Specifically, it notes the need to address high rates of failed IT projects, password fatigue, and limited customer experience improvements. It also discusses how identity management can help meet customer demands for single sign-on across channels, drive cost savings, and position companies to comply with emerging regulations and standards around privacy and an open, connected business environment.
Identity Live Singapore: Transform Your Cybersecurity Capability
Identity Live Singapore: Transform Your Cybersecurity CapabilityForgeRock This document discusses the need for organizations to transform their cyber security capabilities. It notes that the threat landscape and customer expectations around security and privacy have changed dramatically. Organizations must view security through the lens of customer experience in order to build trust and meet rising customer demands. The document argues that security leaders need skills in customer experience, communication, and strategic vision to successfully transform security and help their organizations advance digitally while protecting against modern threats.
Identity Live Singapore 2018 Keynote Presentation
Identity Live Singapore 2018 Keynote PresentationForgeRock This document discusses identity and the strategic value of identity for businesses. It highlights trends around customer experience, trust and consent. Regulations are expanding consumer rights over their own data. Digital identity is seen as a cornerstone of the digital economy and trusted access. Businesses need consistent identity to drive personalized services across internal, external and IoT areas. Identity provides the building blocks for trusted access, authentication and privacy.
Identity Live Sydney 2018 Keynote Presentation
Identity Live Sydney 2018 Keynote PresentationForgeRock This document discusses an event for ForgeRock and identity management. It thanks sponsors and introduces several speakers at the event: Steve Ferris, Fran Rosch, Robert Humphrey. Fran Rosch's presentation discusses how identity is at the heart of business relationships, compliance, security and customer experience. Robert Humphrey talks about trends in technology and the importance of omnichannel capabilities. The document emphasizes that with the power of digital identity comes great responsibility and that building trusted customer relationships requires focusing on identity, experience, privacy and consent.
Identity Live Singapore: Just Ask 'Em
Identity Live Singapore: Just Ask 'EmForgeRock This document discusses how organizations can build user trust through responsible data practices. It recommends that companies identify where digital transformation intersects with user trust risks, view personal data as a joint asset between the user and organization, prioritize obtaining user consent, and leverage identity and access management technologies to establish trust. The overarching message is that through security, privacy, and consent, companies can achieve user trust, which is key to their success.
Identity Live Singapore: Building Trust & Privacy in a Connected Society
Identity Live Singapore: Building Trust & Privacy in a Connected SocietyForgeRock This document discusses ForgeRock's identity and access management platform and upcoming releases. The 6.0 release focuses on powerful authentication orchestration through visual mapping of user journeys and dynamic personalization. It also includes platform-wide monitoring, progressive profiling, social attribute syncing, and performance improvements. The 6.5 release will focus on transforming the on-premise product to run in public cloud as a service, laying the groundwork for graph/machine learning and intelligent features, and delivering a performant, secure and feature-rich platform. Both releases aim to improve user experiences, security, and insights for businesses.
Identity Live Sydney: Intelligent Authentication 
Identity Live Sydney: Intelligent Authentication ForgeRock ForgeRock offers an intelligent authentication platform that enables relationships, access policies, and lifecycles across people, services, and things. It provides modern privacy and consent features, supports various compliance standards, and can run anywhere and scale to manage millions of relationships. The platform addresses challenges around siloed security solutions, outdated authentication methods, and inability to measure user interactions. It solves new use cases like giving users choice in authentication methods and varying login journeys based on context. The demo shows features like user choice, contextual personalization, responsive logins, and threat intelligence.
Identity Live Sydney: Building Trust and Privacy in a Connected Society
Identity Live Sydney: Building Trust and Privacy in a Connected SocietyForgeRock The document discusses ForgeRock's identity and access management platform and its focus on building trust and privacy in a connected society. It outlines ForgeRock's priorities around security, privacy, consent, relationships and making its platform IoT ready. It describes new features in ForgeRock 6.0 like authentication trees and predictive profiling, and themes for the 6.5 release around smarter identity, cloud/DevOps and performance. The document claims ForgeRock's platform enables organizations to quickly respond to customer demands, improves user experience through less intrusive logins, unifies security silos to reduce risk, and helps service providers and business leaders gain customer insights.
Get the Exact Identity Solution you Need in the Cloud - Deep Dive
Get the Exact Identity Solution you Need in the Cloud - Deep DiveForgeRock Containerized IAM on Amazon Web Services - Deep Dive
A deep technical look at the architecture behind running containerized IAM on AWS and what your team needs for a successful deployment
You’ll experience an in depth review of:
Assets and processes needed to containerize ForgeRock
Architecture and processes guiding containerized IAM on AWS
How containers are deployed into Kubernetes
Monitoring and management strategies
Continuous integration configuration
Get the Exact Identity Solution You Need - In the Cloud - Overview
Get the Exact Identity Solution You Need - In the Cloud - OverviewForgeRock Discover how running your IAM on AWS gives you the exact solution that you want with the operational model of a SaaS.
ForgeRock and Trusona - Simplifying the Multi-factor User Experience
ForgeRock and Trusona - Simplifying the Multi-factor User ExperienceForgeRock Authentication and MFA is no longer a one-mode-fits-all experience. Customer-centric companies need flexible intelligence models and simple, consistent login journeys across channels—web, call center, mobile—without being forced to bolt MFA on top of usernames and passwords. ForgeRock’s VP, Global Strategy and Innovation, Ben Goodman, and Trusona’s Chief Design Officer, Kevin Goldman, explain how ForgeRock combined with Trusona creates a broad range of multi-factor authentication modalities all with a consistent user experience, including primary MFA without usernames, passwords or typing whatsoever.
Bonus: Trusona will reveal findings from the first-ever passwordless MFA behavioral research.
Opening Keynote (Identity Live Berlin 2018)
Opening Keynote (Identity Live Berlin 2018)ForgeRock This document discusses identity and the importance of digital identity and privacy. It notes that identity is everywhere and that control over personal information and the right to be forgotten are highly valued. There is a lack of awareness around how much personal information is online. The document predicts that ownership of data will shift to individuals and that consent will be key. Digital identity is described as the building block for trusted access, authentication and privacy.
Steinberg - Customer identity as the cornerstone of our approach to digitaliz...
Steinberg - Customer identity as the cornerstone of our approach to digitaliz...ForgeRock Steinberg - Customer identity as the cornerstone of our approach to digitalization - Bernd Peeters and Daniel Röper of Steinberg Media Technologies
BMW Group - Identity Enables the Next 100 Years.. (Identity Live Berlin 2018)
BMW Group - Identity Enables the Next 100 Years.. (Identity Live Berlin 2018)ForgeRock BMW Group is transitioning to a new identity and access management solution to support its growing digital services and agile IT paradigm. The new solution provides a single identity provider, standardized APIs, and full automation to replace the heterogeneous, non-compliant existing infrastructure. This centralized, automated solution with one consistent identity will enable BMW Group to deliver personalized mobility services across internal and external systems as well as IoT, driving innovation to support the business for the next 100 years.
Trust is Everything - The Future of Identity and the ForgeRock Platform (Iden...
Trust is Everything - The Future of Identity and the ForgeRock Platform (Iden...ForgeRock This document discusses ForgeRock's priorities and recent developments. It focuses on identity being at the center of everything, the importance of trust and relationships, and being ready for IoT. ForgeRock's latest release 6.0 features intelligent authentication, platform-wide monitoring, and other improvements like progressive profiling and social attribute syncing. The overall message is that ForgeRock is driving relationships across people, services, and things through a scalable, unified identity platform.
Silo Busters- The Value of User and Data Centricity beyond IoT Devices (Ident...
Silo Busters- The Value of User and Data Centricity beyond IoT Devices (Ident...ForgeRock Silo Busters- The Value of User and Data Centricity beyond IoT Devices - Gerhard Zehethofer and Michael Tworek of ForgeRock
Shift from GDPR readiness to sustained compliance to improve your business an...
Shift from GDPR readiness to sustained compliance to improve your business an...ForgeRock Shift from GDPR readiness to sustained compliance to improve your business and your customer experience - Enza Iannopollo, Forrester
Intelligent Authentication (Identity Live Berlin 2018)
Intelligent Authentication (Identity Live Berlin 2018)ForgeRock ForgeRock offers an intelligent authentication platform that enables relationships, access policies, and lifecycles across people, services, and things. It provides modern privacy and consent features, runs anywhere, and scales to manage millions of relationships. The platform addresses challenges like siloed security solutions and outdated authentication methods. It also helps meet compliance demands and solves new use cases like giving users choice in authentication methods and varying login journeys based on context. ForgeRock demonstrates features like user choice, contextual personalization, and threat intelligence detection. It integrates with partners and offers business values such as future-proofing, security unification, and customer insights.
Ad
Recently uploaded (20)
Exceptional Behaviors: How Frequently Are They Tested? (AST 2025)
Exceptional Behaviors: How Frequently Are They Tested? (AST 2025)Andre Hora Exceptions allow developers to handle error cases expected to occur infrequently. Ideally, good test suites should test both normal and exceptional behaviors to catch more bugs and avoid regressions. While current research analyzes exceptions that propagate to tests, it does not explore other exceptions that do not reach the tests. In this paper, we provide an empirical study to explore how frequently exceptional behaviors are tested in real-world systems. We consider both exceptions that propagate to tests and the ones that do not reach the tests. For this purpose, we run an instrumented version of test suites, monitor their execution, and collect information about the exceptions raised at runtime. We analyze the test suites of 25 Python systems, covering 5,372 executed methods, 17.9M calls, and 1.4M raised exceptions. We find that 21.4% of the executed methods do raise exceptions at runtime. In methods that raise exceptions, on the median, 1 in 10 calls exercise exceptional behaviors. Close to 80% of the methods that raise exceptions do so infrequently, but about 20% raise exceptions more frequently. Finally, we provide implications for researchers and practitioners. We suggest developing novel tools to support exercising exceptional behaviors and refactoring expensive try/except blocks. We also call attention to the fact that exception-raising behaviors are not necessarily “abnormal” or rare.
How to Optimize Your AWS Environment for Improved Cloud Performance
How to Optimize Your AWS Environment for Improved Cloud PerformanceThousandEyes How to Optimize Your AWS Environment for Improved Cloud Performance
How to Batch Export Lotus Notes NSF Emails to Outlook PST Easily?
How to Batch Export Lotus Notes NSF Emails to Outlook PST Easily?steaveroggers Migrating from Lotus Notes to Outlook can be a complex and time-consuming task, especially when dealing with large volumes of NSF emails. This presentation provides a complete guide on how to batch export Lotus Notes NSF emails to Outlook PST format quickly and securely. It highlights the challenges of manual methods, the benefits of using an automated tool, and introduces eSoftTools NSF to PST Converter Software — a reliable solution designed to handle bulk email migrations efficiently. Learn about the software’s key features, step-by-step export process, system requirements, and how it ensures 100% data accuracy and folder structure preservation during migration. Make your email transition smoother, safer, and faster with the right approach.
Read More:- https://www.esofttools.com/nsf-to-pst-converter.html
Expand your AI adoption with AgentExchange
Expand your AI adoption with AgentExchangeFexle Services Pvt. Ltd. AgentExchange is Salesforce’s latest innovation, expanding upon the foundation of AppExchange by offering a centralized marketplace for AI-powered digital labor. Designed for Agentblazers, developers, and Salesforce admins, this platform enables the rapid development and deployment of AI agents across industries.
Email: [email protected]
Phone: +1(630) 349 2411
Website: https://www.fexle.com/blogs/agentexchange-an-ultimate-guide-for-salesforce-consultants-businesses/?utm_source=slideshare&utm_medium=pptNg
TestMigrationsInPy: A Dataset of Test Migrations from Unittest to Pytest (MSR...
TestMigrationsInPy: A Dataset of Test Migrations from Unittest to Pytest (MSR...Andre Hora Unittest and pytest are the most popular testing frameworks in Python. Overall, pytest provides some advantages, including simpler assertion, reuse of fixtures, and interoperability. Due to such benefits, multiple projects in the Python ecosystem have migrated from unittest to pytest. To facilitate the migration, pytest can also run unittest tests, thus, the migration can happen gradually over time. However, the migration can be timeconsuming and take a long time to conclude. In this context, projects would benefit from automated solutions to support the migration process. In this paper, we propose TestMigrationsInPy, a dataset of test migrations from unittest to pytest. TestMigrationsInPy contains 923 real-world migrations performed by developers. Future research proposing novel solutions to migrate frameworks in Python can rely on TestMigrationsInPy as a ground truth. Moreover, as TestMigrationsInPy includes information about the migration type (e.g., changes in assertions or fixtures), our dataset enables novel solutions to be verified effectively, for instance, from simpler assertion migrations to more complex fixture migrations. TestMigrationsInPy is publicly available at: https://github.com/altinoalvesjunior/TestMigrationsInPy.
The Significance of Hardware in Information Systems.pdf
The Significance of Hardware in Information Systems.pdfdrewplanas10 The Significance of Hardware in Information Systems: The Types Of Hardware and What They Do
Adobe Illustrator Crack FREE Download 2025 Latest Version
Adobe Illustrator Crack FREE Download 2025 Latest Versionkashifyounis067 🌍📱👉COPY LINK & PASTE ON GOOGLE http://drfiles.net/ 👈🌍
Adobe Illustrator is a powerful, professional-grade vector graphics software used for creating a wide range of designs, including logos, icons, illustrations, and more. Unlike raster graphics (like photos), which are made of pixels, vector graphics in Illustrator are defined by mathematical equations, allowing them to be scaled up or down infinitely without losing quality.
Here's a more detailed explanation:
Key Features and Capabilities:
Vector-Based Design:
Illustrator's foundation is its use of vector graphics, meaning designs are created using paths, lines, shapes, and curves defined mathematically.
Scalability:
This vector-based approach allows for designs to be resized without any loss of resolution or quality, making it suitable for various print and digital applications.
Design Creation:
Illustrator is used for a wide variety of design purposes, including:
Logos and Brand Identity: Creating logos, icons, and other brand assets.
Illustrations: Designing detailed illustrations for books, magazines, web pages, and more.
Marketing Materials: Creating posters, flyers, banners, and other marketing visuals.
Web Design: Designing web graphics, including icons, buttons, and layouts.
Text Handling:
Illustrator offers sophisticated typography tools for manipulating and designing text within your graphics.
Brushes and Effects:
It provides a range of brushes and effects for adding artistic touches and visual styles to your designs.
Integration with Other Adobe Software:
Illustrator integrates seamlessly with other Adobe Creative Cloud apps like Photoshop, InDesign, and Dreamweaver, facilitating a smooth workflow.
Why Use Illustrator?
Professional-Grade Features:
Illustrator offers a comprehensive set of tools and features for professional design work.
Versatility:
It can be used for a wide range of design tasks and applications, making it a versatile tool for designers.
Industry Standard:
Illustrator is a widely used and recognized software in the graphic design industry.
Creative Freedom:
It empowers designers to create detailed, high-quality graphics with a high degree of control and precision.
Who Watches the Watchmen (SciFiDevCon 2025)
Who Watches the Watchmen (SciFiDevCon 2025)Allon Mureinik Tests, especially unit tests, are the developers’ superheroes. They allow us to mess around with our code and keep us safe.
We often trust them with the safety of our codebase, but how do we know that we should? How do we know that this trust is well-deserved?
Enter mutation testing – by intentionally injecting harmful mutations into our code and seeing if they are caught by the tests, we can evaluate the quality of the safety net they provide. By watching the watchmen, we can make sure our tests really protect us, and we aren’t just green-washing our IDEs to a false sense of security.
Talk from SciFiDevCon 2025
https://www.scifidevcon.com/courses/2025-scifidevcon/contents/680efa43ae4f5
Interactive odoo dashboards for sales, CRM , Inventory, Invoice, Purchase, Pr...
Interactive odoo dashboards for sales, CRM , Inventory, Invoice, Purchase, Pr...AxisTechnolabs Interactive Odoo Dashboard for various business needs can provide users with dynamic, visually appealing dashboards tailored to their specific requirements. such a module that could support multiple dashboards for different aspects of a business
✅Visit And Buy Now : https://bit.ly/3VojWza
✅This Interactive Odoo dashboard module allow user to create their own odoo interactive dashboards for various purpose.
App download now :
Odoo 18 : https://bit.ly/3VojWza
Odoo 17 : https://bit.ly/4h9Z47G
Odoo 16 : https://bit.ly/3FJTEA4
Odoo 15 : https://bit.ly/3W7tsEB
Odoo 14 : https://bit.ly/3BqZDHg
Odoo 13 : https://bit.ly/3uNMF2t
Try Our website appointment booking odoo app : https://bit.ly/3SvNvgU
👉Want a Demo ?📧 [email protected]
➡️Contact us for Odoo ERP Set up : 091066 49361
👉Explore more apps: https://bit.ly/3oFIOCF
👉Want to know more : 🌐 https://www.axistechnolabs.com/
#odoo #odoo18 #odoo17 #odoo16 #odoo15 #odooapps #dashboards #dashboardsoftware #odooerp #odooimplementation #odoodashboardapp #bestodoodashboard #dashboardapp #odoodashboard #dashboardmodule #interactivedashboard #bestdashboard #dashboard #odootag #odooservices #odoonewfeatures #newappfeatures #odoodashboardapp #dynamicdashboard #odooapp #odooappstore #TopOdooApps #odooapp #odooexperience #odoodevelopment #businessdashboard #allinonedashboard #odooproducts
Microsoft AI Nonprofit Use Cases and Live Demo_2025.04.30.pdf
Microsoft AI Nonprofit Use Cases and Live Demo_2025.04.30.pdfTechSoup In this webinar we will dive into the essentials of generative AI, address key AI concerns, and demonstrate how nonprofits can benefit from using Microsoft’s AI assistant, Copilot, to achieve their goals.
This event series to help nonprofits obtain Copilot skills is made possible by generous support from Microsoft.
What You’ll Learn in Part 2:
Explore real-world nonprofit use cases and success stories.
Participate in live demonstrations and a hands-on activity to see how you can use Microsoft 365 Copilot in your own work!
Requirements in Engineering AI- Enabled Systems: Open Problems and Safe AI Sy...
Requirements in Engineering AI- Enabled Systems: Open Problems and Safe AI Sy...Lionel Briand Keynote at RAISE workshop, ICSE 2025
WinRAR Crack for Windows (100% Working 2025)
WinRAR Crack for Windows (100% Working 2025)sh607827 copy and past on google ➤ ➤➤ https://hdlicense.org/ddl/
WinRAR Crack Free Download is a powerful archive manager that provides full support for RAR and ZIP archives and decompresses CAB, ARJ, LZH, TAR, GZ, ACE, UUE, .
Meet the Agents: How AI Is Learning to Think, Plan, and Collaborate
Meet the Agents: How AI Is Learning to Think, Plan, and CollaborateMaxim Salnikov Imagine if apps could think, plan, and team up like humans. Welcome to the world of AI agents and agentic user interfaces (UI)! In this session, we'll explore how AI agents make decisions, collaborate with each other, and create more natural and powerful experiences for users.
PDF Reader Pro Crack Latest Version FREE Download 2025
PDF Reader Pro Crack Latest Version FREE Download 2025mu394968 🌍📱👉COPY LINK & PASTE ON GOOGLE https://dr-kain-geera.info/👈🌍
PDF Reader Pro is a software application, often referred to as an AI-powered PDF editor and converter, designed for viewing, editing, annotating, and managing PDF files. It supports various PDF functionalities like merging, splitting, converting, and protecting PDFs. Additionally, it can handle tasks such as creating fillable forms, adding digital signatures, and performing optical character recognition (OCR).
Adobe Master Collection CC Crack Advance Version 2025
Adobe Master Collection CC Crack Advance Version 2025kashifyounis067 🌍📱👉COPY LINK & PASTE ON GOOGLE http://drfiles.net/ 👈🌍
Adobe Master Collection CC (Creative Cloud) is a comprehensive subscription-based package that bundles virtually all of Adobe's creative software applications. It provides access to a wide range of tools for graphic design, video editing, web development, photography, and more. Essentially, it's a one-stop-shop for creatives needing a broad set of professional tools.
Key Features and Benefits:
All-in-one access:
The Master Collection includes apps like Photoshop, Illustrator, InDesign, Premiere Pro, After Effects, Audition, and many others.
Subscription-based:
You pay a recurring fee for access to the latest versions of all the software, including new features and updates.
Comprehensive suite:
It offers tools for a wide variety of creative tasks, from photo editing and illustration to video editing and web development.
Cloud integration:
Creative Cloud provides cloud storage, asset sharing, and collaboration features.
Comparison to CS6:
While Adobe Creative Suite 6 (CS6) was a one-time purchase version of the software, Adobe Creative Cloud (CC) is a subscription service. CC offers access to the latest versions, regular updates, and cloud integration, while CS6 is no longer updated.
Examples of included software:
Adobe Photoshop: For image editing and manipulation.
Adobe Illustrator: For vector graphics and illustration.
Adobe InDesign: For page layout and desktop publishing.
Adobe Premiere Pro: For video editing and post-production.
Adobe After Effects: For visual effects and motion graphics.
Adobe Audition: For audio editing and mixing.
Kubernetes_101_Zero_to_Platform_Engineer.pptx
Kubernetes_101_Zero_to_Platform_Engineer.pptxCloudScouts Presentacion de la primera sesion de Zero to Platform Engineer
Designing AI-Powered APIs on Azure: Best Practices& Considerations
Designing AI-Powered APIs on Azure: Best Practices& ConsiderationsDinusha Kumarasiri AI is transforming APIs, enabling smarter automation, enhanced decision-making, and seamless integrations. This presentation explores key design principles for AI-infused APIs on Azure, covering performance optimization, security best practices, scalability strategies, and responsible AI governance. Learn how to leverage Azure API Management, machine learning models, and cloud-native architectures to build robust, efficient, and intelligent API solutions
Explaining GitHub Actions Failures with Large Language Models
Challenges, In...
Explaining GitHub Actions Failures with Large Language Models
Challenges, In...ssuserb14185 GitHub Actions (GA) has become the de facto tool that developers use to automate software workflows, seamlessly building, testing, and deploying code. Yet when GA fails, it disrupts development, causing delays and driving up costs. Diagnosing failures becomes especially challenging because error logs are often long, complex and unstructured. Given these difficulties, this study explores the potential of large language models (LLMs) to generate correct, clear, concise, and actionable contextual descriptions (or summaries) for GA failures, focusing on developers’ perceptions of their feasibility and usefulness. Our results show that over 80% of developers rated LLM explanations positively in terms of correctness for simpler/small logs. Overall, our findings suggest that LLMs can feasibly assist developers in understanding common GA errors, thus, potentially reducing manual analysis. However, we also found that improved reasoning abilities are needed to support more complex CI/CD scenarios. For instance, less experienced developers tend to be more positive on the described context, while seasoned developers prefer concise summaries. Overall, our work offers key insights for researchers enhancing LLM reasoning, particularly in adapting explanations to user expertise.
https://arxiv.org/abs/2501.16495
F-Secure Freedome VPN 2025 Crack Plus Activation New Version
F-Secure Freedome VPN 2025 Crack Plus Activation New Versionsaimabibi60507 Copy & Past Link 👉👉
https://dr-up-community.info/
F-Secure Freedome VPN is a virtual private network service developed by F-Secure, a Finnish cybersecurity company. It offers features such as Wi-Fi protection, IP address masking, browsing protection, and a kill switch to enhance online privacy and security .
Mastering Fluent Bit: Ultimate Guide to Integrating Telemetry Pipelines with ...
Mastering Fluent Bit: Ultimate Guide to Integrating Telemetry Pipelines with ...Eric D. Schabell It's time you stopped letting your telemetry data pressure your budgets and get in the way of solving issues with agility! No more I say! Take back control of your telemetry data as we guide you through the open source project Fluent Bit. Learn how to manage your telemetry data from source to destination using the pipeline phases covering collection, parsing, aggregation, transformation, and forwarding from any source to any destination. Buckle up for a fun ride as you learn by exploring how telemetry pipelines work, how to set up your first pipeline, and exploring several common use cases that Fluent Bit helps solve. All this backed by a self-paced, hands-on workshop that attendees can pursue at home after this session (https://o11y-workshops.gitlab.io/workshop-fluentbit).
Customer Intelligence: Using the ELK Stack to Analyze ForgeRock OpenAM Audit Data
- 1. IRM Summit 2014 Customer Intelligence: Using the ELK stack (Elasticsearch, Logstash and Kibana) to analyse ForgeRock OpenAM audit data [email protected]
- 2. IRM Summit 2014 Make pretty pictures for the boss
- 4. OpenDJ, OpenIDM, OpenAM produce copious amounts of audit data Analysis of that data is left as an exercise for the reader Many great SIEM tools Desire for an Open Source solution for data analysis
- 5. What is the ELK stack? Elasticsearch: “No SQL” database Logstash: Log collection and transformation Kibana: Data visualizer for Elasticsearch
- 6. Yes, but what does ELK do? Collect, analyse and visualize data Any kind of data Github (8 Million repos), Soundcloud (30M users), The Guardian (40M documents) Answer questions: ● Where are my users coming from? ● What is the traffic in North America vs. Europe? ● Why do I see an employee logging in from Canada?
- 7. Elasticsearch ● NoSQL, REST/json, document oriented, schemaless, “Big data” full text search engine ● Apache 2.0 license ● Sweet spot is rapid full text search / ad hoc queries ● Not a replacement for an RDBMS ● Not transactional, not ACID, etc. ● Built on Apache Lucene project
- 8. Logstash ● Swiss army knife of log collection, transformation and forwarding ● JRuby based ● Large footprint :-( ● lumberjack ● go based collector that feeds into logstash ● Very lightweight, small footprint
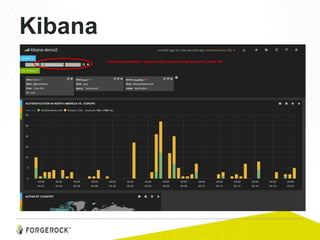
- 9. Kibana
- 10. Logstash flow Input source files, database, syslog, etc. Filters grep, regex, geoIP, ... Output elasticsearch, file, db, syslog “Plugin” based architecture. Add new plugins for input, output and filters
- 11. Logstash example Input source file: amAccess.* type: amAccess Filters Map IP address to GEO location Output elasticsearch:9100 Read from OpenAM access logs Add Geo Location data Write the result to Elasticsearch
- 12. Geek Alert!!
- 13. input { file { type => amAccess path => "/logs/am/log/amAuthentication.*" } } Input section Wildcards can be used Data is tagged with a type. Use this to classify & search by type
- 14. filter { if [type] == "amAccess" { csv { columns => [time,Data,LoginID,ContextID, IPAddr, LogLevel, Domain, LoggedBy, MessageID, ModuleName, NameID, HostName] separator => " " } date { match => ["time", "yyyy-MM-dd HH:mm:ss"] } geoip { database => "/usr/share/GeoIP/GeoIP.dat" source => ["IPAddr"] } } } Filter apply to type Parse the data as csv Normalize the date to a common format Enrich the record with GEO location
- 15. output { stdout { codec => rubydebug } elasticsearch { host => localhost } } Output Send the data to Elasticsearch and the stdout
- 16. Demo Time As seen on youtube! http://youtu.be/tvrYuSLuGik 27 49 views!
- 17. ELK Demo Environment OpenAM OpenDJ OpenIDM logstash elasticsearch:9100 Apache:80/443 + Policy Agent Log Files Kibana
- 18. Marketing Genius? Where to hold the next ForgeRock Summit: Europe, USA, or Canada? Asks you to find out pronto: ● What country are customers visiting the ForgeRock website from? ● How are they authenticating (forgerock account, or federated?)
- 19. The next IRM summit location: We have beer! Bring your toque!
- 20. Next Steps Delivery Models Cloud or Appliance? Interested in collaborating? Share logstash config, kibana reports, etc. Puppet/Chef/Ansible/Docker installers?